the idea multiplier - vanguard › pdf › megatrends... · 2020-01-02 · 3 megatrend: the idea...
TRANSCRIPT

Vanguard Research:
Megatrends
The Idea Multiplier: An acceleration in innovation is coming

About the Megatrends seriesMegatrends have accompanied humankind throughout history. From the Neolithic Revolution to the Information Age, innovation has been the catalyst for profound socioeconomic, cultural, and political transformation. The term “Megatrends” was popularized by author John Naisbitt, who was interested in the transformative forces that have a major impact on both businesses and societies, and thus the potential to change all areas of our personal and professional lives.
Vanguard’s “Megatrends” is a research effort that investigates fundamental shifts in the global economic landscape that are likely to affect the financial services industry and broader society. A megatrend may bring market growth or destroy it, increase competition or add barriers to entry, and create threats or uncover opportunities. Exploring the long-term nature of massive shifts in technology, demographics, and globalization can help us better understand how such forces may shape future markets, individuals, and the investing landscape in the years ahead.
Vanguard Investment Strategy Group’s Global Economics Team
From left to right: Joseph Davis, Ph.D., Global Chief Economist; Americas: Roger A. Aliaga-Díaz, Ph.D., Americas Chief Economist; Jonathan Lemco, Ph.D.; Andrew J. Patterson, CFA; Joshua M. Hirt, CFA; Vytautas Maciulis, CFA; Jonathan Petersen, M.Sc.; Asawari Sathe, M.Sc.; Adam J. Schickling, CFA; Europe: Peter Westaway, Ph.D., Europe Chief Economist; Alexis Gray, M.Sc.; Shaan Raithatha, CFA; Nathan Thomas; Asia-Pacific: Qian Wang, Ph.D., Asia-Pacific Chief Economist; Beatrice Yeo

3
Megatrend: The Idea Multiplier: An Acceleration in innovation is coming
■ The persistent downturn in productivity growth during the past two decades has cast doubts on global economic prospects. Frequently cited causes include slow adoption of technology, an aging population, and a shift to service-based economies. While we acknowledge the role each of these has likely played, our research shows that productivity is fundamentally driven by the generation and expansion of ideas, which have recently accelerated after an extended hiatus. Accordingly, we expect productivity growth to rise in the near future.
■ Much of the work to date on technological advancement has focused on patents as a proxy or leading indicator. In this paper, we take a step back from patents and search for the drivers of expansions (and contractions) in productivity growth where we believe their origins lie: in the sharing of ideas. We introduce what we have termed the “Idea Multiplier,” a time series of academic paper citations within and across industries and countries based on nearly 2 billion records. We find that idea sharing is a significant force for productivity growth, and that the recent era of low growth will eventually end.
■ The recent acceleration in the Idea Multiplier stems from increased domestic and global sharing and collaboration—more minds working together to find solutions for today’s problems and creating efficiencies. Globalization and technology have reduced the physical and digital barriers of international knowledge transmission, barriers that inhibit ideas from reaching their full potential. Our “Idea Diffusion” metric measures the international sharing of ideas and finds countries that increase their utilization of foreign knowledge experience higher productivity growth.
Authors
Qian Wang, Ph.D. Andrew Patterson, CFA Adam J. Schickling, CFA Asawari Sathe, M.Sc. Joseph Davis, Ph.D.Global Chief Economist
41 Total factor productivity growth is based on data from the St. Louis Federal Reserve Board. Mid-20th century here refers to the years 1948 to 1970.2 Represented by the 10,000 most-cited articles.
Introduction
Productivity: A paradox for the ages
One of the greatest economic paradoxes of the last 40 years has been the slowdown in productivity growth coinciding with the advancement of technological innova-tion, particularly in the field of computing. This is some-times referred to as the Solow computer paradox, after Robert Solow’s 1987 remark that “you can see the computer age everywhere but in the productivity statistics” (Solow, 1987).
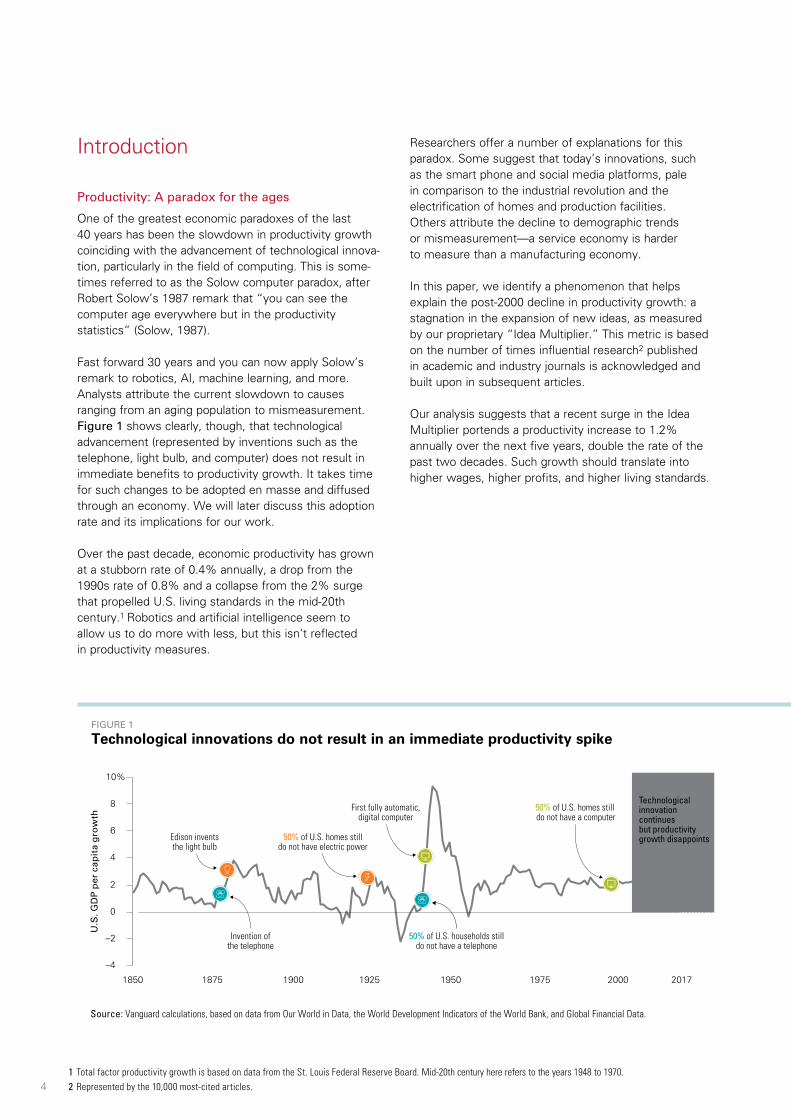
Fast forward 30 years and you can now apply Solow’s remark to robotics, AI, machine learning, and more. Analysts attribute the current slowdown to causes ranging from an aging population to mismeasurement. Figure 1 shows clearly, though, that technological advancement (represented by inventions such as the telephone, light bulb, and computer) does not result in immediate benefits to productivity growth. It takes time for such changes to be adopted en masse and diffused through an economy. We will later discuss this adoption rate and its implications for our work.
Over the past decade, economic productivity has grown at a stubborn rate of 0.4% annually, a drop from the 1990s rate of 0.8% and a collapse from the 2% surge that propelled U.S. living standards in the mid-20th century.1 Robotics and artificial intelligence seem to allow us to do more with less, but this isn’t reflected in productivity measures.
Researchers offer a number of explanations for this paradox. Some suggest that today’s innovations, such as the smart phone and social media platforms, pale in comparison to the industrial revolution and the electrification of homes and production facilities. Others attribute the decline to demographic trends or mismeasurement—a service economy is harder to measure than a manufacturing economy.
In this paper, we identify a phenomenon that helps explain the post-2000 decline in productivity growth: a stagnation in the expansion of new ideas, as measured by our proprietary “Idea Multiplier.” This metric is based on the number of times influential research2 published in academic and industry journals is acknowledged and built upon in subsequent articles.
Our analysis suggests that a recent surge in the Idea Multiplier portends a productivity increase to 1.2% annually over the next five years, double the rate of the past two decades. Such growth should translate into higher wages, higher profits, and higher living standards.
Source: Vanguard calculations, based on data from Our World in Data, the World Development Indicators of the World Bank, and Global Financial Data.
U.S
. GD
P p
er c
apit
a g
row
th
–4
–2
0
2
4
6
8
10%
U.S. GDP per capita growth (ten-year moving average)
50% of U.S. households still do not have a telephone
1850 1900 1925 1950 19751875 20172000
Edison inventsthe light bulb
Invention ofthe telephone
First fully automatic,digital computer
Technological innovation continuesbut productivity growth disappoints50% of U.S. homes still
do not have electric power
50% of U.S. homes still do not have a computer
FIGURE 1
Technological innovations do not result in an immediate productivity spike
5
Productivity growth: Moon landings are great, but . . .
The 1970s ushered in the Information Age. Like the Renaissance and Industrial Revolution before it, this was a turning point in the world’s evolution. Work and life would never be the same as personal com- puters replaced typewriters at home and the office and, eventually, smart phones and tablets gave users more computing power in the palm of their hand than NASA had during the moon landing (Grossman, 2017).
Yet these amazing technological breakthroughs, many of which occurred in the past 20 years, coincided with a period of low productivity growth. How was this possible when calculations that previously would have taken hours and cost small fortunes in hardware could now be completed in seconds?
Research has shown that paradigm-shifting advance-ments in technology (Brynjolfsson et al., 2018) or business practices (Atkeson and Kehoe, 1997) take time to pass through to output and productivity metrics. Perhaps it’s still too early to measure the true impact of the Information Age, but today’s slow productivity growth remains puzzling and a source of robust academic debate.
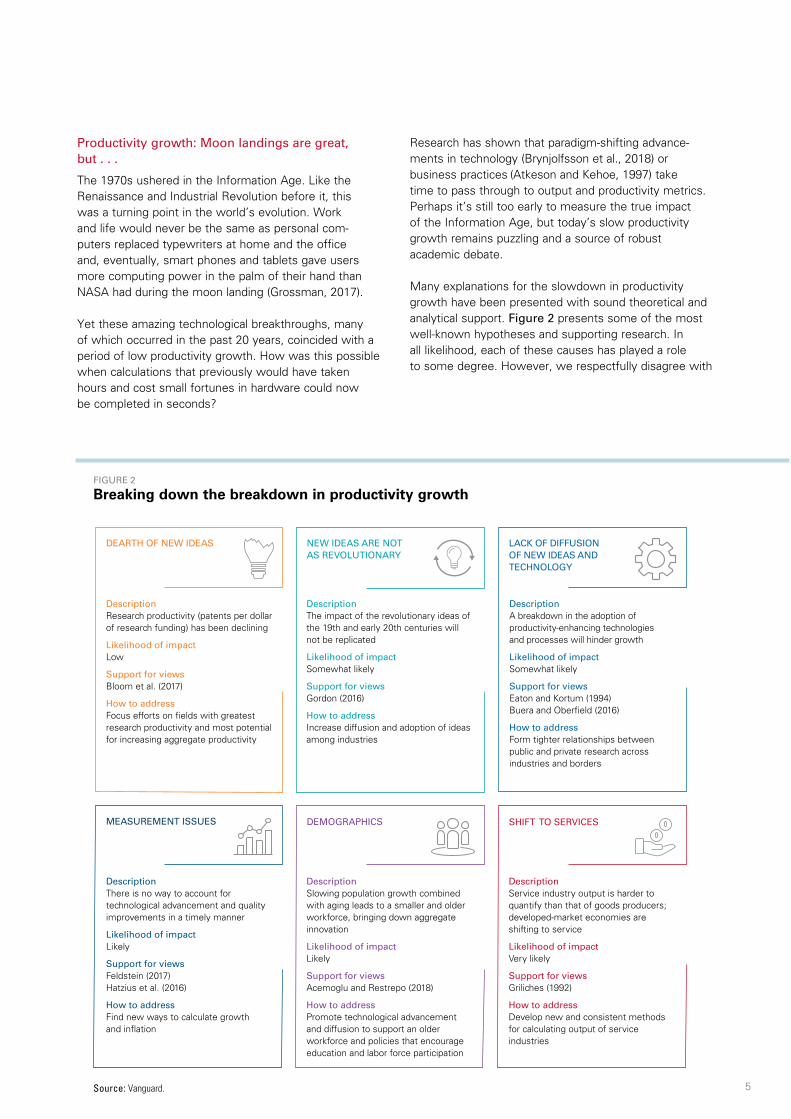
Many explanations for the slowdown in productivity growth have been presented with sound theoretical and analytical support. Figure 2 presents some of the most well-known hypotheses and supporting research. In all likelihood, each of these causes has played a role to some degree. However, we respectfully disagree with
DescriptionThere is no way to account for technological advancement and quality improvements in a timely manner
Likelihood of impactLikely
Support for viewsFeldstein (2017)Hatzius et al. (2016)
How to addressFind new ways to calculate growth and in�ation
MEASUREMENT ISSUES
DescriptionSlowing population growth combined with aging leads to a smaller and older workforce, bringing down aggregate innovation
Likelihood of impactLikely
Support for viewsAcemoglu and Restrepo (2018)
How to addressPromote technological advancement and diffusion to support an older workforce and policies that encourage education and labor force participation
DEMOGRAPHICS
DescriptionService industry output is harder to quantify than that of goods producers; developed-market economies are shifting to service
Likelihood of impactVery likely
Support for viewsGriliches (1992)
How to addressDevelop new and consistent methods for calculating output of service industries
SHIFT TO SERVICES
LACK OF DIFFUSION OF NEW IDEAS AND TECHNOLOGY
DescriptionA breakdown in the adoption of productivity-enhancing technologies and processes will hinder growth
Likelihood of impactSomewhat likely
Support for viewsEaton and Kortum (1994) Buera and Ober�eld (2016)
How to addressForm tighter relationships between public and private research across industries and borders
DEARTH OF NEW IDEAS
DescriptionResearch productivity (patents per dollar of research funding) has been declining
Likelihood of impactLow
Support for viewsBloom et al. (2017)
How to addressFocus efforts on �elds with greatest research productivity and most potential for increasing aggregate productivity
NEW IDEAS ARE NOT AS REVOLUTIONARY
DescriptionThe impact of the revolutionary ideas of the 19th and early 20th centuries will not be replicated
Likelihood of impactSomewhat likely
Support for viewsGordon (2016)
How to addressIncrease diffusion and adoption of ideas among industries
FIGURE 2
Breaking down the breakdown in productivity growth
Source: Vanguard.
6
those who imply that new ideas are increasingly hard to come by and don’t have the potential to drive future productivity growth. In fact, our work shows that the quality, impact, and sharing of ideas have been rising in recent years.
We should all be concerned with productivity growth
Productivity is the ratio of some measure of output attributed to some measure of resource allocation, be it people, technology, or time. Why does it matter? The more productive a firm or industry is, the higher its potential profit margins should be (Syverson, 2010).Differences in productivity and associated economic growth contribute significantly to differences in countries’ standards of living (Mankiw, 1995).
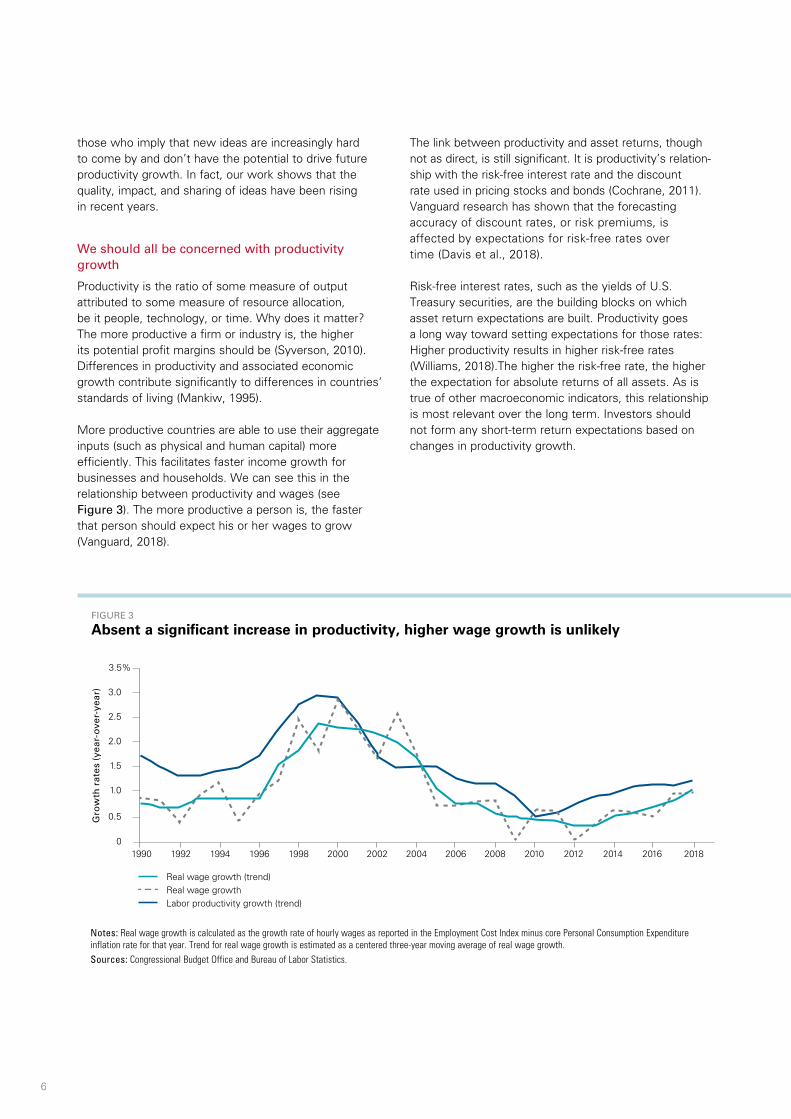
More productive countries are able to use their aggregate inputs (such as physical and human capital) more efficiently. This facilitates faster income growth for businesses and households. We can see this in the relationship between productivity and wages (see Figure 3). The more productive a person is, the faster that person should expect his or her wages to grow (Vanguard, 2018).
The link between productivity and asset returns, though not as direct, is still significant. It is productivity’s relation-ship with the risk-free interest rate and the discount rate used in pricing stocks and bonds (Cochrane, 2011).
Vanguard research has shown that the forecasting accuracy of discount rates, or risk premiums, is affected by expectations for risk-free rates over time (Davis et al., 2018).
Risk-free interest rates, such as the yields of U.S. Treasury securities, are the building blocks on which asset return expectations are built. Productivity goes a long way toward setting expectations for those rates: Higher productivity results in higher risk-free rates (Williams, 2018).The higher the risk-free rate, the higher the expectation for absolute returns of all assets. As is true of other macroeconomic indicators, this relationship is most relevant over the long term. Investors should not form any short-term return expectations based on changes in productivity growth.
FIGURE 3
Absent a significant increase in productivity, higher wage growth is unlikely
0
0.5
1.0
1.5
2.0
2.5
3.0
3.5%
Gro
wth
rat
es (
year
-ove
r-ye
ar)
Real wage growth (trend)Real wage growthLabor productivity growth (trend)
201820162014201220102008200620042002200019981996199419921990
Notes: Real wage growth is calculated as the growth rate of hourly wages as reported in the Employment Cost Index minus core Personal Consumption Expenditure inflation rate for that year. Trend for real wage growth is estimated as a centered three-year moving average of real wage growth.Sources: Congressional Budget Office and Bureau of Labor Statistics.

Ideas as patents
Idea generation and the technological enhancement it supports has long been acknowledged as an important driver of growth (Solow, 1956). As companies and countries apply new technologies and learn new processes, the benefits compound (Romer, 1986).
Much of the existing literature on the impact of ideas on productivity focuses on patents (Eaton and Kortum, 1994). The typical reasoning holds that if an idea was good enough to patent, it should improve productivity, even more so when it is good enough to patent in multiple countries (International Monetary Fund, 2018).
Diffusion, or the spread of ideas across countries and industries and the length of time they take to be applied, can be measured. (This measurement can be incorporated into an assessment of the merits of a patent, which also affect productivity enhancement [Buena and Oberfeld, 2016]). Essentially, the faster and wider a patent spreads, the greater its impact, particularly on countries or industries not yet at the technological frontier (Porter and Stern, 2000). However, not all ideas get patented. Patenting takes time and can involve regulatory hurdles that differ by country.
The U.S. Patent Code was established to provide transparency to technologies and processes, allowing others to use the information to develop their own new ideas. It is really the idea behind the patented (or not patented) technology or process that enhances growth and productivity by facilitating other ideas. That is where our Idea Multiplier comes in.
A new idea for measuring innovation and forecasting productivity
Understanding how innovation happens in the real world is easier if we step back from economics textbooks and consider the backstories of history’s greatest break-throughs. The lone genius going it alone, having a “light-bulb” moment and suddenly seeing what all others have missed, is the romanticized ideal. The true evolution of game-changing ideas is more complicated but also more encouraging.
Innovation does not occur in a vacuum. Instead it is a manifestation of the compounding of ideas both old and new, from disciplines related and seemingly unrelated to the innovator’s region or industry. A great example is the Wright brothers’ use of ornithological research to mimic the twist in birds’ wings and create a more aerodynamic wing for their airplane (see Figure 4).
7
Sources: Animal Locomotion; or, Walking, Swimming, and Flying, with a Dissertation on Aëronautics by James Bell Pettigrew (1874), and Library of Congress.
FIGURE 4
Ornithological research helped the Wright brothers develop their airplane wing
8
In short, invention or innovation is a function of exposure to ideas and the application and transformation of those ideas in a novel and creative way that in turn breeds more ideas. Ideas are the building blocks of innovation, and innovation breeds productivity. The latter cannot occur without the former.
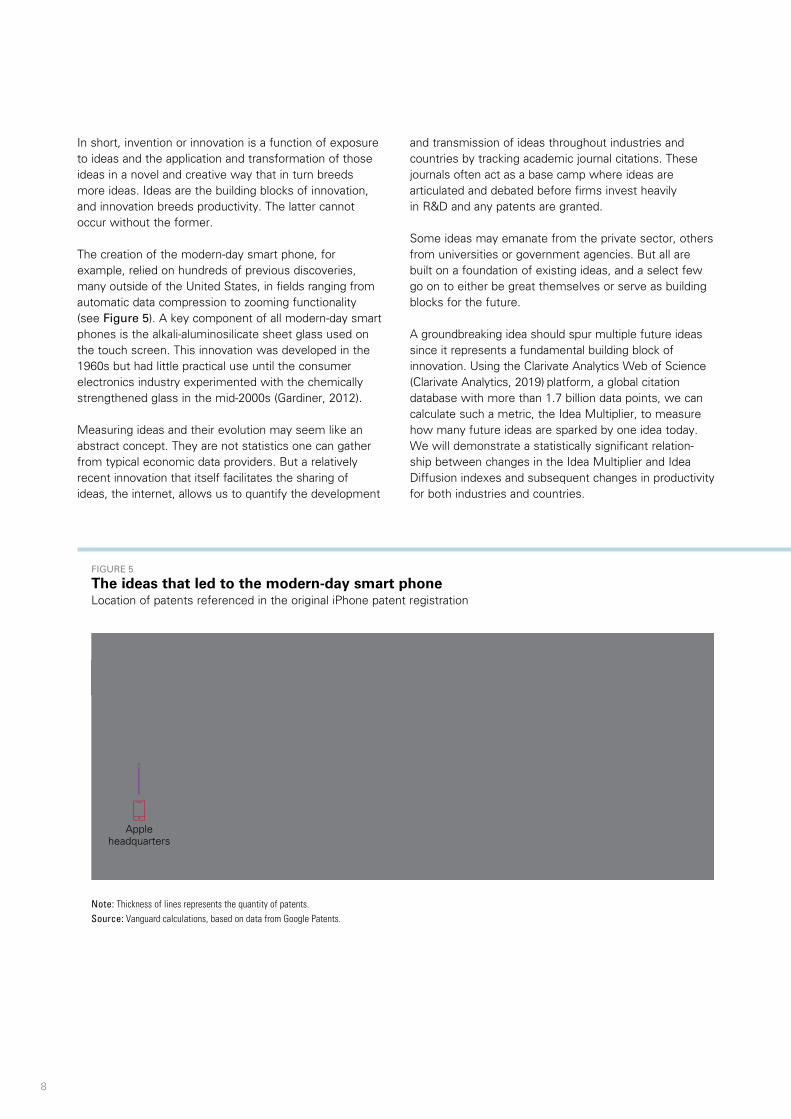
The creation of the modern-day smart phone, for example, relied on hundreds of previous discoveries, many outside of the United States, in fields ranging from automatic data compression to zooming functionality (see Figure 5). A key component of all modern-day smart phones is the alkali-aluminosilicate sheet glass used on the touch screen. This innovation was developed in the 1960s but had little practical use until the consumer electronics industry experimented with the chemically strengthened glass in the mid-2000s (Gardiner, 2012).
Measuring ideas and their evolution may seem like an abstract concept. They are not statistics one can gather from typical economic data providers. But a relatively recent innovation that itself facilitates the sharing of ideas, the internet, allows us to quantify the development
and transmission of ideas throughout industries and countries by tracking academic journal citations. These journals often act as a base camp where ideas are articulated and debated before firms invest heavily in R&D and any patents are granted.
Some ideas may emanate from the private sector, others from universities or government agencies. But all are built on a foundation of existing ideas, and a select few go on to either be great themselves or serve as building blocks for the future.
A groundbreaking idea should spur multiple future ideas since it represents a fundamental building block of innovation. Using the Clarivate Analytics Web of Science (Clarivate Analytics, 2019) platform, a global citation database with more than 1.7 billion data points, we can calculate such a metric, the Idea Multiplier, to measure how many future ideas are sparked by one idea today. We will demonstrate a statistically significant relation-ship between changes in the Idea Multiplier and Idea Diffusion indexes and subsequent changes in productivity for both industries and countries.
Apple headquarters
FIGURE 5
The ideas that led to the modern-day smart phone Location of patents referenced in the original iPhone patent registration
Note: Thickness of lines represents the quantity of patents.Source: Vanguard calculations, based on data from Google Patents.
9
The Idea Multiplier and industry productivity
We first explored the relationship between the Idea Multiplier and productivity in 14 major industries (listed in Appendix A). This analysis illuminated the link between changes in a specific field of knowledge and productivity changes in related industries. Our industry selection process had the following criteria:
1. Practical economic implications. As important as arts and literature are to society and culture, measuring their economic impact is very ambiguous.
2. Robust history of academic research. This ensured a large enough data set to track citations and calculate an Idea Multiplier for the industry.
3. Matching NAICS industry classification. This provided our dependent variable, industry-level productivity growth as proxied by the real value of industry shipments per worker.3
Our methodology was based on traditional growth models from research by Caselli, Esquivel, and Lefort (1996). The authors used the generalized method of moments (GMM) proposed by Arellano and Bond (1991) to study the factors that influence an economy’s growth rate (see Appendix B for an explanation of the Arellano-Bond estimator).
Our findings should be interpreted as estimates of how an industry’s productivity growth can be expected to change based on changes to its own Idea Multiplier.4
We moderated noise from business cycle variations by organizing our data set in five-year increments, similar to the process followed in Barro (2003). In Equation 1, the dependent variable, industry productivity growth, is represented by the average annual growth over the five-year period. The Idea Multiplier (IM) value is taken at the start of the five-year productivity period to help demonstrate a leading rather than coincidental relationship.
As other similar studies have done, in order to account for initial levels of productivity and capital, we included a lagged variable of productivity growth and real output per worker (ROP) as independent variables. Industries with high levels of initial capital, proxied by initial per capita output, typically have limited capacity to expand it further. We also included initial level of investment (INV) and years of schooling (YR_SCH). Industries with lower starting levels of these factors receive a higher marginal productivity payoff from any improvement in them.
Equation 1
Productivityi,t = α+ Productivityi,t–τ + log(ROPi,t–τ) + log(INVt–τ) + YR_SCHt–τ + IMt–τ + ϵi,t
We find a statistically significant relationship at the industry level between the Idea Multiplier and productivity growth. A 0.1-unit increase in an industry’s Idea Multiplier will increase annual productivity growth by 2.6 percentage points from its current level over the subsequent five-year period (see Appendix C for regression results).
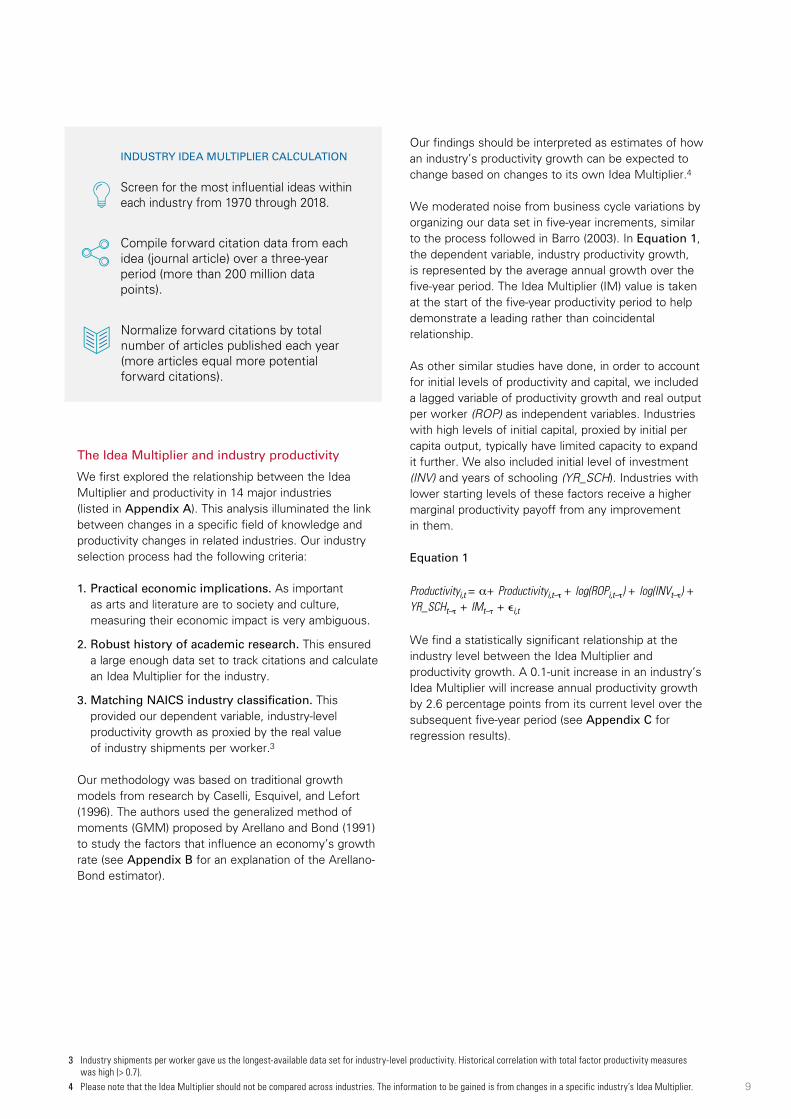
Screen for the most in�uential ideas within each industry from 1970 through 2018.
INDUSTRY IDEA MULTIPLIER CALCULATION
Normalize forward citations by total number of articles published each year (more articles equal more potential forward citations).
Compile forward citation data from each idea (journal article) over a three-year period (more than 200 million data points).
3 Industry shipments per worker gave us the longest-available data set for industry-level productivity. Historical correlation with total factor productivity measures was high (> 0.7).
4 Please note that the Idea Multiplier should not be compared across industries. The information to be gained is from changes in a specific industry’s Idea Multiplier.
10
What does this mean for productivity?
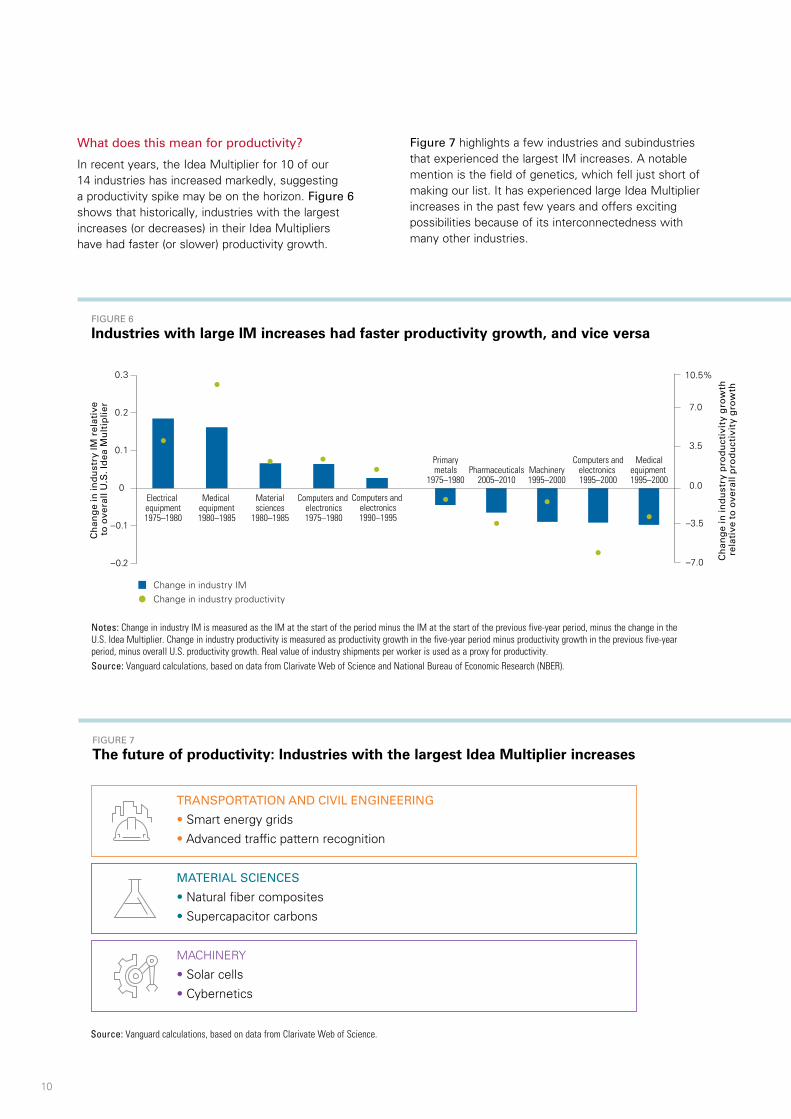
In recent years, the Idea Multiplier for 10 of our 14 industries has increased markedly, suggesting a productivity spike may be on the horizon. Figure 6 shows that historically, industries with the largest increases (or decreases) in their Idea Multipliers have had faster (or slower) productivity growth.
Figure 7 highlights a few industries and subindustries that experienced the largest IM increases. A notable mention is the field of genetics, which fell just short of making our list. It has experienced large Idea Multiplier increases in the past few years and offers exciting possibilities because of its interconnectedness with many other industries.
Ch
ang
e in
ind
ust
ry p
rod
uct
ivit
y g
row
th
rela
tive
to
ove
rall
pro
du
ctiv
ity
gro
wth
–0.2
–0.1
0
0.1
0.2
0.3
–7.0
–3.5
0.0
3.5
7.0
10.5%
Electrical equipment1975–1980
Medical equipment1980–1985
Materialsciences
1980–1985
Computers and electronics1975–1980
Computers and electronics1990–1995
Computers andelectronics 1995–2000
Medicalequipment 1995–2000
Primarymetals
1975–1980Pharmaceuticals
2005–2010Machinery1995–2000
Change in industry IM
Change in industry productivity
Ch
ang
e in
ind
ust
ry IM
rel
ativ
e to
ove
rall
U.S
. Id
ea M
ult
iplie
r
FIGURE 6
Industries with large IM increases had faster productivity growth, and vice versa
Notes: Change in industry IM is measured as the IM at the start of the period minus the IM at the start of the previous five-year period, minus the change in the U.S. Idea Multiplier. Change in industry productivity is measured as productivity growth in the five-year period minus productivity growth in the previous five-year period, minus overall U.S. productivity growth. Real value of industry shipments per worker is used as a proxy for productivity.Source: Vanguard calculations, based on data from Clarivate Web of Science and National Bureau of Economic Research (NBER).
TRANSPORTATION AND CIVIL ENGINEERING
• Smart energy grids
• Advanced traffic pattern recognition
MATERIAL SCIENCES
• Natural fiber composites
• Supercapacitor carbons
MACHINERY
• Solar cells
• Cybernetics
Source: Vanguard calculations, based on data from Clarivate Web of Science.
FIGURE 7
The future of productivity: Industries with the largest Idea Multiplier increases
11
Please note, the optimistic productivity outlook for these fields does not mean their future asset returns should be expected to exceed those of other industries. Many factors, particularly valuations, help explain future asset returns; investors should refrain from making any decisions based on our findings.
Next, we wanted to know what our findings meant for total U.S. productivity. We calculated an overall Idea Multiplier covering the entire U.S. economy, allowing us to capture the effects from other research areas where industry-specific analysis wasn’t feasible.
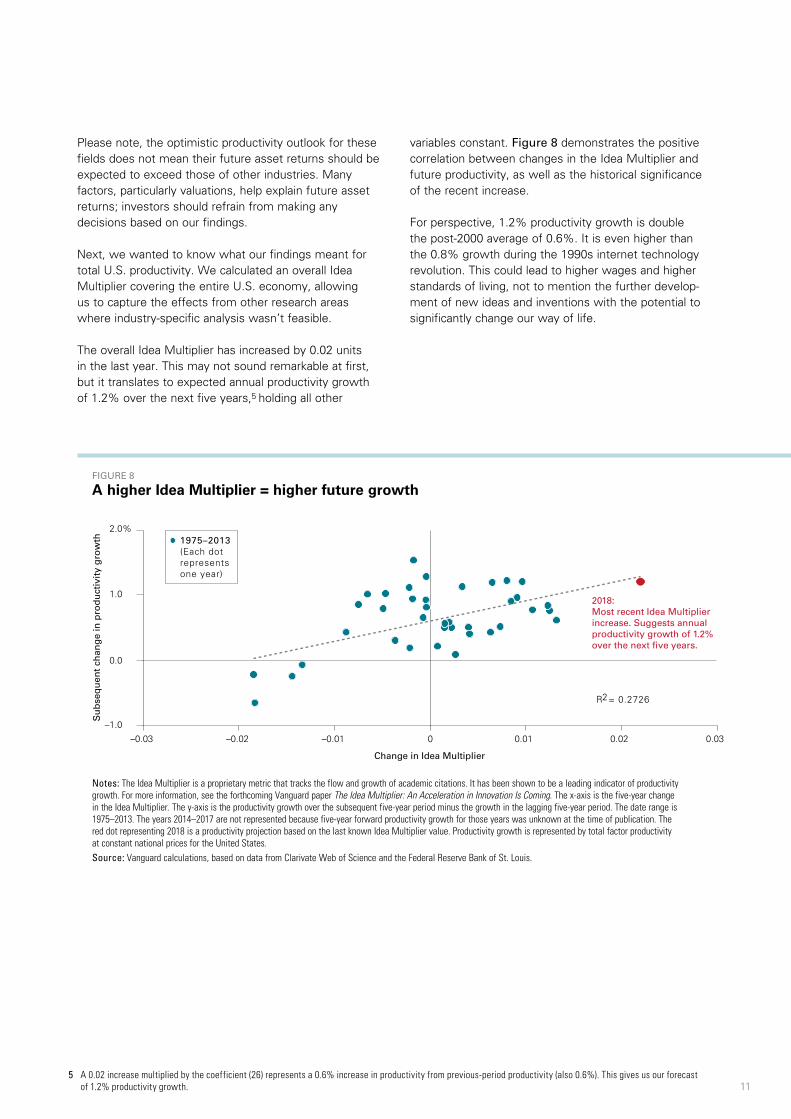
The overall Idea Multiplier has increased by 0.02 units in the last year. This may not sound remarkable at first, but it translates to expected annual productivity growth of 1.2% over the next five years,5 holding all other
variables constant. Figure 8 demonstrates the positive correlation between changes in the Idea Multiplier and future productivity, as well as the historical significance of the recent increase.
For perspective, 1.2% productivity growth is double the post-2000 average of 0.6%. It is even higher than the 0.8% growth during the 1990s internet technology revolution. This could lead to higher wages and higher standards of living, not to mention the further develop-ment of new ideas and inventions with the potential to significantly change our way of life.
5 A 0.02 increase multiplied by the coefficient (26) represents a 0.6% increase in productivity from previous-period productivity (also 0.6%). This gives us our forecast of 1.2% productivity growth.
FIGURE 8
A higher Idea Multiplier = higher future growth
Su
bse
qu
ent
chan
ge
in p
rod
uct
ivit
y g
row
th
Change in Idea Multiplier
2018:Most recent Idea Multiplier increase. Suggests annual productivity growth of 1.2% over the next �ve years.
1975–2013(Each dotrepresentsone year)
–1.0
0.0
1.0
2.0%
–0.03 –0.02 –0.01 0 0.01 0.02 0.03
R2= 0.2726
Notes: The Idea Multiplier is a proprietary metric that tracks the flow and growth of academic citations. It has been shown to be a leading indicator of productivity growth. For more information, see the forthcoming Vanguard paper The Idea Multiplier: An Acceleration in Innovation Is Coming. The x-axis is the five-year change in the Idea Multiplier. The y-axis is the productivity growth over the subsequent five-year period minus the growth in the lagging five-year period. The date range is 1975–2013. The years 2014–2017 are not represented because five-year forward productivity growth for those years was unknown at the time of publication. The red dot representing 2018 is a productivity projection based on the last known Idea Multiplier value. Productivity growth is represented by total factor productivity at constant national prices for the United States.Source: Vanguard calculations, based on data from Clarivate Web of Science and the Federal Reserve Bank of St. Louis.
12
What is causing the Idea Multiplier to multiply?
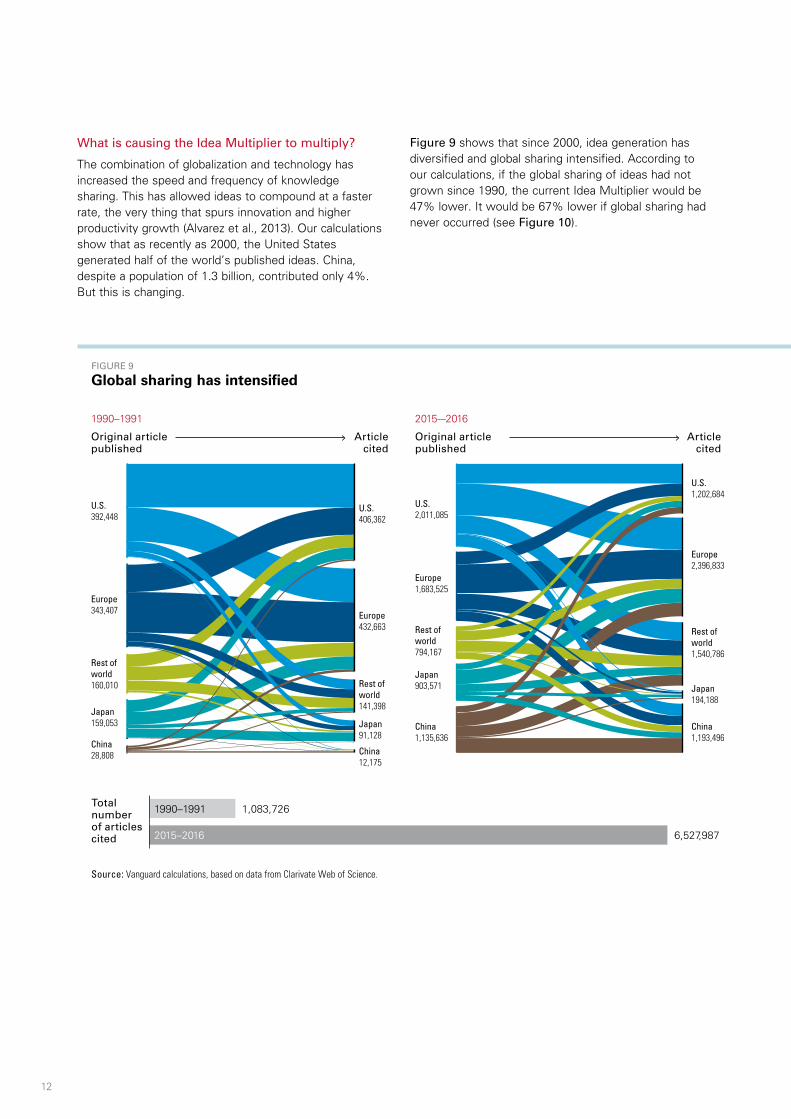
The combination of globalization and technology has increased the speed and frequency of knowledge sharing. This has allowed ideas to compound at a faster rate, the very thing that spurs innovation and higher productivity growth (Alvarez et al., 2013). Our calculations show that as recently as 2000, the United States generated half of the world’s published ideas. China, despite a population of 1.3 billion, contributed only 4%. But this is changing.
Figure 9 shows that since 2000, idea generation has diversified and global sharing intensified. According to our calculations, if the global sharing of ideas had not grown since 1990, the current Idea Multiplier would be 47% lower. It would be 67% lower if global sharing had never occurred (see Figure 10).
1990–1991 2015-–2016
U.S.392,448
Europe343,407
Rest ofworld160,010
Japan159,053
China28,808
U.S.2,011,085
Europe1,683,525
Japan903,571
Rest ofworld794,167
China1,135,636
Europe2,396,833
U.S.1,202,684
Rest ofworld1,540,786
China1,193,496
Japan194,188
U.S.406,362
Europe432,663
Rest ofworld141,398
Japan91,128
China12,175
1990–1991
2015–2016
1,083,726
6,527,987
Totalnumberof articlescited
Original articlepublished
Original articlepublished
Articlecited
Articlecited
FIGURE 9
Global sharing has intensified
Source: Vanguard calculations, based on data from Clarivate Web of Science.
13
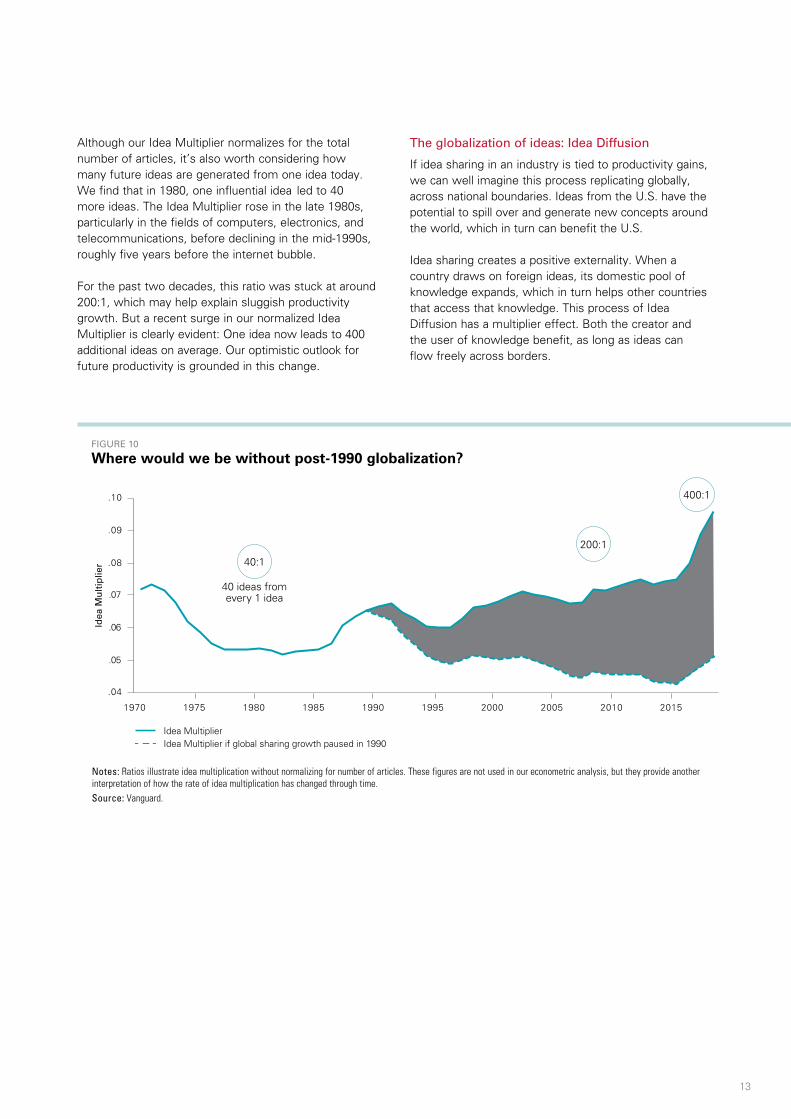
Although our Idea Multiplier normalizes for the total number of articles, it’s also worth considering how many future ideas are generated from one idea today. We find that in 1980, one influential idea led to 40 more ideas. The Idea Multiplier rose in the late 1980s, particularly in the fields of computers, electronics, and telecommunications, before declining in the mid-1990s, roughly five years before the internet bubble.
For the past two decades, this ratio was stuck at around 200:1, which may help explain sluggish productivity growth. But a recent surge in our normalized Idea Multiplier is clearly evident: One idea now leads to 400 additional ideas on average. Our optimistic outlook for future productivity is grounded in this change.
The globalization of ideas: Idea Diffusion
If idea sharing in an industry is tied to productivity gains, we can well imagine this process replicating globally, across national boundaries. Ideas from the U.S. have the potential to spill over and generate new concepts around the world, which in turn can benefit the U.S.
Idea sharing creates a positive externality. When a country draws on foreign ideas, its domestic pool of knowledge expands, which in turn helps other countries that access that knowledge. This process of Idea Diffusion has a multiplier effect. Both the creator and the user of knowledge benefit, as long as ideas can flow freely across borders.
Idea MultiplierIdea Multiplier if global sharing growth paused in 1990
.04
.05
.06
.07
.08
.09
.10
1970 1975 1980 1985 1990 1995 2000 2005 2010 2015
Idea
Mu
ltip
lier
40 ideas from every 1 idea
40:1
200:1
400:1
FIGURE 10
Where would we be without post-1990 globalization?
Notes: Ratios illustrate idea multiplication without normalizing for number of articles. These figures are not used in our econometric analysis, but they provide another interpretation of how the rate of idea multiplication has changed through time.Source: Vanguard.
14
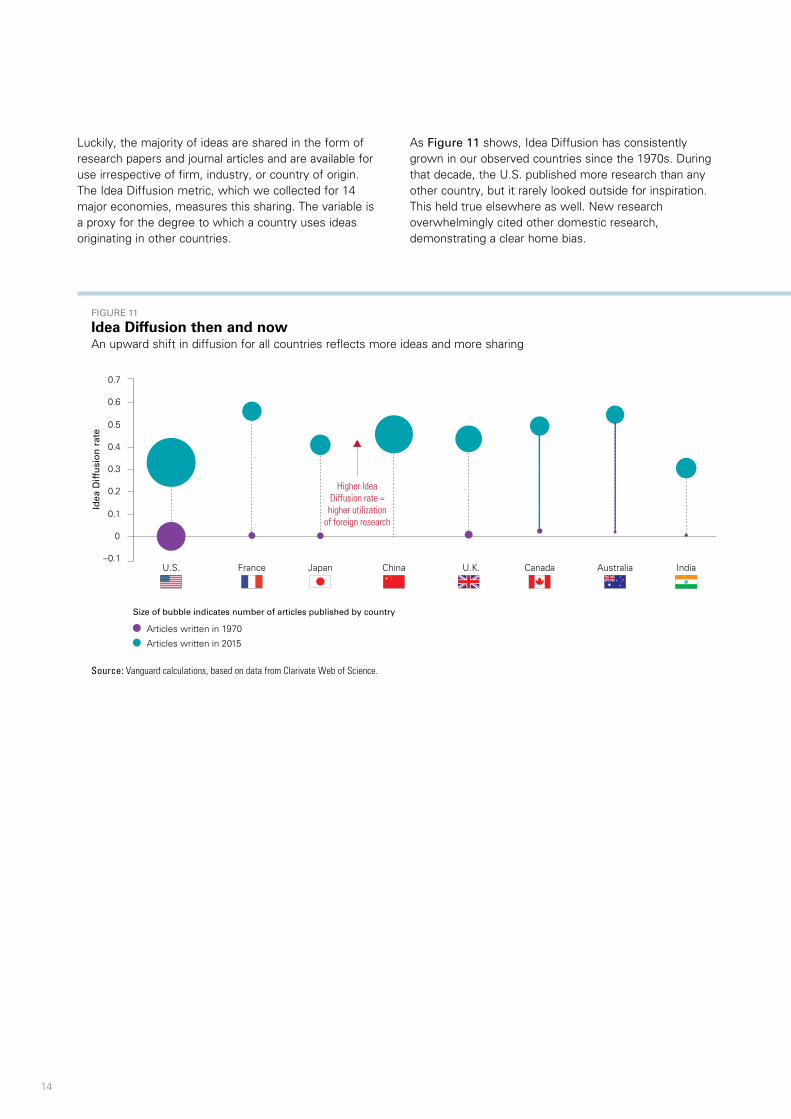
Luckily, the majority of ideas are shared in the form of research papers and journal articles and are available for use irrespective of firm, industry, or country of origin. The Idea Diffusion metric, which we collected for 14 major economies, measures this sharing. The variable is a proxy for the degree to which a country uses ideas originating in other countries.
As Figure 11 shows, Idea Diffusion has consistently grown in our observed countries since the 1970s. During that decade, the U.S. published more research than any other country, but it rarely looked outside for inspiration. This held true elsewhere as well. New research overwhelmingly cited other domestic research, demonstrating a clear home bias.
FIGURE 11
Idea Diffusion then and now An upward shift in diffusion for all countries reflects more ideas and more sharing
–0.1
0
0.1
0.2
0.3
0.4
0.5
0.6
0.7
U.S. France U.K. Canada Australia India
Idea
Diff
usi
on
rat
e
Size of bubble indicates number of articles published by country
Articles written in 1970
Articles written in 2015
Japan China
Higher Idea Diffusion rate = higher utilization
of foreign research
Source: Vanguard calculations, based on data from Clarivate Web of Science.
15
This changed gradually as globalization encouraged knowledge transmission, and technology (most influentially the internet) increased the availability and timeliness of information. Cross-pollination of ideas among countries prevailed, and research momentum grew.
The U.S. remains the leader in generating research. But because it now incorporates research from many foreign sources, the total pool of ideas has expanded by a factor of nine since 1970. Other countries have also increased their use of external research, in turn generating more domestic research of their own. Home bias, or reliance on domestic knowledge, has shrunk from 43% in 1970 to 23% in recent years. This has real benefits for long-term productivity and growth.
Global idea sharing leads to a more productive world
To determine whether this wave of idea sharing benefits global growth, we began with a model similar to the one used by Caselli, Esquivel, and Lefort (1996). It included variables traditionally considered vital to an economy’s growth, such as total stock of initial physical capital, population growth rate, and government spending. We then added our measure of Idea Diffusion for each country to create panel data for countries, as shown in Equation 2.
Equation 2
GYi,t = α + GYi,t–τ + Yi,t–τ + St–τ + log(Nt–τ) + GOt–τ + IDt–τ + ϵi,t
We measured the dependent variable output by rate of growth in GDP per capita (GYi,t).6 We included the lagged value of growth rate in GDP per capita as an independent variable. All other independent variables were considered at beginning-of-period levels to account for the initial position of the economy. Thus, all state-of-the-economy variables were measured at the beginning of the five-year period.
The savings rate (St–τ) was proxied by investment as a percentage of GDP. The gross per capita GDP (Yi,t–τ) proxied for initial stock of capital. Other variables included were government spending (GOt–τ) and log of population growth rate (Nt–τ). We introduced our own measure, Idea Diffusion (IDt–τ), as proxy for the rate of labor-augmenting technological progress.
In our regression results (see Appendix D for details), the coefficient for the Idea Diffusion is positive and highly significant. We estimate that a 0.1-unit rise in Idea Diffusion increases average growth rate in real output per worker by 2% over a five-year period. As an economy absorbs more ideas from outside its domestic knowledge pool, it generally grows at a higher rate than if all ideas were domestically sourced. Therefore, the sharing of ideas is a significant driver of long-term global growth.
6 This equation uses GDP per capita as a proxy for productivity growth because it offers a large data set.
For each country, we calculated the total citations each year, and, separately, the citations that came from other coun-tries. For example, Country X received 700 citations in the year 2000. Eighty of these came from Country Y, 20 from Country Z, and so on.
Based on that data, we were able to determine how many of the articles each country cited originated domestically as opposed to from other countries each year. For example, in Year 2000, Country Y cited 80 articles from Country X, 45 from Country Z, and so forth.
CALCULATING IDEA DIFFUSION
In this way, we collected time series of each country’s citations. Obviously, smaller countries cited both external and internal research less than larger countries were able to. To normalize for that, we divided ex-home country citations in time T by the number of articles written in T+1, T+2, and T+3.
16
Conclusion
The creation and sharing of ideas, at both industry and country levels, has proven to significantly boost productivity. Under reasonable assumptions, we expect productivity growth to climb above 1% over the next five years. This means higher profits for companies, higher wages for workers, and stronger global economic growth.
Our optimism is grounded in the recent increase in the sharing and application of ideas measured by our new proprietary metrics, the Idea Multiplier and Idea Diffusion indexes. But this productivity growth is not a foregone conclusion. Steps must be taken by govern-ments, corporations, and individuals to ensure the continued expansion of the global sharing and application of ideas.
Ideas that are constrained by borders, both real and virtual, are inhibited from reaching their full potential. We find that countries with more open terms of trade have Idea Diffusion scores 0.11 units higher than those of less open countries, indicating productivity growth that is 2 percentage points higher.
Developing economies have already experienced periods of rapid idea diffusion. Now, advanced economies such as the U.S. and Japan may be poised to gain greater benefits from foreign knowledge after decades of being net knowledge exporters.
Corporations must continue to invest in research and development to spur innovation. Partnering with public research institutions will magnify the number of potentially revolutionary ideas. In today’s world of hyper-specialization, individuals should also keep up with research outside of their occupational field. That’s how they’ll bring a novel approach to an existing idea, just as Orville and Wilbur Wright did.

17
References
Acemoglu, Daron, and Pascual Restrepo, 2018. Demographics and Automation. Working Paper No. 24421. Cambridge, Mass.: National Bureau of Economic Research.
Alvarez, Fernando, Francisco J. Buera, and Robert E. Lucas, 2013. Idea Flows, Economic Growth, and Trade. Working Paper No. 19667. Cambridge, Mass.: National Bureau of Economic Research.
Arellano, Manuel, and Stephen Bond, 1991. Some Tests of Specification for Panel Data: Monte Carlo Evidence and an Application to Employment Equations. The Review of Economic Studies 58(2): 277–297.
Atkeson, Andrew, and Patrick Kehoe, 1997. Industry Evolution and Transition: A Neoclassical Benchmark. Working Paper No. 6005. Cambridge, Mass.: National Bureau of Economic Research.
Barro, Robert, 2003. Determinants of Economic Growth in a Panel of Countries. Annals of Economics and Finance 4(2): 231–274.
Bloom, Nicolas, Charles I. Jones, Johan Van Reenen, and Michael Webb, 2017. Are Ideas Getting Harder to Find? Working Paper No. 23782. Cambridge, Mass.: National Bureau of Economic Research.
Brynjolfsson, Erik, Daniel Rock, and Chad Syverson, 2018. The Productivity J-Curve: How Intangibles Complement General Purpose Technologies. Working Paper No. 25148. Cambridge, Mass.: National Bureau of Economic Research.
Buera, Francisco J., and Ezra Oberfield, 2016. The Global Diffusion of Ideas. Working Paper No. 21844. Cambridge, Mass.: National Bureau of Economic Research.
Caselli, Francesco, Gerardo Esquivel, and Fernando Lefort, 1996. Reopening the Convergence Debate: A New Look at Cross-Country Growth Empirics. Journal of Economic Growth 1(3): 363–389.
Clarivate Analytics, 2019. Web of Science, available at https://clarivate.com/webofsciencegroup/solutions/web- of-science/.
Cochrane, John H., 2011. Discount Rates. Working Paper No. 16972. Cambridge, Mass.: National Bureau of Economic Research.
Eaton, Jonathan, and Samuel Kortum, 1994. International Patenting and Technology Diffusion. Working Paper No. 4931. Cambridge, Mass.: National Bureau of Economic Research.
Feldstein, Martin, 2017. Underestimating the Real Growth of GDP, Personal Income, and Productivity. Journal of Economic Perspectives 31(2): 145–164.
Gardiner, Bryan, 2012. Glass Works: How Corning Created the Ultrathin, Ultrastrong Material of the Future. Wired, available at wired.com/2012/09/ff-corning-gorilla-glass/.
Gordon, Robert J., 2016. The Rise and Fall of American Growth. Princeton, N.J.: Princeton University Press.
Griliches, Zvi, 1992. Output Measurement in the Service Sectors. Chicago Ill.: University of Chicago Press.
Grossman, David, 2017. How Do NASA’s Apollo Computers Stack Up to an iPhone? Popular Mechanics, available at https://www.popularmechanics.com/space/moon-mars/a25655/nasa-computer-iphone-comparison/.
Hatzius, Jan, Zach Pandl, Alec Phillips, David Mericle, Elad Pashtan, Daan Struyven, Karen Reichgott, and Avisha Thakkar, 2016. Productivity Paradox v2.0 Revisited. New York, N.Y.: Goldman Sachs.
International Monetary Fund, 2018. World Economic Outlook, April 2018: Is Productivity Growth Shared in a Globalized Economy? Washington, D.C.: International Monetary Fund.
Mankiw, N. Gregory, 1995. The Growth of Nations. Brookings Papers on Economic Activity (1): 275–326.
Porter, Michael E., and Scott Stern, 2000. Measuring the “Ideas” Production Function: Evidence From International Patent Output. Working Paper No. 7891. Cambridge, Mass.: National Bureau of Economic Research.
Romer, Paul M., 1986. Increasing Returns and Long-Run Growth. Journal of Political Economy 94(5): 1002–1036.
Solow, Robert M., 1956. A Contribution to the Theory of Economic Growth. The Quarterly Journal of Economics, 70(1): 65–94.
Solow, Robert M., 1987. We’d Better Watch Out. The New York Times. Book Review July 12: 36.
Syverson, Chad, 2010. What Determines Productivity? Working Paper No. 15712. Cambridge, Mass.: National Bureau of Economic Research.
The Vanguard Group, 2018. Vanguard’s Economic and Market Outlook for 2019: Down but Not Out. Valley Forge, Pa.: The Vanguard Group.
Williams, John, 2018. The Future Fortunes of R-star: Are They Really Rising? Speech at the Economic Club of Minnesota, Minneapolis, Minn.
18
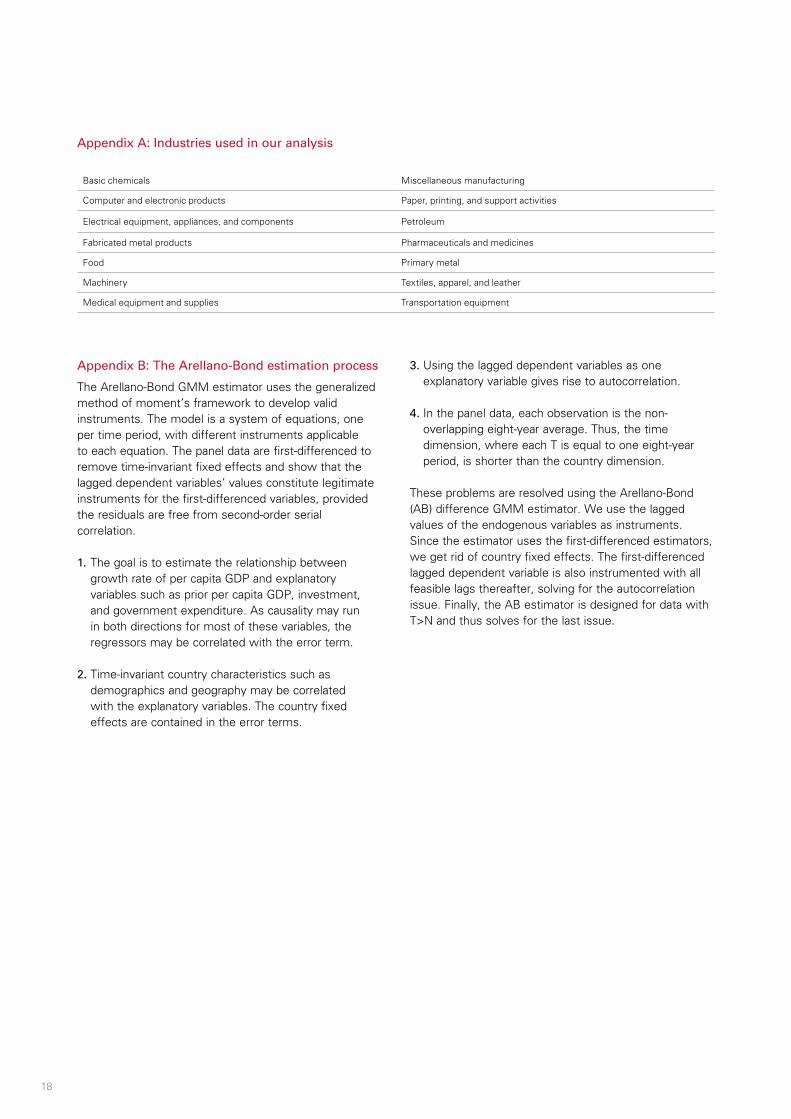
Appendix B: The Arellano-Bond estimation process
The Arellano-Bond GMM estimator uses the generalized method of moment’s framework to develop valid instruments. The model is a system of equations, one per time period, with different instruments applicable to each equation. The panel data are first-differenced to remove time-invariant fixed effects and show that the lagged dependent variables’ values constitute legitimate instruments for the first-differenced variables, provided the residuals are free from second-order serial correlation.
1. The goal is to estimate the relationship between growth rate of per capita GDP and explanatory variables such as prior per capita GDP, investment, and government expenditure. As causality may run in both directions for most of these variables, the regressors may be correlated with the error term.
2. Time-invariant country characteristics such as demographics and geography may be correlated with the explanatory variables. The country fixed effects are contained in the error terms.
3. Using the lagged dependent variables as one explanatory variable gives rise to autocorrelation.
4. In the panel data, each observation is the non-overlapping eight-year average. Thus, the time dimension, where each T is equal to one eight-year period, is shorter than the country dimension.
These problems are resolved using the Arellano-Bond (AB) difference GMM estimator. We use the lagged values of the endogenous variables as instruments. Since the estimator uses the first-differenced estimators, we get rid of country fixed effects. The first-differenced lagged dependent variable is also instrumented with all feasible lags thereafter, solving for the autocorrelation issue. Finally, the AB estimator is designed for data with T>N and thus solves for the last issue.
Appendix A: Industries used in our analysis
Basic chemicals Miscellaneous manufacturing
Computer and electronic products Paper, printing, and support activities
Electrical equipment, appliances, and components Petroleum
Fabricated metal products Pharmaceuticals and medicines
Food Primary metal
Machinery Textiles, apparel, and leather
Medical equipment and supplies Transportation equipment
19
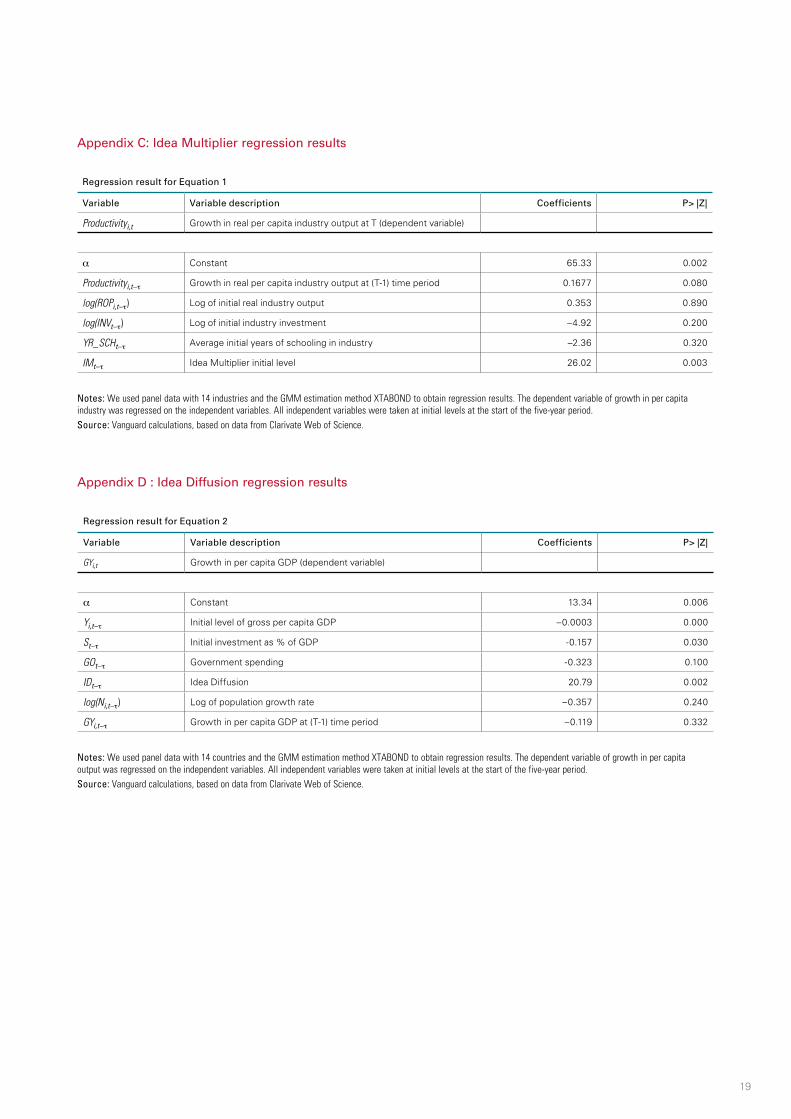
Appendix C: Idea Multiplier regression results
Appendix D : Idea Diffusion regression results
Regression result for Equation 1
Variable Variable description Coefficients P> |Z|
Productivityi,t Growth in real per capita industry output at T (dependent variable)
α Constant 65.33 0.002
Productivityi,t–τ Growth in real per capita industry output at (T-1) time period 0.1677 0.080
log(ROPi,t–τ) Log of initial real industry output 0.353 0.890
log(INVt–τ) Log of initial industry investment –4.92 0.200
YR_SCHt–τ Average initial years of schooling in industry –2.36 0.320
IMt–τ Idea Multiplier initial level 26.02 0.003
Notes: We used panel data with 14 industries and the GMM estimation method XTABOND to obtain regression results. The dependent variable of growth in per capita industry was regressed on the independent variables. All independent variables were taken at initial levels at the start of the five-year period. Source: Vanguard calculations, based on data from Clarivate Web of Science.
Notes: We used panel data with 14 countries and the GMM estimation method XTABOND to obtain regression results. The dependent variable of growth in per capita output was regressed on the independent variables. All independent variables were taken at initial levels at the start of the five-year period.Source: Vanguard calculations, based on data from Clarivate Web of Science.
Regression result for Equation 2
Variable Variable description Coefficients P> |Z|
GYi,t Growth in per capita GDP (dependent variable)
α Constant 13.34 0.006
Yi,t–τ Initial level of gross per capita GDP –0.0003 0.000
St–τ Initial investment as % of GDP -0.157 0.030
GOt–τ Government spending -0.323 0.100
IDt–τ Idea Diffusion 20.79 0.002
log(Ni,t–τ) Log of population growth rate –0.357 0.240
GYi,t–τ Growth in per capita GDP at (T-1) time period –0.119 0.332

© 2019 The Vanguard Group, Inc. All rights reserved. Vanguard Marketing Corporation, Distributor.
ISGIXA 122019
Vanguard Research
P.O. Box 2600 Valley Forge, PA 19482-2600
Connect with Vanguard® > vanguard.com
CFA® is a registered trademark owned by CFA Institute.