the impact of brand image on customer experience – company x
TRANSCRIPT
The impact of brand image on customer experience – Company X
Hannes Siitonen
Bachelor’s Thesis
Degree Programme in
Business Administration
2017

Abstract 10.9.2017
Author(s) Hannes Siitonen
Degree programme Business Administration Report/thesis title The impact of brand image on customer experience – Company X
Number of pages and appendix pages 39+2
The aim of this thesis was to find out what kind of relationship there is between brand image and customer experience, and how the brand image affects to customer experience. The aim was also to define the company’s brand image and customer experience among the target groups, and what factors do affect to them. In addition, this thesis aimed to produce valuable information for the company about their brand image, customer experience, customer behaviour and customer satisfaction, followed by increased customer understanding. This thesis was completed as an assignment for a Finnish company which wanted to remain anonymous, later referred as Company X. The study was delimited to concern brand in Finnish markets. The delimitation was done because Company X has a strong and recognizable brand image in domestic markets comparing to international markets and domestic customers are still company’s main customer segment. Also conducting a survey for domestic customers was easier to perform and control. This kind of study wasn’t performed for the Company X before. The theory of this thesis is divided into three parts. The brand theory reviews how brands build competition advantage for companies, what brand equity is and how brand image forms in customers’ minds. The customer experience theory introduces what customer experience consists, how added value is generated, and how customer path forms. The theoretical framework of relationship between brand and customer experience compounds theories presented in previously and applies theory of customer experience and brand equity. The research was completed with quantitative method and the research material was collected with an online survey in Webropol online platform. The research groups were Company X’s newsletter subscribers who represented the brand loyalists and the second and third year students of Haaga-Helia University of Applied Sciences, who represented millennials. Millennials were chosen as a control group, because Company X sees them as important future customers. The total of 970 respondents answered the study, 881 of them were Company X’s newsletter subscribers and 89 were students of Haaga-Helia UAS. The results were analysed with Microsoft Excel and IBM SPSS statistics software. The results showed that brand image has a significant impact on customer experience amongst the Company X’s newsletter subscribers. The results also showed that the Company X has a strong and loyal customer base who are truly loyal for the brand. Due the small number of respondents among the students it wasn’t possible to draw any meaningful conclusions from the results. Keywords brand image, customer experience, impact of brand image on customer experience

Table of contents
1 Introduction ..................................................................................................................... 11.1 The objectives of the study and research problems ............................................... 2
2 Brands as competition advantage .................................................................................. 32.1 Brand equity ........................................................................................................... 3
2.1.1 Brand loyalty ................................................................................................ 62.1.2 Perceived quality ......................................................................................... 62.1.3 Brand awareness ........................................................................................ 72.1.4 Brand associations ...................................................................................... 8
2.2 Brand image ........................................................................................................... 82.2.1 Brand identity .............................................................................................. 92.2.2 Affecting perceived brand image ............................................................... 10
2.3 Brand experience ................................................................................................. 112.4 Measuring brand image ........................................................................................ 12
3 Creating experiences for customers ............................................................................. 133.1 Creating a customer experience .......................................................................... 133.2 Expectations exceeding experiences ................................................................... 143.3 Added value ......................................................................................................... 153.4 Customer journey ................................................................................................. 153.5 Measuring customer experience .......................................................................... 18
4 The impact of brand image on customer experience .................................................... 204.1 Impact of customer experience on brand equity .................................................. 204.2 Integration of brand and customer experience ..................................................... 204.3 Theoretical framework of impact of brand image on customer experience .......... 22
5 Conducting the study .................................................................................................... 255.1 The findings of the research ................................................................................. 27
5.1.1 Company X’s newsletter subscribers ........................................................ 275.1.2 Students .................................................................................................... 31
5.2 Summary of the findings ....................................................................................... 336 Conclusions .................................................................................................................. 35
6.1 Reliability and validity ........................................................................................... 356.2 Self-assessment of the learning ........................................................................... 36
References ........................................................................................................................ 37Appendices .......................................................................................................................... 1

1
1 Introduction
Customer experience and added value have been trend words in marketing and strategic
leadership in recent years. Experiences generated for customers have become an
important way to differentiate in highly competitive markets and in many industries
customer experience is becoming a crucial competition advantage. Companies are
transforming their strategies to more customer-oriented direction. (Gerdt & Korkiakoski
2016.) Quote “Customer experience is today’s business benchmark” by respected
American business magazine Forbes reflects the significance of the experiences
generated for customers in modern day business. (Forbes 2014.)
Harvard Business Review (2013) defines customer experience as “the customer’s end-to-
end journey”. What customer experience does, is that it binds together all the encounters
in client interface and company’s visible actions as an ensemble for customers. There
aren’t two customer experiences a-like and each customer forms their unique customer
experience through engagements and feelings during these encounters with the brand.
Harvard Business Review sees greater customer satisfaction, diminished customer churn,
higher revenue, and better employee satisfaction as the advantages of investing in
customer experience.
Customer experience can be seen as differentiate factor in highly competitive markets.
Expectations exceeding customer experience creates an important competition advantage
and helps company to gain market leader status. Another important way to differentiate
and gain competition advantage are brands. Nowadays almost everything is branded and
brands have a remarkable status on our everyday lives starting from basic commodities to
luxury products. One of the most used definitions for brand is The American Marketing
Association’s opinion that brand is ”A name, term, sign, symbol, or any other feature that
identifies on seller’s product or service as distinct from those of other sellers.” But in
reality, brand is much more than that. Brand is all the characteristics associated with the
company and their offering and the brand elements are the ones which differ the brand
from its competitors. (Lindberg-Repo et al. 2009. The American Marketing Association,
Borja De Mozota 2009. Keller, Apéria & Georgson 2008.)
Brand is a complex concept and each brand has its own distinguished characteristics
which separates the brand from the others. Some brands are easier to identify but every
brand should have something of its own. It could be argued that in today’s business
almost everything from products or services to distribution channels and patents can be
copied from the competitors but brand is the only thing that can’t be duplicated. If tried, it

2
will massively backfire and the copycat brand only gets confused to the original one. For
example, almost everybody can start to produce a cola flavoured lemonade but there is
only one Coca-Cola.
Brand’s mission is not only to differentiate the company’s offering from their competitors.
Company’s brand is a promise for certain quality for the customers and reduce the
customer’s risks when choosing a product or service to purchase. To many customers,
brands are also a way to express their values, taste, or characteristics which they want
others to affiliate to them. This creates continuity to the relationship between customer
and the brand which instead builds brand loyalty and generates satisfaction for customer
through the familiarity and intimacy while using brand’s products. (Kapferer 2008. p. 20-
22, 186)
1.1 The objectives of the study and research problems
This thesis was completed as an assignment for Company X during the spring 2017. The
main research problem of the thesis was how the brand image affects the customer
experience among Company X’s customer base. The secondary research problems were
how the image of Company X’s differs between different research groups, how the
physical store-environment affects customer experience, and how the image of Company
X varies between consumers who have purchased Company X’s products and non-
purchasers. The study was a good chance for Company X’s to deepen the company’s
understanding of their customers’ behaviour, perception of the brand, and possible issues
in the relationship with the brand.
The study was completed as quantitative research which relied strongly on correlation
coefficient between core findings of the study. The research groups used in this study
were Company X’s Finnish newsletter subscribers and students of Haaga-Helia University
of Applied Sciences, who were aimed to represent the take of 18 to 30-year-old potential
future customers.
The focus of the study was to combine one of the biggest trends in modern day business,
the customer experience, to the competition advantage generating system, the branding.
The idea behind of combining these two concepts was to find a fresh viewpoint for a
largely studied brand building process. Customer experience was a natural choice to add
on because both include similar themes and a lack of previous academic studies of these
two concepts further affirmed the choice of the subject of this thesis.

3
2 Brands as competition advantage
Brands are an essential part of modern business and they are one of truly differentiating
qualities of the companies’ offering. The importance of brands is highlighted in Company
X’s business where characteristics of the brand make company’s products unique and
sought out in highly competitive markets. Brand is also a promise of company’s values
and offering which should be redeemed through company’s actions, brand
communication, and customer’s subjective experiences. (Borja De Mozota 2003. p. 97-99)
To understand the relevance of brands in modern business, it’s important to understand
brand dynamics and its significance to customer experience. The concepts of brand
equity, brand image, brand experience, and measuring brand image are viewed in this
paragraph.
2.1 Brand equity
Brand equity is defined as everything that is linked to the brand and brand equity’s
purpose is to provide added value to the brand. Customer based brand equity expects
that brand is known in advance among the customers and strong customer based brand
equity occurs when customer has a strong memory trace of the brand. (Borja De Mozota
2003. p. 102, Keller 2012. p. 59-60.)
Brand equity is divided in two different perspectives through frameworks of branding
authorities David Aaker and Kevin Lane Keller. Aaker views brand equity from company
based viewpoint which is useful tool for company’s inner analysis of customer
engagement, generated value, and brand’s performance in current markets. Aaker’s
brand equity’s mission is to provide value to the owners of the brand. Aaker divides brand
equity into four dimensions, brand awareness, brand loyalty, perceived quality, and brand
associations. Aaker’s model (Image 3.) shows how these dimensions differentiate the
brand from the competitors. While Aaker’s model treats brand equity mainly from
company-oriented viewpoint it can be applied to customer based perspective too. (Aaker
2014. p. 9-11, Keller, Apéria & Georgson 2012. p. 42, 53)

4
Image 3. How Brand Equity Generates Value (David Aaker 1991.)
Keller considers brand equity as customer based mechanism which aims to provide
added value for the customer. In Keller’s Customer Based Brand Equity model (later
referred as CBBE) (Image 4.) brand equity is viewed as a pyramid which has six blocks.
These stages are partly the same with Aaker’s model but they are viewed by customer’s
response on these factors. Both concepts aim to deliver deep and broad brand awareness
among the customers, differentiative attributes for the brand, positive reactions from the
customers, and intense and active loyalty. The stages pictured in the Keller’s CBBE model
are salience, imagery, performance, feelings, judgements, and resonance. (Aaker 2014.
p. 10-11, Keller et al. 2012. p. 54,66)

5
Image 4. Customer Based Brand Equity Pyramid (Keller 2012.)
From the comprehensive perspective, a strong brand equity benefits the customers, the
company, and the stakeholders. For customers, a strong brand equity generates
advantages through company’s willingness to keep the customer’s satisfied and generate
added value for the customers throughout the supply chain and product development.
Increased brand equity will increase customers’ loyalty towards the brand and vice versa.
(Grönroos 2015. p. 342) From company’s perspective, a strong brand equity is a
competition advantage against the competitors and negotiation leverage in supply chain.
Other assets of strong brand equity are widening customer base and diminished customer
churn, enhanced customer loyalty, higher profits through consumer’s willingness to pay
brand premium, possibility of brand extensions and production licences, and grown effects
of marketing communications. (Aaker 2010 p. 274-275) Brand equity is simply economical
value for stakeholders. Strong brand equity generates increased demand of brand
products or services which result is greater revenues and profits for the company and
stakeholders. (Lindberg-Repo 2009. p. 98-99.)
Brand equity is viewed from Keller’s customer based viewpoint in this thesis due its more
relevant nature while applying the relationship between the brand image and the customer
experience. Customer experience and brand image are both individual and subjective
experiences which can vary massively depending on customer’s perception of the brand.
Keller’s model builds brand equity on the salience which in turn consists brand awareness

6
and brand image. CBBE model also observes constantly the relationship between
customer and the brand in all of the stages of the pyramid.
2.1.1 Brand loyalty
Brand loyalty is a built relationship between consumer and brand which forms through
successful encounters in user interface and customer service actions. Brand loyalty is a
result of long term interaction with the brand and the customer and it won’t happen
overnight. Brand elements which enhance the coherence between consumer and brand,
will affect positively on customer’s brand loyalty. Brand loyalty can be viewed as a cause
and an effect of a strong brand equity. (Keller. 2012. p. 90-91.)
Brand loyalty generates important trade leverage and stable customer base for brands.
Active loyalty also reduces marketing costs while targeting this loyal audience and it helps
to attract new consumers through brand awareness raised by loyal consumers or
promoters who actively recommend the brand. In Keller’s Customer Based Brand Equity
Model brand loyalty is the highest stage of the CBBE pyramid where the active interaction
and dialogue between brand and consumer is achieved. (Keller 2012. p. 66)
Willingness to pay price premium from branded products is an effective way to define the
level of brand loyalty. The customers who are truly loyal to the brand are willing to pay
brand premium and if not, their loyalty level is shallow. Stages of customer loyalty can be
divided in five categories which are noncustomers, price switchers who are sensitive to
changes in pricing, passively loyal who tend to buy from more of a habit than for a reason,
fence sitters who are in between of brands, and the committed. Clear brand identity, brand
awareness, and perceived quality are effective channels to enhance the brand loyalty. In
addition, different loyalty programs, customer clubs, and targeted marketing actions for
specific customer segment can be useful. (Aaker 2010. p. 22-25, 321.)
2.1.2 Perceived quality
Perceived quality is the customer’s viewpoint of overall quality of the brand’s products or
services. Customers form their perception of quality and value through assessing the
performance, features, conformance, reliability, durability, serviceability, and style or
design of the product. These elements of product or service can affect subconsciously on
customer’s attitudes and behaviour towards a brand positively or negatively. Aaker
describes perceived quality as “goodness” of the brand which means when the perceived
quality of the brand improves same thing happens to other elements of the brand. (Keller.
2012. p.208-209. Aaker 2010. p.19.)

7
Perceived quality is a subjective concept which can be affected by customer’s earlier
experiences with the brand or customer’s individual valuation of which attributes he or she
considers important. Thus, from company’s perspective it is important to understand the
definition of quality in different customer segments and to compare their products’ quality
to the competitors’ products. (Aaker 2010. p. 324)
Other customers’ experiences and reviews of the brand may also have an influence on
perceived quality. Positive reviews and word of mouth information will create expectations
of quality which brand is expected to fulfil. If brand fails to deliver or exceed these
expectations, it will shape customer’s perception of quality of the brand. Positioning of the
brand has a factor on perceived quality too.
In today’s business, affiliate marketing has grown a lot in recent years and opinion leaders
used more and more in brand marketing. Especially this has highlighted in social media
and online platforms where the sent information is perceived immediately and responses
are quicker. Opinion leaders such as celebrities, bloggers, vloggers, and other social
media “superstars” shape the preferences and behaviour of consumer segments within
which they are popular.
2.1.3 Brand awareness
Brand awareness represents customer’s recall and strength of the memory of the brand,
the brand recognition. Brand recognition can be measured by customers’ ability to identify
the brand in different situations and from different visible and recognizable attributes, such
as logos, symbols, and designs, which are attachable in the brand. Brand recall on the
other hand is customer’s ability to remember brands when they are given a specific
product or service category. (Keller et al. 2012. p. 58, 60. Aaker 1991. p.10-15.)
For consumers, familiar brands are instantly more tempting options compared to
unfamiliar ones despite the attributes of the product or service. People like familiar things
and they are more likely to attach positive attributes to something which they are already
familiar with. (Borja De Mozota 2003. p.103) In this light, most of the brands are searching
for “top of the mind” -status which is the brand that most of the consumer’s recall first
when asked to name a brand from specific category. The effect of brand awareness is
most significant in low-investment products, for example a chocolate bar, where
consumers use less time to evaluate the purchase decision. In some cases, brand
awareness is the only factor affecting to the buying decision. (Keller. 2012. p. 58, 60-61.
Aaker 1991. p.10-15.)

8
It could also be presumed that elaboration-likelihood model has slight effects on
consumer’s evaluating process of purchase. It means that consumer which has a low
involvement on product due lack of purchase motivation or ability is more likely to make
choices based on brand awareness. In context of Company X’s business environment, the
latter is more important through the assumed limited financial capability of some
consumers. (Keller 2012. p. 61)
2.1.4 Brand associations
Brand associations are described as all the attributes, positive and negative, that
consumer attaches to the brand. (Aaker 1991. p.25). Brand associations might be
anything from package design to brand ambassadors. For example, adidas identifies
strongly to their three stripes and Nike to their Swoosh logo.
Brand associations are relying highly on brand identity and messages sent by the brand
but other things have an effect too. For example, brand positioning, brand values and
pricing affect the favourability and uniqueness of the brand associations. In terms of
favourability, decisive matters are how relevant, distinctive, or believable the brand is.
Uniqueness of the brand associations are achieved by the positioning and values of the
brand to the markets where competition is low or non-existence.
Brand associations are divided into three categories, attributes which consumer attach to
the brand, benefits of using the brand and attitudes towards the brand. (Borja De Mozota
2003. p. 103) Attributes which consumers attach to the brand are the ones which
characterize the brand. Benefit of using the brand is the reflection of consumer’s personal
values which are shaped through consumer’s perception of him or herself and how they
want to be viewed by others. Earlier successful encounters with the brand will also create
positive feelings and beneficial views towards the brand in consumer’s mind. Consumer’s
attitudes towards the brand are also heavily linked to the self-image of the consumer and
values which consumer appreciates. This perception is affected by consumer’s coherence
in specific group. For example, consumer who feels like belonging to young urban creative
population is more likely to create positive attitudes towards the brands which are
considered popular among this group.
2.2 Brand image
Brand image is one of the key concepts of brand dynamics because it views how the
brand is perceived in the markets by a specific group or customer segment, and what kind

9
of relationship consumers has with the brand. Brand image is a reflection on how the
consumers, the brand recipients, view the brand and which attributes they affiliate with
brand. In this point of view, it could be argued that brand image should be used as a
synonym for brand through customer’s perception of their relationship with the brand.
Every customer shapes their own image and perception of the brand. The image is
affected by every visible action of the brand, such as marketing campaign or product
quality, and what is said about the brand in public. This relationship between brand and
the consumer is constantly changing and it needs to be nurtured. Brand image can be
used to measure the strength, uniqueness, and favourability of the brand among the
target audience. (Grönroos 2015. p.342, Borja De Mozota 2003. p.98, Kapferer 2008.
p.174-175)
Additionally, brand image can be used as a synonym of the company’s reputation. CEO of
Amazon online store has described brand as “what people say about you when you are
not in the room”, which is transformable also as a brand image. (Kim 2015.)
2.2.1 Brand identity
Brand image is built upon brand identity which is organization’s self-perception and what
associations it attaches to itself, and which associations organization wants to create or
affirm. (Aaker 2010. p.68-69) Kapferer (2008. p.171-175) sees brand identity as a way to
express brand’s uniqueness and values. Brand identity is also a source of brand
positioning, which affects on image reflection. Aaker and Kapferer both agree that
company’s strategy towards brand image should start from building identity instead of
focusing on how customers view brand. Brands are considered too often through the
external factors and affections of well managed identity are forgotten.
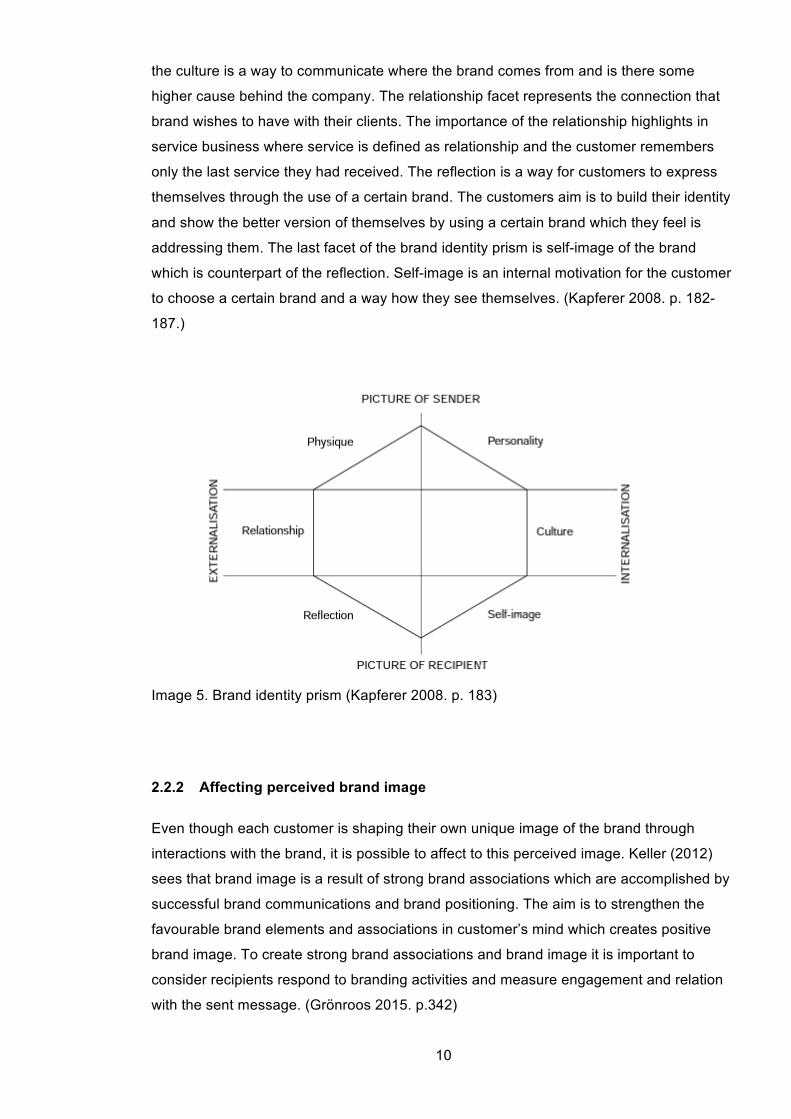
Kapferer’s (2008 p.182-187) brand identity prism considers mechanism between brand
identity and brand image through six factors which are brand physique, personality,
culture, relationships, reflection, and self-image. (Image 5.) These factors form a structure
where all factors strengthen and affirm each other.
Brand physique describes what kind of visual appearance brand has and what kind of
design it depends on. For example, Company X’s brand physique builds on recognizable
design of their products, prints and logo. Brand personality is a way to build a character
for brand. Set of tone in brand communications and spokespersons used in advertising
defines brand personality and makes it more easily approachable for target audience.
Brand culture reflects values that brand represents and how they communicate of them
outwards. It is also an important differentiative factor among the luxury brands because
10
the culture is a way to communicate where the brand comes from and is there some
higher cause behind the company. The relationship facet represents the connection that
brand wishes to have with their clients. The importance of the relationship highlights in
service business where service is defined as relationship and the customer remembers
only the last service they had received. The reflection is a way for customers to express
themselves through the use of a certain brand. The customers aim is to build their identity
and show the better version of themselves by using a certain brand which they feel is
addressing them. The last facet of the brand identity prism is self-image of the brand
which is counterpart of the reflection. Self-image is an internal motivation for the customer
to choose a certain brand and a way how they see themselves. (Kapferer 2008. p. 182-
187.)
Image 5. Brand identity prism (Kapferer 2008. p. 183)
2.2.2 Affecting perceived brand image
Even though each customer is shaping their own unique image of the brand through
interactions with the brand, it is possible to affect to this perceived image. Keller (2012)
sees that brand image is a result of strong brand associations which are accomplished by
successful brand communications and brand positioning. The aim is to strengthen the
favourable brand elements and associations in customer’s mind which creates positive
brand image. To create strong brand associations and brand image it is important to
consider recipients respond to branding activities and measure engagement and relation
with the sent message. (Grönroos 2015. p.342)

11
As said above, brand identity and brand positioning has big role in strengthening the
image of the brand but they also help to differentiate the brand from their competitors. The
idea behind the positioning is to communicate actively about the preferred characteristics
of the brand identity and brand value proposition for the targeted audience. When
positioning the brand, the brand image, and the brand identity should always be compared
to each other on different dimensions to get the realistic picture where the brand is now
positioned. Usually there is three different scenarios to apply in the brand communication
to reposition brand so that it responds better to the brand identity and preferred
characteristics of the brand. These ways are augmentation, reinforcement and
exploitation, and diffusing, softening, or deleting of the brand image. (Kapferer 2008. p.
175, Aaker 2010. p. 70-71, 180-181.) In addition to the elements of brand identity and
brand image, a pricing can be a way to position the brand at the markets and shape the
perceived image of the brand. For example, a Swedish clothing label Acne Studios has
used a pricing in recent years to reposition the brand. With aggressive increase of brand
premium in their products Acne has been able to transform from a common everyman’s
brand to a real luxury label.
There is no doubt that the result of a strong brand image is a strong brand equity. (Keller
2012 p.62) While Aaker and Keller see the brand equity as an ultimate goal of branding,
it’s highly important to look after the brand image as well. Brand image is constantly
changing and it can be affected more easily than brand equity through the brand
communication, the marketing activities, and the customer experience management.
Brand equity is hard to ruin in one night whereas brand image can be destroyed in a
minute.
2.3 Brand experience
Brand experience is mixture of “sensations, feelings, cognition and responses by brand-
related stimuli” that are part of a brand environment. Brakus, Schmitt and Zarantonello
divide brand experience into four different dimensions which are sensory, affective,
intellectual, and behavioural dimensions and these are evoked differently by various
brands. It is said that brand experience influences in consumer satisfaction and loyalty,
together with indirect effects to brand personality. (Brakus, Schmitt, Zarantonello 2009.)
Brand experience is strongly linked to customer journey. During the journey, customer
encounters product, shopping and service and consumption experience. Product
experience is faced when customer is in contact with the product physically or virtually.

12
Shopping and service experience occurs when customer is visiting the store or being
served by the sales personnel in store. Consumption experience happens when product
or service is being used and it is often attached to feelings experienced while consuming.
(Brakus, Schmitt, Zarantonello 2009.)
Brand experience reminds a lot of customer experience. Both concepts rely highly on
creating differentiated experiences and added value for customer in touch points where
customer is engaged with the brand. The differences between these strategies lie in
approach to business. Brand experience is focused on bolstering attributes attached to
brand within customer encounters whereas customer experience is driven by satisfying
customers and offering seamless service throughout the channels and customer journey.
(Chidley 2014.)
2.4 Measuring brand image
Brand image can be measured by studying brand associations structured in consumer’s
mind. In these researches can be used either existent brand associations as
measurement tools or the ones that the brand management wants consumers to attach to
the brand. Usable existent brand associations can be found from Young & Rubicam’s
BrandAsset Valuator® or Jennifer Aaker’s brand personality list. (Balabanis 2009.)
In Young & Rubicam’s BrandAsset Valuator® four dimensions measured are
differentiation, relevance, knowledge, and esteem. In Jennifer Aaker’s brand personality
list, subject person is to describe brand and him/herself through a set of questions that
ask how different adjectives describe the brand. Facets used in brand personality list are
sincerity, excitement, competence, sophistication, and ruggedness. (Balabanis 2009.)
Evaluating the strength of associations on brand image, the studies can consist an
agreement chart which measures percentages of respondents’ answers on association
strength. The reliability of these associations depends on the N of the study. (Balabanis
2009.)
Measuring the brand image is useful way to define a general perception of the brand
amongst the main target group or more niche customer segment. As stated in paragraph
3.2.2 the perception of the prevalent brand image should be in knowledge to position
brand correctly in the markets. (Aaker 2010. p.180-181)

13
3 Creating experiences for customers
Highly considered business publication Harvard Business Review (2013) defines
customer experience as “the customer’s end-to-end journey”. What customer experience
does, is that it binds together all the encounters in client interface and company’s visible
actions as an ensemble for customers. There aren’t two customer experiences a-like and
each customer forms unique experience through engagements and feelings during the
encounters with the brand. (Löytänä & Kortesuo 2011. Questback 2017.) Harvard
Business Review (2013) sees greater customer satisfaction, diminished customer churn,
higher revenue, and better employee satisfaction as the advantages of investing into the
customer experience.
Customer experience is a highly emotional encounter with the customer and the brand.
Over 50% of the customer experience forms through the emotions felt by the customer.
Customer experience is a result of multiple encounters in customer interface with the
brand and the customer in conscious and subconscious ways. Customer experience adds
together company’s performance and customer’s feelings. While each customer
experience varies slightly from each other it is impossible to fully affect the result of
experience that the customer goes through. Although it is possible to manage which kind
of experiences companies try to create. (Shaw, Dibeehi, Walden. 2010 p. 3.) Löytänä and
Kortesuo (2011) see that successful customer experience supports customer’s self-image,
surprises, and creates experiences, remains in the memory, and evokes customer for
wanting more.
Customer experience is also a differentiative factor in highly competitive markets.
Expectations exceeding customer experience create an important competition advantage
and helps company differentiate from their competitors. In today’s business environment,
it is important to stand out from the mass and to become a sought-out alternative for
consumers. (Gerdt & Korkeakoski. 2016 p. 26-31. Shaw, Dibeehi, Walden. 2010 p. 2-3.)
3.1 Creating a customer experience
From strategical point of view the process of managing and creating customer experience
begins by assessing current situation of the customer experience. Gertd's and
Korkeakoski’s model of analysing current situation of customer experience includes three
stages which analyse company’s I. inner prowess of the company, II. current customers
and III. competition environment. (Gerdt & Korkiakoski 2016. p. 32-33, Questback 2017.)

14
Customer experience strategy should be a part of company’s comprehensive business
model along several other strategies such as brand strategy, business strategy and it-
strategy. To create successful customer experience customer-oriented vision and
customer insight are needed. (Gerdt & Korkiakoski 2009 p. 41, 50, Löytänä & Kortesuo
2011.)
It should be noted that customer experience is always subjective concept and there isn’t a
one proper way to execute the customer experience strategy. The execution is highly
dependent on industry and competition environment in which the company is operating.
(Gerdt & Korkiakoski 2016. p. 94.)
3.2 Expectations exceeding experiences
Customer’s expectations are categorised into three stage which are core experience,
extended experience and expectations exceeding experience. Core experience is that
something why customer decides to purchase the goods or service from a certain brand.
Customer who uses the brand’s offering is expecting this core experience to fulfil and it
can be the least that brands should be able to deliver. This can be also seen as
frictionless experience where customer can shift smoothly from touchpoints to another.
(Löytänä & Kortesuo 2011. Gerdt & Korkiakoski 2016. p.38-41, 94)
Extended experience is a step towards expectations exceeding experience and it should
create that little something which adds value to the core experience. Extended experience
requires advancement and enabling. Advancement means that elements are added to the
customer experience which directly promotes the expanding of core experience.
Enablement means that brand creates elements which indirectly expand the core
experience. (Löytänä & Kortesuo 2011.)
After the customer experience has been extended from the core experience, it needs to
be further refined to achieve expectations exceeding experience. Expectations exceeding
experience is tightly connected to the feelings of the customer while the previous stages
have been more objective ones. The experience which exceeds all the expectations
should be personal, individualistic, real, essential, tailored, properly timed, sharable,
sustainable, clear, valuable before and after the transaction, visibly valuable, emotional,
surprising, and profitable. To fulfil these, the customers should be treated as individuals
and their needs and behaviour should be taken into consideration during the
engagements. The communication between customer and the brand is in key role when
creating and pointing out the added value gained during and after the transaction.
(Löytänä & Kortesuo 2011.)

15
Customer’s expectations during the customer experience are as individual as the
customer experience itself. The expectations depend strongly on customer’s persona,
character, and culture. For example, some customers may expect very individual service
during the service setup as others prefer to roam around in shop without disturbance. It is
essential to know the markets, customer base, and their expectations. (Gerdt &
Korkiakoski 2016. p.94)
3.3 Added value
Added value is one of the main goals of customer experience. Two main sources of value
creation for customer are utilitarian and hedonistic sources. Utilitarian sources are visible
for customer and are ways to achieve something. Usually these utilitarian sources are tied
to attributes of the good or service such as materials and price. Hedonistic sources are
individually assessed benefits which are irrational, subjective, and emotional. For
example, hedonistic benefits are brand image, need to self-express, and different feelings
felt during the encounter. According the studies, customer experiences which include
mostly hedonistic elements affect more likely positively to customer’s willingness to
recommend the brand and customer’s attitude towards the brand is more positive and
passionate. (Löytänä & Kortesuo 2011.)
For example, in Company X’s case added value is generating for customers through
utilitarian sources such as used materials, durability of the products and design of the
products. Hedonistic sources could be the looks of the products, the need to express the
taste, and the willingness to own a genuine product to name a few.
3.4 Customer journey
Customer experience is often considered as a synonym for customer service but it is
much more than that. (Löytänä & Kortesuo 2011.) Customer journey and customer
experience can include many different paths which customer goes through but there are
three stages which are more permanent than the others and they are visualized in Image
6. (Questback 2016.) It is also worth to consider what are the channels in which customer
wants to be in engagement with the brand. (Gerdt & Korkiakoski 2016. p. 131.)

16
Image 6. Customer journey
First stage of the customer’s journey and experience is an image experience which is
customer’s perception of the brand image and the brand. (Questback 2016.) Image
experience shapes through the encounters with the brand and the customers and it can
form way before customer even starts to consider purchasing the brands goods or
services. The image experience combines elements of the brand image and the brand
experience. The customer shapes the perception of the brand through multiple encounters
with the brand. (Grönroos 2015. p.342, Borja De Mozota 2003. p.98)
Second step of the journey is the shopping experience where customer makes the
purchase decision. Succeeding in this stage is critical for comprehensive customer
experience because unhappy customer is not likely to come back to the store. (Questback
2016.) While reflecting that, it is important to create customer-oriented service culture
where customer is placed in hub. (Gerdt & Korkiakoski 2016. p.98)
The decision to purchase the goods or service is highly affected by customer’s attitudes
and previous experiences, other people’s opinions and information sources, and
customer’s perception of brand. (Gerdt & Korkiakoski 2016. p. 73-75. Questback 2016.)
Shopping experience can take place in physical store environment or online and main
purpose of it is to create expectations exceeding experiences. Study completed in
Wharton School of Business points out that customer service has a major contribution on
shopping experience and requires constant engagement with the customer from the store
personnel. (Forbes 2009.) A service can be also viewed as a concept which is tied into
company’s business model. For example, when contemplating Swedish furniture giant
IKEA, the service is exactly the same no matter where you visit the IKEA store. IKEA have
created a recognizable service concept which aims to produce standardized customer

17
service each and every time and the company has eliminated the variables in service
setup as they depend strongly on self-service. (Gerdt & Korkiakoski 2016. p.108)
The other factor which has a major impact on shopping experience are the emotions
evoked during the visit in store, no matter whether physical or online. (Machleit & Eroglu
2000.) A great shopping experience affirms the relationship between customer and a
brand, in the best scenario a customer recommends the brand onwards and becomes a
promoter for a company. (Questback 2016.) It should be noted that a good service is
remembered much longer than affordable price through the memory trace that it leaves.
(Gerdt & Korkiakoski 2016. p. 101.)
Last step of the customer’s journey is user experience which length varies on products
and services. (Questback 2016.) User experience of a design chair can last a lifetime
while finishing a chocolate bar takes only couple of minutes. Customer’s user experience
is affected by the expectations that customer might or might not have before purchasing a
product or service. Higher the expectations have been pre-purchase, the better the
product or service must be to deliver the expectations exceeding experiences. These
expectations are affected by earlier experiences, reviews, recommendations, and a price
of the good or service. (Löytänä & Kortesuo 2011.)
User experience binds the customer to the brand and successful user experience creates
loyal customers. The communication after the sales should also considered as a part of
the user experience. If the customer is forgotten after the sales transaction, it is certain
that it affects the customer experience. On the other hand, after sales communication is a
good chance to additional and cross-sales. (Gerdt & Korkiakoski 2016. 132-134.) The post
sales communication is also important part of user experience if the purchased product or
service hasn’t fulfilled the promised. Helpful and understanding communication with
complaining customer can turn negative feelings of faulty product or unsuccessful service
into a positive and memorable experience with the brand.
Car sales is a good example of how the successful user experience affects in customer
experience. A customer who hasn’t’ had any big issues with the vehicle and is happy
about the driving experience is more likely to be loyal for the brand. A customer who’s
constantly suffering about type faults and minor discomforts during the driving experience
will probably not consider the same brand’s car as an option when buying a new one.

18
3.5 Measuring customer experience
As stated before customer experience is mostly a feeling and it can’t be measured directly
by using service or product meters. Even though it is possible to measure by assessing
customer’s experiences and gaging the effects of the customer experience management.
Customers are willing to give feedback and they should be able to do that easily. To gain
the biggest benefit of measuring the customer experience, the company should be willing
to use the feedback to develop their business. Customer feedback and customer
experience measurements are not useful by themselves and they need market
understanding and tracking of customer’s activities to construct a wider range of frame of
reference. (Löytänä & Kortesuo 2011. Gerdt & Korkiakoski 2016. p. 157-159)
Measuring customer experiences can be divided into passive and active measuring.
Passive measurements are defined as spontaneous feedback and feedback forms,
reclamations, social media feedback, and analysing customer service phone calls and e-
mails. Active ways are customer satisfaction surveys, panel discussions for customers,
biometrical measurements, mystery shopping surveys, and constant feedback inquiries in
different touchpoints. (Löytänä & Kortesuo 2011.)
Gerdt and Korkiakoski (2016 p. 164-166) see other way to divide the customer experience
into categories. Their model includes three categories which should be measured and
defined, these are activity indicators, experience indicators and performance indicators.
These indicators are defined by company and can be tied to factors in which company is
interested to. The aim is to survey how these categories influence on business
performance. Performance indicators can be tied for example to customer’s net worth or
willing to recommend the company. Experience indicators should be tied to themes of
customer experience which are defined as efficiency, ease, or feelings by Gerdt and
Korkiakoski. Third level is dedicated to activity indicators which can be tied measurements
like waiting time or number of visits in store. Gerdt’s and Korkiakoski’s model of
measuring customer experience is trying to find a way to develop each stage towards
customer oriented direction and strengthen efficiency, ease, and feelings in customer
experience. If company can enhance these themes around the customer experience, it
should have direct effect to the company’s business performance.
Universally the most used survey method to measure customer experience is Net
Promoter Score (NPS) created by Fred Reichheld and the Bain Company. It measures
customer’s willingness to recommend the brand and their products or services to a friend
or a colleague. NPS uses scale from 0 to 10 and respondents are categorized as

19
promoters (score 9-10), passives (score 7-8), and detractors (0-6). NPS is calculated by
deducting the percentage of the detractors from the promoters. (Satmetrix Systems 2016.)
Net Promoter Score is a straightforward way to measure customer satisfaction while
unhappy customer clearly wouldn’t recommend the brand to anybody. It also offers a
possibility to compare the brand’s result to the competitors. (Questback 2016. Gerdt &
Korkiakoski 2016 p. 166-167)
While previous surveying tools focus on customer’s perception of customer experience
the return of investment, ROI, on customer experience focus on management of customer
experience. Possible measurements for ROI of customer experience are amount of
average purchase, value of customer churn, number of customers, re-purchase
percentage, growth of additional and cross sales, lead-time, given discounts, number of
prospects, number of customers who abandon their shopping cart, sales hit rate, the
brand’s share of customer’s wallet, customer-specific and product-specific viability,
number of returned customers, costs of marketing per lead, costs of new customer
acquisition, and number of promoters. (Löytänä & Kortesuo 2011. Questback 2016.)
To gain applicable data through measuring customer experience, it is important to assess
who are the right people to answer, what should ask, when should ask, and which channel
is the right one? For example, in B2C markets all customers are valid to answer but in
B2B setting the selection of respondents is essential. (Gerdt & Korkiakoski 2016. p.161-
162)

20
4 The impact of brand image on customer experience
Impacts of brand image on customer experience is not widely studied subject and in this
chapter the writer is forming his own framework for the subject using the earlier described
theory and existing viewpoints on the matter.
4.1 Impact of customer experience on brand equity
Even though brand equity and brand image are different concepts of branding these two
elements can be applied together while studying impacts of brand image on customer
experience. While brand equity is comprehensive and long-term process in brand building
and is more of an organizational view on brand, the brand image is an instant response
from customer on how they view the brand. In this light, it is more expedient to review
impacts of customer experience on brand equity than impact of brand equity on customer
experience.
Galina Biedenbach and Agneta Marell review the subject in their study “The impact of
customer experience on brand equity in a business-to-business services setting”
published in Journal of Brand Management in 2010. According to the study customer
experience has a clear positive effect on brand equity on four dimensions, which are
brand awareness, brand associations, perceived quality, and brand loyalty. The study
showed that customer experience has the biggest influence on brand associations and
smallest influence on brand awareness. The study also confirmed the intercorrelation
between these four dimensions but the significance was variable. According to
Biedenbach and Marell, the correlation between customer experience and brand equity is
applicable in B2C and B2B markets. (Biedenbach & Marell 2010.)
4.2 Integration of brand and customer experience
When contemplating customer experience and brand image, both concepts consists of
similar elements. Because of that the relationship between the customer experience and
the brand they should be implemented in company’s strategy on top of each other and
shouldn’t be seen as independent parts of company’s business strategy. (Gerdt &
Korkiakoski 2016. p. 71-78.)
The integration of brand and customer experience is an essential part of successful
customer experience. “TRUE brand compass framework”, created by American marketing
research company Forrester, is helpful in this integration. (Gerdt & Korkiakoski 2016. p.
78-80) The framework created by Forrester employees Tracy Stokes, Chelsea Hammond,

21
and Roxana Strohmenger consists of four different dimensions in brand resonance which
is the highest level in Kevin Lane Keller’s customer-based brand equity pyramid.
(Strohmenger 2013. Keller 2012.) These dimensions described in TRUE framework are
trusted, remarkable, unmistakable, and essential. (Image 7.)
Image 7. (Strohmenger 2013.)
Trusted status for customer experience and brand comes from transparent and
accountable multi-channelling communications between customer, aligned brand promise
with customer encounters and brand promise transmitting products and services.
Remarkable stands for differentiation in customer encounters and brand communications
so that they would not settle in industry’s standards. These encounters should aim in
exceeding customer’s expectations. Unmistakable is recognizable encounter and as a
part of the company’s brand which should also be included in company’s brand promise.
Essential in turn means that a goal of a brand and the customer experience should be
accomplishing an irreplaceable status in consumer’s lives by fulfilling their needs while
creating added value through experiences. (Gerdt & Korkiakoski 2016, Strohmenger
2013.)
The relationship between brand strategy and customer experience strategy should be
organized as a chain in which brand strategy is followed by customer experience strategy
and customer encounters. These actions should constantly be assessed so that customer
experience and customer encounters truly redeem the brand promise (Image 8.). The
brand and the customer experience should create a coherent groundwork for execution of
marketing, sales, and customer service. (Gerdt & Korkiakoski 2016 p. 82-84.)

22
Image 8. Relationship of brand and customer experience (Gerdt & Korkiakoski 2016.)
4.3 Theoretical framework of impact of brand image on customer experience
This paragraph includes applications of theories viewed in previous chapters and
assumptions and viewpoints of the writer of this thesis. In Image 9. is shown the writer’s
viewpoint on the relationship and dependence of brand image and customer experience.
Image 9. Framework for applying brand image to customer experience
When the customer experience is viewed as a result of image experience, shopping
experience and user experience (Questback 2016), it should be considered how the
customer’s perceived brand image affects this mechanism. As stated before, brand image
is a result of engagements between customer and the brand. The customer perceives

23
their own reflection of the brand and the reflection is affected by inner motivations and
external influences. (Grönroos 2015. p.342, Borja De Mozota 2003. p.98) Brand image is
thereby fully comparable with image experience.
Brand image consists of visual elements which are communicated not only through the
marketing channels but also in store environment. These visual elements of the brand are
affected to the shopping experience and atmosphere created for customer during the
shopping process. Atmosphere is an important factor of the customer experience because
the emotions linked to it. When brand image is visually pleasant for customer, the visit at
store, online or physical, is felt more enjoyable and customer is more likely to affiliate
positive feelings to the visit. Likewise, if visual elements of the brand image are not
preferred by the customer, the shopping experience is not felt amusing or enjoyable.
The brand image affects user experience through perceived benefits and brand elements.
The brand which consists of the elements which are more favourable for the customer is
expected also to feel more beneficial and satisfactory in use. On the other hand, if the
brand affiliations are not fulfilled in user experience, the perceived brand image has
negative effects on the customer experience.
Added value in customer experience can form from utilitarian and hedonistic sources.
(Löytänä & Kortesuo 2011.) Brand image can be equated as hedonistic source of added
value through customer’s attitudes and feelings towards the brand. For example,
customers might use brands to identify themselves as part of a social group or social
class. This automatically adds value to the customer experience through positive brand
image.
From the perspective of brand image, the affiliations and brand elements are the
measurements which define the expectations of the customer. If a brand image is strongly
favourable for the customer and customer has previous positive engagements with the
brand, the expectations exceeding customer experience will become harder to achieve.
Expectations of the customer will rise also constantly. If customer has negative brand
image and attributes which customer affiliates with the brand are not favourable ones, the
customer’s prejudices could produce negative customer experience even if there has not
been anything wrong with it. It is also noteworthy that customers who have a neutral brand
image are easier to surprise positively and exceed their expectations. Same applies to
some customers who have a negative perception of the brand.

24
Positive brand image naturally creates positive perception of the engagements with the
brand. Even if there have been some fractures in the shopping or user experience,
positive brand image helps to recover from the small faults and irregularities in the
customer experience and the overall impression is seen positive. But if the brand image is
negative or neutral, unsuccessful shopping or user experience is seen as a failure of the
brand.
The graph in Image 9. applies the study of Biedenbach and Marell which showed the
correlation between the customer experience and brand equity. The aim of the graph is to
visualize the effects of brand image to customer experience and the customer
experience’s effects to brand equity. It could be argued that the brand image should be a
part of the brand equity in Biedenbach’s and Marell’s chart as the brand image priors the
brand equity in generally accepted branding theories. Brand awareness and brand
associations can also be viewed as part of the brand image so it can be argued that brand
awareness and brand associations have effect on the customer experience too as on
contrary.

25
5 Conducting the study
The aim of the study was to find out how different research groups see Company X as a
brand, how they rate customer experience with Company X and how the brand image
affects the customer experience. Simultaneously, the study focused on how different
research groups’ images of Company X as a brand vary from each other, how physical
store environment affects customer experience comparing a brand store and retailer, and
how the customer experiences and brand image differ between those who own Company
X’s products and those who don’t. In Company X’s point of view aim of this study was to
gain insight of their current customers and possible future customers who Company X has
yet to reach with their marketing.
The research groups used in the study were Company X’s newsletter subscribers who
represented the brand loyalists and second and third year students of Haaga-Helia
University of Applied Sciences who represented the millennials. The millennials are
considered as potential future customer segment by Company X.
The study was conducted as a quantitative correlation research because it was the most
reliable way to respond to the research problem. The theory framework and needs of the
client were used as a guideline for the survey form. The most relevant questions for
Company X were disclosed in an interview with the company’s marketing department and
then included in the survey. The survey was built in Webropol online platform and it was
sent for the respondents during the April 2017. The form included structured questions
and a few open questions.
The survey form was mostly built on theory frameworks used in the thesis. The first
questions were aimed to define background variables of the respondents which were
aimed to be used to refine results of the study among different age group or gender. The
gender variable wasn’t used in the findings of the research due the small number of male
respondents. Due the low dispersion with geographic location of the respondents this
background variable wasn’t used in the review of the findings.
The question about the purchase decisions aimed to provide information for Company X
about the purchase behaviour of the respondents. In addition, the aim was to define how
brand premium, the relevance of the brand, visible and invisible brand elements, brand
values, and user experience affect in purchase behaviour. Question matrix about factors
affecting purchase behaviour also reflected Kapferer’s brand identity prism and included
brand identity elements which are valuable for Company X. The questions about the

26
ownership and willingness to own pre-listed brands were designed to measure Company
X’s brand favourability and the competition setup with the company’s competitors.
Question measuring the top of mind status was designed exclusively for students because
Company X’s newsletter subscribers got the study form directly from Company X so the
question would have been invalid.
The questions about physical shopping experience of Company X’s brand store and
retailer’s store based on theories about the shopping experience and exceeding the
expectations which is important part of memorable customer experience. The follow up
questions about the physical shopping experience were all different applications of Net
Promoter Score to define if the respondents are willing to recommend Company X
onwards. The questions about the customer’s satisfaction regarding to Company X’s
products and post sales communications were based on theory about user experience as
a part of customer journey and fulfilling the expectations of the customer.
The question matrix of Company X’s brand image was based on Balabanis’ theories about
measuring brand image by assessing the strength of brand associations. Adjectives used
in the matrix were picked from Company X’s marketing materials and they were aimed to
define attributes which consumer attach to the brand, benefits of using the brand and
attitudes towards the brand. The final question about the latest experience with Company
X’s product, store or brand was reflecting the overall customer experience and customer
journey. The respondent was also able to define with their own words which factors
affected the experience.
The main research problem how brand image affects to the customer experience. Before
it was possible to answer that question, it was essential to define from what Company X’s
customer experience consists and how Company X’s brand image is viewed. The
question 28. defines Company X’s customer experience in overall and 24. reveals how
Company X’s brand image is reflected by respondents. Correlation of these two questions
answers the main research problem.
The first secondary research problem how the image of Company X differs between
different research groups is answered by comparing results of question 24. between
research groups and background variables. The second secondary research problem how
the physical store-environment affects customer experience is answered in questions 12.
and 28 and the results of Company X’s brand store and retailer’s store were compared
with each other. The third secondary research problem how the image of Company X
varies between consumers who have purchased Company X’s products and non-

27
purchasers was defined by questions 15. and 24. and comparing the results of question
24. among the respondents who had purchased Company X products and those who
hadn’t.
The survey was sent via e-mail to 5 936 recipients and it was completed anonymously but
it included a possibility to attend to a draw with personal details.
5.1 The findings of the research
In this chapter, the findings of the survey are reviewed in whole and from both research
groups’ point of view. The answers of the study were analysed statistically with Webropol
survey tool, Microsoft Office Excel, and IBM SPSS Statistics. The used statistical methods
to analyse the results were statistical dispersion, calculation of average, cross tabulation,
and correlation coefficient.
5.1.1 Company X’s newsletter subscribers
This part of the thesis includes confidential information and therefore parts of the results
are not disclosed.
The survey was sent to 5 059 Company X’s newsletter subscribers and total of 909
respondents answered to the survey. Company X’s respondents represented brand
loyalists who have proactive relationship with the brand and who want to be in touch with
Company X.
The questions from 9. to 15. treated Company X’s flagship store and physical customer
experience. The respondents who had visited the store used adjectives stylish, bright,
beautiful, spacious, and cosy among the others to describe the store.

28
Chart 5. Expectations of the customers before visiting in Company X’s store and realized
customer experience
Question 12. and 13. aimed to find out customer’s expectations before the visit in the
flagship store and how Company X managed to fulfil these expectations. The questions
12. And 13. were asked after the respondents had visited in the flagship store and the
respondents were asked to memorize what kind of expectations they had before the visit
and how they were fulfilled. Before visiting the store, the respondents (n=558) valued the
most presentation of the products, customer service, and location and selection of the
store. Rest of the factors were little bit important for the respondents.
When reviewing the realized customer experience, it is seen that the respondents felt that
Company X was able to provide a good overall customer experience. The respondents’
expectations were exceeded in location of the store and in the opening times of the store.
The findings (Appendix 1.) show that there is strong correlation between the respondents’
expectations before the visit in Company X store and the realized experience. The
respondents who had high expectations for the listed attributes in chart above, also felt
that their experiences were good. The Pearson’s correlation coefficient and p-value show
that factors enumerated in Appendix 1. have strong dependence towards each other. The
1,00
1,50
2,00
2,50
3,00
3,50
4,00
4,50
5,00
Findabilty of the products
Presentation of the products
Customer service
Location of the store
Opening times of the store
Attractiveness of the selection
Delivery of the products
Expectations before the visit1 Not at all important - 5 Very important
Realized customer experience1 Not satisfied at all - 5 Very satisfied

29
expectations which had the most correlation to the realized experiences were
attractiveness of the selection and delivery of the products. The respondents who valued
most of these factors felt that their customer experience was better in general.
Question 17. measured respondents’ willingness to recommend a visit in Company X
flagship store for a friend. An applied scale of Net Promoter Score was used in this
question so that answers 1 to 3 were listed as Detractors, number 4 was listed as
Passives and answer number 5 were Promoters. Normally Net Promoter Score is
measured with scale from 0 or 1 to 10 but to keep the survey form unified a smaller scale
was applied to it. As the chart 8. shows, 61% of the respondents (n=661) are willing to
recommend a visit in Company X store for a friend and are counted as net promoters of
Company X’s flagship store.
Chart 9. Expectations before the visit in retailer’s store and realized customer experience
In questions 21. and 22. the respondents who had purchased their latest Company X
product from retailer’s store or online store were asked identical question matrix as in
questions 12. and 13. to find out if the expectations and realized experience in retailer’s
store differs from experiences in Company X’s store. Chart 9. shows that the respondents
(160) had similar expectations before the visit in retailers’ store as they had before visit in
Company X’s. The respondents had highest expectations for customer service,
attractiveness of the selection, and delivery of the products before the visit. Comparing to
results in question 12. the respondents felt that opening times, and delivery of the
products were more important in case of retailer’s store. When considering the realized
1
1,5
2
2,5
3
3,5
4
4,5
5
Findability of the products
Presentation of the
products
Customer service
Location of the store
Opening times of the
store
Attractiveness of the
selection
Delivery of the products
Expectations Realized

30
experience, the respondents (n=187) were generally satisfied with the retailers realized
customer experience and their expectations were exceeded in location of the store and
opening times of the store. When comparing to results of realized customer experience,
visitors in Company X’s store gave higher average grade for findability of the products,
presentation of the products, customer service, location of the store, and attractiveness of
the selection. Retailer’s store scored instead a higher average on opening times of the
store and delivery of the products.
Chart 11. The associations affiliated with Company X’s brand in average
In question 26. the respondents were asked to evaluate the associations of Company X
as brand. The used scale was semantic differential scale in which the respondents
(n=909) assessed whether he or she agrees or not with the given adjectives. Most of the
chosen adjectives were the associations which Company X defines as a part of their
brand essence in their marketing material. The chosen adjectives were aimed also to be
generally positive. As the chart 11. shows the respondents agree with most of the given
adjectives and the strongest association are traditional, durable, familiar, aesthetic, and
attractive which respondents attach to Company X’s brand. The largest dispersion within
the responses were in adjective ordinary and on average the respondents didn’t agree or
disagree with the adjective. Only adjective that the respondents slightly disagreed with
was inexpensive. To sum up the results, the associations affiliated with Company X’s
brand were generally positive.
1
1,5
2
2,5
3
3,5
4
4,5
5
1 N
ot a
gree
at a
ll -5
Tot
ally
agr
ee

31
Chart 12. How Company X’s customer experience responded on the expectations
Questions 30. and 31. were aimed to sum up the respondents’ last experience with
Company X. In question 30. the respondents were asked from how their last experience
with Company X’s product, store or a brand responded to their expectations. The used
scale was 1 to 5, with 1 being Did not meet my expectations at all and 5 being Notably
exceeded my expectations. The respondents (n=899) felt that Company X had slightly
exceeded their expectations on average. In question 31. the respondents (612) were
asked to define which factors affected the most on their experience with Company X. The
most common answers among the respondents were received customer service and
quality of Company X’s products.
5.1.2 Students
This part of the thesis includes confidential information and therefore parts of it are not
disclosed.
Due the small amount of responses it is not valid to draw any broad conclusions about
Company X’s customer experience and brand image in this research group. All the
findings in this paragraph should be viewed directly and only the most relevant findings
are taken into consideration. Only the questions with decent amount of responses have
been viewed next. Neither the background variables weren’t included in analysation of the
results due the small variation.
The survey was sent to total of 877 students in Haaga-Helia University of Applied
Sciences from which 89 respondents answered to the survey the answering percent being
10,14 %. The gender distribution among the respondents (n=89) were 83,2 % (74) female
0%
10%
20%
30%
40%
50%
60%
70%
80%
1 2 3 4 5

32
and 16,8 % (15) male. Age of the respondents (n=89) were divided as follows, 1,1 % (1) of
the respondents were aged under 20, 67,4 % (60) were aged between 20 and 29, 19,1 %
(17) were aged between 30 and 39, 9,0 % (8) were aged between 40 and 49, 3,4 % (3)
were aged between 50 and 59. It is also notable that these results do not fully represent
the views of millennials as there were respondents who were over 40-year-old.
Chart 15. The associations affiliated with Company X’s brand
The question 27. was determined to define Company X’s brand image and the
respondents’ (n=88) perception of attributes is shown above. The findings show that the
respondent agree slightly on every adjective except on inexpensive. The strongest
perceptions of Company X were traditional, durable, and domestic.
The question 31. measured the realised customer experience reflected on expectations
the respondents (n=75) had before the last experience with Company X’s product, store,
or brand. The chart 23. shows that Company X’s experience didn’t exceed or elude the
expectations. It could be presumed that the respondents who didn’t have experiences with
Company X chose the answering option 3 which was the most neutral. When the
respondents were asked what individual factors affect to their customer experience the
responses were the received customer service and the quality of the products.
1
1,5
2
2,5
3
3,5
4
4,5
5

33
5.2 Summary of the findings
This part of the thesis includes confidential information and therefore parts of it are not
disclosed.
In research group one the respondents’ expectations were very high before the visit in
Company X’s flagship store. Despite the elevated expectations, Company X managed to
deliver good overall customer experience during the visit and managed to exceed the
expectations in location of the store and opening times. The high expectations of the
respondents caused Company X to trail a bit in other categories in terms of exceeding the
expectations. Despite that it can be said that Company X’s overall customer experience
was good as average of categories studied in fulfilled experience was 4,36, just between
Quite satisfied (4) and Very satisfied (5) in scale 1 to 5. Most of the respondents who had
visited in Company X’s flagship store were very likely to recommend a visit for a friend
and 61% of them are active promoters according to calculated NPS. This also supports
the results telling that overall customer experience in Company X’s flagship store was
good.
When the correlation between expectations and realized customer experience was
studied, it revealed that the strongest correlation to realized experience in overall had
attractiveness of the selection and delivery of the products (Appendix 1.). The
respondents who had biggest expectation on those factors, were more likely to give better
grade to realized experience.
The respondents who had made their purchases in retailer’s store had similar
expectations before the visit in store than they had before visiting in Company X’s store. In
overall, the respondents had higher expectations before the visit in Company X’s store but
in some categories, such as findability of the products, opening times of the store and
delivery of the products, the respondents had higher expectations on retailer. When
reviewing the success of retailer in fulfilling the expectations of the customer it was seen
that overall customer experience was good average score being 4,30. When comparing
this score to Company X’s store’s score it can be seen that retailers’ experience trailed
only a just. The biggest differences between in realized experience were presentation of
the products, customer service, location of the store, and attractiveness of the selection
which were better in Company X’s store. Retailers instead managed to deliver better
experience in findability of the products, opening times of the store, and delivery of the
products. The difference for the retailers in findability of the products could be explained
by the size of the store spaces and multi brand selection, where varied brands are

34
categorized as independent departments in retailers’ stores. The opening times are
arguably better with the retailers’ than Company X so the difference in the results in that
category is understandable. The delivery of the products could be explained by the size
and location of the stocks of the large department store and retailer chain comparing to
independent brand store which warehouse is located outside of the capital area.
Company X’s brand image is generally positive among their newsletter subscribers and
the respondents agreed in most of the adjectives which Company X wants to attach to
itself. Only adjective which the respondents didn’t agree with was inexpensive which could
be explained by changed perception of prices in the product category which Company X’s
product represent through low-cost brands appearing in the markets. Adjective ordinary
also divided the respondents’ answers and it had the biggest dispersion, so in the average
the respondents didn’t agree or disagree with it.
The students’ answers showed that they have similar perception of Company X as a
brand but they don’t agree with the adjectives as strongly as the brand loyalists. However,
they don’t see Company X as ecological brand like the loyal customers’ see.
Company X’s overall customer experience among the newsletter subscribers were good
and had exceeded the expectations by little. The most of the respondents’ parallel
customer experience to received customer service or quality of the products. The
student’s answers showed that they are more critical about the customer experience and
it didn’t exceed or elude their expectations.
The correlation coefficient (Appendix 2.) between brand image and the last experience
with Company X show that the respondents who had had positive experiences with
Company X had also strong perception of Company X’s brand. This supports the
hypothesis stated in chapter 5. that the customers who have strong positive image and
perception of the brand are more likely to have expectations fulfilling or exceeding
experience with the brand. It is also noteworthy that the respondents who had
expectations exceeding experience with Company X didn’t agree with the proposition of
Company X being ordinary brand and while the correlation is negative it is thus
transferrable as positive perception.

35
6 Conclusions
This part of the thesis includes confidential information and therefore parts of it are not
disclosed.
6.1 Reliability and validity
The reliability of this study was confirmed by using measurements which gave consistent
answers and guided the results towards the wanted outcome. The reliability was
confirmed by documenting each step of the study so that it can be repeated. Company X
can repeat the survey for example after a year, and evaluate if there has been a change in
the behaviour and attitudes of their customers.
The validity of the study was confirmed by documenting each process of the study, and
making sure that all the material was carefully analysed and up to date. All the methods
and solutions used in this study were attempted to justify as well as possible. Also, the
validity of the study was confirmed by sending the survey for as many control group
members as possible. In control group 1. total of 905 respondents answered to study and
the answering percentage was 17,89 %. This amount of answers was large enough to
state that the results are generalizable for the control group. On the other hand, out of the
control group 2. total of 89 respondents answered the study and the answering
percentage was 10,14 %. This amount of answers was not large enough to give any
reliable results and these answers are to be hold only indicative. The answers were
analyzed and documented carefully and their validity was confirmed multiple times. The
researcher tried to be as objective as possible while analyzing the results, although
Company X was meaningful brand for him.
The validity of the study was made sure of by making a precise plan to conduct the thesis.
In the planning phase the research methods, research problems, and contents of the
theoretical part were chosen and these were used as a baseline for the research form.
The research form was tested beforehand by multiple persons who were part of the
research groups, Company X loyalists and millennials, but they weren’t included in the
actual research. The research form was clear and interpretable which affirms the validity
of the study. The survey was sent for research group 1. by Company X and all the
recipients were Company X’s newsletter subscribers, but this was not separately
confirmed because the link for the survey wasn’t available for anybody else. The research
group 2. were 18 to 30-year-old students of Haaga-Helia Uni. of Applied Sciences and
belonging to the right age group was confirmed in background questions. Although there
were respondents older than 30 years old in research group 2. it wasn’t significant

36
regarding the results because the results of the research group 2. were irrelevant and only
indicative.
The research problems were answered through theoretical framework and the survey.
The objective of the research was accomplished. It can be stated that the research is
valid.
6.2 Self-assessment of the learning
I started to work with the thesis in June 2016. After discussing the possible subjects and
defining the topic with my supervisor and the client, I started to make the thesis plan which
worked as a guideline for the theoretical framework. After setting up the baseline for the
theoretical framework, I started to work with the survey form with the help of the
theoretical framework. The survey form was conducted in Webropol and the pre-testing
was completed in January 2016. The actual survey form was sent to research group 1. on
31st of March 2017 and it was set to be closed on 9th of April 2017. The survey form for
research group 2. was sent on 10th of April 2017 and it was set to be closed on 3rd of May
2017. After that I started to analyze the results and refine the theoretical framework.
Finishing the thesis took much longer than I thought and my original execution plan was
too ambitious, yet I’m still satisfied with the process and the way it progressed.
The thesis process was also a great way to combine the theoretical part of brands to the
practical business. I widened my understanding of brand concept and customer
experience management, which I believe are useful in the future. I also noticed that
theories don’t always seamlessly apply to practice and I learned to review different brand
theories critically. In addition, I learned to use IBM SPSS statistics software to analyze
research material and draw conclusions of it as an ensemble and as a proportion. I feel
that I was successful of being objective and didn’t let my personal feelings towards
Company X to affect in analyzing of the results or the conclusions.

37
References
Aaker, D. 2014. Aaker On Branding: 20 principles that drive success. Morgan James Pub.
New York.
Aaker, D. 2010. Building Strong Brands. Pocket Books/Simon & Schuster. London.
Balabanis, G. 2009. How to Measure Brand Awareness, Brand Image, Brand Equity and
Brand Value URL: http://www.balabanis.com/marketresearch/brand.pdf. Accessed: 10
July 2016
Biedenbach, G. & Marell, A. 2010. Journal of Brand Management Vol 17. The impact of
customer experience on brand equity in a business-to-business services setting.
Macmillan Publishers Ltd.
Borja De Mozota, B. 2003. Design Management: Using Design to Build Brand Value and
Corporate Innovation
Brakus, J., Schmitt, B. & Zarantonello, L. 2009. Journal of Marketing Vol. 79. Brand
Experience: What Is It? How Is It Measured? Does It Affect Loyalty? American Marketing
Association.
Chidley, B. 2014. Brand Experience versus Customer Experience: Twins Separated at
Birth? URL: https://www.linkedin.com/pulse/20140819115606-5291694-brand-experience-
versus-customer-experience-twins-separated-at-birth. Accessed: 15 July 2016
Forbes 2009. The Elements of a Great Shopping Experience. URL:
http://www.forbes.com/2009/07/13/retail-customer-service-entrepreneurs-sales-marketing-
wharton.html. Accessed: 19.1.2017.
Gerdt, B. & Korkiakoski, K. 2016. Ylivoimainen asiakaskokemus. Talentum. Helsinki.
Grönroos, C. 2015. Service Management and Marketing: Managing the Service Profit
Logic. John Wiley & Sons. Chichester.
Kapferer, J-N. 2008. New strategic brand management: creating and sustaining brand
equity long term. Kogan Page. London

38
Keller, K., Apéria, T. & Georgson, M. 2012. Strategic Brand Management: a European
Perspective. Financial Times/Prentice Hall cop. Harlow.
Kim, L. 2015. INC.com. URL: http://www.inc.com/larry-kim/22-inspiring-billionaire-quotes-
about-successful-personal-branding.html. Accessed: 10 July 2016
Lindberg-Repo, K., Mehra, E., Gupta, N., Dube, A. & Kaul, V. 2009. Titans of Branding.
Gummerus. Helsinki.
Löytänä, J. & Kortesuo, K. 2011. Asiakaskokemus, palvelubisneksestä
kokemusbisnekseen. Talentum. Helsinki.
Machleit, K. & Eroglu, S. 2000. Describing and Measuring Emotional
Response to Shopping Experience. Journal of Business Research 49. Elsevier Science
Inc. New York.
Pankoke, M. 2016. Advertising Age. Three Stereotypes to Avoid when Marketing to
Millennials URL: http://adage.com/article/digitalnext/stereotypes-avoid-marketing-
millennials/305872/. Accessed: 3.12.2016.
Questback. 2016. Asiakaskokemuksen mittaamisen ABC – Opas liiketoiminnan päättäjille.
Satmerix Systems Inc. 2016. What Is Net Promoter?. URL:
https://www.netpromoter.com/know/. Accessed: 24.1.2017.
Shaw, C. Dibeehi, Q., Walden Steven. 2010. Customer experience: future trends and
insights. Palgrave Macmillan. United Kingdom.
Strohmenger Roxana. 2013. Blog. Calculating Brand Resonance: Introducing Forrester’s
TRUE Brand Compass Framework. URL:
http://blogs.forrester.com/roxana_strohmenger/13-07-15-
calculating_brand_resonance_introducing_forresters_true_brand_compass_framework.
Accessed: 19 August 2016
Tenhunen Marika. Questback 2016. Mitä asiakaskokemus todella on - ja miten sitä pitäisi
mitata eri tasoilla?. URL: https://www.questback.com/fi/blog/mita-asiakaskokemus-todella-
on-ja-miten-sita-pitaisi-mitata-eri-tasoilla. Accessed: 17.1.2017.

39
The American Marketing Association. 1995. Dictionary. URL:
https://www.ama.org/resources/Pages/Dictionary. Accessed 14 August 2016.

Appendices
Construct measures Pearson's correlation coefficient p<0,050
Expectations: Findability of the products
Realized: Findability of the products 0,200 0,000 Realized: Location of the store 0,132 0,006 Realized: Opening times of the store 0,231 0,000
Expectations: Presentation of the products
Realized: Customer service 0,106 0,030 Realized: Location of the store 0,108 0,023
Expectations: Customer service
Realized: Customer service 0,119 0,016 Realized: Delivery of the products 0,189 0,002
Expectations: Location of the store
Realized: Location of the store 0,147 0,002 Realized: Opening times of the store 0,128 0,009
Expectations: Opening times of the store
Realized: Findability of the products 0,101 0,009 Realized: Presentation of the products 0,125 0,038 Realized: Opening times of the store 0,203 0,000
Expectations: Attractiveness of the selection
Realized: Customer service 0,098 0,046 Realized: Location of the store 0,121 0,011 Realized: Opening times of the store 0,119 0,016 Realized: Attractiveness of the selection 0,116 0,015
Expectations: Delivery of the products
Realized: Findability of the products 0,123 0,022 Realized: Location of the store 0,174 0,001 Realized: Opening times of the store 0,218 0,000 Realized: Delivery of the products 0,271 0,000
Appendix 1. Supported correlation coefficients of visit in Company X’s store

Construct measures Pearson's correlation coefficient p<0,050
The success of the latest customer experience with Company X’s product, customer service or brand
Brand image: Modern 0,180 0,000 Brand image: Affordable 0,124 0,000 Brand image: Durable 0,22 0,000 Brand image: Familiar 0,083 0,013 Brand image: Ordinary -0,079 0,019 Brand image: Functional 0,189 0,000 Brand image: Aesthetic 0,15 0,000 Brand image: Ecological 0,19 0,000 Brand image: Domestic 0,202 0,000 Brand image: Attractive 0,241 0,000
Appendix 2. Correlation between Company X’s brand image and customer experience