the impact of low oil prices on the gcc economies im… · crude oil: proved reserves (at end 2014)...
TRANSCRIPT
1
Hatim Al-SHANFARI
Aman Union 6th Annual Meeting
7 December 2015
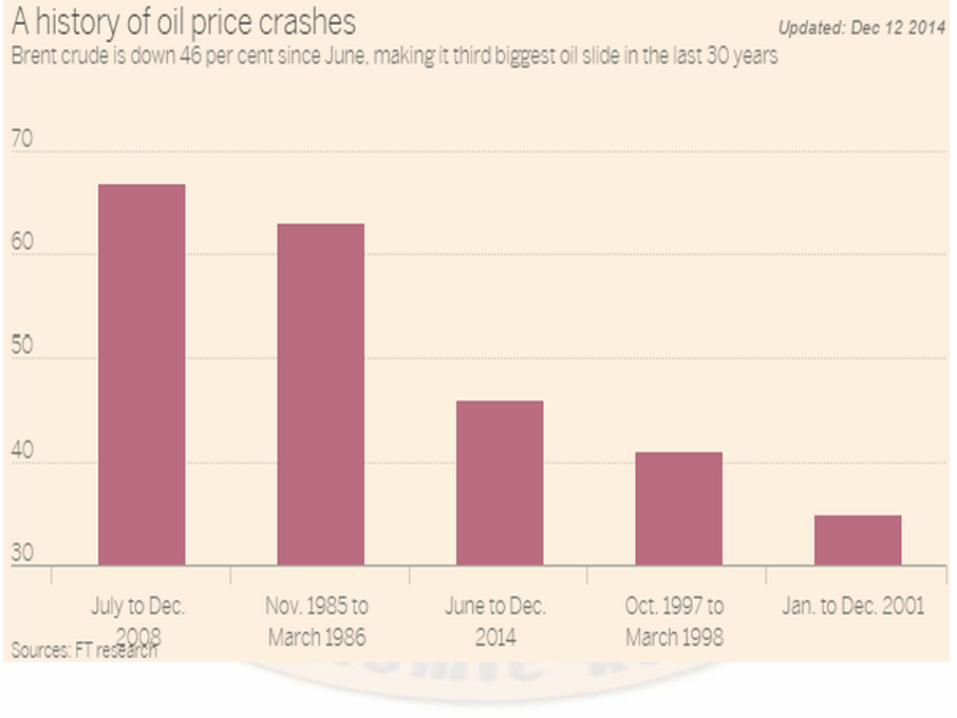
The Impact of Low Oil prices on the
GCC Economies

2
Outline of the Presentation
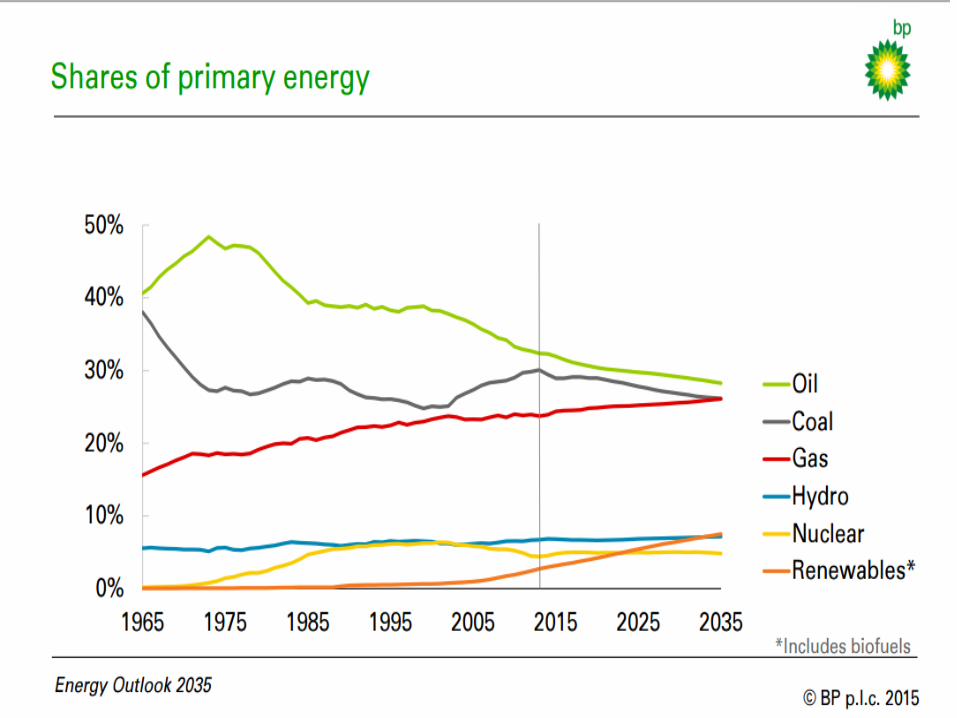
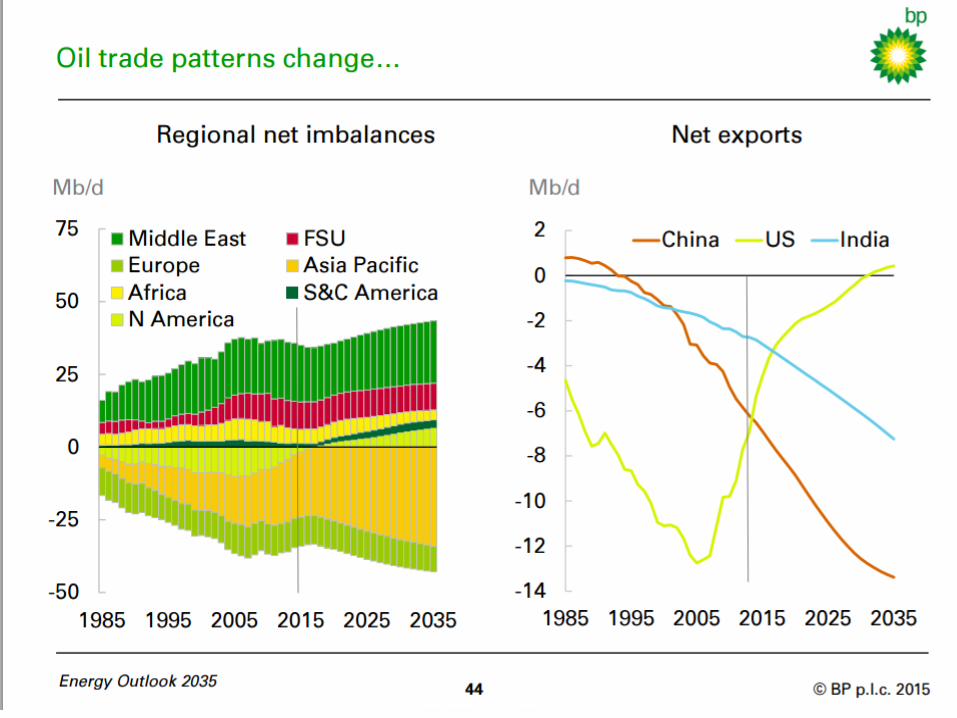
Global Energy Outlook
GCC Economic Outlook
Oman Economic Outlook
Conclusion
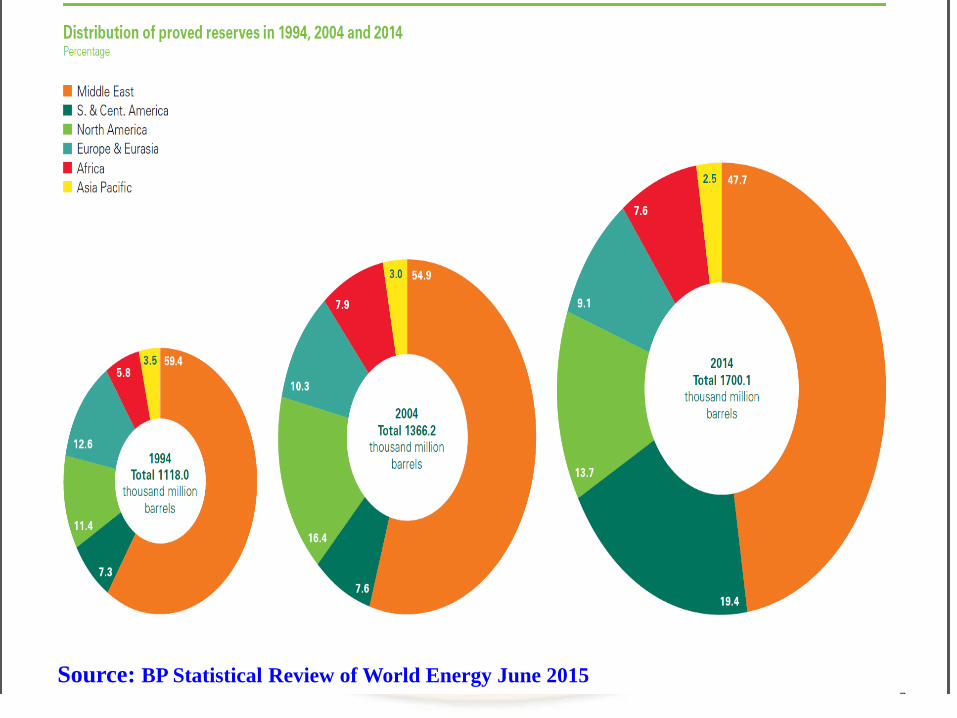
3Source: BP Statistical Review of World Energy June 2015

Crude Oil: Proved Reserves (at end 2014)
Country Share of World Total Reserves/Production ratio
(years)
Venezuela 17.5 % +100
Saudi Arabia 15.7 % 64
Canada 10.2 % +100
Iran 9.3 % +100
Iraq 8.8 % +100
Russia 6.1 % 26
USA 2.9% 11Source: BP Statistical Review of World Energy June 2015

Crude Oil: Proved Reserves (at end 2014)
Country Share of World Total Reserves/Production ratio
(years)
Saudi Arabia 15.7 % 64
Kuwait 6.0 % 89
UAE 5.8 % 72
Qatar 1.5 % 36
Oman 0.3 % 15
Source: BP Statistical Review of World Energy June 2015

6Source: BP Statistical Review of World Energy June 2015

Natural Gas: Proved Reserves (at end 2014)
Country Share of World Total Reserves/Production ratio
(years)
Iran 18.2 % +100
Russia 17.4 % 56
Qatar 13.1 % +100
Turkmenistan 9.3 % +100
US 5.2 % 13
Saudi Arabia 4.4 % 75
UAE 3.3 % +100Source: BP Statistical Review of World Energy June 2015

Natural Gas: Proved Reserves (at end 2014)
Country Share of World Total Reserves/Production ratio
(years)
Qatar 13.1 % +100
Saudi Arabia 4.4 % 75
UAE 3.3 % +100
Kuwait 1.0 % +100
Oman 0.4 % 24
Bahrain 0.1%
11
Source: BP Statistical Review of World Energy June 2015

9
10
11

12
13

14

15
16
GCC Economic Outlook
17

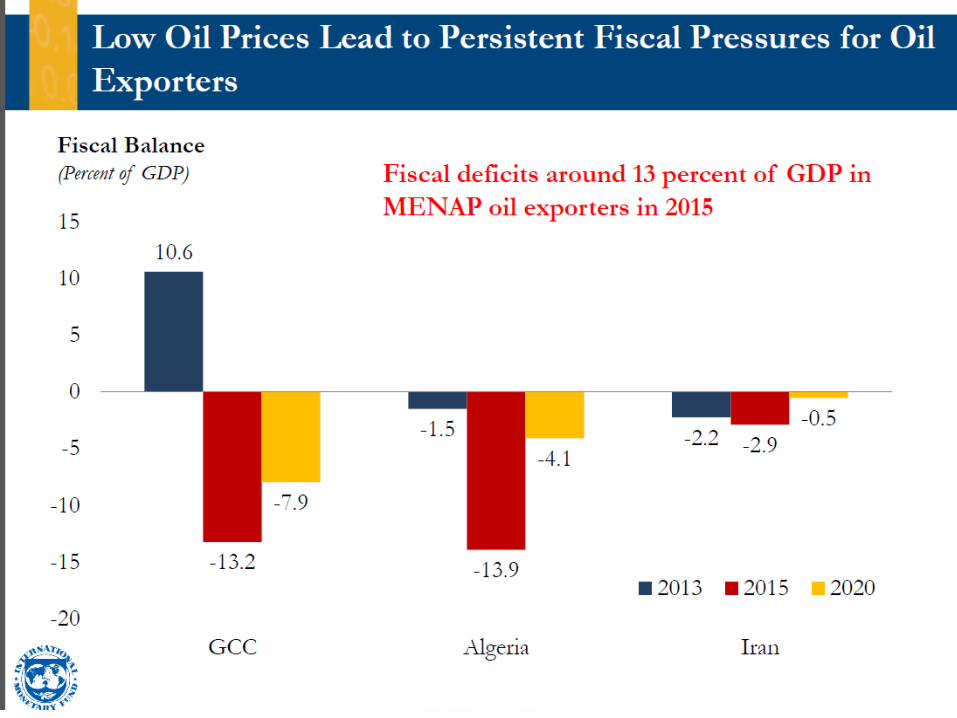
18Source: IMF

19

20
21

22

23

24

25
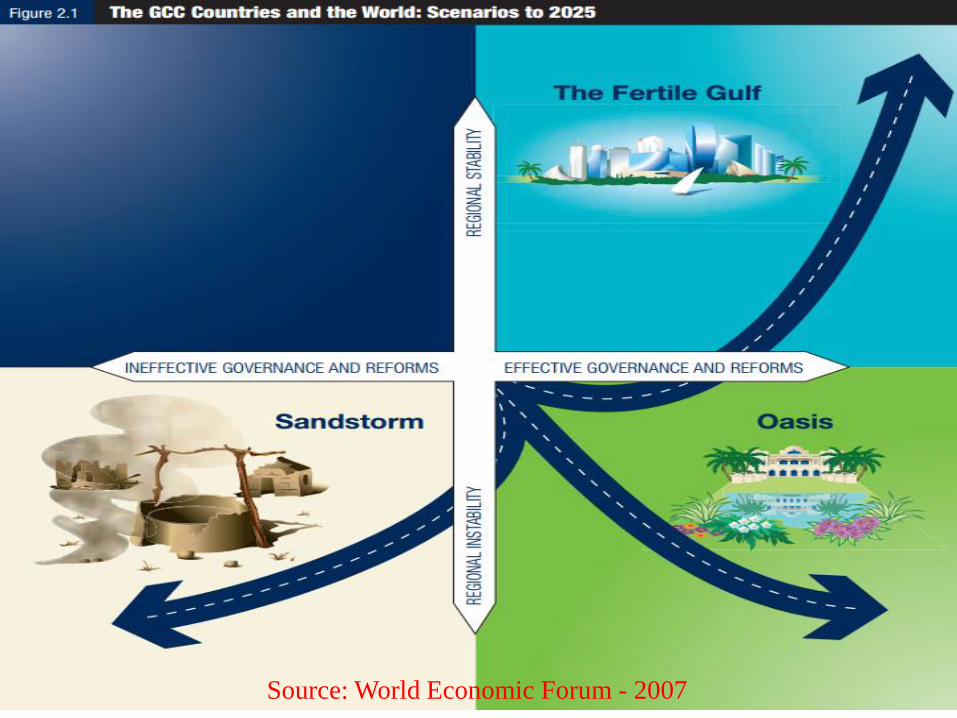
Key Questions for the Scenarios
Q1- Will leaders in the GCC countries be willing
and able to implement the necessary economic
and political reforms and enforce the rule of law,
both in public and private governance?
Q2 – How can the GCC countries maintain
internal order and stability, in particular vis-
a-via a complex and uncertain regional
situation?Source: World Economic Forum - 2007
26Source: World Economic Forum - 2007
Oman Economic Outlook
27
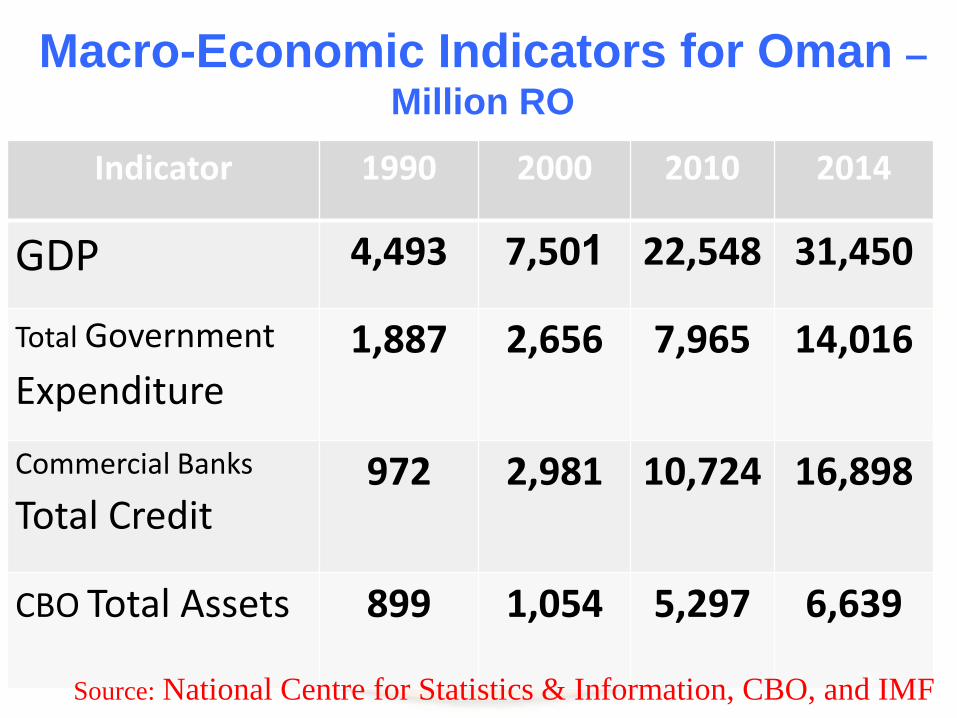
Macro-Economic Indicators for Oman –Million RO
Indicator 1990 2000 2010 2014
GDP 4,493 7,501 22,548 31,450
Total Government
Expenditure1,887 2,656 7,965 14,016
Commercial Banks
Total Credit 972 2,981 10,724 16,898
CBO Total Assets 899 1,054 5,297 6,639
28Source: National Centre for Statistics & Information, CBO, and IMF

Key Variables for Oman
Oil & Gas Sector: production and prices
Population Trend
Regional Opportunities
29

Oman: Proved Reserves (at end 2014)
Share of World Total Reserves/Production ratio
(years)
Crude Oil 0.3 % 15
Natural Gas 0.4 % 24
Source: BP Statistical Review of World Energy June 2015

Total Omani Population- Million
31
Year Size
2015 2.3
2020 2.6
2030 3.2
2040 3.8

Regional Opportunities for Oman

Regional Opportunities – Population (million)
Country 2015 2005
India 1,303 1,134
Pakistan 191 158
Iran 79 69
Kenya 46 36
Tanzania 49 39
Ethiopia 101 79
Total 1.8 Billion 1.5 Billion
Source: United National Development Program [UNDP] – Human Development Reports

34

The Fertile Oman
Higher oil and Gas prices and production
Oil Price around $ 100 /BBL
Oil Production around one Million BBL
High diversity of the Economy
Low unemployment
Knowledge Economy
Higher Regional Opportunities
35

Oasis
Current Oil and Gas prices and production
Oil Price around $ 60 /BBL
Oil Production around one Million BBL
Current level of diversity
Current rate of Unemployment
Current state of Knowledge-based Economy
Moderate Regional Opportunities
36

Sandstorm Low oil and Gas prices and production
Oil Price around $ 20 /BBL
Oil Production around 0.5 Million BBL
Low level of diversity
High unemployment
Less competitiveness
Less Regional Opportunities
37
How can Oman builds on
its current strength, while
overcoming the internal
and external pressures
that could shift it from the
path of sustainable
development?
38
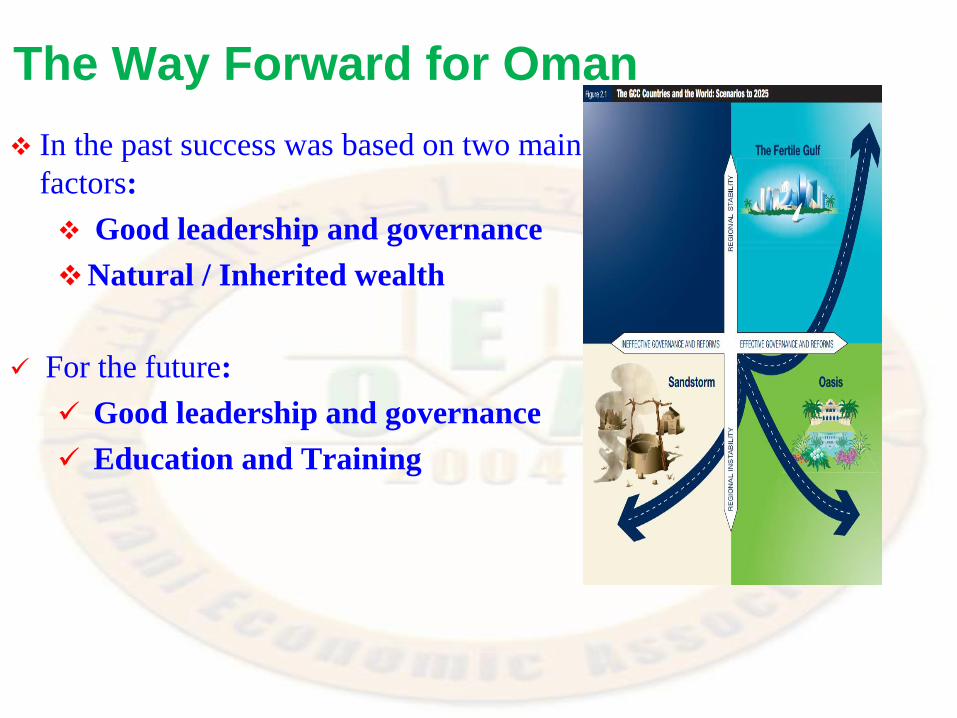
The Way Forward for Oman
In the past success was based on two main
factors:
Good leadership and governance
Natural / Inherited wealth
For the future:
Good leadership and governance
Education and Training
39

The Way Forward for Oman
The future is:
Highly unpredictable
Highly competitive
High expectation of the Youth
More regional opportunities
What we need to have:
More flexibility / adaptive to changes
Less bureaucracy
High quality education and training
More productivity
Smart investment
40

41
Thank you