the impact of mobile banking: a case study of m-pesa in
TRANSCRIPT

THE IMPACT OF MOBILE BANKING: A CASE STUDY OF
M-PESA IN THE KENYAN SOCIETY
BY
GEOFFREY NDERITU MUNGA
D61/70080/2007
A MANAGEMENT RESEARCH PROJECT SUBMITTED IN PARTIAL
FULFILMENT OF THE REQUIREMENTS FOR THE AWARD OF THE
DEGREE OF MASTER OF BUSINESS ADMINISTRATION, SCHOOL OF
BUSINESS, UNIVERSITY OF NAIROBI
OCTOBER 2010
DECLARATION
This project is my original work and has not been submitted for a degree in any other
University.
STUDENT
hnutOC-iK ir i|,Qp!^
NAME SIGNED DATE
SUPERVISOR
^ ^• A / J M / A
NAME SIGNED
/f /Vou. 'ICfO
DATE
ti
ACKNOWLEDGEMENTS
The successful completion of this study would not have been possible without the
assistance and cooperation of my supervisor Dr. Muranga Njihia.
Also special thanks to all the people who took their time to fill my questionnaires.

DEDICATION
To my lovely son Douglas.
To my wife Dorcas whose constant encouragement inspired this work in ways unseen
and
to my mother Anna and all my sisters Diana. Patricia and Elizabeth.
1 love you all tremendously.
IV

TABLE OF CONTENTS
DECLARATION...................................................................................................................ii
ACKNOWLEDGEMENTS............................................................................................... iii
DEDICATION......................................................................................................................iv
TABLE OF CONTENTS.................................................................................................... v
LIST OF TABLES............................................................................................................viii
LIST OF FIGURES............................................................................................................ ix
ABSTRACT.......................................................................................................................... x
CHAPTER ONE................................................................................................................... 1
INTRODUCTION................................................................................................................. 1
1.1 Background.............................................................................................................. 1
1.2 Statement of the Problem..........................................................................................4
1.3 Research Objectives...................................................................................................5
1.4 Significance of the Study............................................................................................. 5
CHAPTER TWO..................................................................................................................7
LITERATURE REVIEW....................................................................................................7
Introduction.........................................................................................................................7
2.1 Mobile Communications.............................................................................................. 7
2.2 Technology Diffusion and Mobile Commerce........................................................ 8
2.3 Social Impacts and Influences of Mobile Commerce.......................................... 10
2.4 Mobile Banking..........................................................................................................13
v

2.4.1 Mobile Banking in South Africa......................................................................... 14
2.4.2 Mobile Banking in Philippines........................................................................... 15
2.5 Traditional Money Transfer Services in Kenya................................................. 17
2.6 Mobile Banking in Kenya.....................................................................................20
2.6.1 Growth of M-Pesa.............................................................................................. 21
2.6.2 Influence of M-Pesa in Kenya............................................................................25
2.7 Legal and Regulatory Issues regarding M-Pesa........................................................ 28
a) Regulatory Issues in Mobile Banking.............................................................. 28
b) Money Handling with M-Pesa...........................................................................29
c) Other Issues........................................................................................................30
CHAPTER THREE............................................................................................................32
RESEARCH METHODOLOGY..................................................................................... 32
3.1 Research Design..........................................................................................................32
3.2 Population...............................................................................................................32
3.3 Sampling.....................................................................................................................32
3.4 Data Collection...........................................................................................................34
CHAPTER FOUR...............................................................................................................36
DATA ANALYSIS, RESULTS AND DISCUSSION.....................................................36
4.1 Introduction................................................................................................................. 36
4.2 Data Analysis.........................................................................................................36
4.3 Results....................................................................................................................37
V!

4.3.1 Number of respondents............................................................................................37
4.3.2 Demographic Characteristics of the respondents...................................................37
4.3.3 Economic Impacts........................................................................................................41
I. Response from M-Pesa Agents.................................................................................42
II. Response from M-Pesa U sers...............................................................................47
4.3.4 Social Impacts..............................................................................................................52
4.3.5 Other Findings.............................................................................................................59
4.3.6 Discussion................................................................................................................... 66
CHAPTER FIVE................................................................................................................69
SUMMARY, CONCLUSION AND RECOMMENDATIONS.....................................69
5.1 Summary.........................................................................................................................69
5.2 Conclusion......................................................................................................................69
5.3 Recommendations...........................................................................................................70
5.4 Recommendations for Further Research........................................................................71
5.5 Limitations of the study..................................................................................................71
REFERENCES....................................................................................................................72
APPENDICES.....................................................................................................................74
M-PESA USERS QUESTIONNAIRE.............................................................................74
M-PESA AGENT’S QUESTIONNAIRE........................................................................80
Vll

LIST OF TABLES
Table 4.1: Gender of the Respondents................................................................................37
Table 4.2: Age of the Respondents.....................................................................................38
Table 4.3: New M-Pesa Customers Registered in a Month.............................................. 43
Table 4.4: Frequency of M-Pesa Money Transfer............................................................. 43
Table 4.5: Period The Most Money Transfers Takes Place...............................................44
Table 4.6: Average Income Earned Per Month.................................................................. 45
Table 4.7: Income Earned by M-Pesa Users...................................................................... 40
Table 4.8: Primary Account Operated................................................................................47
Table 4.9: Frequency of Using M-Pesa............................................................................. 48
Table 4.10: Average Amount of Money Transferred in a Month Before M-Pesa.......... 49
Table 4.11: Average Number of Times Money is Transferred in a Month.......................51
Table 4 .12: M-Pesa Money Destination..............................................................................53
Table 4.13: M-Pesa Usage....................................................................................................54
Table 4.14: Money Transfer Service Used Before M-Pesa................................................55
Table 4.15: Local Money Transfer Service Used Currently...............................................56
Table 4.16: Where Money is Sent To Most Often.............................................................. 57
Table 4.17: From Where Money Is Received Most Often..................................................58
Table 4.18: Reasons for Using M- Pesa...............................................................................60
Table 4.19: Most Common Problems Encountered by the Agents.....................................61
Table 4.20: Most Common Problems Encountered by the Users.......................................63
Table 4.21: Services The Users Want M-Pesa to Introduce...............................................64
VI11

LIST OF FIGURES
Figure 4.1: Gender of the Respondents............................................................................... 38
Figure 4.2: Age of the Respondents..................................................................................... 39
Figure 4.3: Marital Status.....................................................................................................40
Figure 4.4: Number of M-Pesa Customers Served Per Day...............................................42
Figure 4.5: New M-Pesa Customers Registered in A M onth.............................................43
Figure 4.6: Frequency of M-Pesa Money Transfer..............................................................43
Figure 4.7: Period The Most Money Transfers Takes Place...............................................45
Figure 4.8: Average Income Earned Per Month..................................................................46
Figure 4.9: Income Earned By M-Pesa Users...................................................................... 41
Figure 4.10: M-Pesa Users Who Operate Commercial Bank Accounts............................ 45
Figure 4.11: Primary Account Operated.............................................................................. 47
Figure 4.12: Frequency of Using M-Pesa............................................................................ 48
Figure 4.13: Average Amount of Money Transferred in A Month Before M-Pesa........ 50
Figure 4.14: Average Number of Times Money is Transferred in A Month.....................52
Figure 4.15: M-Pesa Money Destination............................................................................. 53
Figure 4.16: M-Pesa Usage...................................................................................................54
Figure 4.17: Money Transfer Service Used Before M-Pesa...............................................55
Figure 4.18: Local Money Transfer Service Used Currently..............................................56
Figure 4.19: Where Money is Sent to Most Often...............................................................58
Figure 4.20: From Where Money Is Received Most O ften................................................59
Figure 4.21: Reasons for Using M- Pesa............................................................................. 61
Figure 4.22: Most Common Problems Encountered by the Agents.................................. 62
Figure 4.23: Most Common Problems Encountered by the Users......................................63
Figure 4.24: Services the Users Want M-Pesa to Introduce...............................................65
IX

ABSTRACT
In March 2007, Kenya's largest mobile network operator, Safaricom (part of the
Vodafone Group), launched M-PESA, an innovative mobile banking service for the
unbanked. "Pesa" is the Swahili word for cash; the "M" is for mobile. Since then the
growth o f M-Pesa has been explosive and is a clear sign that M-PESA fills a gap in the
market.
The purpose of this study is to determine the economic and social impact of mobile
banking such as M-PESA to the society in Kenya. The respondents were selected from a
representative sample of the close to 10 million M-Pesa registered users (Safaricom
Annual Financial Report. 2010) and a number of selected M-Pesa authorized agents.
Questionnaires were used to collect the primary data which was supplemented with some
secondary data from Safaricom. Various statistical analysis techniques such as descriptive
statistics, difference of means and Chi-Square test were used to measure the social and
economic impacts M-Pesa has had. From the findings it was revealed that indeed M-Pesa
had had a huge impact on the Kenyan society both economically and socially. Also from
the research study other interesting findings were discovered that could contribute to
improving M-Pesa as a service.
Finally, the research study recommends the need for further studies possibly targeting
other mobile banking services across Kenya.
x

husbands and other contacts in Kenyan cities. Remittances through M-PESA relieve
many women in rural areas of the burden of traveling by bus to cities to receive money
from their husbands and relatives, a process that for some could take as long as one week.
However, on the negative side it reveals that now some men working in the cities have
cut back on the number of visits to their rural homes, visits they made more frequently
before M-PESA was available in order to deliver funds to their wives and relatives. As a
result, some wives fear their husbands may leave them for "city wives." which could lead
to a complete stop to remittances or. worse, to competing claims for their homes and
land. (Morawczynski. 2009)
1.2 Statement of the Problem
The World Bank estimates that in many countries, over half the population, "the
unbanked", has never had a bank account. The poor tend to be terrified of banks, since
they are often humiliated or ignored when they try to enter them. That means they cannot
leave their savings anywhere safe, pay a bill without walking with the cash to the office,
or prove that they are credit-worthy. (Wireless intelligence. 2007)
Studies have been done by Owens, John and Anna Bantug-Herrera (2006) for other
countries, specifically South Africa and Philippines. Despite the phenomenal growth of
M-Pesa and the major impact it has had in Kenya, they have been no published academic
studies done so far in Kenya on the socio-economic impact of mobile banking in Kenya
(Gikunju. 2009). It would therefore be informative to analyze the impact of mobile
banking, specifically M-Pesa to the society in Kenya and understand perceptions about
mobile banking among users and non-users.
4

This study therefore seeks to analyze the question; what has been the socio-economic
impact of mobile banking, specifically M-PESA to the Kenyan society?
1.3 Research Objectives
The objective of this study is to analyze some of the socio-economic impact of mobile
banking, specifically M-PESA to the society in Kenya both positive and negative.
Specifically, it seeks to answer the following research objectives:
a) To determine the social impact of M-PESA to the Kenyan society
b) To determine the economic impact of M-PESA to the Kenyan society
1.4 Significance of the Study
This study will be beneficial to the following stakeholders:
a) Industry Players
Telecommunication companies that may wish to venture into mobile payment will have
an insight on the significance and impact of the service and how to improve their
products.
b) Users
An opportunity to become engaged in the formal banking sector.
To enable financial transactions without the costs and risks associated with the use of
cash (including theft and travel to pay in person)
5

c) Agents
Add business opportunities through the increase in the number of customers coming to
their premise.
d) Government and Non-governmental organizations
The product facilitates in the equal distribution of wealth specifically in rural areas hence
promoting development. This is in line with the millennium development goal of
eradicating poverty in Kenya.
e) Academia
This study will also benefit the academia in better understanding the impact mobile
banking has had to the society and how this can be leveraged to further improve the
industry through more research
6
CHAPTER TWO
LITERATURE REVIEW
Introduction
The word mobile comes from the Latin word mobilis which means “to move" or “able to
move freely or easily" or “able or willing to move freely or easily between occupations,
places of residence and social classes" Device, state of being, industry (Oxford English
Dictionary).The word mobile device can be described as a mobile, wireless or cellular
phone - a portable, handheld communications device connected to a wireless network that
allows users to make voice calls, send text messages and run applications.
2.1 Mobile Communications
According to a survey done by the Wireless Intelligence in 2007, within the last decade
or so mobile communications became well established in the industrialized nations. A
continuous growth of the number of subscribers is anticipated for the foreseeable future.
The success of mobile communications is largely because of the interaction of many
different technological developments, such as the implementation of specialized coding
and modulation schemes, miniaturization of electronic systems, the mathematical
simulation of wave propagation and using state of the art switching and wireless
technology. Mobile communication today does not only cover terrestrial voice
communication but also covers satellite technology and data transmission technology
between mobile and fixed user equipment.
7

Wireless communication permits services such as long range communication that are
very difficult to implement with the use of wires. This term is normally used in the
telecommunications industry to refer to telecommunication systems (e.g. radio
transmitters and receivers, computer networks, network terminals, remote controls etc.)
which use some form of energy (e.g. radio frequency, laser light, visible light, infrared
light, acoustic energy etc...) to transfer information without using physical wires.
Information is transferred in this way over both short and long distances. (Wireless
Intelligence, 2007).
2.2 Technology Diffusion and Mobile Commerce
Mobile commerce (also called wireless commerce, or m-commerce) is a fairly new
phenomenon, several definitions exist in the academic and practitioner literatures.
Tarasewich. (2002. p. 42), for example, defines m-commerce as "all activities related to a
commercial transaction conducted through a communications networks that interface
with w ireless devices." We find that Tarasew ich et al.'s definition is too broad and may
include the use of wireless devices (e.g., mobile phones) for voice communication.
Another definition has been attributed to Forrester Research, and defines m-commerce as
"the use of handheld wireless devices to communicate, interact, and transact via high
speed connection to the Internet" (Shuster. 2001. p. 2). This definition is unsatisfactory,
too: it may exclude mobile transactions (e.g. short message service, SMS) that are
conducted via private networks. According to another study that was by Crawford and
Aftahi (2001), there definition stands in contrast to these. It emphasizes three elements of
m-commerce: a range of activities, devices, and network types. In our research, we will
8

define m-commerce as all electronic transactions (e.g., communication, interaction,
purchase, payment) that use data-enabled wireless device connections to the Internet or to
a vendor's private networks. The extent of the diffusion of m-commerce activities in a
country is typically related to the number of mobile phones, w hich accounted for more
than 97% of the worldwide mobile device market in 2000 (Crawford and Aftahi, 2001).
On the other hand mobile banking can be described as the provision and availing of
banking and financial services with the help of mobile devices. However the difference
between mobile commerce and mobile banking is that the scope of mobile banking is
limited to a few services being offered which may include facilities to conduct banking
and stock market transactions, to administer money accounts and to even access
customised information whereas mobile commerce is much broader and encompasses all
transactions done using a mobile device.
The convergence of Internet and mobile communications, has led to the creation of an
emerging market for mobile commerce (m-commerce). Although the m-commerce
market currently is in its initial stage of development, most observers predict that a
critical mass of business and individual users will be reached very rapidly. For example,
an article in Business Week Online reported that International Data Corporation (IDC) has
suggested that the market for m-commerce-related services will reach $21 billion by 2004
(Baker. 2000).
9

One survey by (Foong. 2001) shows that in particular, some countries (e.g., Finland.
Japan. Korea and Hong Kong) evidence a rapid increase in mobile phone penetration,
while others (e.g.. India, the United States) have seen more gradual increases in mobile
phone penetration. Observers point to anecdotal evidence to make claims about the
disparate factors that may drive the growth of mobile phone adoption and usage in
different countries. The Gartner Group argues that the unique characteristics of Japanese
culture, low PC penetration, and high cost of fixed phone line access charges provided
the basis for the phenomenal growth of Japan's mobile phone users, which reached 48%
of the population in March 2001 (Foong. 2001). Similarly, the business press claims that
the strong pan-Europcan regulatory policy in support of a uniform Global System for
Mobile (GSM) communications standard has been instrumental in the growth and
penetration of mobile phones in several European countries (Baker. 2000: Schenker,
2000).
2.3 Social Impacts and Influences of Mobile Commerce
As m-commerce continues to grow' rapidly, it could have significant effects on the
structure and functioning of a society at an individual and aggregate level (Granovetter,
1995). The social impacts of these changes are discussed in this section. Revolution in
computing and communications of the past few decades, indicate that technological
progress and use of information technology will continue at a rapid pace.
One study in particular reveals that the Internet's growth and m-commerce has begun to
create fundamental change in government, societies, and economies with social,
10

economic and political implications (Boulton et al., 2000: McGarvey, 2001). These
advances present many significant opportunities but also are having wide-ranging etYects
across numerous domains of society, and for policy makers. Issues involve economic
productivity, intellectual property rights, privacy protection, and affordability of and
access to information, among other concerns (Sharma and Gupta, 2001; 2003b). Mobile
commerce promises to be the momentum behind a new wave of economic growth
(Mariotti and Sgobbi, 2001).
Another study done by Mariotti and Sgobbi (2001) argues that M-commerce has already
improved business value by fundamentally changing the ways products are conceived,
marketed, delivered, and supported. The relationship and interaction of various
stakeholders such as customers, suppliers, strategic partners, agents, and distributors is
entirely changed. On the positive side, m-commerce has been creating opportunities for
individuals and businesses in the new economy. M-commerce is helping organizations to
reduce transaction, sales, marketing, and advertising costs. M-commerce is also helping
businesses to reach markets efficiently, all day ever day. Many of the benefits come from
improved consumer convenience, expanded choices, lower prices, and the opportunity for
better interactions with partners, suppliers and targeted customers for service and
relationships.
M-commerce has also improved product promotion through mass-customization and one-
to-one marketing. Adoption of new information technologies, particularly m-commerce,
is expected to improve firm performance, such as reducing transaction costs and closer
tO WER
n

coordination of economic activity among business partners (e.g.. Malone et al., 1987;
Mukhopadhyay et al., 1995). M-commerce specifically (especially Business to Business)
is predicted to result in lower coordination or transaction costs due to automation of
transactions online, as well as productivity and efficiency gains (Amit and Zott, 2001;
Lucking-Reileyand Spulbur, 2001; Wigand and Benjamin. 1995). M-commerce also is
expected to facilitate entry into new markets and the extension of existing markets
(Garicano and Kaplan, 2001), and greater integration of systems with suppliers and
customers (OECD. 1999; Timmers, 1999; Wigand and Benjamin. 1995). As m-commerce
continues to grow rapidly, it could have significant effects on the social and economic
structures of economy. The impacts of these changes are diverse and may even widen the
digital divide among nations, alter the composition o f trade, disrupt labour markets, and
change taxation (Anonymous, 2000).Widespread use of the Internet for m-commerce
may have ramifications for intellectual property rights, privacy protection, and data
filtering. Therefore, in the digital economy, it is becoming imperative to know how m-
commerce affects organizations and society and raises social concerns. Some of these
effects of m-commerce are unintentional and create adverse business and personal
conditions that could have societal consequences.
Social and economic aspects o f ICT have been studied by many researchers and
practitioners for over 50 years (Dutton. 1999a; 1999b). However, the influences of m-
commerce are expected to be far bigger than were ever imagined before (Sharma and
Gupta, 2003b). In the next chapter we will now look at a specific form of m-commerce
which is mobile banking.
12

Late in 2007. Celtel launched Sokotele, supposedly a competitor to M-PESA. Celtel's
partners in the development were Packet Stream, a public data network operator, and K-
Rep Bank, one of Kenya's leading micro-finance institutions. K-Rep Bank provides the
banking expertise. Packet Stream supplies the vending software, and Celtel Kenya's
cellular network makes the connectivity possible. Over the last couple of years, several
banks have also embraced mobile banking technologies, enabling customers to access
their bank accounts via their mobile phones. Leading microfinance institutions in Kenya,
including Jamii Bora. K-RepBank and Faulu Kenya, have also introduced services based
on SMS (short message service) that let their clients view their balances, request account
statements, and transfer money.Michael Joseph. CEO of Safaricom stated:
Safaricom and Vodafone's M-PESA mobile money transfer service is an example
of Kenya leading the way in the advancement of mobile technology and its uses.
Following the very positive response by consumers to the pilot, we believe that
there is a great deal to be gained for Kenyan consumers as well as for mobile and
financial sector companies. (Joseph. 2008)
2.6.1 Growth of M-Pesa
The growth of M-Pesa in Kenya has been phenomenal. In its one year o f operation M-
Pesa had enlisted over 2.3 million active customers. Currently we are talking about 9.48
million registered users as of March 2010 (up from 2.08 million in March 2008) and Ksh
28.59 billion transferred person to person in March 2010, up from Ksh. 3.0 billion in
March 2008 (Safaricom Annual Financial Report. 2010)
21
According to Omwansa, (2009) several factors help explain the phenomenal growth of
Mobile Banking, especially in Kenya. The top three are the impressive adoption of
mobile phones, the need to access financial serv ices, and the low cost of money transfers
through mobile phones. Each of these factors is explained in more detail in the sections
below.
a) Diffusion of mobile phones
The growth of Kenya's mobile subscribers has been tremendous. As of December 2008.
the number had risen well above 13 million. Meanwhile, the use of land lines grew far
less quickly over the same period, from 328,358 to 463,122. In the first quarter of 2006
there were 147.4 million mobile subscribers in Africa: two years later the number had
more than doubled, to 301.7 million, representing a penetration rate of 30.4%.
(Rosenberg, 2009)
According to a survey done by ITU. Kenya's penetration rate rose from 2% in 2001 to
39% as of the second quarter o f 2008. Kenya is the most developed mobile market in East
Africa and its penetration rate is forecast to reach 67.5% in 2012. Four mobile service
operators are active in Kenya. Safaricom. with well over 15 million subscribers, is the
clear market leader with 81% o f the total subscriber base. Zain (formerly Celtel) follows
with just over 3 million subscribers, and Telkom Orange has about 1 million. Econet,
barely a month old, has not released any subscription data. The fact that Safaricom
controls such a large percentage of the subscription base has given M-PESA the
advantage it needed to penetrate very quickly. Only Safaricom subscribers can operate an
22

M-PESA account, though other network subscribers can receive an SMS from an M-
PESA subscriber. (Pickens. 2009)
b) The need for access to financial services
A survey that was conducted in early 2007 revealed that 38% of Kenyans had no access
to any form of financial services, according to a national survey, and only 19% had
access to formally regulated financial institutions such as banks. In the entire country
there were only 400 bank branches and slightly over 600 ATMs—and over 10 million
mobile subscribers. (Ndungu. 2009)
We could easily say that M-PESA took off so rapidly because of the low penetration
of banking services and the public need for them. Though few studies have been done to
establish whether the service mostly benefits the un-banked, we have several indications
that it has gone both ways. Features such as convenience, speed, and low transaction fees
attract significant numbers of those who already use banks. Small businesses are among
the greatest beneficiaries in using M-PESA because it lets them go to the bank less often,
and spend more time running their businesses. Many unbanked Kenyans can now receive
and send money via their mobile phones, wherever they are in the country. In September
2008, Safaricom signed an agreement with Pesa Point Ltd. to allow M-PESA subscribers
to withdraw money through PesaPoint ATMs. Registered in 2005. PesaPoint has a vision:
to provide all banked Kenyans with easy access to funds in their bank accounts wherever
they are in the country. So far it has installed over 110 ATMs across the country. This
agreement helps overcome the problem that agents sometimes do not have enough cash to
23

issue to M-PESA customers who want to withdraw it. This partnership was a major
milestone in linking M-PESA to the formal banking system, a confirmation that more
financial players are willing to collaborate to improve access to financial services.
In December 2008, M-PESA signed another agreement with Western Union for
international cash transactions. Vodafone, Safaricom and Western Union announced that
they would partner to pilot a cross-border intercontinental mobile money transfer service
between the United Kingdom and Kenya. Ultimately M-PESA subscribers will be able to
receive international remittances just like local ones. According to the World Bank.
Kenyans received approximately SUS 1.3 billion in international remittances in 2007; for
some Kenyans, these remittances are a considerable part of their total income. These
innovations will certainly improve many Kenyans’ lives. (Omwansa. 2009)
c) Low transaction costs
According to the 2007 survey mentioned above, over 70% of Kenyans prefer informal
methods to remit funds to their loved ones within the country. Of those interviewed,
55% sent money with friends or family members who w'ould be travelling and 22% used
public transport companies. Though such methods are not safe, people prefer them
because the transaction fees are lower than those of banks and money transfer companies.
(Ndungu. 2009)
M-PESA offers a very competitive package with a very attractive transaction fee. To send
KShs. 35,000 (approx USS 500) using a money transfer company such as Western Union
24

would cost about K.shs. 1.200 (approx US$ 17) within the country, but using M-PESA to
send the same amount would cost less than a third as much and M-PESA is much cheaper
than using a bank account. Given their setup and operational costs, banks and money
transfer companies cannot offer such low rates. (Safaricom Financial Report, 2009)
2.6.2 Influence of M-Pesa in Kenya
Cost is another significant attraction for M-PESA users, who find that transactions are 27
percent cheaper than services offered by the postal network, and 68 percent less than
sending money by bus companies. (Moraw'czynski. 2009)
The same research showed that M-PESA users fall into two categories— urban senders,
who are usually men. and rural recipients, who are mostly women. Their transactions are
generally either small, regular transfers that act as income support for rural members and
lump sum transfers, which are often used to pay school fees.
However, the same research revealed that there are some downsides to M-PESA. Urban
users say they are sometimes frustrated by failed transactions which are often the result of
network problems as M-PESA relies on the same technology that supports text
messaging. Because it is often difficult to get through to Safaricom's busy customer care
M-PESA support phone number 234, a failed transaction may require the user to turn to
the M-PESA agent network, which often struggles to resolve the problem. Rural users
complain that agents sometimes lack cash on hand sometimes referred to as cash float.
M-PESA customers whose agents cannot meet their withdrawal requests are often forced
to travel to the cities to get their money. As a positive, users report increases of 5% to
25

30% in their incomes thanks to transfers through M-PESA. By making smaller but more
frequent transfers, urban migrants on average are sending more money home than ever
before. This represents a substantial boost for rural recipients, for whom remittances can
represent up to 70% of their household income. (Morawczynski. 2009)
The research also shows that M-PESA is also empowering rural women because it makes
it easier for them to solicit and get money from their husbands and other contacts in
Kenyan cities. Remittances through M-PESA relieve many women in rural areas of the
burden of traveling by bus to cities to receive money from their husbands, a process that
for some could take as long as one week. One unexpected consequence is that some men
working in the cities have cut back on the number of visits to their rural home, visits they
made frequently before M-PESA was available to deliver funds to their wives and
relatives. Some wives fear their husbands may leave them for “city wives,” which could
lead to a complete stop of remittances or worse still to competing claims for their homes
and land. (Morawczynski, 2009)
Overall, the research suggests a positive change in savings behavior as a result of M-
PESA. In particular, the financial business diaries reveal that many customers are
integrating M-PESA with popular savings tools, such as bank accounts and informal
savings clubs. The most frequent users who kept financial diaries were making on
average 15 to 20 small deposits to their M-PESA accounts each month. Some used these
savings to invest in their rural home, for example by purchasing a cow or building a
home, while others transferred the money into bank accounts to earn some interest. There
is no conclusive evidence given of higher savings and incomes, combined with greater
26
empowerment of rural women, however the study points to the benefits gained in just two
communities in Kenya. The research therefore represents the beginning of a better
understanding, using new data sources, of the impact of mobile banking on the lives of
the poor.
It is clear from our research that M-PESA is breaking down many barriers to
money transfer, in particular by helping cash reach Kenyan rural communities that
often struggle to access traditional banking and financial services ... Additionally,
as M-PESA has grown to critical mass, many rural customers are tapping into a
growing network of potential remitters and lenders to effectively increase their
incomes (Morawczynski, 2009)
The above quote basically summarizes the social impact M-Pesa has had to Kenyans,
especially in rural areas.
One of the most interesting findings is how many low-income Kenyans are using
M-PESA to store money. One in five M-PESA users say they keep funds in their
M-PESA wallet, like a bank account. This is powerful evidence that Kenyans
have more financial needs and are willing to pay when a quality service is made
available. (Pickens, 2009)
Similarly, the above statement in a nutshell captures the economic impact that M-Pesa
has had on Kenyans, especially among the low income earners.
27

2.7 Legal and Regulatory Issues regarding M-Pesa
a) Regulators Issues in Mobile Banking
In any new market, enablement requires a blend of legal and regulatory openness, which
creates the opportunity to start up and experiment, with sufficient legal and regulatory
certainty that there will not be arbitrary or negative changes to the regulatory framework,
so that providers have the confidence to invest the resources necessary. Developing
countries with low levels of effective and comprehensive regulation may be very open
but highly uncertain, since regulatory discretion may lead to arbitrary action. Countries
with greater regulatory certainty may be less open, in that the types of entities allowed to
start up are restricted. Especially in a new unknown market sector like mobile banking,
where business models are not yet established, enablement in the policy and regulatory
sector means a move towards greater certainty and greater openness. (Kinyua. 2009)
Prior to the launch of M-Pesa services in Kenya. Safaricom sought authorization from the
Central Bank of Kenya (CBK) to undertake the money transfer service. In evaluating the
business proposal, the CBK considered the request on the basis of reliability, safety and
efficiency of the service. In addition, some precautionary measures were instituted to
ensure that the services did not infringe upon the banking services regulatory framework
as provided for under section 2(1) of the Banking Act. The M-Pesa service therefore does
not qualify to be a banking service because it does not accept deposits from members of
the public, money or deposits that are repayable on demand or at the expiry of a fixed
period or after notice. It also does not accept from members of the public, money for
current account purposes that is used for payment and acceptance of cheques and lastly.
28
M-Pesa does not employ money held or any part of the money for purposes of lending
and investment or in any other manner for the account and at the risk of the person so
employing the money. (Kinyua, 2009)
b) Money Handling with M-Pesa
In M-Pesa. money collected by agents is deposited in a trust account in one of the leading
commercial banks in Kenya. This trust account that was created provides the legal
protection for the beneficiaries. The money put in this trust account is not under the
control of Safaricom and cannot be employed for other puiposes such as lending,
investing or in any other manner for the account and at the risk of Safaricom as per
Section 2(1) of the Banking Act. Legal protection of the money put in this trust account is
provided for in the trustee deed. Also various legal instruments pertaining to this service,
including the trustee deed have been presented to the Central Bank and reviewed
accordingly. In addition to this, funds in the trust account deposited in the designated
commercial bank are regulated by the Central Bank of Kenya under Section 2( 1) of the
Banking Act in Kenya, 2009 (Kinyua. 2009)
Safaricom undertakes to the Trustee (defined as the bank that holds in trust money
deposited by the M-Pesa agents) and to the System Participants that it will not issue any
new e-Money other than in return for an equal amount in conventional money being paid
to and received by the Trustee. Safaricom cannot also effect any transfer o f any e-Money
from any M-Pesa Account of an amount which exceeds the credit balance of e-Money in
the relevant M-Pesa account. (Omwansa, 2009)
29

c) Other Issues
A number of critical issues and risks that have been reviewed include: liquidity
management, settlement risks, the reliability of the system, the registration of users,
system audit trail, anti-money laundering measures and consumer protection issues that
could compromise the safety, efficiency, integrity and effectiveness o f the M-Pesa
system. These risks have been mitigated through a number of monetary security measures
which the Central Bank and the Communications Commission of Kenya (CCK) monitors
regularly. For example, there is no credit risk because M-Pesa agents pre-pay before
offering any sen ices to customers. Also Central Bank of Kenya has placed a maximum
limit of KShs 50.000 per M-Pesa account per day and a transaction limit of KShs 35.000
per day in order to mitigate against settlement risk. Moreover. Safaricom is part of the
Vodafone group, an international and well reputed multinational company in the
provision of mobile phone services. The M-Pesa product benefits from the research and
development of Vodafone and as such the operational risks have been minimized. The
Central Bank of Kenya has continued to oversee the serv ice in line with its Oversight
Policy Framework document on payment systems in Kenya which is downloadable at the
Bank's official website www.centralbank.co.ke . For example, whereas the system
transacted about Kshs. 17 billion in August 2008. the net deposit/residual value per
customer (i.e. deposit less withdrawals) was Kshs. 203/- only thus demonstrating that M-
Pesa is yet to be regarded as an alternative bank account with sums of money staying in
the system.(Omwansa, 2009)
30

To further provide a sound legal basis for payment systems in Kenya, the CBK and the
Treasury have been refining several legal and regulatory measures aimed at promoting
safety, efficiency and effectiveness of payment systems in Kenya. One such effort is the
review of the Central Bank Act in the year 2003 to include section 4A1 (D) that mandates
the CBK to advocate for such policies as to best facilitate the establishment, regulation
and supervision of efficient and effective payment, clearing and settlement systems.
Currently the Bank has proposed and formulated the enactment of the National Payment
System Bill that will strengthen the above mandate by expressly providing for the
oversight of all Payment systems including money transfer services. This Bill will soon
be tabled in Parliament for enactment into Law (Kinyua, 2009)
Recently the enacted Kenya Communications (Amendment) Act 2008 expanded the
functions of the CCK in relation to electronic transactions and provides legal recognition
of electronic transactions. This Act not only legalizes electronic financial transactions but
it also enables the CBK and CCK to work together and support this system including
other such products that may come in future to the market. According to Starita (2009).
while 55 percent of adult Kenyans have access to a mobile phone, only 19 percent are
banked. There is therefore a huge market that has access to mobile phones but not
financial services and M-Pesa was designed to help fill this gap. (Kinyua. 2009)
31
CHAPTER THREE
RESEARCH METHODOLOGY
3.1 Research Design
To investigate the socio-economic impact of M-Pesa, it was necessary to measure the
socio-economic effects before and after M-Pesa was launched. This allowed us to gauge
the improvement of the socio-economic status of Kenyans since the launch of M-Pesa.
The best way to achieve this was to conduct a random survey of M-Pesa users.
3.2 Population
The population of this study was all M-Pesa registered users who as of March 2009 were
estimated to be about 6.5 million registered users (Safaricom Financial Annual Report.
March 2009). Also some additional information w'as obtained from a few selected M-%
Pesa agents to supplement the information that was gathered.
3.3 Sampling
Determining the sample size is a very important issue because samples that are too large
may waste time, resources and money, while samples that are too small may lead to
inaccurate results. When sample data is collected and the sample mean is calculated, that
sample mean is typically different from the population mean. This difference between the
sample and population means can be thought of as an error. The margin of error is the
maximum difference between the observed sample mean and the true value of the
population mean. Hence the sample size is given by the formula:
32

Where:
z .*/a is known as the critical value, the positive z value that is at the vertical boundary
a /for the area of / 2 in the right tail of the standard normal distribution.
• is the population standard deviation.
• is the sample size.
• is the calculated sample mean
• is the population mean
• is the margin of error
Solving for the sample size « .A 95% degree confidence corresponds to 05 = 0.05. Each of
a /the shaded tails in the following figure has an area of / 2 = 0.025. The region to the left
of /^and to the right of z = 0 is 0.5 - 0.025. or 0.475. In the Table of the Standard
Normal ( z ) Distribution, an area of 0.475 corresponds to a lv a lu e of 1.96. The critical
zB,value is therefore A = 1.96.
33

The margin of error E= 5 and the standard deviation cr= 50. Using the formula for
sample size, we can calculate:
n =
385
So we needed a sample size of at least 385 randomly selected M-Pesa registered users.
With this size of sample we would be 95% confident that the sample mean x will be
within an acceptable range of the true population of M-Pesa registered users.
For the M-Pesa agents since they are not part of the main study, only fifty were randomly
selected based on our judgment from different geographical areas.
3.4 Data Collection
There were two main sources of data. This included secondary data from Safaricom's M-
Pesa Department and primary data from M-Pesa registered users and also M-Pesa agents.
The instrument that was used for data collection was questionnaires. The questionnaires
were of two types: those targeting M-pesa registered users and those targeting M-pesa
agents. An M-pesa registered user is defined as any Safaricom subscriber who has
registered with Safaricom at least one M-Pesa account. An M-pesa agent is defined as
any authorised Safaricom dealer who is legally permitted to transfer and receive money
through M-Pesa on behalf of Safaricom.
34

Simple random sampling technique was used to collect data within the sample
population. The areas from which the data was collected included the central business
district in Nairobi and randomly selected residential areas in Nairobi.
As expected some of the respondents were uncooperative and some questionnaires were
also not filled appropriately. However, the responses received were reasonably
representative considering that the stratum selected was reasonably heterogeneous and
the elements in the strata were reasonably homogenous. Randomness o f data collection
during the survey was strictly observed to avoid bias.
UNVvfc? *
35

CHAPTER FOUR
DATA ANALYSIS, RESULTS AND DISCUSSION
4.1 Introduction
The chapter presents data analysis, findings and discussion of the study in line with the
research objective. The research objective of the study was to investigate impact of
mobile banking M-PESA in the Kenyan society. To achieve the objective, the research
used a number of specific objectives as follows: to establish the social impact of M-PESA
to the Kenyan society and to establish the economic impact of M-PESA to the Kenyan
society.
4.2 Data Analysis
The responses from the questionnaires were then analysed and the socio-economic
impacts of M-Pesa to the Kenyan society were then formulated from the statistics
gathered. Descriptive Statistics was used to describe the basic features o f the data in the
study. This provided simple summaries about the samples and the measures used in the
data. This was mainly used to analyze the economic impacts of M-Pesa. Difference of
Means was also used to analyse if there was a significant difference in the impact of
money transfer services before and after M-Pesa. Chi-Square test was used to determine
whether there was a significant difference between the expected frequencies and the
observed frequencies in one or more categories.
The software that was used for all the above analysis was Microsoft Excel and Statistical
Package for Social Sciences (SPSS).
36

4.3 Results
4.3.1 Number of respondents
A total of 500 questionnaires (440 for M-PESA users and 60 for M-PESA agents) were
issued out. The completed questionnaires were edited for completeness and consistency.
Of the 500 questionnaires issued, only 386 were returned and correctly filled for M-Pesa
users while only 47 were returned and correctly filled for M-Pesa agents.
4.3.2 Demographic Characteristics of the respondents
The demographic characteristics considered in this study for the M-Pesa users included
gender, age. marital status and the average income distribution. While those considered
for the M-Pesa agents were gender and age only.
a) Gender
The purpose of this analysis was to establish if there is a significant difference in the
usage of M-Pesa between male and female users.
Table 4.1: Gender of the respondents
M-PESA users M-PESA agents
Male 42.6% 46.8%
Female 57.4% 53.2%
Total 100.0% 100.0%
37

Figure 4.1: Gender of the respondents
After performing the Chi-square Test for M-Pesa users, we find Chi squared equals 1.96
with 1 degree of freedom and the two-tailed P value equals 0.1615. By conventional
criteria, this difference is considered to be not statistically significant. Similarly for M-
Pesa agents Chi squared equals 0.360 with 1 degree of freedom and the two-tailed P
value equals 0.5485. By conventional criteria, this difference is also considered to be not
statistically significant.
This finding implies that both men and women have embraced M-Pesa equally with no
significant difference between them.
b) Age
The purpose of this analysis was to establish if there is a significant difference in the
adoption of M-Pesa between users of different ages.
Table 4.2: Age of the respondents
M-Pesa agents(%) M-Pesa users(%)
Below 20 0.0 9.10
2 0 -3 0 42.60 28.00
38
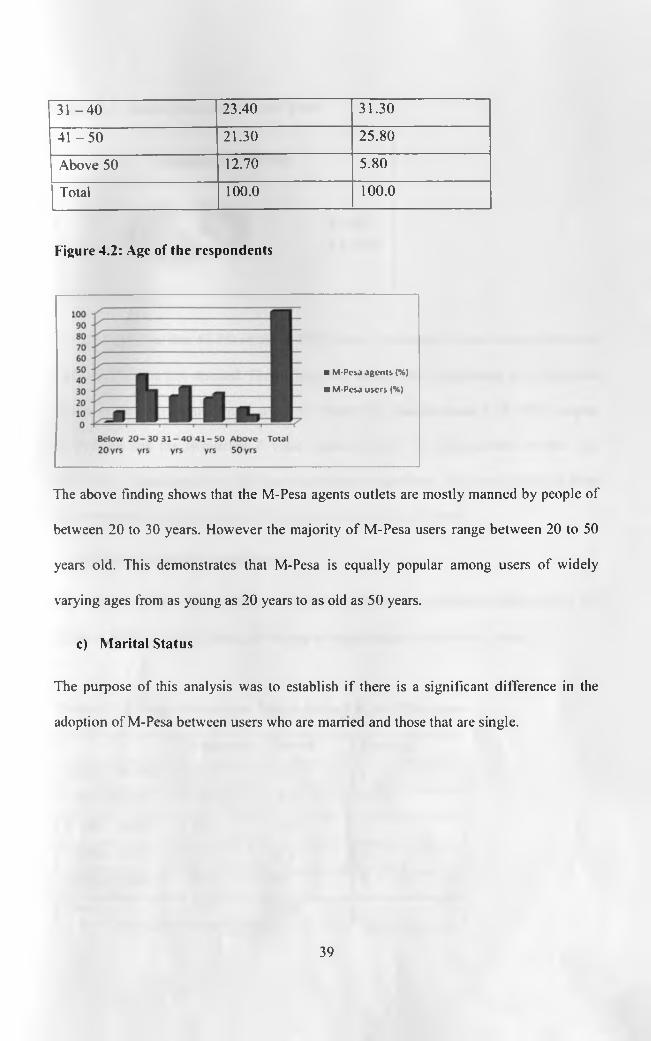
3 1 -4 0 23.40 31.30
41 - 5 0 21.30 25.80
Above 50 12.70 5.80
Total 100.0 100.0
Figure 4.2: Age of the respondents
■ M-Pcsd agents (%)
■ M-Pcsa users (%)
The above finding shows that the M-Pesa agents outlets are mostly manned by people of
between 20 to 30 years. However the majority of M-Pesa users range between 20 to 50
years old. This demonstrates that M-Pesa is equally popular among users of widely
varying ages from as young as 20 years to as old as 50 years.
c) Marital Status
The purpose of this analysis was to establish if there is a significant difference in the
adoption of M-Pesa between users who are manned and those that are single.
39

Figure 4.3: Marital status of M-Pesa Users
Marital Status
■ Single
■ Married
The findings show that 58.7% of the M-PESA users' respondents were married while the
other 41.3% were not married. From Figure 4.3 above, after performing the Chi-square
Test between married and single users, we found Chi squared equals 3.24 with 1 degree
of freedom and the two-tailed P value equals 0.0719. By conventional criteria, this
difference is considered to be not quite statistically significant. This implies that M-Pesa
has been equally adopted and used by both married and single users.
d) Average Income Distribution
The purpose of this analysis was to establish if there is a significant difference in the
usage of M-Pesa between users of varying average income distribution groups.
Table 4.7: Average Income per Month earned by M-PESA users
Frequency Percent Ranking
10.000-30.000 161 48.9 1
Below 10,000 64 19.5 2
31.000-50.000 39 11.9 3
51.000-70.000 39 11.9 4
Above 71.000 26 7.9 5
Total 329 100.0
40

Figure 4.9: Average Income per Month earned by M-PESA users
The above findings clearly show that the majority o f M-Pesa users actually earn between
Kshs. 10,000/- and Kshs. 30,000/- per month which lies in the low income group
according to the National Income Distribution of 2009 published by the Kenya Bureau of
Statistics. This is a very significant finding as it implies that M-Pesa is significantly more
popular among the low income earners compared to the relatively higher income earners.
4.3.3 Economic Impacts
Under economic impacts we considered the following criteria from the M-Pesa agents:
a) Average Number of M-Pesa customers served in a day
b) Average New M-Pesa customers registered in a day
c) Average Pattern of Demand for M-Pesa services
d) Average Income earned before and after adopting M-Pesa as a business
41

Similarly, under economic impacts we considered the following criteria from the M-Pesa
users:
a) M-Pesa usage compared to commercial bank accounts
b) Use of M-Pesa for various financial services e.g. sending and receiving of money
c) Average amount of money transferred in a month before and after M-Pesa was
launched
d) Average number of times in a month money is transferred before and after M-
Pesa was launched
I. Response front M-Pesa Agents
a) Average Number of M-Pesa customers served in a day
The purpose of this analysis was to establish the demand of M-Pesa services by
measuring the average number of M-Pesa customers served in day by a single M-Pesa
agent.
Figure 4.4: Average Number of M-PESA customers served per day
Number of M-Pesa Customers Served in Day
100%80%60%40%20%
0%
Less 10 to 50 to 100 and than 10 50 100 more
42

The finding above indicates that 83.0% of the M-Pesa agents serve more than 100
customers per day. This is quite a high number of customers to be served in a single day
by a single agent which directly implies that there is a high demand for M-Pesa services
in Kenya.
b) Average New M-Pesa customers registered in a day
The purpose of this analysis was to establish if there is growth in demand of M-Pesa
serv ices by measuring the average number of new M-Pesa customers registered in day by
a single M-Pesa agent.
Table 4.3: Average new M-PESA customers registered in a day
Frequency Percent Ranking
Less than 10 20 42.6 2
10-50 23 48.9 1
50- 100 3 6.4 3
More than 100 1 2.1 4
Total 47 100.0 5
Figure 4.5: Average new M-PESA customers registered in a day
■ Frequency
■ Percent
Less than 10-50 50-100 More Total10 than 100
43

The finding above indicates that almost half the number of agents (48.9%) register
between 10 to 50 new customers in a day. This implies there is still growth in demand for
M-Pesa services and has not yet reached its peak.
c) Average Pattern of Demand for M-Pesa serv ices
The purpose of this analysis was to establish the average pattern of demand for M-Pesa
services to determine if there is even distribution of money transferred throughout a
month.
Table 4.5: Period the most money transfers takes place
Frequency Percent Ranking
End month 23 48.9 1
Mid - month 12 25.5 2
Evenly distributed throughout
the month10 21.3
3
Holidays 2 4.3 4
Total 47 100.0 5
44

Figure 4.7: Period the most money transfers takes place
The finding above shows that money transferred via M-Pesa is not evenly distributed
throughout the month but instead almost 50% of it occurs towards the end of the month.
This is possibly because this is w'hen most users have received their salaries/wages and
are able to send money to their loved ones or pay their bills.
d) Average Income earned before and after adopting M-Pesa as a business
The purpose of this analysis was to establish if there is a significant difference in the
average income earned by M-Pesa agents before and after adopting M-Pesa as a business.
Table 4.6: Average income earned per month
Before M-Pesa After M-PesaFrequency
PercentCumulativePercent
FrequencyPercent
CumulativePercent
11.000-20.000 18 38.3 38.3 1 2.1 2.1
21.000-30.000 10 21.3 59.6 2 4.3 6.4
31.000-40.000 2 4.3 63.8 13 27.7 34.0
41.000-50.000 6 12.8 76.6 5 10.6 44.7
45

More than 50,000 11 23.4 100.0 26 55.3 100.0
Total 47 100.0 47 100.0
Figure 4.8: Average income earned per month
This finding shows that the income earned by M-Pesa agents since taking up M-Pesa as a
business is very significant with more than 50% of agents reporting to have earned up to
Kshs. 50.000/- compared to only 20% before M-Pesa. From Table 4.6 above, after
performing the Chi-square Test for P value and statistical significance, we find Chi
squared equals 222.008 with 4 degrees of freedom. The two-tailed P value is less than
0.0001. By conventional criteria, this difference is considered to be extremely statistically
significant. This therefore implies that M-Pesa has actually had a huge impact in the
income earned by M-Pesa agents and by extension in alleviating poverty in Kenya.
46

II. Response from M-Pesa Users
a) M-Pesa compared to commercial bank accounts
The purpose of this analysis was to establish if there has been a significant impact to the
banking industry after the launch of M-Pesa.
Table 4.8: Primary Account operated Account after M-Pesa
Frequency Percent RankingM-PESA 140 42.6 1Other Commercial Bank Account 116 35.3 2
Do not have other Commercial Bank Account only M-Pesa
73 22.13
Total 329 100.0
Figure 4.11: Primary Account operated Account after M-Pesa
350300250200150100
500
M-PESA Other Do not have Commercial other
Bank Commercial Account Bank
Account
I Frequency
l Percent
Total
After performing a Chi-square test. Chi squared equals 7.387 with 2 degrees of
freedom. The two-tailed P value equals 0.0249. By conventional criteria, this difference
is considered to be statistically significant. This finding therefore shows that M-Pesa has
47

indeed had a significant impact on the banking industry. It shows that most Kenyans
w hether banked or unbanked have decided to operate M-Pesa as their primary cash
account. This is probably w hat has led some leading commercial banks to seek
partnership with M-PESA to launch new products into the market that can assist them
leverage on the dominance of M-Pesa in the market. Examples of this are Equity Bank in
partnership with Safaricom recently launched M-KESHO a product that allows M-PESA
users gain credit facilities of up to Kshs. 5.000/- through Equity Bank.
b) Use of M-PESA for various financial services
The purpose of this analysis was to establish the impact M-Pesa has had on various
financial services.
Table 4.9: Frequency of using M-PESA for various financial serv ices
Daily(%)
Weekly<%)
Monthly(%)
Rarely (%) '
Never(%)
Total Ranking
Sendmoney
10.0% 41.6% 41.0% 7.4% 0.0% 100.0% 1
Withdrawmoney
10.0% 35.9% 33.4% 18.5% 2.2% 100.0% 2
Buyairtime
26.6% 28.0% 11.6% 30.5% 3.3% 100.0% 3
Pay bills 4.3% 2.7% 44.4% 12.2% 36.4% 100.0% 4Buy goods - 11.2% 15.3% 16.4% 57.1% 100.0% 5
Figure 4.12: Frequency of using M-PESA for various financial services
48

■ Daily (%)
■ Weekly (%)
■ Monthly (%)
■ Rarely (%)
■ Never (%)
Based on the finding above it is obvious that sending and receiving money combined
account for more than half of all M-Pesa transactions which implies that M-Pesa is still
primarily used as a money transfer service rather than to buy goods or pay bills.
Therefore the latter two represent potential areas that M-Pesa should focus to grow in
future in order to capture a wider market.
c) Average amount of money transferred in a month before and after M-Pesa
was launched
The purpose of this analysis was to establish if there is a significant impact in the average
amount of money transferred in a month per user after M-Pesa was launched compared to
what was transferred before M-Pesa using other traditional money transfer services.
Table 4.10: Average amount of money transferred in a month before M-PESA
Sending Money (%) Receiving Money (%)Before M-Pesa After M-Pesa Before M-
PesaAfter M-Pesa
Less than 1.000
9.7 13.7 16.1 9.7
49
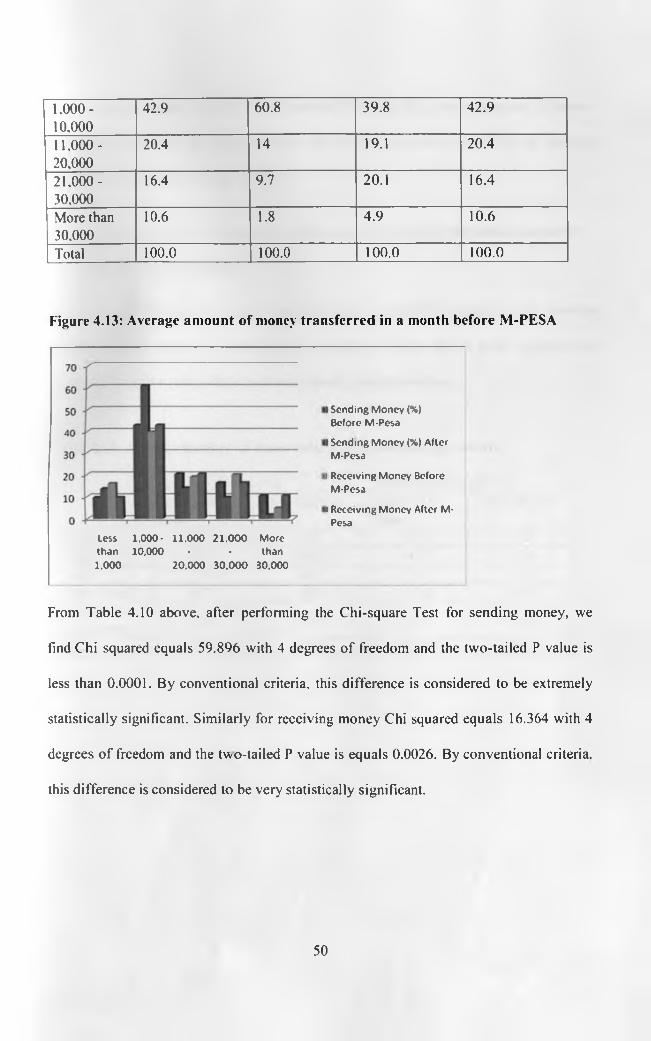
1.000-10.000
42.9 60.8 39.8 42.9
11.000-20.000
20.4 14 19.1 20.4
21.000-30.000
16.4 9.7 20.1 16.4
More than 30.000
10.6 1.8 4.9 10.6
Total 100.0 100.0 100.0 100.0
Figure 4.13: Average amount of money transferred in a month before M-PESA
Less 1,000- 11.000 21.000 Morethan 10,000 - - than1.000 20.000 30.000 30.000
I Sending Money (%)Before M-Pesa
I Sending Money (%) After M-Pesa
i Receiving Money Before M-Pesa
i Receiving Money After M- Pesa
From Table 4.10 above, after performing the Chi-square Test for sending money, we
find Chi squared equals 59.896 with 4 degrees of freedom and the two-tailed P value is
less than 0.0001. By conventional criteria, this difference is considered to be extremely
statistically significant. Similarly for receiving money Chi squared equals 16.364 with 4
degrees of freedom and the two-tailed P value is equals 0.0026. By conventional criteria,
this difference is considered to be very statistically significant.
50

This therefore implies that after the advent of M-Pesa. the average amount of money
transferred per month per respondent has significantly increased especially for amounts
between Kshs. 1,000/-to Kshs. 10.000/-
a) Average number of times in a month money is transferred before and after
M-Pesa was launched
The purpose of this analysis was to establish if there is a significant impact in the average
number of times money is transferred in a month per user after M-Pesa was launched
compared to before using other traditional money transfer services.
Table 4.11: Average number of times money is transferred in a month
Sending Money (%) Receiving Money (%)Before M- Pesa
After M-Pesa Before M- Pesa
After M-Pesa
Never 5.2 1.5 6.7 1.2Once 52.9 14.9 41.3 13.4Twice 17.0 16.7 13.1 14.3Three times 6.7 10.9 17.6 16.1More than three times 18.2 55.9 21.3 55.0
Total 100.0 100.0 100.0 100.0
51

Figure 4.14: Average number of times money is transferred in a month
0Never Once Twice Three More
times than
■ Sending Money (%) Before M-Pesa
■ Sending Money (%) After M-Pesa
■ Receiving Money (%) Before M-Pesa
■ Receiving Money (%) After M-Pesa
threetimes
From Table 4.11 above, after performing the Chi-square Test for sending money, we
find Chi squared equals 109.287 with 4 degrees of freedom and the two-tailed P value is
less than 0.0001. By conventional criteria, this difference is considered to be extremely
statistically significant. Similarly for receiving money Chi squared equals 78.543 with 4
degrees of freedom and the two-tailed P value is equals 0.0001. By conventional criteria,
this difference is considered to be extremely statistically significant
The results above indicate that the number of times the respondents have transferred
money in a month has increased significantly after the introduction of M-Pesa.
4.3.4 Social Impacts
Under social impacts the following criteria were considered:
a) Beneficiaries of M-Pesa money transfers
b) Reasons for using M-Pesa
c) Money transfer methods used before and after M-Pesa
d) Geographical distribution of M-Pesa money transfers
52

a) Beneficiaries of M-Pesa money transfer
The purpose o f this analysis was to establish the impact M-Pesa has had in social well
being of Kenyans by establishing the most frequent beneficiaries of M-Pesa money
transfer.
Table 4.12: Most Frequent M-PESA Beneficiaries
Veryoften(%)
Often(%)
Occasionally(%)
Rarely (%) '
Never(%)
Total(%)
Ranking
Parents 30.4 29.5 26.1 6.1 7.9 100% 1Spouse 25.8 21.9 20.7 11.5 20.1 100% 2Friends 10.3 11.9 43.8 24.6 9.4 100% 3Relatives 9.4 9.7 43.5 24 13.4 100% 4Children 11.6 16.4 19.1 17.9 35 100% 5BusinessPartners
5.5 13.4 21.5 24.3 35.3 100% 6
Figure 4.15: Most Frequent M-PESA Beneficiaries
■ Very often (%)
■ Often (%)
■ Occasionally (%)
■ Rarely (%)
■ Never (%)
The above finding shows that the most frequent beneficiaries of M-Pesa money transfers
are direct family dependents such as parents, spouses and children who perhaps are still
53

living in the remote rural areas but depend on the respondents to send them money for
their economic and social upkeep.
b) Reasons for using M-Pesa
The purpose of this analysis was to establish the most frequent reasons for the transfer of
money using M-Pesa.
Table 4.13: Most Frequent Reasons for M-Pesa Money Transfers
Mean Std. Deviation RankingBuying Airtime 2.304 1.20922 1Savings for emergency
3.3435 1.29043 2
Fund raising 3.4195 1.18439 3Paying Bills 3.6413 1.3086 4Paying school fees 3.7842 1.49356 5Paying debts 3.8267 1.23111 6Buying goods 4.1094 1.22482 7Paying employees 4.2158 1.20426 8
54

Note: The higher the mean or standard deviation the less the frequency. This means that
buying airtime, having savings for emergencies, fund raisings and paying bills were the
top reasons for money transfers. This implies that M-Pesa has had an impact in the social
lifestyle of many Kenyans who no longer feel the need to physically attend fund raisings,
or go to the shop to buy airtime or visit the bank or SACCO to put their savings. They
have now resulted to using M-Pesa in the comfort of their homes or work place and still
do all the above social activities.
c) Money transfer methods used before and after M-Pesa
The purpose of this analysis was to establish the impact M-Pesa has had on traditional
money transfer methods that were used before M-Pesa.
Table 4.14: Money transfer service used before M-PESA
Veryoften(%)
Often(%)
Occasionally(%)
Rarely (%) '
Never(%)
Total(%)
Ranking
Money order 19.1 24.3 28.9 9.4 18.2 100% 1Direct deposit into bank
18.2 22.8 23.7 8.8 26.5 100% 2
Buses/Matatus 14 15.8 18.3 19.1 32.8 100% 3Cheques 10.3 9.1 30.7 15.2 34.7 100% 4Family/ friends 9.1 22.9 23.7 26.1 18.2 100% 5Posta pay 7.3 17.9 35.9 19.1 19.8 100% 6Western Union 2.1 13.4 16.4 13.1 55 100% 7
Figure 4.17: Money transfer serv ice used before M-PESA
55

■ Very often (%)
■ O ften (%)
■ O ccasionally (%)
■ Rarely (%)
■ N ever (%)
Table 4.15: Money transfer service used after M-Pesa
Very often (%)
Often(%)
Occasionally(%)
Rarely(%) '
Never(%)
Total(%)
Ranking
M-Pesa 66.7 17.3 9.1 3.9 3 100% 1Direct deposit into bank
18.2 30.4 21.3 8.5 21.6 100% 2
Cheques 7 18.2 31 9.1 34.7 100% 3Money Order - 7.3 31 30.7 31 100% 4Family/Friends - 11.6 21.3 28.5 38.6 100% 5Zap 5.8 7.9 17.9 20.7 47.7 100% 6Buses/Matatus 0.6 10.3 17.7 23.1 48.3 100% 7Posta Pay - 4.3 23.1 38 34.6 100% 8Western Union 12.2 10 4.5 14.3 59 100% 9
Figure 4.18: Money transfer service used after M-Pesa
■ V e ry o ften (%)
■ O ften (%)
i O ccasionally (%)
■ R are ly (%)
■ N ever (%)
56

After performing a Chi-square test for the above, the average Chi squared equals 84.668
with 4 degrees o f freedom. The two-tailed P value is less than 0.0001. By conventional
criteria, this difference is considered to be extremely statistically significant. The social
implication o f this finding is that indeed M-PESA has revolutionized money transfer
services in Kenya and within a short span of time it has become by far the predominant
and preferred mode of money transfer compared to all the other modes used previously.
We can therefore infer that M-PESA has also dramatically had an impact to the lifestyle
of Kenyans in terms of transferring money from one place to another.
a) Geographical distribution of M-Pesa money transfers
The purpose of this analysis was to establish which geographic regions in Kenya have
been impacted the most by M-Pesa and also establish if there is a significant difference of
M-Pesa money transfers between regions.
Table 4.16: Where money is sent to most often
Mean Std. Deviation RankingWithin Nairobi 1.8663 1.03021 1Rift Valley Region
2.0462 1.52525 2
Central Region 2.2584 1.49699 3Western Region 2.3617 1.46291 4Coastal Region 2.8207 1.30713 5Eastern Region 2.8906 1.21482 6North Eastern Region
4.0638 1.35437 7
57

Figure 4.19: Where money is sent to most often
Table 4.17: From where money is received most often
Mean Std. DeviationRanking
Within Nairobi 1.696 0.97781 1
Central Region 2.3222 1.37691 2
Rift Valley Region 2.3708 1.25761 3
Western Region 2.4316 1.42143 4
Coastal Region 2.8632 1.22828 5
Eastern Region 3.0426 1.13616 6
North Eastern 7
Region 4.4833 1.099
58

Figure 4.20: From where money is received most often
North Eastern Region
Eastern Region
Coastal Region
Western Region
Rift Valley Region
Central Region
Within Nairobi
0 1 2 3 4 5
■ Std. Deviation
■ Mean
Note: The higher the mean or standard deviation the less the frequency. From Table 4.17
above, after performing a Chi-Square test for both receiving and sending money, the
average Chi squared equals 1.500 with 6 degrees ot freedom. The two-tailed P value
equals 0.9595. By conventional criteria, this difference is considered to be not statistically
significant
The social implication of this is that there is no significant difference between money
transferred between various geographical regions regardless ot population size, distance
or any other factor. This implies that M-Pesa is used equally in all geographical regions
within Kenya.
4.3.5 Other Findings
Under this section we considered other significant findings that could not be directly
attributed to both economic and social impacts. These included:
59

a) Motivation for Using M-Pesa
b) Common Problems Encountered by M-Pesa Agents
c) Common Problems Encountered by M-Pesa Users
d) New Services the users want M-PESA to introduce
a) Motivation for Using M-Pesa
The purpose of this analysis was to establish some of the key motivations behind why
Kenyans have embraced M-Pesa in a very big way.
Table 4.18: Motivation for using M- PESA
Mean Std. Deviation Ranking
Convenience 1.4195 .52416 1
Readily available 1.5441 .66169 2
Secure 1.7842 .81090 3
Faster 1.6231 .88907 4
Cheaper 2.0030 1.04034 5
60

Figure 4.21: Motivation for using M- PESA
■ Std. Deviation
■ Mean
0 0.5 1 1.5 2 2.5
Note: The higher the mean or standard deviation the less the frequency. This therefore
means in general the respondents agreed that all the factors put forward to them were
some of the reasons as to why they use M-PESA. However interestingly enough
convenience came out as the most important reason and cost actually came last which
could imply that users would be willing to pay a bit more for the same or even better
something which Safaricom could explore.
b) Common Problems Encountered by M-Pesa Agents
The purpose of this analysis was to establish some of the common problems encountered
by M-Pesa agents and by so doing identify key areas that would require improvements.
Table 4.19: Most Common Problems encountered by the agents
Mean Std. Deviation Ranking
Technical problems 1.5319 0.65445 1
Cheaper
Faster
Secure
Readily available
Convenience
61

Customer awareness 2.766 0.7861 2
Tedious record keeping 2.8511 0.72167 3
Security 3 0.72232 4
Cash float 3.4894 0.58504 5
M-PESA agent support 3.8511 0.6248 6
Note: The higher the mean or standard deviation the less the frequency. This implies that
mobile banking being a new technology that is fast evolving is still a long way from
maturity and hence why it faces a lot of technical problems. Mobile operators,
government, research institutions and even universities need to invest more time and
resources in researching and developing this highly potential and lucrative technology so
that it can mature and bring even greater benefits to all Kenyans.
62
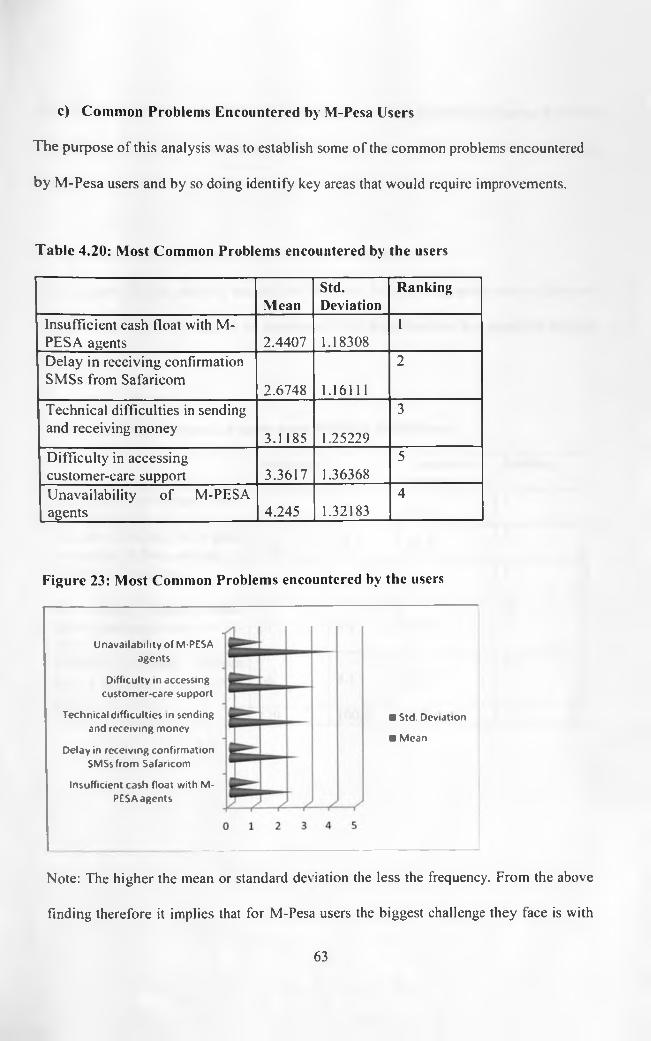
c) Common Problems Encountered by M-Pesa Users
The purpose of this analysis was to establish some of the common problems encountered
by M-Pesa users and by so doing identify key areas that would require improvements.
Table 4.20: Most Common Problems encountered by the users
MeanStd.Deviation
Ranking
Insufficient cash float with M- PESA agents 2.4407 1.18308
1
Delay in receiving confirmation SMSs from Safaricom
2.6748 1.16111
2
Technical difficulties in sending and receiving money
3.1185 1.25229
3
Difficulty in accessing customer-care support 3.3617 1.36368
5
Unavailability of M-PESA agents 4.245 1.32183
4
Figure 23: Most Common Problems encountered by the users
Unavailability of M-PESA agents
Difficulty in accessing customer-care support
Technical difficulties in sending and receiving money
Delay in receiving confirmation SMSsfrom Safaricom
Insufficient cash float with M- PESA agents
■ Std. Deviation
■ Mean
Note: The higher the mean or standard deviation the less the frequency. From the above
finding therefore it implies that for M-Pesa users the biggest challenge they face is with
63

regard to insufficient cash float with M-Pesa agents which is slightly different from the
top challenges that were mentioned by M-Pesa agents above. This implies that Safaricom
should look at better ways of increasing the cash float for M-Pesa agents.
d) New Services the users want M-Pesa to introduce
The purpose of this analysis was to find out from M-Pesa customers some of the new
services that they would like to be introduced by M-Pesa that they feel would be of great
value in their lives.
Table 4.21: New Services the users want M-PESA to introduce
FrequencyPercent
CumulativePercent
Ranking
Pay interest on money saved on M-Pesa 117 35.6 90.9 1
Transfer of money from bank account to M-Pesa account 110 33.4 55.3 2
Offer credit facilities 72 21.9 21.9 3
Earn loyalty (Bonga) points for transactions made on M- Pesa
16 4.9 100.04
Transfer of money between bank accounts from your phone
14 4.3 95.15
Total 329 100.0 100
64

Figure 4.24: New Services the users want M-PESA to introduce
Some o f the new services mentioned above have already been addressed by Safaricom in
very recent months. The launch of M-KESHO a credit facility in partnership with Equity
Bank that now allows registered M-Pesa users to borrow amounts up to Kshs, 5.000/- has
already been implemented and as anticipated well received by M-Pesa customers.
Another that was recently introduced is Bonga Points that Sataricom launched that allows
M-Pesa users to earn loyalty points for every M-Pesa transaction they make. Still other
improvements that have been made is the ability to transfer money directly from your
bank account from certain banks that Safaricom has partnered with such as Equity Bank.
Co-operative Bank of Kenya and Barclays Bank.
65

4.3.6 Discussion
In light o f all the above findings when we compare with what we have in the literature
review, we certainly see some commonalities and some disparities. Under economic
impacts for instance, based on our findings we were able to confirm that indeed M-Pesa
is indeed now by far the most preferred mode of money transfer in Kenya compared to
other money transfer services as was deduced by Omwansa (2009). However, contrary to
what Omwansa (2009) had suggested, it was also discovered that the reason for the
popularity of M-Pesa is largely due to convenience rather than cost. This is a significant
finding as it implies that Kenyans are willing to pay more for innovative services such as
M-Pesa that can make their lives more convenient. It was also confirmed that M-Pesa
indeed has become more popular than even commercial bank services and has had a
significant impact on the banking industry. Indeed many banks have since realized this
and are finding ways to partner with M-Pesa in order to remain relevant in the market,
examples are Equity Bank. Co-operative Bank of Kenya. Family Finance Bank etc...
Also under economic impacts, it was confirmed that M-Pesa has significantly increased
the monthly income of those who have adopted M-Pesa as a business with most M-Pesa
agents reporting to have earned an average of Kshs. 50.000/- and more from M-Pesa.
These earnings are very significant given that according to the National Income
Distribution survey done by Kenya Bureau of Statistics estimates that 80% ot Kenyans
earn less than Kshs. 10,000/- per month. From the findings it was confirmed that by far
the majority of M-Pesa users are in the low to medium income bracket which is
consistent with what was suggested in the literature review by Morawczynski (2009).
66

Still under economic impacts it was discovered that since the advent of M-Pesa the
number of person to person money transfer transactions and even the average amounts
transferred in month from person to person has significantly increased which implies by
extension that M-Pesa has actually contributed to stimulating rapid economic growth in
the country.
Under social impacts, from the above findings it was discovered that M-Pesa is just as
popularly and widely used in the urban areas like Nairobi as it is in the rural areas,
contrary to what was suggested in the literature review by Morawczynski (2009) that
most M-Pesa transactions are due to urban workers sending money to their loved ones
still living in the rural areas. This is a significant finding as it implies that M-Pesa is not
only used to transfer money to families leaving in the rural areas but also as a preferred
mode of payment even within the urban areas. However it was also confirmed that indeed
the majority of M-Pesa users send and receive money from their direct family members
such as parents, spouses and children which is consistent with the study done by
Morawczynski (2009) as highlighted in the literature review.
Still under social impacts, the popularity of M-Pesa based on the findings was found to be
more or less equally distributed among users of the age between 20 to 50 years. This is
contrary to what was suggested in the literature review' by Morawczynski (2009) that M-
Pesa is mainly popular among the youth, which is generally assumed to be people of the
ages 35 years and below'. Not mentioned in the literature review, his study also
discovered that M-Pesa has been equally adopted by both men and women, whether
67
single or married with no significant difference in either group. It was also continued
based on the research done by Omwansa (2009) that most M-Pesa transactions occur at
the beginning and at the end of the month when most users have been paid and need to
send money to their loved ones which is consistent with the social lifestyle of Kenyans
where most economic activities occur during the beginning and the end of the month.
Also consistent with the findings by Morawczynski (2009) is that majority o f M-Pesa
users and even the M-Pesa agents cited lack of adequate cash float and technical
problems as the two major challenges they face when using M-Pesa. Safaricom as a
company w ill seriously need to look at addressing these two problems if they are to keep
their customers delighted.
New findings were also discovered from this study that are not directly related to
economic or social impacts but also have never been previously discussed in other similar
academic studies. Some of them include the fact that M-Pesa customers expressed a
strong desire to earn interest on their M-Pesa balance, be able to transfer money from M-
Pesa to their bank account and also be able to access credit facilities using M-Pesa.
Safaricom as a company has already attempted to address two of these needs by
partnering with some of the leading banks such as Equity Bank. Co-operative Bank of
Kenya and others. Recently Safaricom and Equity Bank launched a joint product dubbed
M-KESHO that allows registered M-Pesa users to borrow up to Kshs. 5.000/- using M-
Pesa. Safaricom has also introduced the ability to earn redeemable loyalty *Bonga’ points
on your M-Pesa account.
68

CHAPTER FIVE
SUMMARY, CONCLUSION AND RECOMMENDATIONS
5.1 Summary
In summary, the objective of this study was to research on the economic and social
impacts of M-Pesa on the Kenyan society. This study was able to establish through a
survey done via questionnaires to M-Pesa users and M-Pesa agents, that M-Pesa as a
form of mobile money transfer service has been a huge success in Kenya and has
transformed many lives both economically and socially. The achievements made so far
with M-pesa are just the beginning and there is still a lot ot potential for growth in mobile
banking in Kenya to attain even greater economic and social benefits.
5.2 Conclusion
In conclusion, this study has achieved its objectives to discover the economic and social
impacts of M-Pesa on the Kenyan society by surveying a representative sample of M-
Pesa users and a number of M-Pesa agents. It was found that M-Pesa is now indeed by far
the most preferred and dominant money transfer service in Kenya and has actually had a
huge impact in the number and average amount of person to person money transfers. It
was also discovered that M-Pesa has had significant economic impact to many low to
medium income Kenyans who are able to get some significant additional income by
becoming M-Pesa agents and earning commissions from it as a livelihood. It was also
found that M-Pesa has had various social impacts as it has enabled many Kenyans to be
69

able to send money to their loved ones both family and friends regardless of where they
live in Kenya meaning they are no longer constrained by distance.
5.3 Recommendations
Safaricom and the banks who they have partnered with to offer services like automatic
teller machine withdrawal, buying goods using the service, paying bills and debts should
do a thorough market sensitization and advertisement as the customers are not fully aware
and familiar with these service. A majority of them do not understand how to use them
and some of the numbers which are given by organizations to be used to pay bills are so
many such that the customers may confuse the numbers and in the process lose their
money.
There should be a ceiling in which the M-Pesa agents should have the cash float (money
deposited in the bank to facilitate M-Pesa customer transactions) so that they by the time
the float becomes insufficient they will have deposited some money in order to increase
their float thus having constant float for the customers to transact. In order for the
customers not to lose their money whenever they send their money to the wrong number,
the company should work on a legal framework which will ensure that the recipient can
be prosecuted it they withdraw the money or whenever they transact in their account, the
money is deducted and the other person is refunded.
Safaricom could also make the features of using the service more user friendly so that
neither the users nor the agents suffer from the technical problems while using the
70

serv ice. The company should also introduce other schemes of rewarding the customers
for their continued loyalty as suggested by the users like paying interest on money saved
on M-Pesa. transfer of money from bank account to M-Pesa account and offering credit
facilities
5.4 Recommendations for Further Research
The study confined itself to only one company offering mobile banking although there
are other companies in Kenya such as Zain with Zap. Essar with YU Cash and now most
recently Telkom Orange offering the same service. This research therefore should be
replicated in the other mobile service companies and the results be compared so as to
establish whether there is consistency among the mobile service companies. Also this
study was confined to a quantitative research but perhaps a qualitative research could also
be undertaken.
5.5 Limitations of the study
This study was based on a sample limited to only one mobile banking company. It did not
cover other mobile banking companies. The scope and depth of study was also limited
by the time factor and financial resource constraints. This put the researcher under
immense time pressure. The researcher also encountered immense problems with the
respondents' unwillingness to complete the questionnaires promptly. Some of them kept
the questionnaires for too long, thus delaying data analysis.
71

REFERENCES
Gikunju, W. (2009, September). M-pesa catches on fast but studies on its impact are
scanty. Business Daily.
Hughes, N. (2009). Retrieved August 2009, from Africa Telecom News:
http://www.africantelecomsnews,com
Hughes. N„ & Lonie, S. (2007). M-PESA: Mobile Money fo r the Un-banked.
Joseph. M. P. (2008). The Case of M-PESA in Kenya., (p. Mobile Banking & Financial
Services Africa). Johannesburg. South Africa.
Kabbucho. K., Sander, C., & Mukwana. P. (2003). Money Transfer Systems: The
Practice and Potential fo r Products in Kenya.
Kinyua. J. (2009). Permanent Secretary Treasury. A Political Kenya.
Ndungu, P. N. (2009). Governor o f the Central Bank of Kenya. Financial Services
Deepening.
Omwansa, T. (2009). M-PESA: Progress and Prospects.
Owens, J„ & Bantug-Herrera, A. (2006). Catching the Technology Wave: Mobile Plume
Banking and Text-A-Payment in the Phillipines.
Pickens, M. (2006). The World Bank. Vodafone Group Foundation and United Nations
Foundation Report. South Africa: CGAP.
72

Pickens, M. (2009). Can M-PESA work for microfinance clients? International
Telecommunications Union Publication.
Safaricom. (2009). Safaricom Financial Results. Nairobi: Safaricom.
Starita, L. (2009). Mobile Cash Transfers Pose Threat to Banks.
Tiwari. & Buse. (2006). Customer on the Move: Strategic Implications o f Mobile
Banking fo r Banks and Financial Enterprises.
Tiwari. & Buse. (2006). Mobile Banking as a Business Strategy: Impact o f Mobile
Technologies on Customer Behaviour and its Implications for Banks.
Tiwari, & Buse. (2007). Mobile Services in Banking Sector: the Role of Innovative
Business Solutions in Generating Competitive Advantage. International Research
Conference on Quality, Innovation and Knowledge Management, (pp. 886-894).
New Delhi.
Tiwari, & Buse. (n.d.). The Mobile Commerce Prospects: A Strategic Analysis of
Opportunities in the Banking Sector. Hamburg University Press.
Vaughan, P. (2008). Providing the Unbanked with Access to Financial Services: The
Case of M-PESA in Kenya. Mobile Banking & Financial Services Africa.
Johannesburg, South Africa.
73

APPENDICES
M-PESA USERS QUESTIONNAIRE
1.
2.
S ex Male □ Female
A r e you m a rr ied ? Y es□
3 . A g e
Below 20
20-30
31-40
41-50
50 and above
4 . P la ce o f r e s i d e n c e _________________________________
5 . P la ce o f r e s id e n c e o f sp o u s e /c h ild r e n ______________
6 . In com e
□Below Ksh. 10.000
Ksh. 10.000-K sh . 30.000
Ksh. 31.000-K sh . 50.000
Ksh. 5 1 .0 0 0 -Ksh. 70.000
Ksh. 71,000 and above
7. Do you o p era te a co m m ercia l b a n k account ? es
□□□□
□□□□□
nQ8. If yes, w h ich account d o you o p e r a te m ore freq u en tly?
M-Pesa Other | |
74

9. As an M-Pesa user, w hat makes you use M-PESA? (Tick one for each choice)
S tro n g ly
A g ree
A g ree N ot sure D isagree S tro n g ly
D isa g reeC o n v e n ie n c e
R e a d ily A v a ila b le
S e c u r e
F a s t e r
C h e a p e r
A n y o th er (p lease
s p e c ify )
10. H ow often d o y o u u se the follow ing M -P e sa serv ices? (T ick o n e fo r each ch o ice)
D a ily W eek ly M on th ly R arely N ev er
S e n d M on ey
W ith d ra w M o n ey
B u y airtim e
P a y B ills e .g . KPLC
B u y G oods
A T M W ith d raw al
A n y o th er (p lease
sp ec ify )
11. W hom do y o u sen d m oney to via M -P e sa ? (T ick on e for e a c h ch oice)
V ery O ften O ften O cca sio n a lly R arely N ev er
S p o u se
P aren ts
C h ild ren
R elatives
F riends
B usiness P artners
A ny o th er (p lea se
sp ecify)
12. W h at do y o u use M -P E SA for? (T ic k on e for each ch o ice)
V ery O ften O fte n O cca s io n a lly R arely N ev er
Paying S ch ool Fees
B uying G ood s
Paying E m ployees
Paying B ills e .g .
KPLC
Buying A irtim e
75

F u n d r a is in g e.g .
f u n e r a ls , w e d d in g s
P a y in g d e b ts e.g .
b a n k lo a n . S A C C O .
-V frn m n *S a v in g s for
E m e r g e n c y
A n y o th er (p lea se
s p e c i fy )
1 3 . B efo re M -P esa w h ich loca l m on ev tr a n s fe r serv ice did v o u u se? (T ick one fo r each
c h o ice )V ery O ften O ften O cca sio n a lly R arely N ev er
P o s ta Pay
M o n e y O rd er
B u se s /M a ta tu s
F a m ilv /F r ie n d s
C h e q u e s
W e ste r n U n io n
D ir e c t d ep o sit in to
b a n k a ccou n tA n y o th er (p lea se
sp e c ify )
14. C u rren tly w h ich loca l m on ey tra n sfer serv ice do vou use? (T ic k one for each c h o ice )
V ery O ften O ften O cca sio n a lly R arely N e v e r
M -P esa
Z a p (Z ain )
P o sta Pay
M o n ey O rd er
B u ses/M a ta tu sF am ily /F rien d s
C h eq u es
W estern U nion
D irect d ep o sit into
bank a cco u n tA ny o th er (p lease
specify)
15. W h ere do you send m oney? (T ick o n e fo r each ch oice)
V ery O ften O ften O cca s io n a lly R arely N ev er
W ith in N airob i
W estern R egion
76

C e n t r a l R e g io n
C o a s t a l R e g io n
E a s t e r n R e g io n
R i f t \ a l le y R eg io n
N o r t h E a s te r n
—R £ U if in _ _A n y o t h e r (p le a se
s p e c i f y )
1 6 . F r o m w h ere d o v o u receive m on ey? (T ic k o n e for ea ch ch o ice )
V e r y O ften O ften O ccasion a lly R arely N ever
W i t h in N a ir o b i
W e s t e r n R eg io n
C e n t r a l R eg io n
C o a s t a l R e g io n
E a s t e r n R e g io n
R i f t V a lle y R eg ion
N o r t h E a ste r n
R e g io n
A n y o th e r (p lea se
s p e c i f y )
1 7 . B e fo re M -P E S A . w hat w as the a v e r a a e am ount o f m o n ey th a t you tra n sferred in a
m o n th ? (T ick o n e fo r each ch o ice)
L ess th an
K sh. 1.000
K sh. 1 .000
- K sh .
10,000
K sh. 11.000 -
K sh. 20 .000
Ksh.
21.000 -
Ksh.
30.000
M o re
th a n K sh.
3 0 ,0 0 0
S e n d in g M o n ey
R e c e iv in g M on ey
18 . A fter M -P E S A . w hat w a s the a v e r a g e am ount o f m on ey that you tra n sferred in a
m o n th ? (T ick one for each ch oice)
L ess th an
K sh. 1,000
K sh . 1.000
K sh.
10 .000
K sh . 11 ,000 -
K sh . 20 .000
Ksh.
21.000 -
Ksh.
M o re
th a n K sh .
3 0 ,0 0 0
S en d in g M on ey
R e c e iv in g M oney
77

1 0 . B e fo re M -P E S A . w h a t w as th e a v era g e n u m b er o f t im e s th a t v m i t r a n s f e r r e d m n n e v in
a m o n th ? (T ick o n e fo r each ch o ice )
N e v e r O nce T w ice T h ree
tim es
M ore
than
T hree
S e n d in g m o n ey
R e c e iv in g m o n ey
11 . A fte r M -P E S A . w hat w as th e av era g e n u m b er o f tim es that y o u tra n sferred m oney in a
m o n th ? (T ick o n e fo r each ch o ice)N ev er O nce T w ice T hree
tim es
M ore
than
T h ree
S e n d in g m on ey
R e c e iv in g m o n ey
12. W h ich p ro b lem s h a v e you en co u n tered w h en u sin g M -P esa ? (T ick one fo r each c h o ice )
V ery O ften O ften O cca s io n a lly R arely N e v e r
In su ffic ie n t cash
f lo a t w ith M -P esa
a g en ts
D elay in rece iv in g
c o n firm a tio n SM Ss
from Safaricom
T ech n ica l d ifficu lties
in sen d in g and
receiv in g m oney
U n ava ilab ility o f M -
Pesa agentsD ifficu lty in
accessing cu sto m er-
care su p p ort
78
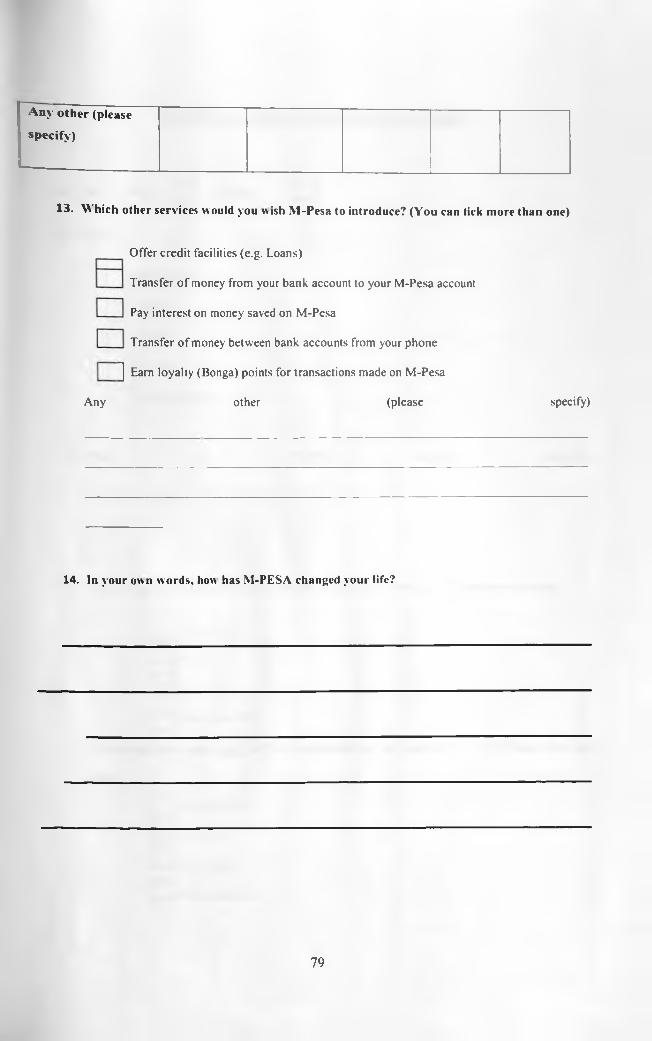
A n y o t h e r (p le a se
s p e c i f y )
1 3 . W h ic h o th er se r v ic e s w ou ld y o u w ish M -P e sa to in trod u ce? (Y o u can tick m ore than o n e)
Offer credit facilities (e.g. Loans)
Transfer o f money from your bank account to your M-Pesa account
Pay interest on money saved on M-Pesa
Transfer o f money between bank accounts from your phone
j] Earn loyalty (Bonga) points for transactions made on M-Pesa
Any other (please specify)
14 . In y o u r ow n w o r d s , how has M -P E S A ch an ged y o u r life?
79

□ □
□□
□
M-PESA AGENT’S QUESTIONNAIRE
1 1 . S ex Male | | Female □1 2 . A g e
Below 20
20-30
31-40
41-50
50 and above
1 3 . P la ce o f M -P e sa b u sin ess o p era tio n
1 4 . O n a v era g e how m a n y M -P E SA cu sto m ers do you serv e per d ay? (P lease tick one o n ly )
Q□
Less than 10
1 0 -5 0
5 0 -1 0 0
More than 100
15. O n av era g e how m an y new M -P E SA cu sto m ers d o you reg ister in a d ay? (P lea se tick one
o n ly )
□□□
Less than 10
1 0 -5 0
5 0 -1 0 0
More than 100
80

6. VN hat is the frequency of M-Pesa money transfers during the following periods? (Tick
o n e fo r ea ch c h o ice )
V ery H igh H igh A v era g e Low V ery Loss
E n d M o n th
B e g i n n i n g o f th e
M o n t hM id - M o n t h
H o l id a y s e .g .
C h r i s t m a s , E a s te r ,
1 6 . W h e n do m ost m on ey tra n sfers take p la c e ? (P lease tick one o n ly )
End Month
Mid-Month
Evenly distributed throughout the month
Holidays e.g. Christmas. Easter. School Holidays etc...
Any other (please specify)__________________________________________________
1 7 . B e fo r e M -P E S A h ow m uch incom e d id you earn on a v e r a g e , per m on th ? (P lea se tick one
o n ly )
Less than 10.000
11.000 - 20.000
2 1 .0 0 0 - 30.000
3 1 .0 0 0 - 40.000
4 1 .0 0 0 - 50.000
More than 50.000
18. A fte r M -P E S A h ow m uch ad d itio n a l incom e do you ea rn on average , per m o n th ? (P lease
tick one o n ly )
□ Less than 10.000
□□□□□□
□n
n□
81

] 11.000 - 20.000
□ 21.000-30.000
□ 31.000-40.000
□ 41.000-50.000
□ More than 50,000
1 9 . W h a t P r o b le m s d o you en cou n ter w h en serv in g cu sto m ers? (T ick one for each c h o ice )
V ery O ften O ften O ccasion a lly R arely N ev er
T e c h n ic a l p r o b le m s
C u s t o m e r aw a ren ess
C a s h f lo a t
S e c u r i t y
T e d io u s reco rd -
k e e p in gM - P E S A A g en t
S u p p o r tA n y o th e r (p le a se
s p e c i fy )
2 0 . In y o u r ow n w o rd s, how has M -P E SA changed y o u r socia l lifesty le? If y e s , p lease ex p la in ?
82