the impact of multiple electronic learning resources on student
TRANSCRIPT

The Impact of Multiple Electronic Learning Resources on Student Academic Performance
Robert Burk, Patrick Lyons, Andrea Noriega and Dragana Polovina-Vukovic, Carleton University
Published by
The Higher Education Quality Council of Ontario
1 Yonge Street, Suite 2402
Toronto, ON Canada, M5E 1E5
Phone: (416) 212-3893
Fax: (416) 212-3899
Web: www.heqco.ca
E-mail: [email protected]
Cite this publication in the following format:
Burk, R., Lyons, P., Noriega. A., & Polovina-Vukovic, D. (2013). The Impact of Multiple Electronic Learning Resources on Student Academic Performance. Toronto: Higher Education Quality Council of Ontario.
The opinions expressed in this research document are those of the authors and do not necessarily represent the views or official polices of the
Higher Education Quality Council of Ontario or other agencies or organizations that may have provided support, financial or otherwise, for this project.
© Queens Printer for Ontario, 2013
The Impact of Multiple Electronic Learning Resources on Student Academic Performance
Higher Education Quality Council of Ontario i
ACKNOWLEDGEMENTS A number of people have assisted with this project. We would like to thank Matthew Di Giuseppe for his help in data gathering, Derek Vilim and Hilary Lee for attendance data preparation, Dr. Tak Fung for performing statistical analyses and Dr. Anthony Marini for his feedback on parts of this report. We would also like to thank HEQCO for the generous funding and HEQCO consultants Dr. Ruth Childs and Susan Elgie, whose thoughtful suggestions at the beginning of the project helped us focus our research questions. But above all, we would like to thank Dr. Burk’s Chemistry 1001 and 1002 students, who agreed to participate in the project and without whom our task would have been impossible to accomplish.
This study has received ethics approval from Carleton University's Research Ethics Committee.
The Impact of Multiple Electronic Learning Resources on Student Academic Performance
Higher Education Quality Council of Ontario ii
Table of Contents Executive Summary ............................................................................................................................................. 1
Introduction........................................................................................................................................................... 3
Research Questions ............................................................................................................................................. 4
Literature Review ................................................................................................................................................. 5
Relationship between Lecture Attendance and Academic Performance .....................................................5
Relationship between Lecture Attendance, Academic Performance and E-resources ................................5
Methodology ......................................................................................................................................................... 7
Research Participants ...................................................................................................................................7
Data Sources ................................................................................................................................................7
Attendance Data .....................................................................................................................................7
Performance Data ...................................................................................................................................7
Peer Assisted Study Sessions (PASS) ...................................................................................................7
High School Entrance Averages (GPA) ..................................................................................................8
Online Resources .........................................................................................................................................8
Internet Video on Demand (VOD) ...........................................................................................................8
Learning Management System (WebCT) ...............................................................................................8
WileyPlus ................................................................................................................................................9
Limitations of the Data ............................................................................................................................... 10
Analyses and Discussion ........................................................................................................................... 11
Fall Term (CHEM 1001) ............................................................................................................................. 11
Winter Term (CHEM 1002) ........................................................................................................................ 21
Conclusion and Recommendations ................................................................................................................... 30
References ......................................................................................................................................................... 32
The Impact of Multiple Electronic Learning Resources on Student Academic Performance
Higher Education Quality Council of Ontario iii
List of Tables Table 1: Simple Regression – Grades (Fall Term) ...................................................................................... 12
Table 1a and 1b: Hierarchical Multiple Regression Predicting Grades (Fall Term) .......................................... 15
Table 2: Simple Regression – Attendance (Fall Term) ............................................................................... 16
Table 2a: Multiple Regression Predicting Attendance (Fall Term) ................................................................ 16
Table 3: Effect of In-class Attendance Survey Compliance on Grades (Fall Term) .................................... 18
Table 4: Effect of In-class Attendance Survey Compliance on WileyPlus Score ........................................ 18 and VOD Use (Fall Term)
Table 5: Effect of Tutorial Survey Compliance on Grades (Fall Term) ....................................................... 19
Table 6: Effect of Tutorial Survey Compliance on WileyPlus Score and VOD Use (Fall Term) .................. 19
Table 7: Simple Regression Analysis – Grouped by Number of Midterm Tests ......................................... 20 Written (Fall Term)
Table 8: Simple Regression Analyses – Grades (Winter Term) ................................................................. 22
Table 8a and 8b: Hierarchical Multiple Regression Predicting Grades (Winter Term) ..................................... 23
Table 9: Simple Regression Analyses – In-class Attendance (Winter Term) .............................................. 24
Table 9a: Multiple Regression Predicting Attendance (Winter Term) ........................................................... 24
Table 10: Effect of In-class attendance Survey Compliance on Grades (Winter Term) ............................... 26
Table 11: Effect of In-class Attendance Survey Compliance on WebCT Sessions, ..................................... 26 WileyPlus Score and VOD Use
Table 12: Effect of Tutorial Survey Compliance on Grades (Winter Term) ................................................... 27
Table 13: Effect of Tutorial Attendance Survey Compliance on WebCT Mail Read, .................................... 27 Pass Total and WebCT Sessions (Winter Term)
Table 14: Simple Linear Regression Analyses – Grades and Attendance, ................................................. 28 Grouped by Number of Midterm Tests Written (Winter Term)
The Impact of Multiple Electronic Learning Resources on Student Academic Performance
Higher Education Quality Council of Ontario 1
Executive Summary Under the broad research question, “Can multiple electronic learning resources improve students’ academic performance in a large first-year General Chemistry course?”, this study examines how students used a wide range of online resources during the Fall 2011 and Winter 2012 academic terms and correlates this information with their academic success, measured by their grades on two midterms, a final exam and their final course grade. Since 1996, Professor Robert Burk has taught Carleton University’s large first-year chemistry course, CHEM 1000. The course was a full credit course and spanned the fall and winter terms. In 2010, the Department of Chemistry adjusted the curriculum and the course has since then been offered as two half-credit courses – CHEM 1001, which runs in the fall term, and CHEM 1002, which runs in the winter term. Only students who achieve a passing mark in the fall term are eligible to enroll in the winter section of the course. Course enrollment has increased from 350 in 1996 to 700 in 2011. The course is math intensive. The first part (CHEM 1001) introduces students to periodicity, gas laws, energy, atomic and molecular structure, intermolecular forces, solutions and organic chemistry. The second half of the course (CHEM 1002) includes thermodynamics, kinetics, equilibrium, acid-base chemistry, main group chemistry, transition metals, macromolecules and nuclear chemistry. The course consists of lectures three hours a week, tutorial one hour per week, and a three-hour laboratory session every two weeks. While lectures and tutorials are not compulsory elements of the course and there is no participation mark in the course evaluation, lab sections are obligatory and students can miss only one lab section without a valid reason if they wish to pass the course. However, students are strongly encouraged by the instructor to attend lectures and tutorials and actively participate in the course (e.g., ask questions, communicate with teaching assistants and the instructor frequently, do their homework and work on problem sets, etc.). Professor Burk has introduced an array of electronic resources to this large course with the intention of allowing students to individualize their learning experiences by providing materials that they can self-select and giving students the opportunity to work through homework-type material at their own pace. Depending on their learning styles and preferences, students in this course could choose to download all course information, lecture PowerPoint slides, web links of interest, videos of lab experiments or previous exams, and to communicate with their peers on the course discussion board inside the learning management system (Blackboard Campus Edition 8). They could also access recorded lectures online through Carleton University’s video on demand (VOD) service or view them on Rogers digital cable television channel 243. In addition, students could work on their homework and problem sets online inside the homework management system (WileyPlus) or use the traditional course textbook to check problem sets and solutions. Despite the many possible benefits that these rich course resources and tools may bring to students’ learning, their influence has not yet been examined in any systematic way. The study applied a series of quantitative analyses to aggregated statistical data gathered on: 1) the grades of all 919 first-year chemistry students enrolled in Robert Burk’s CHEM class over two academic terms; 2) students’ class and tutorial attendance; and 3) the frequency of students’ use of recorded lectures (video on demand), electronic tutorials and other electronic course content available via course learning management (Blackboard Campus Edition 8, referred to as WebCT in this study) and homework management (WileyPlus) systems. The objective is to explore any possible correlations between the use of any of these resources and students’ performance on two midterm tests, a final exam and the final grade obtained at the end of the course. Ordinary least square regression analyses were used to investigate the
The Impact of Multiple Electronic Learning Resources on Student Academic Performance
Higher Education Quality Council of Ontario 2
strengths of the linear associations between the dependent (e.g., total grades, total in class attendance, total tutorial attendance) and independent variables (e.g., entrance GPA, LMS hours, etc.). Stepwise regression analysis was performed on total course grades to determine significant predictors based on a set of potential predictors (e.g., final exam grade, midterm 1 grade, midterm 2 grade, etc.). Hierarchical multiple regression is used to evaluate the relationship between a set of independent variables and the dependent variable. The findings show that students did indeed use resources and tools provided by the instructor and that many of them positively correlate with students’ grades. In particular, the homework management system (WileyPlus) and learning management system (WebCT), which both contain resources and activities that encourage students to spend time on tasks, solve problems, interact with course content and interact with each other, have the most significant positive effects on grade performance. Our data also show that class attendance decreases when the course uses lecture capture (in this case, the video on demand service). However, because the course provides other types of e-resources through the learning management and WileyPlus homework systems, there is no correlation (positive or negative) of lecture attendance with student grade performance. Finally, our data suggest that instructors could look to the learning management system's extensive analytics on student activities as a proxy for student engagement. Instructors could use reports generated by the learning management system as a barometer for how connected students are to the classroom learning environment. While this research project has focused exclusively on the use of e-resources within a large first-year university General Chemistry course, we feel that a number of our findings are broadly applicable to other disciplines and may provide guidance to instructors in designing and re-designing their own courses.
The Impact of Multiple Electronic Learning Resources on Student Academic Performance
Higher Education Quality Council of Ontario 3
Introduction
Higher education has increasingly been taking advantage of internet-based tools for teaching. These tools are varied and may include websites (managed by instructors or publishers), learning management systems (or LMS, such as Blackboard or Desire2Learn), lecture capture and playback systems, homework managements systems, social media such as Facebook, Twitter and YouTube, communication media such as email, chat rooms and instant messaging systems, and web conferencing systems like BigBlueButton and Adobe Connect. The uses of such systems are also manifold and include:
The dissemination of common material such as course outlines, lecture notes and grades
Allowing students to receive primary and supplementary lecture and course materials
Allowing students to solve homework-type material at their own pace and receive personalized feedback
Rapidly fixing “errors” in previous communications or misconceptions about particular course material
Coordinating the activities of the instructors, teaching assistants, laboratory coordinators and students – everybody gets the same message at the same time
The use of these tools is especially prevalent in large undergraduate courses, where communication with hundreds of students at a time is required. It is sometimes necessary to push information to all students simultaneously, but at many other times it becomes appropriate to allow students to individualize their learning experiences by providing materials that students can self-select. Online resources can facilitate both of these objectives. Carleton University has been teaching a large General Chemistry course, CHEM 1000, at the first-year level for decades. The course was originally created as a full credit course that ran throughout the fall and winter terms. In 2010, the Department of Chemistry adjusted the curriculum and the course has since then been offered as two half-credit courses – CHEM 1001, which runs in the fall term, and CHEM 1002, which runs in the winter term. Only students who achieve a passing mark in the fall term are eligible to enroll in the winter section of the course. CHEM 1001 and CHEM 1002 are each offered in two course sections (A and V), one for on-campus and the other for off-campus students. CHEM 1001/1002 is offered to first-year students who intend to enroll in second-year chemistry. Course enrollment has increased from 350 in 1996 to 700 in 2011. The course consists of lectures three hours a week, tutorial one hour per week, and a three-hour laboratory session every two weeks. While lectures and tutorials are not compulsory elements of the course and there is no participation mark in the course evaluation, lab sections are obligatory and students can miss only one lab section without a valid reason if they wish to pass the course. However, the instructor encourages students to attend lectures and tutorials and actively participate in the course by asking questions, communicating with teaching assistants and the instructor frequently, doing their homework and working on problem sets. Beginning in 1996, two resources for students were introduced to the course, including a manually-coded HTML website, which offered students PowerPoint notes of the lectures, and video recordings of the lectures, which were distributed through a local cable television channel and via VHS tapes mailed out to off-campus students. The video recordings were introduced to compensate for the increasing size of the course and allow for a much increased student-to-teacher ratio, from a historical value of about 100 to the current value of about 700. Posting PowerPoint notes online was a novel idea at the time but soon became the norm in this and many other courses on campus. Since that time, many other resources have been added, some of which students must now use and others which are optional. The course currently offers: video recordings of every
The Impact of Multiple Electronic Learning Resources on Student Academic Performance
Higher Education Quality Council of Ontario 4
lecture and tutorial, available on demand over the internet1; materials and activities hosted in a learning
management system (Blackboard Campus Edition 8, referred to as WebCT in the 2011-2012 academic year, when this study was carried out)
2; and an online homework management system (WileyPlus) provided by the
textbook publisher.3 The course also makes extensive use of YouTube recordings of class demonstrations,
especially demonstrations of laboratory experiments, to help students prepare for their real laboratory work. In addition, students in the course have access to a Peer Assisted Studies Sessions (PASS) program
4, where
an undergraduate facilitator guides them in weekly tutorial-like exercises. Although we have added all these resources with the best intentions, we have not studied in a systematic way whether or not students really do benefit from their availability. Furthermore, we recognize that such a variety of tools and resources may even negatively affect students’ performance in the course. We thus felt it necessary to determine the effects of the use of these resources on students’ academic performance.
5 We
therefore collected data on students’ use of a number of these resources during the Fall 2011 and Winter 2012 terms and investigated whether they were correlated with students’ performance in the course.
Research Questions Our broad research question asked: is the use of multiple electronic learning resources correlated with student academic performance in a first-year chemistry course? More specifically, we wanted to determine the effects of the following variables on the final grade in CHEM 1001 and CHEM 1002:
1. Classroom attendance at both lectures and tutorials 2. Use of the video on demand (VOD) system for watching lectures and tutorials 3. Intensity of use of the homework management system 4. Intensity of use of the learning management system 5. Attendance at the peer assisted study sessions 6. High school grades
In addition, we also wanted to ask:
1. Are there correlations between lecture/tutorial attendance and the frequency of use of online resources in CHEM 1001 and CHEM 1002?
2. Does a higher level of use of e-learning resources lead to a higher level of performance on assessment tasks?
1 Students can access recorded lectures online on a dedicated video on demand website and/or from Blackboard. They can also watch
lectures on an Ottawa Rogers digital cable television channel (Rogers Channel 243), on an internet simulcast stream of the cable television channel and through on-campus viewing kiosks. 2 WebCT is an online-based learning management system that allows instructors to post course materials for students and administer
quizzes, surveys and online assignments. It also provides an interface wherein students can communicate with the instructor or other students using email, discussion boards and announcements. Students’ grades can be entered and made available to them inside the system and group activities can also be assigned. 3 WileyPlus is an interactive online homework system that allows students to access an electronic version of the course textbook and
activities that would help them understand the most important course concepts. The system has assessment capabilities that report time-on-task and measure learning outcomes. 4 See Miles et al. (2010) for more about the PASS program.
5 As measured by students’ grades (two midterms, a final exam and final grade) throughout the term.
The Impact of Multiple Electronic Learning Resources on Student Academic Performance
Higher Education Quality Council of Ontario 5
Literature Review
Relationship between Lecture Attendance and Academic Performance The research investigating the relationship between lecture attendance and academic performance is extensive (Allen & Webber, 2010; Moore et al., 2008; Newman-Ford et al., 2008; Westerman et al., 2011). While none of these articles specifically addresses the variable of classroom size, Allen and Webber (2010) and Newman-Ford et al. (2008) conducted their research with large groups of students, many of whom were in lecture (versus seminar/tutorial) classes. Gosper et al. (2010) do provide some insight into how a third variable, such as class size, might have some effect on student attendance and performance. They argue that community building is important for student engagement and suggest that face-to-face interactions typically breed this sense of community. From this, one could infer that smaller classrooms facilitate this sense of community and may therefore encourage engagement, while large classrooms may detract from a sense of community. It should be noted, however, that Gosper et al. (2010) also argue that online resources such as lecture capture can similarly aid in creating a sense of community. Many authors agree that lecture attendance has some effect on performance. Still, the nature of this relationship remains under investigation (Allen & Webber, 2010; Moore et al., 2008; Newman-Ford et al., 2008; Westerman et al., 2011). Both Newman-Ford et al. (2008) and Westerman et al. (2011) found that high-performing students were not as affected by their absenteeism as were lower-performing students. Westerman et al. (2011) also found that students with higher GPAs were less affected by missing classes before an assessment (i.e., they still demonstrated high performance on assessments in spite of a decrease in attendance) than students with lower GPAs (p. 59). Newman-Ford et al.’s (2008) findings indicate that students who attended up to 90% of the lectures only had a 25% chance of failing the course, whereas students who only attended up to 70% of the lectures had a 33.3% chance of failing. Allen and Webber’s (2010) findings also confirmed this correlation. They studied the effect that implementing an attendance policy would have on performance. Classes that originally had high attendance rates showed less increase in performance when an attendance policy was put in place than classes that originally had lower attendance rates (45). This means that attendance may not be equally influential on performance for those who attend class more frequently and those who do not. What can be concluded from this, however, is that lower attendance rates are linked to lower academic performance, especially for students with lower GPAs.
Relationship between Lecture Attendance, Academic Performance and E-resources
There has recently been a growing interest in investigating how digital and online resources relate to and affect class attendance and academic performance (Gosper et al., 2010; Knight, 2010; Morris et al., 2005; Nie et al., 2010; Perera & Richardson, 2010; Stewart & Nuttal, 2011; Traphagan et al., 2010; Von Konsky et al., 2009). Some of these studies have considered how the use of specific online resources, such as those made available through learning management systems (LMS), influence academic performance. Perera and Richardson (2010) explored the relationship between students’ academic performance and their use of online course resources in a second-year accounting class. They were interested in the time students spent online on WebCT, their use of specific WebCT resources, and how these correlated to academic performance (589). They found that although there was no significant correlation between the number of discussion board posts students read and their performance, there was a significant correlation between the number of messages
The Impact of Multiple Electronic Learning Resources on Student Academic Performance
Higher Education Quality Council of Ontario 6
they posted and their performance (597). They argue that these results reflect a difference between “passive” and “active” participation.
6
Similarly, Knight (2010) examined the use of online resources on WebCT for students enrolled in a second-year geography course. He identified two types of learning approaches: deep learning and surface learning. The results indicated that students who regularly accessed course materials through WebCT (i.e., had consistent “hit and read scores”) had higher exam scores (Knight, 2010, pp. 71-72). These types of students were categorized as employing a deep learning approach, whereas students who accessed online resources either only at the beginning of the course or only at the end of the course were categorized as surface learners (p. 71). It is interesting to note, however, that students who accessed materials only at the beginning of the course had higher final exam scores than those who accessed materials only at the end of the course. Stewart et al. (2011) discuss the relationship between class attendance and the use of the Blackboard LMS (p. 54). They found that, on average, student in-class attendance seems to decrease over the course of the semester when correlated with the use of online resources in Blackboard. The authors suggest that students leveraged online resources to compensate for their in-class absenteeism (p. 57). Students who regularly downloaded lectures, however, were also the same students who regularly attended class (p. 58). Stewart et al. found that attendance decreased as the semester went on and suggested that peaks in online use directly before class assessments could be indicative of student procrastination (p. 57). They found a moderate-large correlation between lecture attendance and performance (Ibid.). The use of online resources and performance were also correlated and tended to occur with the same students who attended class (p. 58). Their findings reveal that the use of online resources was not random but followed a pattern related to assessment (Ibid.). Stewart and al. thus conclude that “assessment appeared to be a major driver as to when the online resources were accessed” (p. 58) and suggest that “time-on-task” (p. 62) could be the key to enhancing the potential for learning in blended-learning courses. Their findings confirm that in-class attendance can predict academic success (p. 61). There has also been interest in understanding the effects of lecture capture on student in-class attendance and academic performance. Von Konsky et al. (2009) investigated the relationships between student attendance, performance and lecture-capture use for a third-year undergraduate software engineering program. Their findings showed that both attending the lectures and viewing the captured lectures were positively correlated with higher marks (p. 587). Conversely, lecture attendance alone was not a significant predictor of final marks (p. 588). Lecture capture did not seem to affect attendance, but neither attendance nor the number of lecture capture downloads were significant predictors of student performance in the course (p. 591). Similarly, Traphagan et al. (2010) studied the effects of webcasts on student attendance and performance. The study found that, while access to webcasts did seem to induce absenteeism, it had no significant negative impact on student performance (p. 34). As a result, the researchers speculated that the effects of absenteeism were nullified by the use of webcasts (p. 31). The study revealed that more frequent viewing of webcasts was related to higher performance (p. 34). However, students with webcast access did not demonstrate higher performance in general than those without (Ibid.). Traphagan et al. thus conclude that “absenteeism does not have a negative effect on performance when webcasting is available and viewed because webcasting appears to improve performance” (p. 35).
6 I.e., reading posts involves passive participation, while writing posts involves active participation.
The Impact of Multiple Electronic Learning Resources on Student Academic Performance
Higher Education Quality Council of Ontario 7
Methodology
Research Participants Research participants were 919 undergraduate students in a first-year chemistry course at Carleton University. This included 503 students from CHEM 1001 in the fall of 2011 and 416 students in CHEM 1002 in the winter of 2012. There is a slight difference between these two groups in that students in CHEM 1002 had to have passed CHEM 1001. All students enrolled in the fall and winter sections of the course (CHEM 1001 and CHEM 1002, respectively) decided to participate in the study (a recruitment rate of 100%).
7 Therefore,
there was no self-selection bias in this study.
Data Sources This study analyzes several types of data pertaining to student attendance, student performance and students’ use of online resources (including internet video on demand, use of the learning management system and the intensity of use and scores from the homework management system). The dimensions of the analysis will be outlined below.
Attendance Data Using the course’s LMS, biweekly surveys were made available for students to voluntarily report their attendance during the two-week period corresponding to the survey. The fall 2011 CHEM 1001 course and the winter 2012 CHEM 1002 course each had seven survey periods, which covered the entire semester. For each survey period, students were asked to indicate which classes and which tutorials they had attended. The incentive for completing the biweekly surveys was the chance to win a $50 credit to be added to the student’s student card (offered each survey cycle).
Performance Data Student performance in the course was measured using grades achieved on two midterms, the final exam and the final course grade. In addition, entrance grades, based on students’ high school GPA, were also used as an indicator of students’ performance prior to entry into the university (see below).
Peer Assisted Study Sessions (PASS) PASS is a series of weekly study sessions offered for select courses that provides students with study skills to help improve their grade. These sessions are voluntary and run by a student who has previously taken the course. PASS allows students to compare notes with each other, to discuss important concepts, to develop strategies for studying and to practice for tests and the final exam by writing “mock” tests. Attendance was voluntary. Students who attended PASS sessions were tracked using a sign-up sheet.
7 Members of the research team (excluding the instructor) invited students to participate in the study during the first class. The invitation,
accompanied by the letter of information and informed consent form, was also placed inside WebCT. Students could sign the consent form and bring it to the members of the research team or send their consent by email. The letter of information clearly stated that participation was voluntary and that students would be given free access to the VOD service if they chose to participate.
The Impact of Multiple Electronic Learning Resources on Student Academic Performance
Higher Education Quality Council of Ontario 8
High School Entrance Averages (GPA) The university maintains records of some Ontario students’ high school entrance averages. This data set was obtained from the university’s Office of Institutional Research and Planning (OIRP). The data set provided by OIRP contains high school entrance averages for some of the participants who attended high school in Ontario (n = 343 for CHEM 1001 and n = 259 for CHEM 1002
8). High school entrance averages were not
available for 46 students enrolled in CHEM 1001 and 21 students in CHEM 1002 who came to Carleton from provinces other than Ontario.
Online Resources
Internet Video on Demand (VOD) The course was also offered in an internet video on demand format. This is a type of lecture capture that is recorded directly in class during the lecture, delivered and made available within about an hour after the class. Students can view the lectures and tutorials as a series of video streams online. Students were required to log into the system to view the video, allowing our team of researchers to associate individual students with their activities. For each student, the system tracked which classes were viewed, the frequency of viewing, the length of time viewed, and at what date and time students viewed the class recordings. Carleton’s internet VOD service normally requires students to subscribe at a cost of $50 per course. As an incentive, students who agreed to participate in the study received this service for free for CHEM 1001/1002. For the purpose of this study, the data analysis for VOD use focused on the total amount of time students spent viewing class recordings.
Learning Management System (WebCT) The course’s LMS, WebCT, which is available to all students enrolled in the course free of charge, contained many online resources. Students were required to log into the system, allowing researchers to associate individual students with their online activities. Much like the internet VOD system, WebCT logs extensive data relating to student activity. For each student, page views, frequency of access, dates and times of access, email messages read/sent, content accessed, discussion board postings read/posted and links viewed are counted. Drawing upon the results of previous research, we decided to focus on page views, content and folders viewed and discussion board postings.
8 It should be noted that the high school entrance average data set provided by OIRP for CHEM 1002 was incomplete and was missing
data for some Ontario students. In addition, we also eliminated from our analyses students who, although registered in the course, did not complete any of the course requirements.
The Impact of Multiple Electronic Learning Resources on Student Academic Performance
Higher Education Quality Council of Ontario 9
WileyPlus WileyPlus is a proprietary online homework management system offered by textbook publisher Wiley. The publisher describes the system as an “online teaching and learning environment that integrates the entire digital textbook with the most effective instructor and student resources to fit every learning style.” It contains a series of problems and supplementary activities that are written to align with the learning outcomes of the textbook. Use of WileyPlus in both courses was voluntary and did not count towards course grades. Every student in both the fall and winter terms had free access to it, which came with the purchase of the textbook used in the course. The system provided students with individualized feedback on practice questions to help them identify potential areas of improvement. Students were required to log into the system, which allowed the research team to associate individual students with their activities. Even though the use of WileyPlus was not mandatory and this work did not count toward the final course grade, the instructor encouraged students to use it for exercises, solving problem sets and reviewing the main points from the textbook chapters each week. WileyPlus allows instructors to log into the system and track student progress, so the research team was able to use the instructor’s credentials to collect data on all students’ activities inside the system. Two data points from the WileyPlus system were used in the analysis: WileyPlus Total Progress, a measure of how much of the total available content was viewed by each student, and WileyPlus Raw Score, a performance measure that indicates success on each of the problem sets. Statistical Analyses
9
Data were extracted from each source and categorized, and meaningful variables were identified. These variables were selected on the basis of completeness, reliability and applicability to the research questions. Some data were deemed worthless, such as those concerning the computer operating systems and web browsers that students used and the number of discussion posts read inside WebCT. Both attendance and VOD data were subdivided into intervals along a timeline corresponding to the three main assessments in the course, to allow for the analysis of behavior patterns leading up to the two midterms and the final exam. Once all variables had been determined and stripped of missing data, the aggregated files were analyzed. All variables were carefully cleaned using the following procedures:
1. The frequency distributions of each variable were examined to ensure that there were no unreasonable values due to data entry errors
2. Internal consistencies of the data were tested 3. All zero values with the data sets were verified to ensure that they were truly zeroes (that is, students
did not attend a class or did not take a test) and not absent values Ordinary least square regression analyses were used to investigate the strengths of the linear associations between the dependent (e.g., total grades, total in class attendance, total tutorial attendance) and independent variables (e.g., entrance GPA, WebCT hours, etc.). This type of analysis is one of the most basic and commonly used prediction techniques. Stepwise regression analysis was performed on the final course grade to determine significant predictors based on a set of potential predictors (e.g., final exam grade, midterm 1 grade, midterm 2 grade, etc.). Since students’ final course and final exam grades are normally distributed (based on Kolmogorov-Smirnov tests), one-way analysis of variance (ANOVA) was used to determine whether there was any compliance group difference. However, for WileyPlus raw score and total
9 All statistical analyses were performed by Dr. Tak Fung, who used IBM SPSS version 20.
The Impact of Multiple Electronic Learning Resources on Student Academic Performance
Higher Education Quality Council of Ontario 10
VOD hours, which do not satisfy the normality assumption, Kruskal-Wallis tests were used instead. In addition, hierarchical or sequential regression was used to examine the “best” predictors in our analyses by placing some of the predictors into groupings or blocks of variables. This allowed for better evaluation of the relationship between variables taking into account the impact of different sets of independent variables on the dependent variable.
Limitations of the Data During the course of the data analyses, we discovered a number of challenges with the data collection and the overall data set. The most significant challenge involved inconsistencies with the attendance data set. Data for attendance were collected via biweekly self-reported surveys. While participation rates seemed high for these surveys, it became apparent after the data collection phase that students were not consistently completing the questionnaires. For example, some of the students would complete surveys in weeks one and two, but they would not for weeks three and four. At the same time, other students who did not fill in the survey in the first two weeks would decide to complete their attendance data for weeks three and four. This meant that our attendance data were incomplete, so we addressed the missing data by using survey compliance as a proxy for student engagement in the course. We therefore divided all respondents into groups depending on the percentage of the surveys they completed.
10
As previously stated, extensive data were collected by many of the systems (LMS, VOD and WileyPlus) used in CHEM 1001 and CHEM1002. Many variables from these systems were discarded as they were not pertinent to the research questions or were unfortunately erroneous. It should be noted that, while the VOD data collection was highly reliable, it was not the only means whereby students participating in the research study could view the class recordings. There were other avenues through which students could access the recordings without the research team being able to collect data. These included the television broadcast of the lectures, an internet simulcast stream of the cable television channel, and through on-campus viewing kiosks. Students could also choose to share their university login information with other students in the class. We do not believe that these are substantial issues. Since students participating in the study had free VOD access, they were unlikely to use any of the other viewing mechanisms, which were less flexible and less convenient. For example, the television broadcast occurs nearly a week after the class is recorded and requires a Rogers digital television subscription. In other words, we believe that the convenience of viewing lectures through internet VOD would decrease the likelihood of students using those other methods. An important limitation of this study is the exclusion of sociodemographic characteristics, including gender, as factors in our analyses. The reason for this exclusion is threefold. First, all students enrolled in the course – both female and male – participated in the study, so there was no gender-related self-selection bias. Second, all students enrolled in the class had equal access and opportunities to use (or not use) any of the course resources offered by the instructor. Third, since the main focus of the study was on the use of electronic resources, we did not conduct a student survey and thus did not collect the relevant data on student gender. While we acknowledge that preferences may exist in the use of particular e-learning resources according to gender difference, nationality, first language and socioeconomic status, we had to leave this type of analysis for future projects.
10
Group 1 – students who completed 0 to 25% of the attendance surveys; group 2 – 25 to 50%; group 3 – 50 to 75%; and group 4 – 75
to 100% completion.
The Impact of Multiple Electronic Learning Resources on Student Academic Performance
Higher Education Quality Council of Ontario 11
Analyses and Discussion The data are divided into two main parts, fall term (CHEM 1001) and winter term (CHEM 1002). In each part of the study, the independent variables consisted of a number of metrics from WebCT, two variables related to the use of the homework management system WileyPlus, total attendance at the PASS sessions, a student’s entrance average from high school and the total time spent watching lectures and tutorials via the VOD system. The dependent variables included the grades on midterm tests and final exams, the final course grade and attendance data. In many tables throughout this report, the standardized regression coefficient β is given for each independent variable. The magnitude of β is indicative of the predictive power of the independent variable. The sign of β indicates the direction of the correlation; positive β values indicate a positive correlation, e.g., that a higher final course grade correlated with a higher use of WebCT. The value of R
2 indicates the goodness of fit
between the dependent and independent variable. An R2 of 1.00 would indicate a perfectly linear relationship
between the two. The significance, p, is a measure of whether or not the observed correlation is statistically significantly different from 0. A p-value of less than 0.05 indicates that the observed correlation is not due to chance. In general, we have chosen to report only those correlations that were significant at this level.
Fall Term (CHEM 1001)
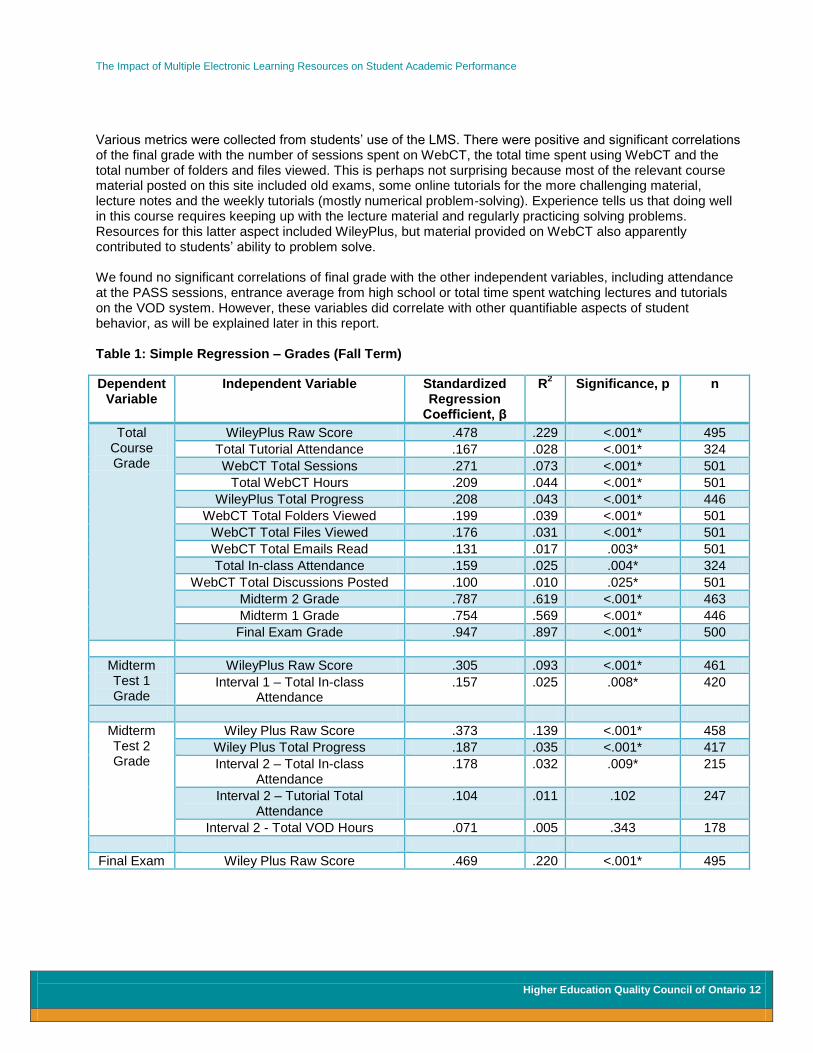
Grades Table 1 presents the results of statistical analyses examining correlations between the final course grade, midterm 1, midterm 2 and final exam grade, and the various independent variables noted above. These variables are presented in Table 1 in decreasing order of significance (i.e., the most significant correlation is at the top of the table). Significantly correlated variables included those associated with the use of WileyPlus, total attendance at lectures and tutorials, and use of WebCT.
11
These two first-year chemistry courses were partly an exercise in learning to solve problems. The midterm tests and final exam were all structured in the same way – 67% of the grade on each came from solving numerical problems. The online homework management system also consisted largely of numerical problems, many presented in a tutorial-style with feedback for incorrect answers. This gave the student ample opportunity to solve each problem before moving on to the next one. This seems to be a rather effective way of helping students learn to problem solve – the highest standard regression coefficient (which is identical to the Pearson correlation coefficient for the single predictor regression which we used) of students’ final grade was observed to be with the score obtained on WileyPlus. Also a significant predictor of students’ final grade was WileyPlus Total Progress, a measure of how many of the assigned problems students attempted using this system. Use of WileyPlus was entirely optional, but the instructor constantly suggested to students that it was in their best interest to use the system. Students who did not use WileyPlus were encouraged to solve problems directly from the textbook (solutions were provided), but we did not collect data on this aspect of student behavior. We can conclude that use of the WileyPlus e-resource had a large and positive effect on students’ final grades in the course.
11
We use the multiple regression model in our analyses instead of the single regression model for two main reasons: 1) we analyze different dependent variables; 2) based on the nature of the each dependent variable, there will be different sets of predictors.
The Impact of Multiple Electronic Learning Resources on Student Academic Performance
Higher Education Quality Council of Ontario 12
Various metrics were collected from students’ use of the LMS. There were positive and significant correlations of the final grade with the number of sessions spent on WebCT, the total time spent using WebCT and the total number of folders and files viewed. This is perhaps not surprising because most of the relevant course material posted on this site included old exams, some online tutorials for the more challenging material, lecture notes and the weekly tutorials (mostly numerical problem-solving). Experience tells us that doing well in this course requires keeping up with the lecture material and regularly practicing solving problems. Resources for this latter aspect included WileyPlus, but material provided on WebCT also apparently contributed to students’ ability to problem solve. We found no significant correlations of final grade with the other independent variables, including attendance at the PASS sessions, entrance average from high school or total time spent watching lectures and tutorials on the VOD system. However, these variables did correlate with other quantifiable aspects of student behavior, as will be explained later in this report. Table 1: Simple Regression – Grades (Fall Term)
Dependent Variable
Independent Variable Standardized Regression
Coefficient, β
R2 Significance, p n
Total Course Grade
WileyPlus Raw Score .478 .229 <.001* 495
Total Tutorial Attendance .167 .028 <.001* 324
WebCT Total Sessions .271 .073 <.001* 501
Total WebCT Hours .209 .044 <.001* 501
WileyPlus Total Progress .208 .043 <.001* 446
WebCT Total Folders Viewed .199 .039 <.001* 501
WebCT Total Files Viewed .176 .031 <.001* 501
WebCT Total Emails Read .131 .017 .003* 501
Total In-class Attendance .159 .025 .004* 324
WebCT Total Discussions Posted .100 .010 .025* 501
Midterm 2 Grade .787 .619 <.001* 463
Midterm 1 Grade .754 .569 <.001* 446
Final Exam Grade .947 .897 <.001* 500
Midterm Test 1 Grade
WileyPlus Raw Score .305 .093 <.001* 461
Interval 1 – Total In-class Attendance
.157 .025 .008* 420
Midterm Test 2 Grade
Wiley Plus Raw Score .373 .139 <.001* 458
Wiley Plus Total Progress .187 .035 <.001* 417
Interval 2 – Total In-class Attendance
.178 .032 .009* 215
Interval 2 – Tutorial Total Attendance
.104 .011 .102 247
Interval 2 - Total VOD Hours .071 .005 .343 178
Final Exam Wiley Plus Raw Score .469 .220 <.001* 495
The Impact of Multiple Electronic Learning Resources on Student Academic Performance
Higher Education Quality Council of Ontario 13
Grade Wiley Plus Total Progress .197 .039 <.001* 445
Interval 3 – Total In-class Attendance
.179 .032 .015* 183
Interval 3 – Total Tutorial Attendance
.133 .018 .073 183
Interval 3 – Total VOD Hours .076 .006 .295 190
*significant at the .05 level
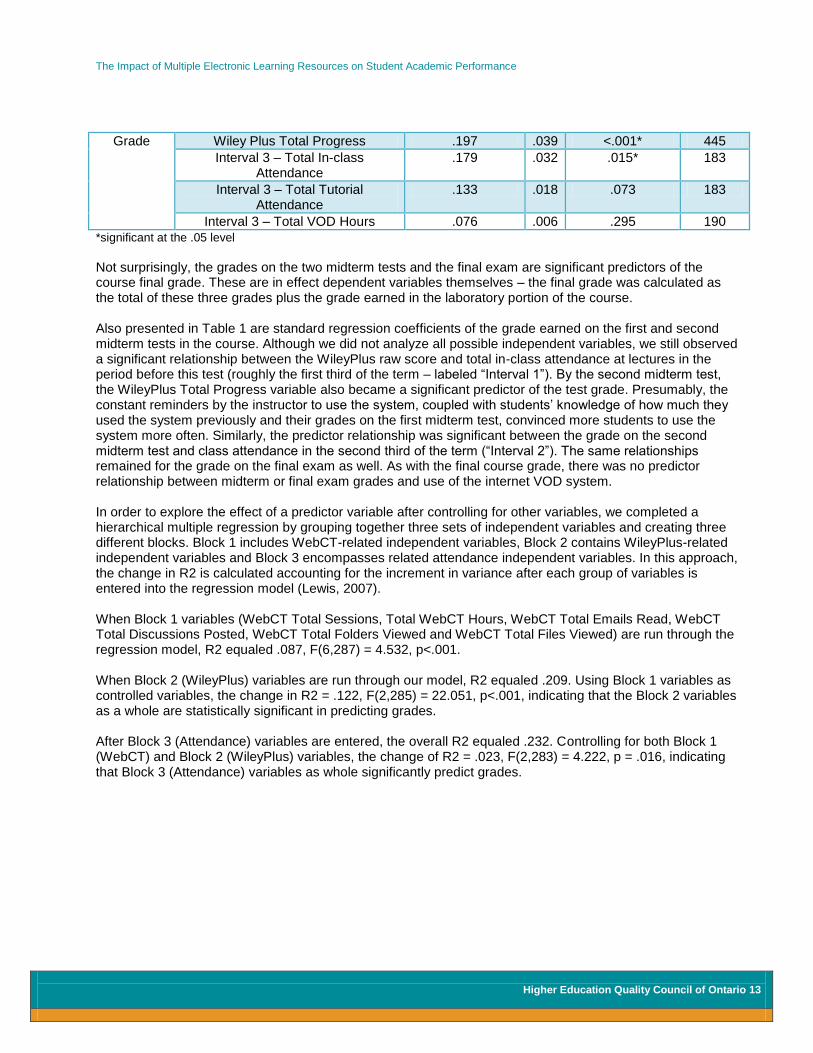
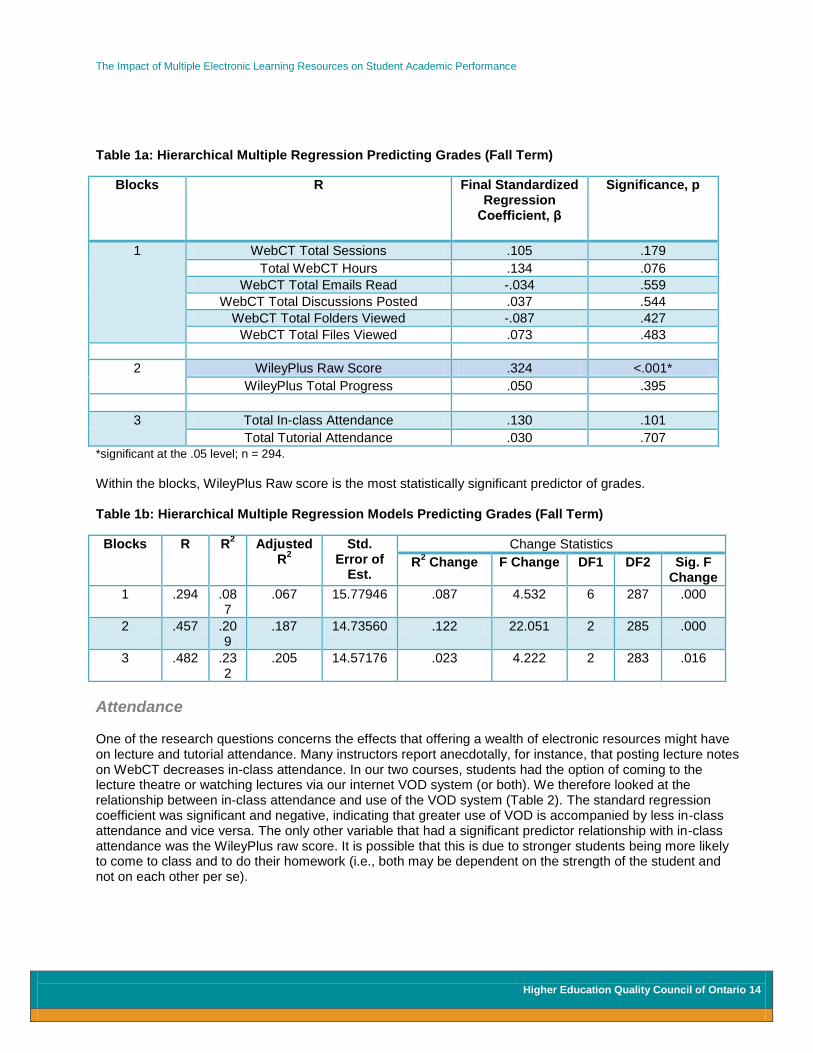
Not surprisingly, the grades on the two midterm tests and the final exam are significant predictors of the course final grade. These are in effect dependent variables themselves – the final grade was calculated as the total of these three grades plus the grade earned in the laboratory portion of the course. Also presented in Table 1 are standard regression coefficients of the grade earned on the first and second midterm tests in the course. Although we did not analyze all possible independent variables, we still observed a significant relationship between the WileyPlus raw score and total in-class attendance at lectures in the period before this test (roughly the first third of the term – labeled “Interval 1”). By the second midterm test, the WileyPlus Total Progress variable also became a significant predictor of the test grade. Presumably, the constant reminders by the instructor to use the system, coupled with students’ knowledge of how much they used the system previously and their grades on the first midterm test, convinced more students to use the system more often. Similarly, the predictor relationship was significant between the grade on the second midterm test and class attendance in the second third of the term (“Interval 2”). The same relationships remained for the grade on the final exam as well. As with the final course grade, there was no predictor relationship between midterm or final exam grades and use of the internet VOD system. In order to explore the effect of a predictor variable after controlling for other variables, we completed a hierarchical multiple regression by grouping together three sets of independent variables and creating three different blocks. Block 1 includes WebCT-related independent variables, Block 2 contains WileyPlus-related independent variables and Block 3 encompasses related attendance independent variables. In this approach, the change in R2 is calculated accounting for the increment in variance after each group of variables is entered into the regression model (Lewis, 2007). When Block 1 variables (WebCT Total Sessions, Total WebCT Hours, WebCT Total Emails Read, WebCT Total Discussions Posted, WebCT Total Folders Viewed and WebCT Total Files Viewed) are run through the regression model, R2 equaled .087, F(6,287) = 4.532, p<.001. When Block 2 (WileyPlus) variables are run through our model, R2 equaled .209. Using Block 1 variables as controlled variables, the change in R2 = .122, F(2,285) = 22.051, p<.001, indicating that the Block 2 variables as a whole are statistically significant in predicting grades. After Block 3 (Attendance) variables are entered, the overall R2 equaled .232. Controlling for both Block 1 (WebCT) and Block 2 (WileyPlus) variables, the change of R2 = .023, F(2,283) = 4.222, p = .016, indicating that Block 3 (Attendance) variables as whole significantly predict grades.
The Impact of Multiple Electronic Learning Resources on Student Academic Performance
Higher Education Quality Council of Ontario 14
Table 1a: Hierarchical Multiple Regression Predicting Grades (Fall Term)
Blocks R Final Standardized Regression
Coefficient, β
Significance, p
1 WebCT Total Sessions .105 .179
Total WebCT Hours .134 .076
WebCT Total Emails Read -.034 .559
WebCT Total Discussions Posted .037 .544
WebCT Total Folders Viewed -.087 .427
WebCT Total Files Viewed .073 .483
2 WileyPlus Raw Score .324 <.001*
WileyPlus Total Progress .050 .395
3 Total In-class Attendance .130 .101
Total Tutorial Attendance .030 .707
*significant at the .05 level; n = 294.
Within the blocks, WileyPlus Raw score is the most statistically significant predictor of grades. Table 1b: Hierarchical Multiple Regression Models Predicting Grades (Fall Term)
Blocks R R2 Adjusted
R2
Std. Error of
Est.
Change Statistics
R2 Change F Change DF1 DF2 Sig. F
Change
1 .294 .087
.067 15.77946 .087 4.532 6 287 .000
2 .457 .209
.187 14.73560 .122 22.051 2 285 .000
3 .482 .232
.205 14.57176 .023 4.222 2 283 .016
Attendance
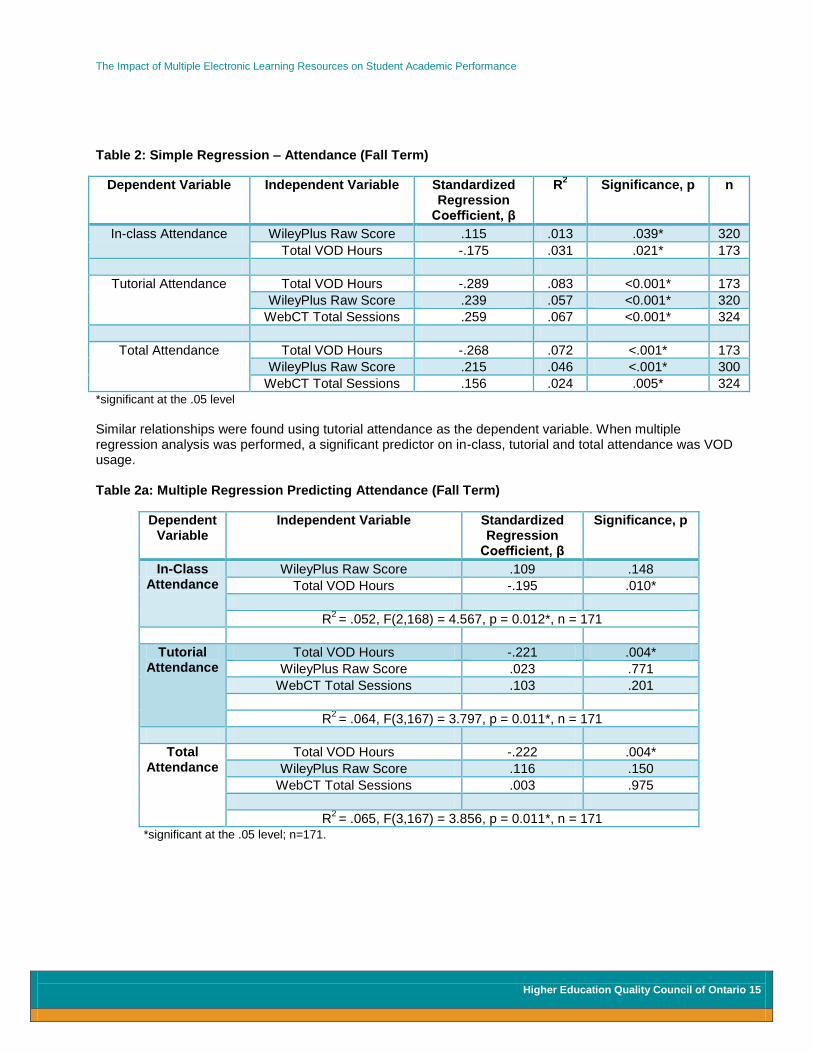
One of the research questions concerns the effects that offering a wealth of electronic resources might have on lecture and tutorial attendance. Many instructors report anecdotally, for instance, that posting lecture notes on WebCT decreases in-class attendance. In our two courses, students had the option of coming to the lecture theatre or watching lectures via our internet VOD system (or both). We therefore looked at the relationship between in-class attendance and use of the VOD system (Table 2). The standard regression coefficient was significant and negative, indicating that greater use of VOD is accompanied by less in-class attendance and vice versa. The only other variable that had a significant predictor relationship with in-class attendance was the WileyPlus raw score. It is possible that this is due to stronger students being more likely to come to class and to do their homework (i.e., both may be dependent on the strength of the student and not on each other per se).
The Impact of Multiple Electronic Learning Resources on Student Academic Performance
Higher Education Quality Council of Ontario 15
Table 2: Simple Regression – Attendance (Fall Term)
Dependent Variable Independent Variable Standardized Regression
Coefficient, β
R2 Significance, p n
In-class Attendance WileyPlus Raw Score .115 .013 .039* 320
Total VOD Hours -.175 .031 .021* 173
Tutorial Attendance Total VOD Hours -.289 .083 <0.001* 173
WileyPlus Raw Score .239 .057 <0.001* 320
WebCT Total Sessions .259 .067 <0.001* 324
Total Attendance Total VOD Hours -.268 .072 <.001* 173
WileyPlus Raw Score .215 .046 <.001* 300
WebCT Total Sessions .156 .024 .005* 324 *significant at the .05 level
Similar relationships were found using tutorial attendance as the dependent variable. When multiple regression analysis was performed, a significant predictor on in-class, tutorial and total attendance was VOD usage. Table 2a: Multiple Regression Predicting Attendance (Fall Term)
Dependent Variable
Independent Variable Standardized Regression
Coefficient, β
Significance, p
In-Class Attendance
WileyPlus Raw Score .109 .148
Total VOD Hours -.195 .010*
R2 = .052, F(2,168) = 4.567, p = 0.012*, n = 171
Tutorial Attendance
Total VOD Hours -.221 .004*
WileyPlus Raw Score .023 .771
WebCT Total Sessions .103 .201
R2 = .064, F(3,167) = 3.797, p = 0.011*, n = 171
Total Attendance
Total VOD Hours -.222 .004*
WileyPlus Raw Score .116 .150
WebCT Total Sessions .003 .975
R2 = .065, F(3,167) = 3.856, p = 0.011*, n = 171
*significant at the .05 level; n=171.
The Impact of Multiple Electronic Learning Resources on Student Academic Performance
Higher Education Quality Council of Ontario 16
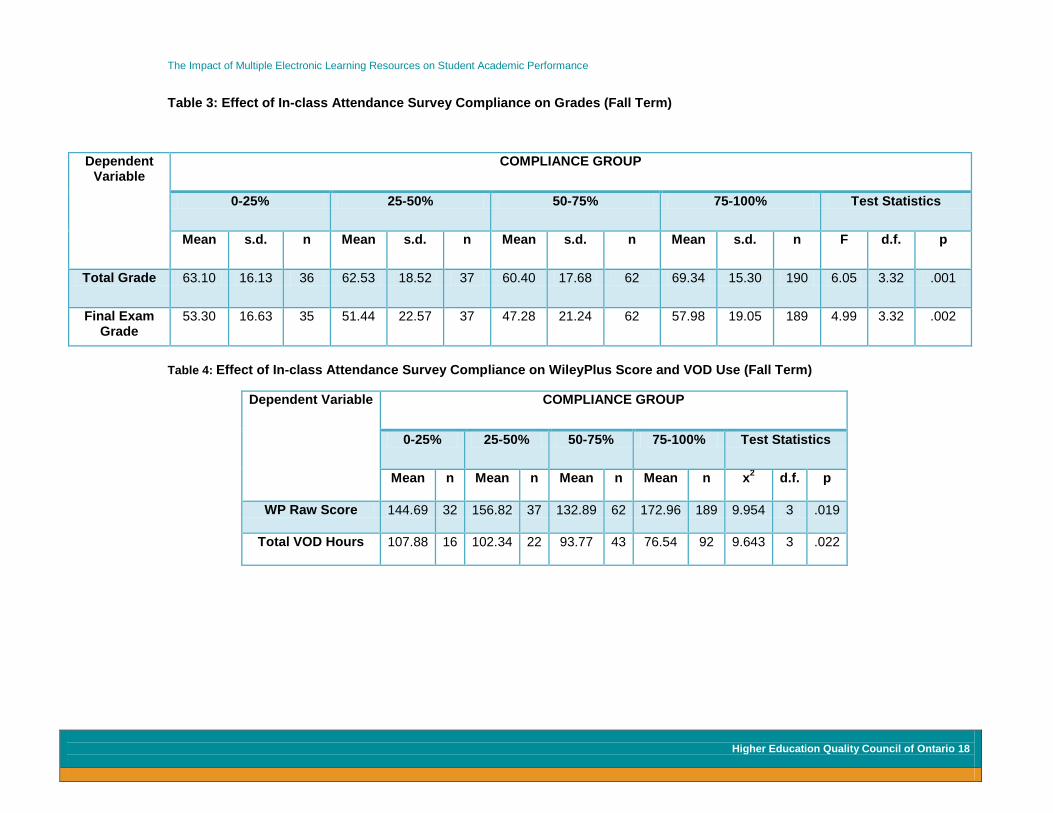
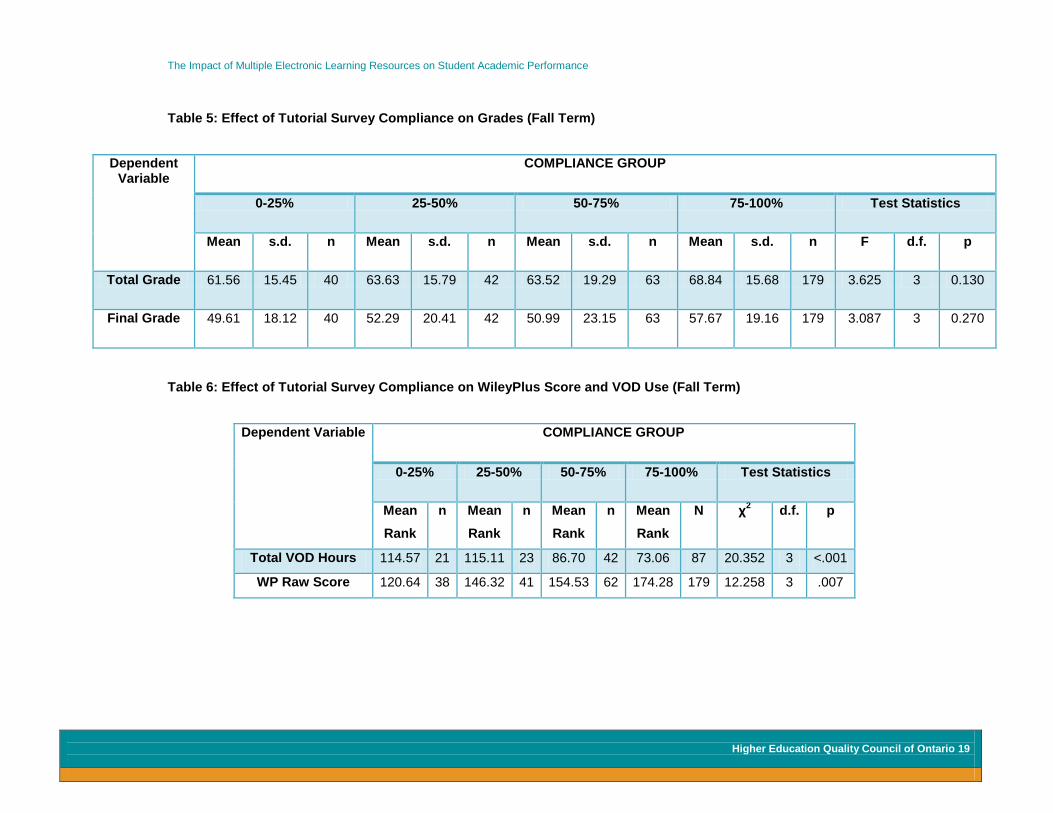
Compliance with Attendance Surveys In an attempt to deal with the incomplete nature of the collected attendance data, the thought arose that students who regularly filled in the attendance surveys might be considered more “connected” to the course and might be expected to achieve higher grades as a result. We therefore divided all respondents into one of four groups depending on the percentage of the surveys they completed (0-25%, 25-50%, 50-75% or 75-100%) and tabulated the average grades in each of these groups (Table 3). Using ANOVA, we determined that there were positive correlations between their final exam grade or their final course grade and their compliance in filling out these surveys. This analysis was repeated using the WileyPlus raw score and VOD hours (Table 4), and these two variables were also found to be positively correlated with survey compliance. As with the attendance data presented above, this likely indicates that the more “connected” students tend to achieve higher grades. The above analysis was repeated using tutorial attendance surveys. The data are presented in Tables 5 and 6, and support the conclusion that the more connected students as evidenced by their compliance in filling in the attendance surveys tended to earn higher grades, spend more time on VOD and obtain higher scores on WileyPlus. We are not suggesting cause and effect here, merely that stronger students tend to do many things better.
The Impact of Multiple Electronic Learning Resources on Student Academic Performance
Higher Education Quality Council of Ontario 18
Table 3: Effect of In-class Attendance Survey Compliance on Grades (Fall Term)
Dependent Variable
COMPLIANCE GROUP
0-25% 25-50% 50-75% 75-100% Test Statistics
Mean s.d. n Mean s.d. n Mean s.d. n Mean s.d. n F d.f. p
Total Grade 63.10 16.13 36 62.53 18.52 37 60.40 17.68 62 69.34 15.30 190 6.05 3.32 .001
Final Exam Grade
53.30 16.63 35 51.44 22.57 37 47.28 21.24 62 57.98 19.05 189 4.99 3.32 .002
Table 4: Effect of In-class Attendance Survey Compliance on WileyPlus Score and VOD Use (Fall Term)
Dependent Variable COMPLIANCE GROUP
0-25% 25-50% 50-75% 75-100% Test Statistics
Mean n Mean n Mean n Mean n x2
d.f. p
WP Raw Score 144.69 32 156.82 37 132.89 62 172.96 189 9.954 3 .019
Total VOD Hours 107.88 16 102.34 22 93.77 43 76.54 92 9.643 3 .022
The Impact of Multiple Electronic Learning Resources on Student Academic Performance
Higher Education Quality Council of Ontario 19
Table 5: Effect of Tutorial Survey Compliance on Grades (Fall Term)
Dependent Variable
COMPLIANCE GROUP
0-25% 25-50% 50-75% 75-100% Test Statistics
Mean s.d. n Mean s.d. n Mean s.d. n Mean s.d. n F d.f. p
Total Grade 61.56 15.45 40 63.63 15.79 42 63.52 19.29 63 68.84 15.68 179 3.625 3 0.130
Final Grade 49.61 18.12 40 52.29 20.41 42 50.99 23.15 63 57.67 19.16 179 3.087 3 0.270
Table 6: Effect of Tutorial Survey Compliance on WileyPlus Score and VOD Use (Fall Term)
Dependent Variable COMPLIANCE GROUP
0-25% 25-50% 50-75% 75-100% Test Statistics
Mean
Rank
n Mean
Rank
n Mean
Rank
n Mean
Rank
N χ2
d.f. p
Total VOD Hours 114.57 21 115.11 23 86.70 42 73.06 87 20.352 3 <.001
WP Raw Score 120.64 38 146.32 41 154.53 62 174.28 179 12.258 3 .007
The Impact of Multiple Electronic Learning Resources on Student Academic Performance
Higher Education Quality Council of Ontario 20
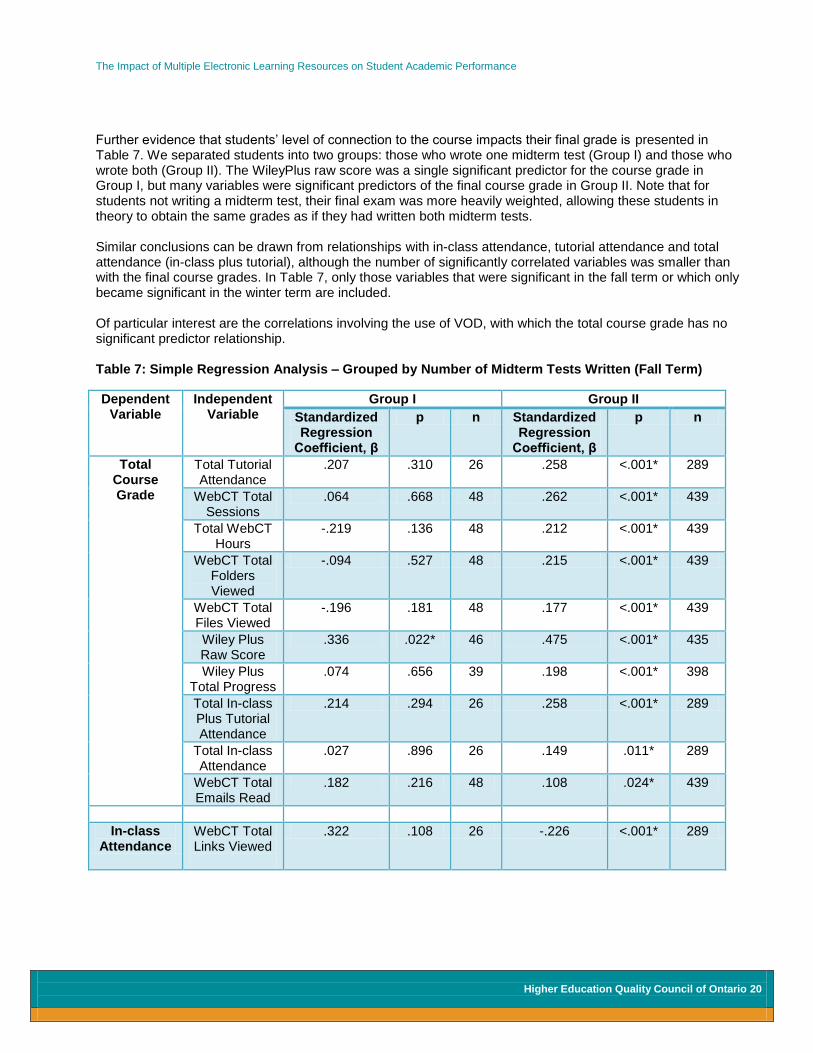
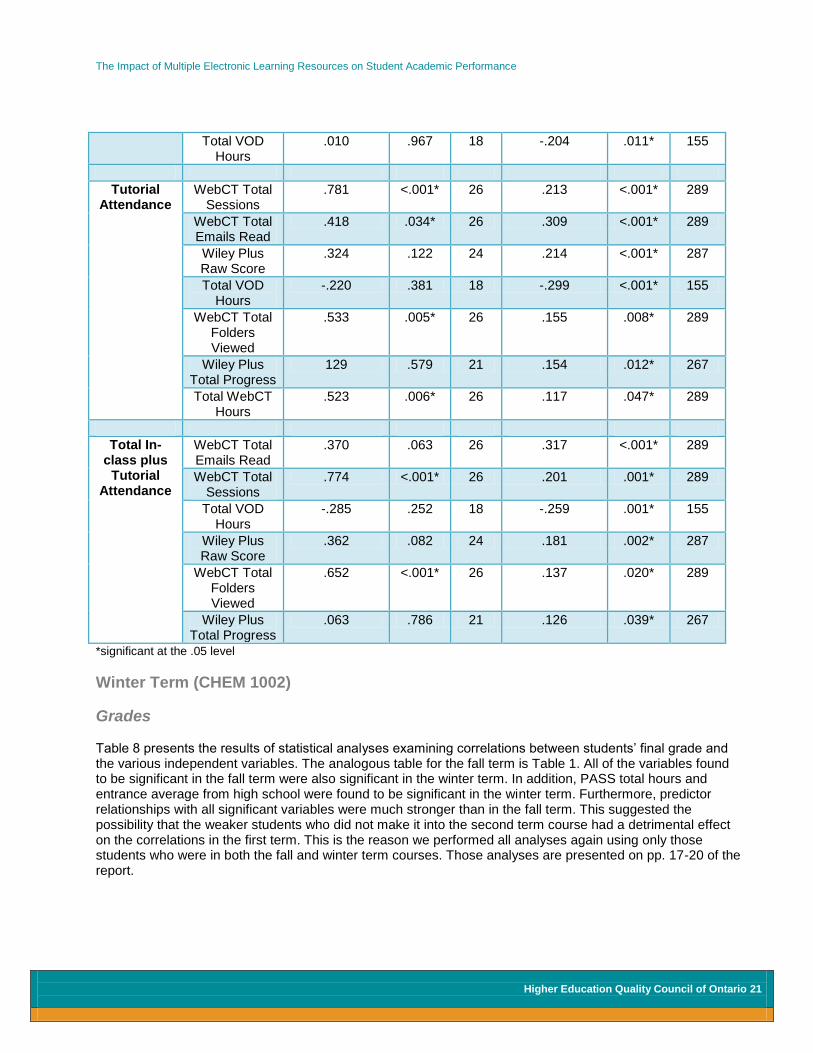
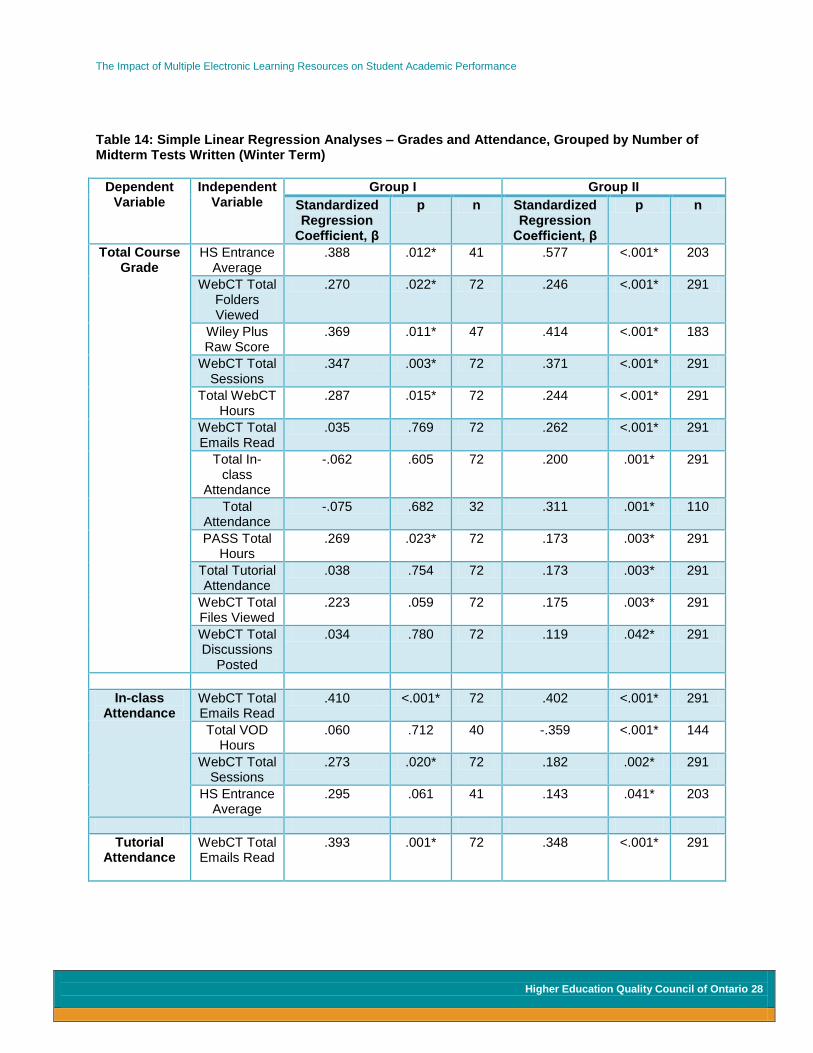
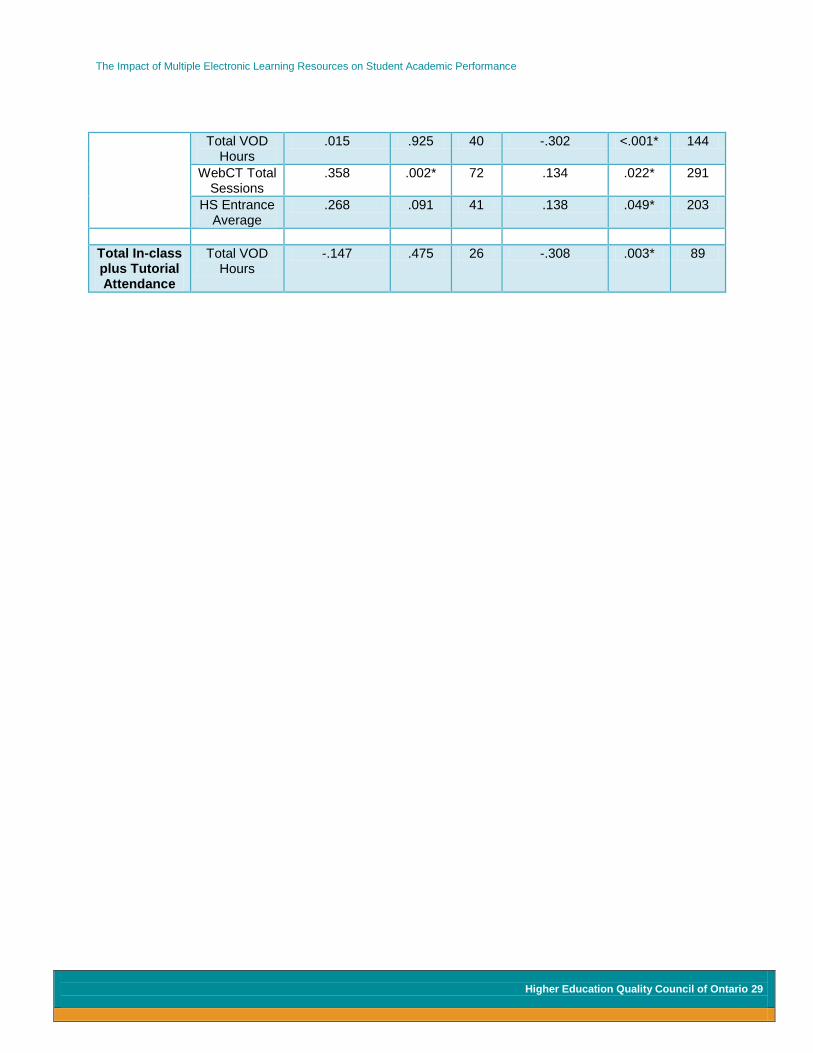
Further evidence that students’ level of connection to the course impacts their final grade is presented in Table 7. We separated students into two groups: those who wrote one midterm test (Group I) and those who wrote both (Group II). The WileyPlus raw score was a single significant predictor for the course grade in Group I, but many variables were significant predictors of the final course grade in Group II. Note that for students not writing a midterm test, their final exam was more heavily weighted, allowing these students in theory to obtain the same grades as if they had written both midterm tests. Similar conclusions can be drawn from relationships with in-class attendance, tutorial attendance and total attendance (in-class plus tutorial), although the number of significantly correlated variables was smaller than with the final course grades. In Table 7, only those variables that were significant in the fall term or which only became significant in the winter term are included. Of particular interest are the correlations involving the use of VOD, with which the total course grade has no significant predictor relationship. Table 7: Simple Regression Analysis – Grouped by Number of Midterm Tests Written (Fall Term)
Dependent Variable
Independent Variable
Group I Group II
Standardized Regression
Coefficient, β
p n
Standardized Regression
Coefficient, β
p n
Total Course Grade
Total Tutorial Attendance
.207 .310 26 .258 <.001* 289
WebCT Total Sessions
.064 .668 48 .262 <.001* 439
Total WebCT Hours
-.219 .136 48 .212 <.001* 439
WebCT Total Folders Viewed
-.094 .527 48 .215 <.001* 439
WebCT Total Files Viewed
-.196 .181 48 .177 <.001* 439
Wiley Plus Raw Score
.336 .022* 46 .475 <.001* 435
Wiley Plus Total Progress
.074 .656 39 .198 <.001* 398
Total In-class Plus Tutorial Attendance
.214 .294 26 .258 <.001* 289
Total In-class Attendance
.027 .896 26 .149 .011* 289
WebCT Total Emails Read
.182 .216 48 .108 .024* 439
In-class Attendance
WebCT Total Links Viewed
.322 .108 26 -.226 <.001* 289
The Impact of Multiple Electronic Learning Resources on Student Academic Performance
Higher Education Quality Council of Ontario 21
Total VOD Hours
.010 .967 18 -.204 .011* 155
Tutorial Attendance
WebCT Total Sessions
.781 <.001* 26 .213 <.001* 289
WebCT Total Emails Read
.418 .034* 26 .309 <.001* 289
Wiley Plus Raw Score
.324 .122 24 .214 <.001* 287
Total VOD Hours
-.220 .381 18 -.299 <.001* 155
WebCT Total Folders Viewed
.533 .005* 26 .155 .008* 289
Wiley Plus Total Progress
129 .579 21 .154 .012* 267
Total WebCT Hours
.523 .006* 26 .117 .047* 289
Total In-class plus
Tutorial Attendance
WebCT Total Emails Read
.370 .063 26 .317 <.001* 289
WebCT Total Sessions
.774 <.001* 26 .201 .001* 289
Total VOD Hours
-.285 .252 18 -.259 .001* 155
Wiley Plus Raw Score
.362 .082 24 .181 .002* 287
WebCT Total Folders Viewed
.652 <.001* 26 .137 .020* 289
Wiley Plus Total Progress
.063 .786 21 .126 .039* 267
*significant at the .05 level
Winter Term (CHEM 1002)
Grades Table 8 presents the results of statistical analyses examining correlations between students’ final grade and the various independent variables. The analogous table for the fall term is Table 1. All of the variables found to be significant in the fall term were also significant in the winter term. In addition, PASS total hours and entrance average from high school were found to be significant in the winter term. Furthermore, predictor relationships with all significant variables were much stronger than in the fall term. This suggested the possibility that the weaker students who did not make it into the second term course had a detrimental effect on the correlations in the first term. This is the reason we performed all analyses again using only those students who were in both the fall and winter term courses. Those analyses are presented on pp. 17-20 of the report.
The Impact of Multiple Electronic Learning Resources on Student Academic Performance
Higher Education Quality Council of Ontario 22
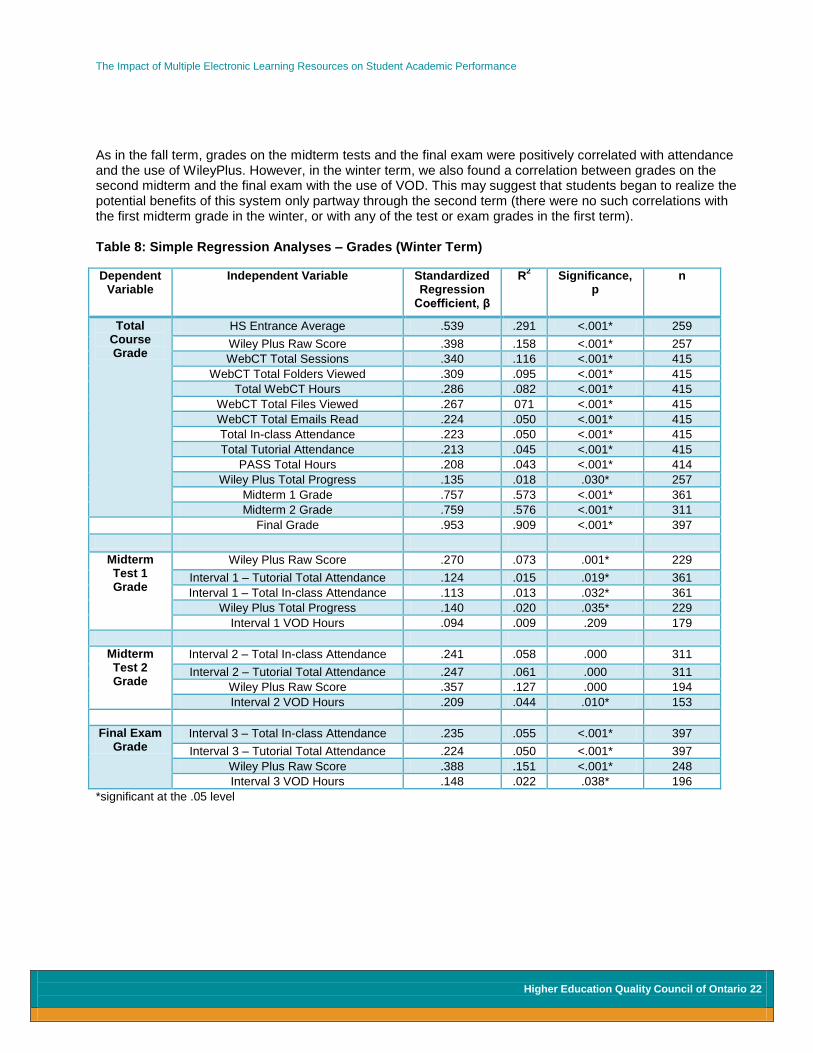
As in the fall term, grades on the midterm tests and the final exam were positively correlated with attendance and the use of WileyPlus. However, in the winter term, we also found a correlation between grades on the second midterm and the final exam with the use of VOD. This may suggest that students began to realize the potential benefits of this system only partway through the second term (there were no such correlations with the first midterm grade in the winter, or with any of the test or exam grades in the first term). Table 8: Simple Regression Analyses – Grades (Winter Term)
Dependent Variable
Independent Variable Standardized Regression
Coefficient, β
R2 Significance,
p n
Total Course Grade
HS Entrance Average .539 .291 <.001* 259
Wiley Plus Raw Score .398 .158 <.001* 257
WebCT Total Sessions .340 .116 <.001* 415
WebCT Total Folders Viewed .309 .095 <.001* 415
Total WebCT Hours .286 .082 <.001* 415
WebCT Total Files Viewed .267 071 <.001* 415
WebCT Total Emails Read .224 .050 <.001* 415
Total In-class Attendance .223 .050 <.001* 415
Total Tutorial Attendance .213 .045 <.001* 415
PASS Total Hours .208 .043 <.001* 414
Wiley Plus Total Progress .135 .018 .030* 257
Midterm 1 Grade .757 .573 <.001* 361
Midterm 2 Grade .759 .576 <.001* 311
Final Grade .953 .909 <.001* 397
Midterm Test 1 Grade
Wiley Plus Raw Score .270 .073 .001* 229
Interval 1 – Tutorial Total Attendance .124 .015 .019* 361
Interval 1 – Total In-class Attendance .113 .013 .032* 361
Wiley Plus Total Progress .140 .020 .035* 229
Interval 1 VOD Hours .094 .009 .209 179
Midterm Test 2 Grade
Interval 2 – Total In-class Attendance .241 .058 .000 311
Interval 2 – Tutorial Total Attendance .247 .061 .000 311
Wiley Plus Raw Score .357 .127 .000 194
Interval 2 VOD Hours .209 .044 .010* 153
Final Exam Grade
Interval 3 – Total In-class Attendance .235 .055 <.001* 397
Interval 3 – Tutorial Total Attendance .224 .050 <.001* 397
Wiley Plus Raw Score .388 .151 <.001* 248
Interval 3 VOD Hours .148 .022 .038* 196
*significant at the .05 level
The Impact of Multiple Electronic Learning Resources on Student Academic Performance
Higher Education Quality Council of Ontario 23
Table 8a: Hierarchical Multiple Regression Predicting Grades (Winter Term)
Blocks Independent Variable Final Standardized Regression Coefficient,
β
Significance, p
1 WebCT Total Sessions .051 .564
Total WebCT Hours .003 .968
WebCT Total Emails Read .109 .150
WebCT Total Folders Viewed -.079 .592
WebCT Total Files Viewed .135 .252
2 PASS Total Hours .135 .021*
HS Entrance Average .482 <.001*
Total In-class Attendance -.010 .942
Total Tutorial Attendance .122 .366
Wiley Plus Raw Score .285 <.001*
Wiley Plus Total Progress -.018 .777 *significant at the .05 level; n = 185
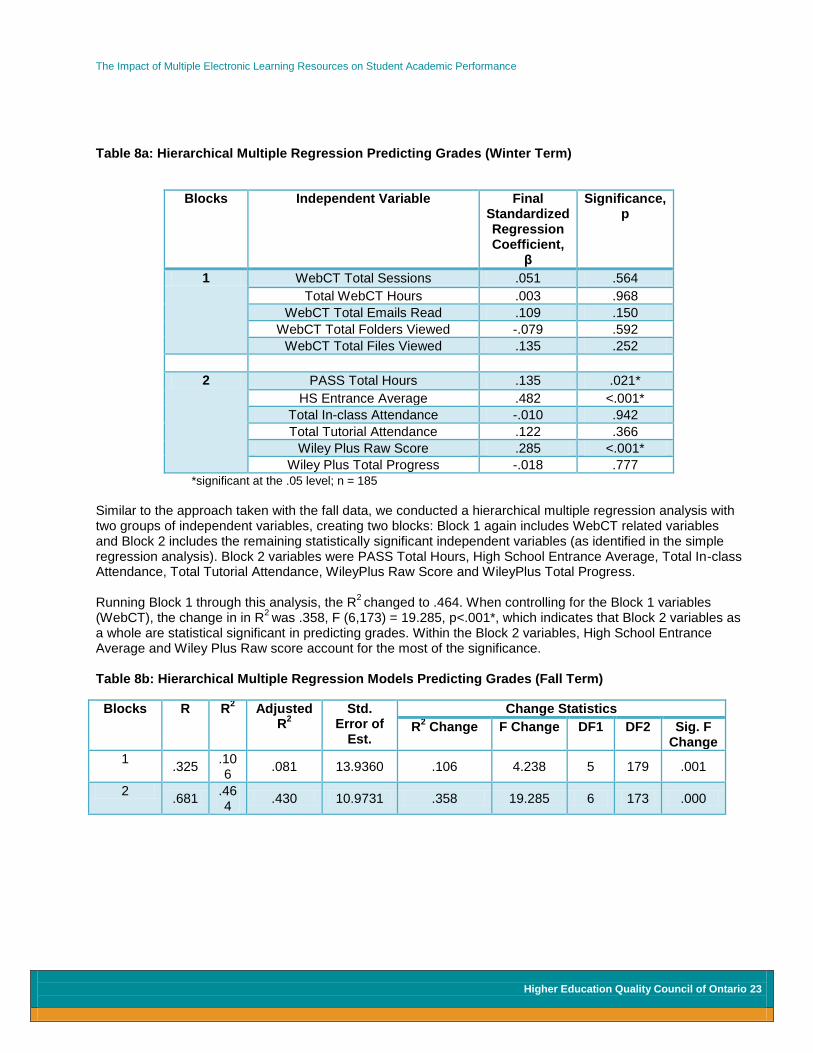
Similar to the approach taken with the fall data, we conducted a hierarchical multiple regression analysis with two groups of independent variables, creating two blocks: Block 1 again includes WebCT related variables and Block 2 includes the remaining statistically significant independent variables (as identified in the simple regression analysis). Block 2 variables were PASS Total Hours, High School Entrance Average, Total In-class Attendance, Total Tutorial Attendance, WileyPlus Raw Score and WileyPlus Total Progress. Running Block 1 through this analysis, the R
2 changed to .464. When controlling for the Block 1 variables
(WebCT), the change in in R2 was .358, F (6,173) = 19.285, p<.001*, which indicates that Block 2 variables as
a whole are statistical significant in predicting grades. Within the Block 2 variables, High School Entrance Average and Wiley Plus Raw score account for the most of the significance. Table 8b: Hierarchical Multiple Regression Models Predicting Grades (Fall Term)
Blocks R R2 Adjusted
R2
Std. Error of
Est.
Change Statistics
R2 Change F Change DF1 DF2 Sig. F
Change
1 .325
.106
.081 13.9360 .106 4.238 5 179 .001
2 .681
.464
.430 10.9731 .358 19.285 6 173 .000
The Impact of Multiple Electronic Learning Resources on Student Academic Performance
Higher Education Quality Council of Ontario 24
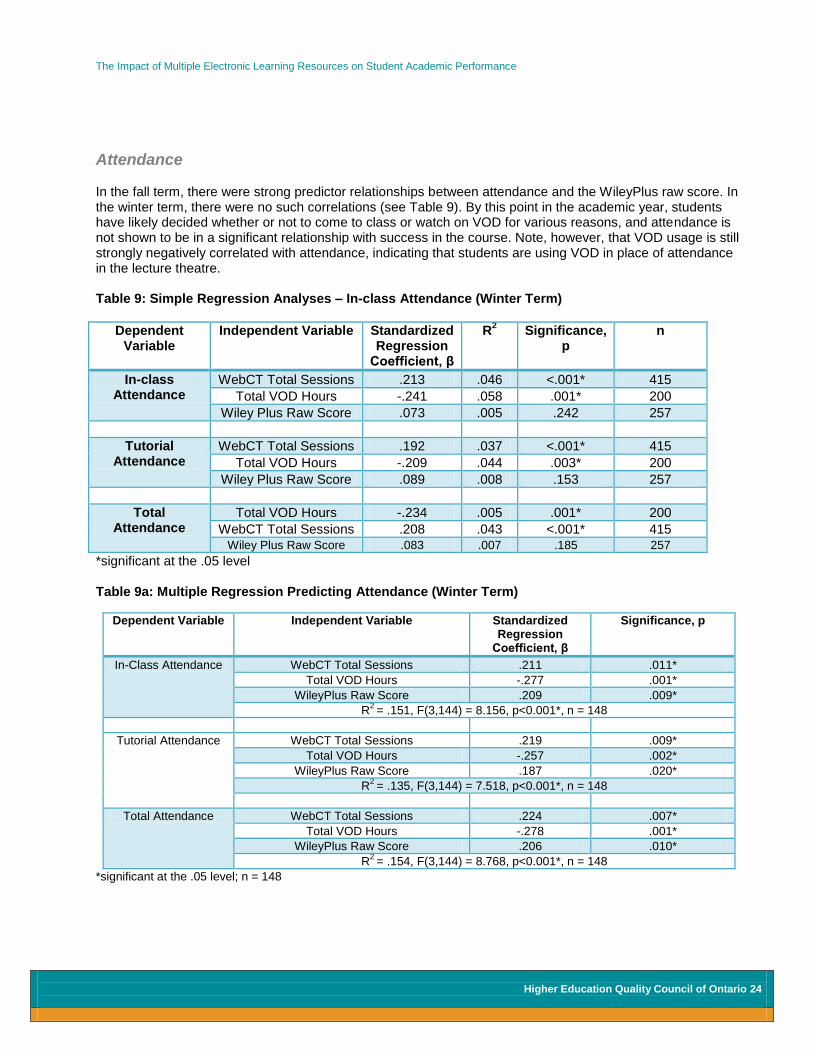
Attendance In the fall term, there were strong predictor relationships between attendance and the WileyPlus raw score. In the winter term, there were no such correlations (see Table 9). By this point in the academic year, students have likely decided whether or not to come to class or watch on VOD for various reasons, and attendance is not shown to be in a significant relationship with success in the course. Note, however, that VOD usage is still strongly negatively correlated with attendance, indicating that students are using VOD in place of attendance in the lecture theatre. Table 9: Simple Regression Analyses – In-class Attendance (Winter Term)
Dependent Variable
Independent Variable Standardized Regression
Coefficient, β
R2 Significance,
p n
In-class Attendance
WebCT Total Sessions .213 .046 <.001* 415
Total VOD Hours -.241 .058 .001* 200
Wiley Plus Raw Score .073 .005 .242 257
Tutorial Attendance
WebCT Total Sessions .192 .037 <.001* 415
Total VOD Hours -.209 .044 .003* 200
Wiley Plus Raw Score .089 .008 .153 257
Total Attendance
Total VOD Hours -.234 .005 .001* 200
WebCT Total Sessions .208 .043 <.001* 415 Wiley Plus Raw Score .083 .007 .185 257
*significant at the .05 level Table 9a: Multiple Regression Predicting Attendance (Winter Term)
Dependent Variable Independent Variable Standardized Regression
Coefficient, β
Significance, p
In-Class Attendance WebCT Total Sessions .211 .011*
Total VOD Hours -.277 .001*
WileyPlus Raw Score .209 .009*
R2
= .151, F(3,144) = 8.156, p<0.001*, n = 148
Tutorial Attendance WebCT Total Sessions .219 .009*
Total VOD Hours -.257 .002*
WileyPlus Raw Score .187 .020*
R2
= .135, F(3,144) = 7.518, p<0.001*, n = 148
Total Attendance WebCT Total Sessions .224 .007*
Total VOD Hours -.278 .001*
WileyPlus Raw Score .206 .010*
R2
= .154, F(3,144) = 8.768, p<0.001*, n = 148
*significant at the .05 level; n = 148
The Impact of Multiple Electronic Learning Resources on Student Academic Performance
Higher Education Quality Council of Ontario 25
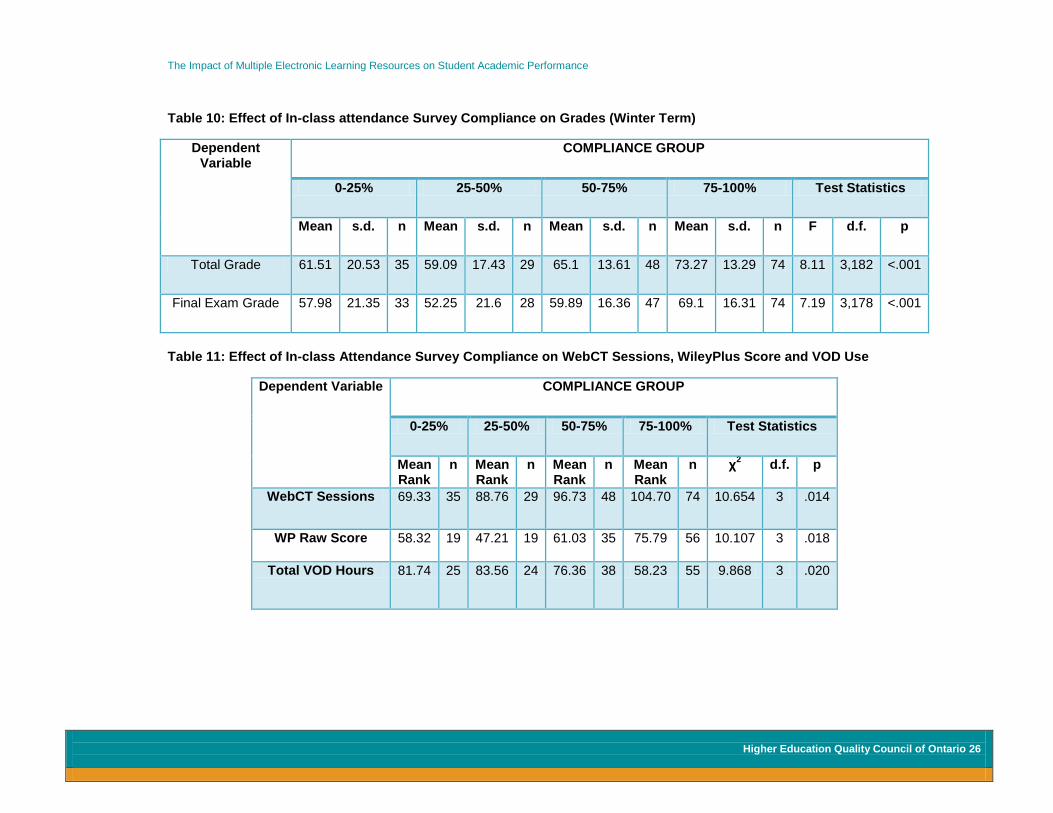
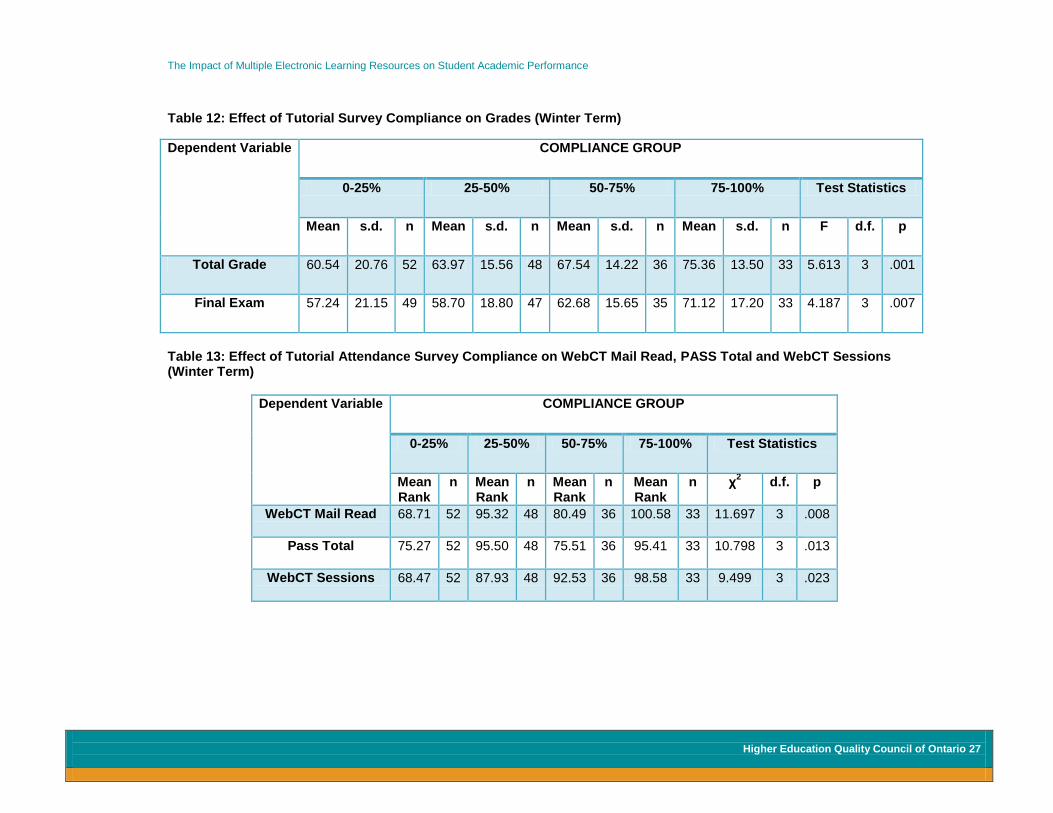
Compliance with Attendance Surveys As in the fall term, we tried to determine whether there is any compliance group effect on grades and other variables. Once again we found that there are statistically significant compliance group effects on the final exam grade and the final course grade, as well as with the use of WileyPlus, the use of WebCT and attendance at the PASS sessions. Again, we feel this to be indicative of how connected students are to the course. Winter term data in Tables 10 to 14 are comparable to fall term data in Tables 3 to 7. The correlations involving the use of VOD are again of particular interest to us. As in the fall term, the final course grade is not significantly correlated with the use of VOD, and VOD use is negatively and significantly correlated with in-class attendance, tutorial attendance and total attendance. In other words, our winter term data also suggest that the use of the VOD system may be an adequate substitute for attendance.
The Impact of Multiple Electronic Learning Resources on Student Academic Performance
Higher Education Quality Council of Ontario 26
Table 10: Effect of In-class attendance Survey Compliance on Grades (Winter Term)
Dependent Variable
COMPLIANCE GROUP
0-25% 25-50% 50-75% 75-100% Test Statistics
Mean s.d. n Mean s.d. n Mean s.d. n Mean s.d. n F d.f. p
Total Grade 61.51 20.53 35 59.09 17.43 29 65.1 13.61 48 73.27 13.29 74 8.11 3,182 <.001
Final Exam Grade 57.98 21.35 33 52.25 21.6 28 59.89 16.36 47 69.1 16.31 74 7.19 3,178 <.001
Table 11: Effect of In-class Attendance Survey Compliance on WebCT Sessions, WileyPlus Score and VOD Use
Dependent Variable COMPLIANCE GROUP
0-25% 25-50% 50-75% 75-100% Test Statistics
Mean Rank
n Mean Rank
n Mean Rank
n Mean Rank
n χ2
d.f. p
WebCT Sessions 69.33 35 88.76 29 96.73 48 104.70 74 10.654 3 .014
WP Raw Score 58.32 19 47.21 19 61.03 35 75.79 56 10.107 3 .018
Total VOD Hours 81.74 25 83.56 24 76.36 38 58.23 55 9.868 3 .020
The Impact of Multiple Electronic Learning Resources on Student Academic Performance
Higher Education Quality Council of Ontario 27
Table 12: Effect of Tutorial Survey Compliance on Grades (Winter Term)
Dependent Variable COMPLIANCE GROUP
0-25% 25-50% 50-75% 75-100% Test Statistics
Mean s.d. n Mean s.d. n Mean s.d. n Mean s.d. n F d.f. p
Total Grade 60.54 20.76 52 63.97 15.56 48 67.54 14.22 36 75.36 13.50 33 5.613 3 .001
Final Exam 57.24 21.15 49 58.70 18.80 47 62.68 15.65 35 71.12 17.20 33 4.187 3 .007
Table 13: Effect of Tutorial Attendance Survey Compliance on WebCT Mail Read, PASS Total and WebCT Sessions (Winter Term)
Dependent Variable COMPLIANCE GROUP
0-25% 25-50% 50-75% 75-100% Test Statistics
Mean Rank
n Mean Rank
n Mean Rank
n Mean Rank
n χ2
d.f. p
WebCT Mail Read 68.71 52 95.32 48 80.49 36 100.58 33 11.697 3 .008
Pass Total 75.27 52 95.50 48 75.51 36 95.41 33 10.798 3 .013
WebCT Sessions 68.47 52 87.93 48 92.53 36 98.58 33 9.499 3 .023
The Impact of Multiple Electronic Learning Resources on Student Academic Performance
Higher Education Quality Council of Ontario 28
Table 14: Simple Linear Regression Analyses – Grades and Attendance, Grouped by Number of Midterm Tests Written (Winter Term)
Dependent Variable
Independent Variable
Group I Group II
Standardized Regression
Coefficient, β
p n
Standardized Regression
Coefficient, β
p n
Total Course Grade
HS Entrance Average
.388 .012* 41 .577 <.001* 203
WebCT Total Folders Viewed
.270 .022* 72 .246 <.001* 291
Wiley Plus Raw Score
.369 .011* 47 .414 <.001* 183
WebCT Total Sessions
.347 .003* 72 .371 <.001* 291
Total WebCT Hours
.287 .015* 72 .244 <.001* 291
WebCT Total Emails Read
.035 .769 72 .262 <.001* 291
Total In-class
Attendance
-.062 .605 72 .200 .001* 291
Total Attendance
-.075 .682 32 .311 .001* 110
PASS Total Hours
.269 .023* 72 .173 .003* 291
Total Tutorial Attendance
.038 .754 72 .173 .003* 291
WebCT Total Files Viewed
.223 .059 72 .175 .003* 291
WebCT Total Discussions
Posted
.034 .780 72 .119 .042* 291
In-class Attendance
WebCT Total Emails Read
.410 <.001* 72 .402 <.001* 291
Total VOD Hours
.060 .712 40 -.359 <.001* 144
WebCT Total Sessions
.273 .020* 72 .182 .002* 291
HS Entrance Average
.295 .061 41 .143 .041* 203
Tutorial Attendance
WebCT Total Emails Read
.393 .001* 72 .348 <.001* 291
The Impact of Multiple Electronic Learning Resources on Student Academic Performance
Higher Education Quality Council of Ontario 29
Total VOD Hours
.015 .925 40 -.302 <.001* 144
WebCT Total Sessions
.358 .002* 72 .134 .022* 291
HS Entrance Average
.268 .091 41 .138 .049* 203
Total In-class plus Tutorial Attendance
Total VOD Hours
-.147 .475 26 -.308 .003* 89
The Impact of Multiple Electronic Learning Resources on Student Academic Performance
Higher Education Quality Council of Ontario 30
Conclusion and Recommendations
While this research project has focused exclusively on the use of e-resources within a large first-year university General Chemistry course, we feel there are a number of findings that are broadly applicable to other disciplines and that provide guidance to instructors and administrators.
Performance This research study indicates that students selected and used a number of different e-resources to aid with their learning. Many of these resources are a significant predictor of students’ grades, indicating that, at least in the case of CHEM 1001 and CHEM 1002, the resources provided were effective and helpful for learning. In particular, resources and activities that encourage students to spend time on task, solve problems, interact with course content and interact with each other had the most significant positive effects on grades in this course. Our data show that the homework management system, WileyPlus, which encourages students to complete problems and provides individualized feedback on student progress, had the most significant impact on students’ grades in both CHEM 1001 and CHEM 1002. It is the opinion of the research team that instructors should explore integrating homework management systems like WileyPlus into the set of resources that they provide to students. The WebCT course site is extensive for both CHEM 1001 and CHEM 1002 and gives ample opportunities for students to access course materials, including lecture slides and previous midterms and final exams. Our research would seem to support previous conclusions (Knight, 2010; Perera & Richardson, 2010) that indicate the importance of student-content interactions. Our data suggest that, at least in disciplines similar to General Chemistry, having an extensive course website is helpful to learning. As we discussed previously (see Table 8a, p. 21), the PASS program also aids students’ learning. This is in accordance with findings from previous research (Miles et al., 2010), which suggests that the benefits from PASS program are transferable to other disciplines. The benefits of attending class and tutorial sessions are also likely transferable to other disciplines. In this case, the lecture capture e-resource was found to be a suitable replacement for classroom and tutorial attendance. This would suggest that, in courses with a similar instructional approach, lecture capture (VOD) is a viable tool for students to use instead of attending class.
Attendance When considering the impact of e-resources on classroom attendance, only one e-resource, VOD, negatively impacted class attendance. In the case of CHEM 1001 and CHEM 1002, students chose either to physically attend class or to view the classes via VOD. As noted earlier, VOD use has no correlation, positive or negative, with student grade performance. When considering this more generally, it would seem to suggest that instructors should consider the potential impact that lecture capture may have on classroom attendance. Yet, at the same time, if their courses follow similar instructional strategies to CHEM 1001 and 1002 (including providing significant e-resources), lecture capture is an acceptable way for students to learn.
The Impact of Multiple Electronic Learning Resources on Student Academic Performance
Higher Education Quality Council of Ontario 31
Some of the CHEM 1001 and 1002 LMS e-resources positively correlate with attendance, suggesting that instructors could look to the LMS data as a proxy for student engagement. As many LMS provide easy instructor access to extensive analytics on student activities, instructors could use reports generated by the LMS as a barometer for how connected students are to the classroom learning environment. Other studies (e.g., Knight, 2010; Morris, Finegan, & Wu, 2005; Stewart & Nuttal, 2011; Von Konsky, Ivins, & Gribble, 2009) support similar conclusions. The number of e-resources and tools available to instructors has grown substantially. Instructors and administrators need help identifying those resources that are helpful to student learning and fit with the instructional strategies that they have selected. Our research suggests that students also need help in identifying which resources and activities may be the most helpful to their learning. On the one hand, providing students with a wealth of resources may allow them to create a personalized learning environment. On the other, they may also not be self-aware enough or have the necessary learning maturity to recognize which tools or behaviours are most beneficial to their learning. Instructors should consider guiding and directing novice learners to use the most useful e-resources by selecting resources that emphasize time-on-task and solve problems. Instructors may wish to directly address effective learning strategies in class or by providing a guide online.
The Impact of Multiple Electronic Learning Resources on Student Academic Performance
Higher Education Quality Council of Ontario 32
References Allen, D. O., & Webber, D. J. (2010). Attendance and exam performance at university: a case
study. Research in Post-Compulsory Education, 15(1), 33-47. Gosper, M., McNeil, M., Philips, R., Preston, G., Woo, K., & Green, D. (2010). Web-based
lecture technologies and learning and teaching: a study of change in four Australian universities. Research in Learning Technology, 18(3), 251-263.
Knight, J. (2010). Distinguishing the learning approaches adopted by undergraduates in their
use of online resources. Active Learning in Higher Education, 11(1), 67-76. Lewis, M. (2007). Stepwise versus Hierarchical Regression: Pros and Cons. Paper presented at
the annual meeting of the Southwest Educational Research Association. February 2007, San Antonio, TX.
Miles, C. A., Polovina-Vukovic, D., Litteljohn, D., & Marini, A. (2010). The Effectiveness of the
Peer-Assisted Study Sessions (PASS) Program in Enhancing Student Academic Success at Carleton University. Toronto: Higher Education Quality Council of Ontario.
Moore, S., Armstrong, C., & Pearson, J. (2008). Lecture absenteeism among students in
higher education. Journal of Higher Education Policy and Management, 30(1), 15-24. Morris, L., Finnegan, C., & Wu, S. (2005). Tracking student behaviour persistence and
achievement in online courses. Internet and Higher Education, 8, 221-231. Newman-Ford, L., Fitzgibbon, K., Lloyd, S., & Thomas, S. (2008). A large-scale investigation
between attendance and attainment: a study using an innovative, electronic attendance monitoring system. Studies in Higher Education, 33(6), 699-717.
Nie, M., Armellini, A., Harrington, S., Barklamb, K., & Randall, R. (2010). The role of
podcasting in effective curriculum renewal. Research in Learning Technology, 18(2), 105-118. Perera, L., & Richardson, P. (2010). Student’s use of online academic resources within a course web site and
site relationship with their course performance: An exploratory study. Accounting Education: An International Journal, 19(6), 587-600.
Stewart, M., Stott, T., & Nuttall, A. (2011). Student engagement patterns over the duration of
level 1 and level 3 geography modules: Influences on student attendance, performance, and use of online resources. Journal of Geography in Higher Education, 35(1), 47-65.
Traphagan, T., Kucser, J. V., & Kishi, K. (2010). Impact of class lecture webcasting on
attendance and learning. Education Tech Research Dev, 58, 19-37.
The Impact of Multiple Electronic Learning Resources on Student Academic Performance
Higher Education Quality Council of Ontario 33
Von Konsky, B. R., Ivins, J., & Gribble, S. J. (2009). Lecture attendance and web-based lecture technologies: a comparison of student perceptions and usage patterns. Australasian Journal of Educational Technology, 25(4), 581-595.
Westerman, J. W., Perez-Batre, L. A., Coffey, B. S., & Pouder, R. W. (2011). The relationship
between undergraduate attendance and performance revisited: alignment of student and instructor goals. Decision Sciences Journal of Innovative Education, 9(1), 49-67.