the impact of seabed rock roughness on tidal stream power
TRANSCRIPT

HAL Id: hal-01673396https://hal.archives-ouvertes.fr/hal-01673396
Submitted on 3 Jan 2018
HAL is a multi-disciplinary open accessarchive for the deposit and dissemination of sci-entific research documents, whether they are pub-lished or not. The documents may come fromteaching and research institutions in France orabroad, or from public or private research centers.
L’archive ouverte pluridisciplinaire HAL, estdestinée au dépôt et à la diffusion de documentsscientifiques de niveau recherche, publiés ou non,émanant des établissements d’enseignement et derecherche français ou étrangers, des laboratoirespublics ou privés.
The impact of seabed rock roughness on tidal streampower extraction
Nicolas Guillou, Jérôme Thiebot
To cite this version:Nicolas Guillou, Jérôme Thiebot. The impact of seabed rock roughness on tidal stream power extrac-tion. Energy, Elsevier, 2016, 112, pp.762-773. �10.1016/j.energy.2016.06.053�. �hal-01673396�

The impact of seabed rock roughnesson tidal stream power extraction
by
Nicolas Guillou and Jérôme Thiébot
Full citation of this article is :Guillou N., Thiébot J. (2016). The impact of seabed rock roughness on
tidal stream power extraction. Energy, vol. 112, pp. 762-773, doi :10.1016/j.energy.2016.06.053
Please note that this is an author-produced PDF of the draft of themanuscript submitted to Energy. The definitive publisher-authenticated
version is available on the publisher Web site.

The impact of seabed rock roughness on tidal stream powerextraction.
Nicolas Guilloua,∗, Jerome Thiebotb
aLaboratoire de Genie Cotier et Environnement (LGCE), Cerema/DTecEMF/DS, 155 rue PierreBouguer Technopole Brest-Iroise - BP 5 - 29280 Plouzane, France
bNormandie Univ., UNICAEN, LUSAC, EA4253, site universitaire de Cherbourg, rue Louis Aragon,BP 78, F-50130 Cherbourg-Octeville, France
Abstract
Numerical assessments of environmental disturbances induced by a tidal farm projectrely usually on local modifications of the friction coefficient over the area covered bya proposed array. Nevertheless, no study has investigated the sensitivity of predic-tions to surrounding seabed friction. The present investigation focuses on impacts ofroughness parameterisation of rock outcrops, a typical seabed of tidal stream sites. Ahigh-resolution depth-averaged circulation model is implemented in the Fromveur Straitoff western Brittany, a region with strong potential for array development, integratingthe heterogeneity of sediment bottom types. Rock roughness strongly influences initialpredictions of tidal current and kinetic energy in the Strait with variations of availablepower up to 30 %. Tidal energy extraction induces noticeable reductions of tidal currentsand bottom shear stresses up to 15 km from the array considered till surrounding sand-banks. Rock roughness impacts farm-induced modifications of tidal currents, bottomshear stresses and stream powers till north-eastern and southward edges of the Straitwith major absolute differences identified in its central part. Surrounding sandbanks arefinally suggested to variations of shear stresses from 9 to 17 % over the Bank of the Fourwith possible implications on local sediment deposition.
Keywords: marine renewable energy, TELEMAC 2D, western Brittany, Sea of Iroise,Fromveur Strait, unstructured grid
1. Introduction
The exploitation of tidal stream power is currently considered as a promising solutionfor rising the proportion of marine renewable energy to the worldwide energy production[1, 2]. Major well-known advantages are the highly predictable and regular characteristicsof the resource, the substantial degree of modularity in extracting the energy [3], the highload fluid factor and the reduced visual impact of tidal stream devices in comparison with
∗Corresponding authorEmail addresses: [email protected] (Nicolas Guillou ), [email protected]
(Jerome Thiebot)
Preprint submitted to Energy October 21, 2016

wind or waves systems. Tidal kinetic power has thus attracted significant interest fromleading developers of tidal energy converters (TEC) with numerous full-scale devicestested in the real environment [4]. Considering the increasing technical development ofdevices, the question of the hydro-environmental impact of tidal stream farms is of majorinterest to guarantee successful deployment in the marine environment. Indeed, besides alocal modification of available power distribution, potential far-field effects are expectedwith modifications of hydrodynamics components and associated transport of particlesat several kilometres from the proposed array [5, 6, 7].
As observations in the real environment with tidal stream farms are not availabletoday, investigations of far-field impacts rely nowadays on regional numerical modelling.Hydrodynamic effects of tidal stream devices, which generally take the form of horizontalaxis turbines [8], are most of the time approached with an equivalent drag force termredistributing the sum of turbines’ thrust and structural drag forces over the area coveredby a proposed array [9, 10, 11]. Whereas uncertainties exist about parameterisations ofdrag coefficients, upstream velocities [12, 13] or wake-wake interactions within the ar-ray [14], these formulations provide a global assessment of tidal stream power extractionparticularly suited for the early stages of a tidal farm project while restricting the compu-tational costs of simulations. Numerical sensitivity studies to the array-drag coefficienthave thus helped potential developers to optimize projects of stream farms in terms ofsize, thrust and structural drag coefficients and number of turbines [7, 15, 16].
Nevertheless, in spite of local sensitivity studies to array-drag coefficients, no addi-tional investigation has been devoted to the influence of surrounding seabed friction onTEC-induced modifications. Indeed, numerical sensitivity studies have primarily focusedon the regional influence of bottom friction on tides exhibiting, in continental shelf en-vironments, its effects on currents amplitude and asymmetry, and transport of particles[17, 18, 19]. These aspects have however been set aside in numerical assessments of avail-able tidal stream power and TEC effects assuming uniform bottom friction coefficients,based (1) on Manning-Strickler [7, 10] or Chezy [20] formulations in depth-averaged mod-els or (2) on uniform quadratic friction law in three-dimensional approaches [21, 22, 23].Further investigations about the influence of bottom friction, integrating the spatial het-erogeneity of sediment bottom types, are thus necessary as (1) induced modifications oftidal stream array depend on initial estimates of current fields and (2) more significanteffects are expected on predicted energy outputs and sediment transport rates which varywith a power of tidal current amplitude.
The present study investigates the numerical sensitivity of tidal stream power ex-traction to the parameterisation of bottom roughness. Bottom friction depends howeveron different settings and forcings including bed-sediment composition and morphology ofthe sea bottom [24], and influence of hydrodynamic processes such as interactions of waveand current bottom boundary layers [25]. Taking into account the difficulty to separateeach contribution, the influence of time-variable bottom roughness is disregarded herefocusing on effects of intrinsic seabed properties. The attention is devoted to sensitivityof numerical predictions to roughness parameter of rock outcrops, a typical seabed oftidal stream sites whose roughness is characterised by a relative uncertainty in relationto the shape of seabed features [24]. This sensitivity study will furthermore give fur-ther insights about the calibration of seabed roughness in numerical assessments of TECeffects at the early stages of a farm project.
After a description of the study site (Section 2.1), the emphasis is put on the theoret-2

ical formulation and implementation of hydrodynamic model (Section 2.2). Predictionsare first assessed against available in-situ observations of current amplitude and direction(Section 3.1) exhibiting the local numerical sensitivity to roughness parameterisation ofrock outcrops (Section 3.2). Synoptic effects on tidal current amplitude and associatedkinetic energy are then evaluated in spring tidal conditions. Modifications induced bythe presence of a tidal stream farm are finally investigated focusing on key parametersof maximum currents amplitude and available stream power 10 m above the seabed(the assumed technology hub height for the region considered), and bottom shear stress(Sections 3.3 and 3.4).
2. Materials and methods
2.1. Study region
The site of application is the Fromveur Strait, off western Brittany, separating theisle of Ushant from a group of islets and rock belonging to the Molene archipelago (Fig.1). With annual peak velocities exceeding 4 m s−1 [26] and mean water depths of 50 m,this location is one of the largest tidal stream resource along the coasts of France. Arestricted area of interest of 4 km2 has thus been identified by the French governmentfor the development of tidal farm projects. The exploitation of tidal kinetic energy fromthis site is a promising alternative for restricting current energy consumption of the islesof Ushant and Molene, currently based on expensive and polluting fuel power station.In this perspective, a horizontal axis turbine known as Sabella D10 is currently tested inthe Fromveur Strait by the French company Sabella SAS and connected to the electricitygrid of the isle of Ushant. This turbine with rated power output of 0.5 MW for a tidalcurrent velocity of 3 m s−1 is a first step toward the implementation of a tidal streamfarm in the Strait.
Tide propagates from the Gulf of Biscay in the South towards the English Channel inthe North travelling around western Brittany thus generating clockwise rotating currentsin the area of interest. The Strait is furthermore characterised by a strong asymmetry oftidal currents with a north-eastern flood-dominated sector and a southward ebb domi-nated region [27]. This asymmetry, likely associated with the funnel shape configurationof the Strait, decreases toward the centre of the area where the tidal flow is balancedwith equivalent magnitudes of flood and ebb components. The seabed presents finallya highly heterogeneous spatial distribution of bottom-sediment grain sizes characterisedby a succession of gravel deposits and localised sand supplies [28] (Fig. 2). Rocky sub-strates cover the major part of shallow water areas surrounding islands and islets ofthe Ushant-Molene archipelago spreading over nearly all the north-eastern part of theFromveur Strait. Surrounding seabeds in deep waters are dominated by gravel depositswith localised sand supplies over the sand banks of Ushant (point #1, Fig. 1) and theFour (point #2, Fig. 1) [29].
2.2. Numerical model
Simulations are performed with the bi-dimensional horizontal (2DH) model TELEMAC2D (version 6p3) of the finite-element modelling system TELEMAC [31]. The major ad-vantage of this simulation tool in comparison with other shallow-water models is the
3

Figure 1: Bathymetry of Ushant-Molene archipelago with locations of available current meters ( ). Themagenta line in the Fromveur Strait delimits the region of interest for implementation of tidal streamdevices. Water depth is relative to mean sea level.
use of an unstructured mesh particularly suited, in the present investigation, (1) to cap-ture the complex coastline geometry of the isles and islets of Ushant-Molene archipelagoand (2) to reach a refined spatial resolution over the tidal stream site while sparing pro-hibitive computational costs with a reduced number of grid nodes. TELEMAC 2D solvesthe shallow water Barre de Saint-Venant equations of continuity (Eq. 1) and momen-tum (Eq. 2), derived from the three-dimensional Navier-Stokes equations by averagingover the water column. The derivation of depth-averaged shallow-water equations relyon major assumptions of hydrostatic pressure, negligible vertical velocity and imperme-ability of the surface and the bottom. These equations take the following mathematicalexpressions :
∂h
∂t+ ~u.~∇(h) + h∇.~u = 0 (1)
∂ui∂t
+ ~u.~∇ui = −g ∂zs∂xi
+1
h∇.(hνt~∇ui) + Si (2)
where i = (x, y) with x and y the geographical coordinates, t denotes time, h is the totalwater depth, g is the gravity acceleration, ~u = (ux, uy) is the depth-averaged velocity, zsis the water elevation and νt is the horizontal momentum diffusion coefficient computed
4

Figure 2: Sediment bottom types in and around the Fromveur Strait (adapted from Hamdi et al. [30]).
with a depth-averaged k − ε model. Si accounts for sinks in the momentum equationsrelated to (1) bottom friction Sbf and (2) forces induced by TEC Stec: ~Si = ~Sbf,i+ ~Stec,i.The default version of TELEMAC 2D has been modified to integrate these two sinkterms. Associated computation methods retained here are briefly detailed hereafter.
Resulting from the average of Navier-Stokes equations along the water column, bottom-friction sink term is computed with the bottom shear stress τb as Sbf,i = −τb,i/(ρh cos(α))where ρ is the water density taken equal to 1025 kg m−3 and cos(α) is the cosine recipro-cal of the steepest slope at one point [31]. Assuming a logarithmic vertical velocity profilebased on the law of the wall [32], the bottom shear stress is approached with a quadraticfriction law: ~τb = ρCb|u|~u where Cb is the bottom drag coefficient. Its mathematicalexpression is given by
Cb =κ2
ln2 [h/(ez0)](3)
where κ = 0.4 is the von Karman constant and z0 is the roughness parameter definedas the height above the bed at which the fluid velocity is zero. As exhibited by Soulsby[32], coarse sand and gravels are characterised by hydrodynamically rough turbulentregimes in the marine environment. Considering the spatial distribution of sedimentbottom types in the area of interest (Fig. 2), this assumption is retained here. Theroughness parameter can thus be formulated in terms of the physical roughness of thebed neglecting influences of water viscosity and current speed [24]. The formulation ofCb (Eq. 3) associates thus seabed friction with values of z0 for different sediment bottomtypes.
Following most common numerical approaches [7, 9, 10, 21, 33, 34], tidal farm effectsare included, at the scale of the tidal stream array, as an additional bed friction sink
5

terms Stec in the momentum equations: Stec,i = −τtec/(ρh|u|)ui where τtec is the stressterm exerted by the turbine array on the flow. Its mathematical expression is obtainedby averaging the total drag from turbines over the area covered by the proposed arrayAe: τtec = nF/Ae where n is the total number of devices and F is the individual totaldrag force from a single turbine. The individual drag is computed with the formulationproposed by Plew and Stevens [16] which includes the thrust and the structural drag ofthe device as
~F =1
2ρ(CtA+ CdAs)|u|~u (4)
where A is the area swept by blades, As is the projected area of structural components inthe vertical plane normal to the flow, and Ct and Cd are the thrust and structural dragcoefficients, respectively. The thrust is considered over a cut-in speed uc from which theturbine is in function. Assuming that the energy lost to turbulence is constant relative tothe power produced, the thrust coefficient is considered constant equal to Ct0 between ucand the design speed ud at which device reaches its maximum power output Pmax. Forhigher velocities, Ct decreases to limit power output and to protect the device generator.The thrust coefficient is thus parameterised as
Ct = 0 for u < ucCt = Ct0 for uc ≤ u ≤ udCt = Ct0
Cp0
2Pmax
ρAu3 for u > ud
(5)
where Cp0 is the power coefficient. Devices’ parameterisations are taken from Plew andStevens [16]. The blade diameter is taken equal to 18.6 m corresponding to a total sweptarea A ' 272 m2. The area of structural components is assumed to be 10 % of theturbine swept area (As = 0.1A) while a high value of the drag coefficient Cd = 0.9 isadopted to integrate effects of surface fouling. Devices are in function for flow speedover uc = 1 m s−1. The constant value of the thrust coefficient is finally taken equal toCt0 = 0.8. The design speed and maximum power output have however been reviewedto be consistent with surrounding hydrodynamic conditions and planned stream devicesin the Fromveur Strait: Pmax = 1 MW and ud = 2.8 m s−1 corresponding to a powercoefficient Cp0 = 0.31.
2.3. Setup
TELEMAC 2D is set up on an unstructured computational grid covering the westernextend of Brittany, and comprising 19068 nodes and 37019 triangular finite elements witha size ranging from 10 km at offshore boundaries to less than 50 m in the Fromveur Strait(Fig. 3). The geographical limits of the domain are similar to the grid used by Guillouand Chapalain [35, 36]. The bathymetry includes different databases among which are (1)the regional database of Loubrieu [37] with a spatial resolution of 1 km and (2) the high-resolution coverage of the Ushant-Molene archipelago established during the Litto3Dproject [38]. From the offshore extent of the isle of Ushant to the eastern boundary,sediment bottom types are determined on the basis of the map established by Hamdi etal. [30] (Ifremer, “Agence des Aires Marines Protegees”). If a computational grid node islocated inside a patch identified in this sedimentological cartography, the correspondingnature of the seabed is assigned to this node. The associated roughness parameter is thenprescribed according to observations of z0 for different bottom types compiled by Soulsby
6

Figure 3: Detailed view of the unstructured computational grid in and around the Fromveur Strait.
[24]. The sensitivity of numerical predictions is evaluated with seven values of z0 in areasof rock outcrops: 3.5, 5.0, 10.0, 15.0, 20.0, 30.0 and 50.0 mm. Following parameterisationsretained in regional tidal model covering the western extend of Brittany [19, 39, 40], thebottom roughness parameter is set to an uniform value of z0 = 3.5 mm offshore wherethe nature of the seabed can not be identified from the sedimentological cartography [30].The model is implemented with a time step of 1 s neglecting influences of atmosphericpressure, wind velocity components and surface-gravity waves. Simulations are driven by13 major harmonic tidal constituents (K1, O1, P1, Q1, M2, S2, N2, K2, M4, MS4, MN4,Mm, Mf ) of the TPXO7.2 database covering the area of interest with a spatial resolutionof 0.25 o [41]. Prescribed sea level variations and free normal velocities are considered atthe open boundaries. When considered, tidal stream devices are placed in the restrictedarea of interest identified in the Fromveur Strait (Fig. 1). According to Thiebot et al.[10], a density of 50 machines per km2 is retained here which corresponds to a totalof 207 turbines placed in the tidal farm. Numerical results are evaluated with a series
of statistical parameters including the standard deviation STD =√
1N
∑i=Ni=1 |yi − y|2,
the mean relative error MRErel = MRE/x × 100 with MRE = 1N
∑i=Ni=1 (yi − xi) and
the index of agreement RE [42] where N is the number of data in the discretised seriesconsidered, (xi) and (yi) represent the two sets of measured and simulated values, and xand y are the mean values of observed and simulated data, respectively. Positive values ofMRE and MRErel indicate thus a mean overestimation of observations whereas negativesvalues account of a mean underestimation. RE varies between 0 and 1. Its equals tounity for perfect agreement.
7

3. Results and discussion
3.1. Evaluation of model predictions
The evaluation of model predictions is performed against available in-situ observa-tions of current amplitude and direction at points 1010 and 1011 (Fig. 1 and Table 1).These observations have been acquired by a 600 kHz RDI ADCP (Acoustic DopplerCurrent Profiler) deployed by the French Navy SHOM (“Service Hydrographique etOceanographique de la Marine”). Measurements period correspond to different neap-spring tidal conditions: (1) from 19 March to 2 April 1993 at point 1010 and (2) from14 May to 11 June 1993 at point 1011. Whereas ADCP data are available in 2 m binsdistributed throughout the water column at both measurement points, comparisons be-tween observations and predictions are performed 10 m above the bed as this correspondsto the operating height of planned horizontal axis turbines in the Strait. Values 10 mabove the bed are computed from predicted depth-averaged velocities assuming a verticallogarithmic profile in the water column. Fig. 4 presents the comparison for predictionswith a roughness parameter z0 = 20 mm over rock outcrops. An overall good agree-ment is obtained for the current amplitude at point 1010 with an index of agreementRE=0.98. Predictions reproduce also the weak asymmetry of tidal current in the Straitcharacterised by slightly larger amplitudes of south-west directed components at point1010 [27]. This asymmetry is however far more pronounced at point 1011 with (1) strongand short north-eastern components and (2) reduced long-lasted south-western veloci-ties. In spite of higher differences than at point 1010 with an index RE=0.78, numericalresults reproduce the observed asymmetry of current amplitude at point 1011, seeminglyassociated with the formation of a tidal recirculation in the north of the isle of Molene.Whereas slight deviations are identified in current directions, simulated values appearconsistent with observations, reproducing at both measurement sites abrupt changes be-tween south-west and north-east directed velocities. This local assessment of model’sperformances is supplemented by a regional comparison of predictions with numericalestimations provided by the SHOM at the scale of Ushant-Molene archipelago [43] (Fig.5). This synoptic evaluation confirms the ability of the model to approach temporal andspatial variabilities of spring tidal currents in the area of interest.
Table 1: Description of current measurement campaigns.
Points Coordinates Water depths Periods
Lon. Lat (m) of measurements
1010 5.036 o W 48.449 o N 53 19/03/1993 → 02/04/1993
1011 4.945 o W 48.423 o N 29 14/05/1993 → 11/06/1993
3.2. Effects of seabed roughness without turbines
Local predictions appear however sensitive to the value retained for the roughness pa-rameter over rock outcrops (Fig. 6). Increasing z0 results thus in a decrease of tidal cur-rent amplitude at both measurement points with associated mean relative errors MREreldecreasing from 2.2 to −2.8 % at point 1010, and from 24.0 to 11.3 % at point 1011. Aspredictions of current direction at point 1010 are barely sensitive to bottom roughness
8

Figure 4: Measured (black line) and computed (for z0 = 20 mm over rock outcrops) (blue line) timeseries of the amplitude and direction (anticlockwise convention from the East) of the current 10 m abovethe bed at points 1010 and 1011.
Figure 5: Current ellipses at 10 m above the bed for mean spring tidal conditions (blue) issued from theSHOM database [43] and (red) predicted in configuration with z0 = 20 mm over rock outcrops.
parameterisation, a foremost calibration of z0 over rock outcrops is determined on thebasis of predicted amplitudes at this measurement point. Best comparisons are obtainedfor roughness parameters between 15 and 20 mm with MRErel between -0.47 and 0.08 %.More significant sensitivity to roughness of rock outcrops is however obtained at point1011. Whereas the mean relative error of |U | is found to decrease by increasing theroughness parameter, best estimations of current direction are obtained for values of z0
9
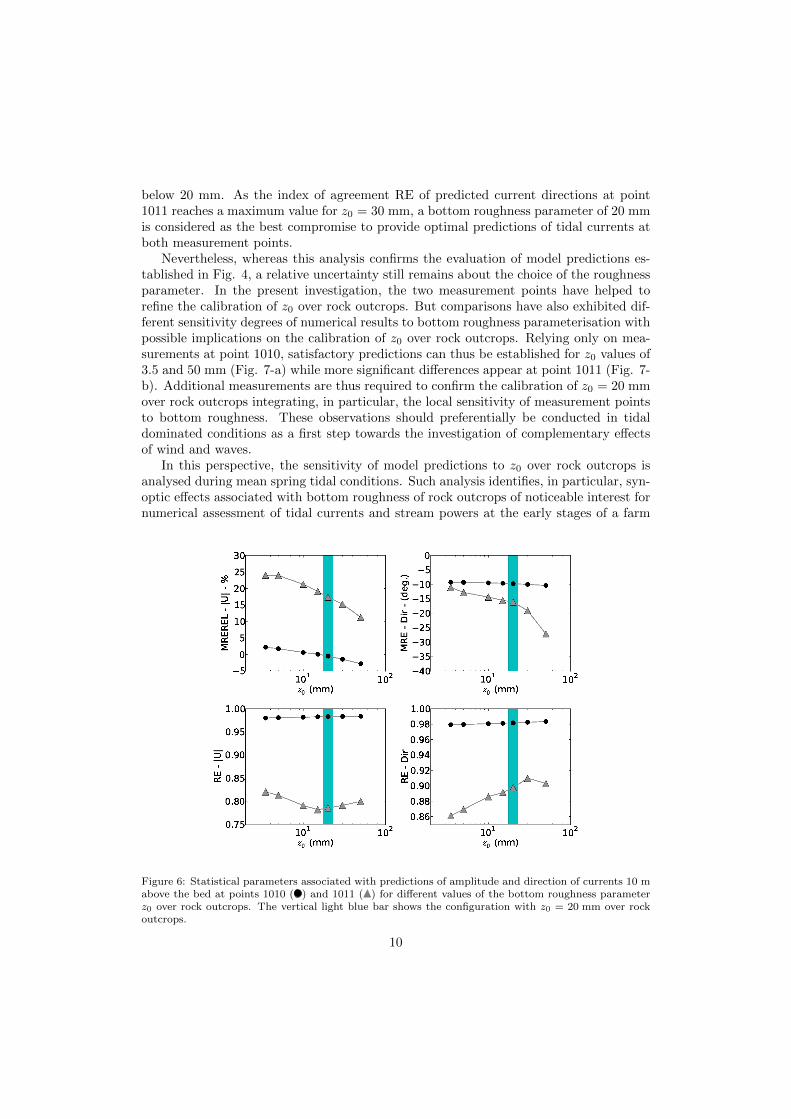
below 20 mm. As the index of agreement RE of predicted current directions at point1011 reaches a maximum value for z0 = 30 mm, a bottom roughness parameter of 20 mmis considered as the best compromise to provide optimal predictions of tidal currents atboth measurement points.
Nevertheless, whereas this analysis confirms the evaluation of model predictions es-tablished in Fig. 4, a relative uncertainty still remains about the choice of the roughnessparameter. In the present investigation, the two measurement points have helped torefine the calibration of z0 over rock outcrops. But comparisons have also exhibited dif-ferent sensitivity degrees of numerical results to bottom roughness parameterisation withpossible implications on the calibration of z0 over rock outcrops. Relying only on mea-surements at point 1010, satisfactory predictions can thus be established for z0 values of3.5 and 50 mm (Fig. 7-a) while more significant differences appear at point 1011 (Fig. 7-b). Additional measurements are thus required to confirm the calibration of z0 = 20 mmover rock outcrops integrating, in particular, the local sensitivity of measurement pointsto bottom roughness. These observations should preferentially be conducted in tidaldominated conditions as a first step towards the investigation of complementary effectsof wind and waves.
In this perspective, the sensitivity of model predictions to z0 over rock outcrops isanalysed during mean spring tidal conditions. Such analysis identifies, in particular, syn-optic effects associated with bottom roughness of rock outcrops of noticeable interest fornumerical assessment of tidal currents and stream powers at the early stages of a farm
Figure 6: Statistical parameters associated with predictions of amplitude and direction of currents 10 mabove the bed at points 1010 ( ) and 1011 ( ) for different values of the bottom roughness parameterz0 over rock outcrops. The vertical light blue bar shows the configuration with z0 = 20 mm over rockoutcrops.
10

Figure 7: Measured (black line) and computed (with z0 = 3.5 mm, blue line, and z0 = 50 mm, red line,over rocks outcrops) time series of current amplitude 10 m above the bed at points (a) 1010 and (b)1011 during spring conditions of March and May 1993.
project (Figs. 8 and 9). Significant differences are obtained at the scale of Ushant-Molenearchipelago with an overall reduction of maximum tidal current amplitude by increasingz0 values over rock outcrops (Fig. 8). In narrow straits between islets and isles of Molenearchipelago, depth-averaged currents experience thus a reduction of maximum velocitiesover 30 % by rising z0 from 3.5 to 20 mm. Strong differences are also identified in thenorth-eastern and southward edges of the Fromveur Strait with a reduction of maxi-mum currents amplitudes up to 0.6 m s−1. Nevertheless, the central area of the Straitpresents modifications restricted below 6 % (less than 0.2 m s−1) as exhibited with thelocal sensitivity study at point 1010 (Fig. 6). This spatial distribution may be associatedwith the asymmetry of tidal currents in the Strait [27] (Section 2.1). Roughness of rockoutcrops in the central Strait impacts thus north-east directed current components inthe northern part of the Strait while the reverse happens in the southward region. Astidal flow is balanced in the central Strait with equivalent magnitudes of flood and ebbcomponents, only a reduced area of rock outcrops impacts currents over this area. Thearea with a reduced sensitivity corresponds thus to the region of rock outcrops identifiedin the central Strait (Fig. 2). Besides this remarkable evolution, predictions exhibit, inthe north-eastern edge of the Strait, an adjacent area to the main flow where currentamplitudes experience a reverse trend in comparison with the global evolution. Possiblecompensation effects of the flow passing the Strait may explain this spatial distribution.In spite of the restricted local sensitivity of tidal currents in the central Strait, signif-icant differences are obtained for predictions of available tidal stream powers over thearea identified for array implementation (Fig. 9). Over this area, mean and maximumtidal kinetic energies are thus reduced in the same proportion, by around 30 %, betweenconfigurations with z0 = 3.5 and 50 mm over rock outcrops. This result exhibits thegreat sensitivity of numerical assessment of available stream power to bottom roughness
11

of rock outcrops in the Fromveur Strait.
3.3. Effects of tidal stream power extraction
Prior to the investigation of rock roughness impacts on tidal stream power extraction,effects of the turbine array are analysed during mean spring tidal conditions, for thereference configuration with z0 = 20 mm over rock outcrops, focusing on modificationsof current amplitude, bottom shear stress and available stream power. Tidal powerextraction has a negligible influence on water level confirming previous numerical regionalassessments of turbines effects [7, 10, 16, 44]. More significant differences are howeverobtained on current amplitude, particularly noticeable along the flow passing the Strait(Fig. 10). Predicted modifications are typical of differences induced on velocities witha turbine array [7, 45, 46]. Current amplitude is thus reduced inside the array, andboth upstream and downstream the tidal farm while it is accelerated on the sides ofthe flow passing the farm location. The increase in current magnitude on both sides ofthe farm is attributed to the fact that flow not harnessed by the array is conveyed ina restricted area [44]. The perturbation magnitude reaches 0.7 m s−1 at ebb and floodpeaks for the tidal array configuration retained here. Confirming regional numericalinvestigations performed by Ahmadian et al. [7] and Neill et al. [9], noticeable changesin velocity magnitudes, over 10 % of mean depth-averaged currents during a spring tidalcycle (Figs. 11-a and b), occur furthermore at a distance of several kilometres from thearray. These modifications, which correspond to a decrease by nearly 0.10 m s−1 of tidalcurrent amplitude, appear at around 10 km from the tidal farm for north-east directedcurrents while it extends up to 15 km from the site of extraction for south-west directedvelocities. Such asymmetry may be related to the spatial north-eastern and southwardextents of maximum tidal current velocities in the Fromveur Strait as exhibited in Fig.8.
Whereas further investigations may be conducted on associated sediment transportrates and local modifications of seabed morphology relying on transport models [9, 10],difficulties associated with the calibration of such simulation rise numerous uncertaintiesfor the investigation of TEC effects. Instead, modification of maximum bottom shearstress τb,max is provided as an indicator of changes induced in sediment transport, par-ticularly relevant for estimating seabed sediments motion (Figs. 11-c and -d). Inducedmodifications of τb,max are highly correlated with differences identified for tidal currentsconfirming predictions established by Thiebot et al. [10] in the Alderney Race (EnglishChannel). In the present investigation, the extraction of tidal stream energy results thusin a reduction of maximum values of τb up to 30 % in the Fromveur Strait (Fig. 11-d)corresponding to a decrease of bottom shear stress over 10 N m−2 in its central part.Weaker modifications appear however off the Strait (modification of τb,max smaller than4 % over the bank of Ushant). Nevertheless, noticeable effects remain over the bank ofthe Four with a reduction of τb,max up to 12 %. Such evolution of local bottom shearstress may be associated with increased deposition of sediments over this sand bank.
Available tidal stream power experiences finally a significant reduction in the FromveurStrait by nearly 30 % for Pmean and Pmax during a mean spring tidal cycle (Fig. 12).This reduction exceeds the theoretical power output of the tidal stream array. This ispartly explained by the effects of thrust and structural drag forces on the flow. Firstly,as exhibited by the ratio between the thrust and power coefficients (Ct0/Cp0 ' 2.6) (Eq.5), more power is extracted from the available resource than outputted by the device at
12

Figure 8: (left) Maximum amplitudes of currents 10 m above the bed (umax(10 m)) and of depth-averaged currents (u2d,max) during mean spring tidal conditions for simulation with z0 = 20 mm overrock outcrops. (middle and right) Relative differences with respect to this configuration for simulationswith z0 = 3.5 and 50 mm over rock outcrops. Predictions of currents 10 m above the bed are shown formean water depths over 20 m.
13

Figure 9: (top) Maximum and mean predicted tidal stream powers 10 m above the bed during meanspring conditions for the reference configuration (z0 = 20 mm over rock outcrops). Predictions are shownfor mean water depths over 20 m. (bottom) Evolution of maximum and mean spring tidal stream powersaveraged over the area identified for array implementation for different values of z0 over rock outcrops.
14

Figure 10: (left) Depth-averaged currents for the reference configuration (z0 = 20 mm over rock outcrops)without tidal stream array and (right) differences in amplitude of depth-averaged currents by integratingeffects of tidal stream array at times of flood (T1) and ebb (T2) peaks in the Fromveur Strait. Positiveand negative values account for increase and reduction of currents with TEC, respectively.
15
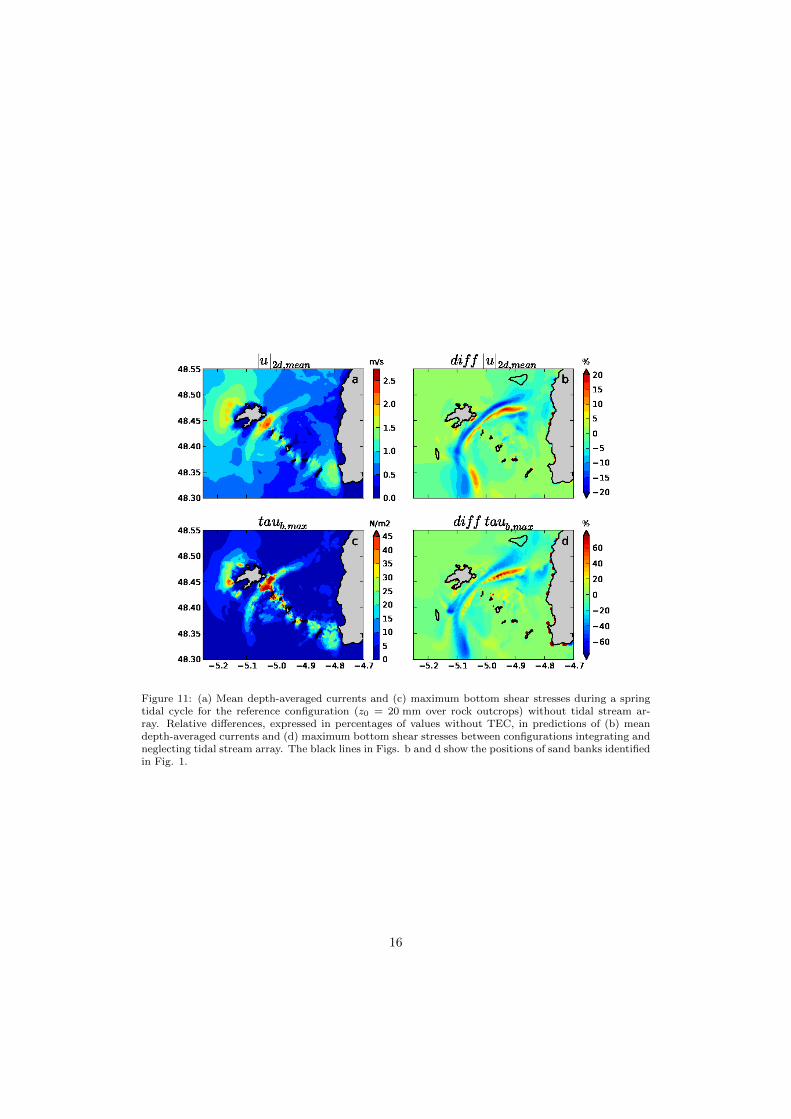
Figure 11: (a) Mean depth-averaged currents and (c) maximum bottom shear stresses during a springtidal cycle for the reference configuration (z0 = 20 mm over rock outcrops) without tidal stream ar-ray. Relative differences, expressed in percentages of values without TEC, in predictions of (b) meandepth-averaged currents and (d) maximum bottom shear stresses between configurations integrating andneglecting tidal stream array. The black lines in Figs. b and d show the positions of sand banks identifiedin Fig. 1.
16

high velocities exceeding the design speed ud. As the Fromveur Strait is characterisedby strong velocities exceeding ud over a large part of the tidal stream array at flood andebb peaks, the ratio Ct0/Cp0 results in a significant reduction of available tidal streampower at the scale of the farm. Secondly, the contribution of structural drag forces actsalso on the reduction of available power. According to Plew and Stevens [16], this effectmay be significant resulting in overestimation of peak and average power productionsduring spring tides when neglected.
Figure 12: Relative differences, expressed in percentages of values without TEC, in predictions of max-imum and mean tidal stream powers 10 m above the bed during a spring tidal cycle for the referenceconfiguration (z0 = 20 mm over rock outcrops) between simulations integrating and neglecting tidalstream array. Predictions are shown for mean water depths over 20 m.
3.4. Sensitivity of tidal stream energy extraction to rock bottom roughness
The impact of rock bottom roughness on tidal stream power extraction is investi-gated expressing induced modifications as ratios to the reference configurations withoutTEC. Fig. 13 shows relative differences induced by TEC in predictions of maximumcurrent and stream power 10 m above the bed, and bottom shear stress during a meanspring tidal cycle for three values of z0 over rock outcrops: 3.5, 15 and 50 mm. Bottomroughness parameterisation has a reduced influence on the overall spatial distributionof TEC-induced differences for the three key indicators considered here. Indeed, majorTEC-induced differences remain restricted along the extension of the Fromveur Strait asidentified in section 3.3 (Figs. 11 and 12). Rock bottom roughness influences howeverrelative differences in the north-eastern and southward edges of the Strait as exhibited bythe standard deviation of theses quantities (Fig. 14). In the north-eastern part, majorchanges are obtained over the acceleration area appearing on the side of the flow passingthe Strait which tends to deviate slightly towards the south and lessen by increasing
17

roughness of rock outcrops. In the southward region, main modifications concern thedeceleration area with noticeable effects appearing at the eastern side of the bank ofUshant.
Nevertheless, modifications appearing at the north-eastern and southward edges ofthe flow passing the Strait concern reduced magnitudes of current amplitude, bottomshear stress and stream power in comparison with values in the central part of the Strait(Figs. 8, 9 and 11-c). In this central area, rock roughness parameterisation has thus astrong influence on magnitudes of induced modifications as exhibited by the evolutionof available tidal stream powers over the area identified for array implementation (Fig.15). The central part of the Strait presents furthermore a pronounced sensitivity of shearstress predictions to bottom roughness values of rock outcrops. Whereas τb decreases by9 N m−2 over this central area for z0 = 3.5 mm over rock outcrops, the reduction exceeds14 N m−2 for z0 = 50 mm. This result exhibits the noticeable sensitivity of bottomshear-stress predictions to bottom roughness in the central part of the Strait.
Predictions over the bank of the Four (point #2) remain finally sensitive to bottomroughness parameterisation of rock outcrops. Over this area, the induced reductions ofmaximum currents amplitude 10 m above the bed vary thus in the range 4.6 − 8.8 %depending on z0 values retained over rock outcrops (Table 2). Differences are exacer-bated in the range 9.0− 16.9 % for τb predictions which vary with the square of currentamplitude. Over this area, the global tendency is a reduction of induced variations by in-creasing bottom roughness values. The magnitude of induced modifications of sedimenttransport rates and associated deposition over the bank of the Four will thus stronglydepend on values retained for z0 over rock outcrops. Variations obtained over the bank ofUshant (point #1) are finally restricted below 2.0 % for maximum current and 4.0 % formaximum bottom shear stress exhibiting a reduced sensitivity to tidal energy extractionand bottom roughness parameterisation over rock outcrops (Table 3).
4. Conclusions
The depth-averaged tidal circulation model TELEMAC 2D has been implementedin a region off western Brittany, that has been identified with strong potential for tidalarray development, in order to investigate and evaluate the impact of bottom roughnessparameterisation of rock outcrops on effects of tidal kinetic energy extraction. Numericalpredictions are assessed against available in-situ observations of tidal currents amplitudeand direction at two locations in the Fromveur Strait and shallow waters off the isle ofMolene. The main outcomes of the present study are as follow.
1. Significant differences are obtained for initial predictions of tidal currents and as-sociated stream powers, during a mean spring tidal cycle, particularly noticeablein the north-eastern and southward edges of the Strait with a reduction of maxi-mum depth-averaged velocities over 30 % between configurations with z0 = 3.5 and20 mm over rock outcrops. Rock bottom roughness influences also the initial esti-mates of tidal kinetic energy in the area identified for stream-array implementationwith a reduction of available power by 30 % by rising z0 from 3.5 to 50 mm.
2. Tidal kinetic energy extraction results in significant reduction of tidal current am-plitude, bottom shear stress and available stream power inside the array and both
18

Figure 13: Relative differences, with respect to the configuration without TEC, in predictions of max-imum (top) currents 10 m above the bed, (middle) bottom shear stresses and (bottom) tidal streampowers 10 m above the bed during a mean spring tidal cycle between configurations integrating andneglecting tidal stream array for three values of the bottom roughness parameter over rock outcrops(z0 = 3.5, 15 and 50 mm). Predictions 10 m above the bed are shown for mean water depths over 20 m.
Table 2: Predicted maximum currents at 10 m above the bed and bottom shear stresses at point #2during a mean spring tidal cycle without tidal stream array and associated relative differences with tidalstream array for different values of z0 over rock outcrops
z0 u10,max ( m s−1) ∆u10,max τb,max ( N m−2) ∆τb,max
(mm) without TEC with TEC without TEC with TEC
3.5 1.51 −8.8 % 3.67 −16.9 %
5.0 1.46 −8.2 % 3.40 −15.8 %
10.0 1.36 −7.2 % 2.95 −13.8 %
15.0 1.30 −6.6 % 2.72 −12.7 %
20.0 1.27 −6.4 % 2.57 −12.3 %
30.0 1.21 −5.7 % 2.36 −11.1 %
50.0 1.15 −4.6 % 2.11 −9.0 %
19

Figure 14: Standard deviations of relative differences displayed in Fig. 13 with respect to the sevenvalues of z0 over rock outcrops.
20

Figure 15: (red) Maximum and (blue) mean stream powers 10 m above the bed during a mean springtidal cycle averaged over the area identified for array implementation (continuous line, , ) withoutand (dotted line, , ) with tidal stream devices for different values of z0 over rock outcrops.
Table 3: Predicted maximum currents at 10 m above the bed and bottom shear stresses at point #1during a mean spring tidal cycle without tidal stream array and associated relative differences with tidalstream array for different values of z0 over rock outcrops
z0 u10,max ( m s−1) ∆u10,max τb,max ( N m−2) ∆τb,max
(mm) without TEC with TEC without TEC with TEC
3.5 1.98 −2.0 % 6.24 −3.9 %
5.0 1.94 −1.5 % 6.01 −3.0 %
10.0 1.87 −1.4 % 5.59 −2.7 %
15.0 1.82 −1.3 % 5.33 −2.5 %
20.0 1.78 −0.8 % 5.07 −1.5 %
30.0 1.72 −0.7 % 4.73 −1.5 %
50.0 1.64 −1.3 % 4.32 −2.5 %
21

upstream and downstream the tidal farm with flow acceleration on the sides. In-duced modifications appear furthermore several kilometres from the array with aprominent extension, up to 15 km, for south-west directed flow. In spite of thisasymmetry, more pronounced effects of tidal stream energy extraction are identifiedin the bank of the Four with a reduction of maximum bottom shear stress, up to12 %, in the reference configuration with z0 = 20 mm over rock outcrops.
3. Spatial distributions of TEC-induced differences show nearly similar spatial pat-terns with respect to bottom roughness parameterisation of rock outcrops. Mainmodifications of TEC-induced relative differences appear in the north-eastern andsouthward edges of the area of interest in relation to decrease and deviation of theflow passing the Strait. Nevertheless, rock roughness parameterisations stronglyinfluence the magnitude of induced differences in the central part of the Strait.Predictions established over the bank of the Four are finally sensitive to z0 valuesof rock outcrops exhibiting different degrees of induced-perturbations on sedimenttransport.
Whereas the present investigation focuses only on bottom roughness parameterisationof rock outcrops, strong sensitivity of numerical predictions have been exhibited for thepredictions without and with tidal stream farm. As numerical predictions are tradition-ally used by potential TEC developers to optimise devices configurations, such sensitivitystudy are suggested at the early stages of a tidal farm project. This is naturally a keyissue for a refined assessment of tidal stream project, based on Sabella D10 technology,currently planned in the Fromveur Strait. Extended field campaigns may thus be im-plemented to refine the calibration of bottom roughness promoting observations in areaswith the most pronounced sensitivity. Besides the implementation of different configu-rations of tidal stream array, this numerical analysis will benefit from the developmentand implementation of a multicomponent sediment transport model integrating the lo-cal heterogeneity of available seabed sediments. Another prospective of this researchwill consist in considering the influences of other forcings such as wind, atmosphericpressure, waves and temperature gradients on the calibration of bottom roughness pa-rameterisation. The associated results will naturally help to remove uncertainties aboutroughness parameterisation of rock outcrops in areas of interest for tidal stream farmimplementation.
Acknowledgements
The authors are grateful to Andre Simon (Cerema) for the process of sedimento-logical data. Current measurements were supplied by the Service Hydrographique etOceanographique de la Marine (SHOM). Simulations were performed on computer facili-ties CAPARMOR (“CAlcul PARallele Mutualise pour l’Oceanographie et la Recherche”).The present paper is a contribution to the research programs DIADEMS and FLUSED ofthe Laboratory of Coastal Engineering and Environment (Cerema, http://www.cerema.fr,http://memphys-lgce.fr.ht).
References
[1] I. Bryden, D. Macfarlane, The utilisation of short term energy storage with tidal current generationsystems, Energy 25 (9) (2000) 893–907.
22

[2] I. Bryden, S. Naik, P. Fraenkel, C. Bullen, Matching tidal current plants to local flow conditions,Energy 23 (9) (1998) 699–709.
[3] S. Neill, M. Hashemi, M. Lewis, Optimal phasing of the European tidal stream resource using thegreedy algorithm with penalty function, Energy 73 (2014) 997–1006.
[4] P. L. Fraenkel, Marine current turbines: pioneering the development of marine kinetic energyconverters, P. Mech. Eng. A-J Pow 221 (2007) 159–169.
[5] S. Neill, E. Litt, S. Couch, A. Davies, The impact of tidal stream turbines on large-scale sedimentdynamics, Renewable Energy 34 (2009) 2803–2812.
[6] I. Bryden, S. Couch, Me1-marine energy extraction: tidal resource analysis, Renewable Energy 31(2006) 133–139.
[7] R. Ahmadian, R. Falconer, B. Bockelmann-Evans, Far-field modelling of the hydro-environmentalimpact of tidal stream turbines, Renewable Energy 38 (1) (2012) 107–116.
[8] M. Khan, G. Bhuyan, M. Iqbal, J. Quaicoe, Hydrokinetic energy conversion systems and assessmentof horizontal and vertical axis turbines for river and tidal applications: a technology status review,Applied Energy 86 (10) (2009) 1823–1835.
[9] S. Neill, J. Jordan, S. Couch, Impact of tidal energy convertor (TEC) arrays on the dynamics ofheadland sand banks, Renewable Energy 37 (2012) 387–397.
[10] J. Thiebot, P. Bailly du Bois, S. Guillou, Numerical modeling of the effect of tidal stream turbines onthe hydrodynamics and the sediment transport - Application to the Alderney Race (Raz Blanchard),France, Renewable Energy 75 (2015) 356–365.
[11] M. Sanchez, R. Carballo, V. Ramos, G. Iglesias, Tidal stream energy impact on the transient andresidual flow in an estuary: A 3D analysis, Applied Energy 116 (2014) 167–177.
[12] T. Roc, D. Conley, D. Greaves, Methodology for tidal turbine representation in ocean circulationmodel, Renewable Energy 51 (2013) 448–464.
[13] S. Kramer, M. Piggott, A correction to the enhanced bottom drag parameterisation of tidal turbines,Renewable Energy 92 (2016) 385–396.
[14] C. Garrett, P. Cummins, The efficiency of a turbine in a tidal channel., Journal of Fluid Mechanics588 (2007) 243–251.
[15] R. Vennell, Tuning tidal turbines in-concert to maximise farm efficiency., Journal of Fluid Mechanics671 (2011) 587–604.
[16] D. Plew, C. Stevens, Numerical modelling of the effects of turbines on currents in a tidal channel -Tory Channel, New Zealand, Renewable Energy 57 (2013) 269–282.
[17] A. Nicolle, M. Karpytchev, Evidence for spatially variable friction from tidal amplification andasymmetry in the Pertuis Breton (France), Continental Shelf Research 27 (2007) 2346–2356.
[18] S. Kumar, R. Balaji, Effect of bottom friction on tidal hydrodynamics along Gulf of Khambhat,India, Estuarine, Coastal and Shelf Science 154 (2015) 129–136.
[19] N. Guillou, G. Chapalain, E. Duvieilbourg, Modelling impact of bottom roughness on sea surfacetemperature in the Sea of Iroise, Continental Shelf Research 54 (2013) 80–92.
[20] M. Hashemi, S. Neill, P. Robins, A. Davies, M. Lewis, Effect of waves on the tidal energy resourceat a planned tidal stream array., Renewable Energy 75 (2015) 626–639.
[21] P. Robins, S. Neill, M. Lewis, S. Ward, Characterising the spatial and temporal variability of thetidal-stream energy resource over the northwest European shelf seas., Applied Energy 147 (2015)510–522.
[22] S. Neill, M. Hashemi, M. Lewis, The role of tidal asymmetry in characterizing the tidal energyresource of Orkney, Renewable Energy 68 (2014) 337–350.
[23] M. Lewis, S. Neill, P. Robins, M. Hashemi, Resource assessment for future generations of tidal-stream energy arrays, Energy 83 (2015) 403–415.
[24] R. Soulsby, The bottom boundary layer of shelf seas, in: B. E. Johns (Ed.), Physical Oceanographyof Coastal and Shelf Seas, Elsevier, Amsterdam, 1983, pp. 189–266.
[25] W. Grant, O. Madsen, Combined wave and current interaction with a rough bottom, Journal ofGeophysical Research 84 (C4) (1979) 1797–1808.
[26] SHOM, Courants de maree - Cote Ouest de Bretagne, Technical Report, Service Hydrographiqueet Oceanographique de la Marine (1994).
[27] M. Thiebaut, A. Sentchev, Estimation of tidal stream potential in the Iroise Sea from velocityobservations by high frequency radars, Energy Procedia 76 (2015) 17 – 26, European GeosciencesUnion General Assembly 2015 - Division Energy, Resources and Environment, EGU 2015.
[28] A. Hamdi, French marine landscapes maps, Technical report, Ifremer (2007).[29] F. Hinschberger, A. Guilcher, M. Pruleau, A. Moign, Y. Moign, Carte sedimentologique sous-marine
des cotes de France. Feuille de Brest. Echelle 1/100000., Tech. rep., DGRST-CNEXO (1968).
23
[30] A. Hamdi, M. Vasquez, J. Populus, Cartographie des habitats physiques Eunis - Cotes de France,Technical Report DYNECO/AG/10-26/JP, Ifremer (2010).
[31] J. Hervouet, Hydrodynamics of free surface flows, modelling with the finite element method, Cam-bridge University Press, Cambridge, 2007.
[32] R. Soulsby, Dynamics of marine sands, H.R. Wallingford, 1997.[33] Z. Defne, K. Haas, H. Fritz, Numerical modeling of tidal currents and the effects of power extraction
on estuarine hydrodynamics along the Georgia coast, USA, Renewable Energy 36 (2011) 3461–3471.[34] P. Work, K. Haas, Z. Defne, T. Gay, Tidal stream energy site assessment via three-dimensional
model and measurements, Applied Energy 102 (2003) 510–519.[35] N. Guillou, G. Chapalain, Numerical modelling of nearshore wave energy resource in the Sea of
Iroise, Renewable Energy 83 (2015) 942–953.[36] N. Guillou, G. Chapalain, Wave energy potential in the Sea of Iroise, in: 11th European Wave and
Tidal Energy Conference Series, Nantes, France, 2015.[37] B. Loubrieu, J. Bourillet, E. Moussat, Bathy-morphologique regionale du Golfe de Gascogne et de
la Manche, modele numerique, Tech. rep., Ifremer (2008).[38] L. Louvart, C. Grateau, The Litto3D project, in: Oceans 2005 - Europe, Brest, France, 2005.[39] H. Muller, F. Dumas, B. Blanke, V. Mariette, High-resolution atmospheric forcing for regional
oceanic model: the Iroise Sea, Ocean Dynamics 57 (4-5) (2007) 375–400.[40] N. Guillou, G. Chapalain, E. Duvieilbourg, Sea surface temperature modelling in the Sea of Iroise:
assessment of boundary conditions, Ocean Dynamics 63 (2013) 849–863.[41] G. Egbert, A. Bennett, M. Foreman, TOPEX/POSEIDON tides estimated using a global inverse
model, Journal of Geophysical Research 99 (1994) 24821–24852.[42] C. Willmott, On the validation of models, Physical Geography 2 (2) (1981) 219–232.[43] SHOM, http://datashom.fr (2016).[44] V. Ramos, R. Carballo, M. Alvarez, M. Sanchez, G. Iglesias, Assessment of the impacts of tidal
stream energy through high-resolution numerical modelling, Energy 61 (2013) 541–554.[45] L. Myers, A. Bahaj, An experimental investigation simulating flow effects in first generation marine
current energy converter arrays, Renewable Energy 37 (2012) 28–36.[46] R. Ahmadian, R. Falconer, Assessment of array shape of tidal stream turbines on hydro-
environmental impacts and power output, Renewable Energy 44 (2012) 318–327.
24
View publication statsView publication stats