the impact of the 1896 factory and shops act on …ftp.iza.org/dp10388.pdfthe impact of the 1896...
TRANSCRIPT

Forschungsinstitut zur Zukunft der ArbeitInstitute for the Study of Labor
DI
SC
US
SI
ON
P
AP
ER
S
ER
IE
S
The Impact of the 1896 Factory and Shops Act onVictorian Labour Markets
IZA DP No. 10388
November 2016
Andrew SeltzerJeff Borland
The Impact of the 1896 Factory and Shops Act on Victorian Labour Markets
Andrew Seltzer Royal Holloway, University of London
and IZA
Jeff Borland
University of Melbourne
Discussion Paper No. 10388 November 2016
IZA
P.O. Box 7240 53072 Bonn
Germany
Phone: +49-228-3894-0 Fax: +49-228-3894-180
E-mail: [email protected]
Any opinions expressed here are those of the author(s) and not those of IZA. Research published in this series may include views on policy, but the institute itself takes no institutional policy positions. The IZA research network is committed to the IZA Guiding Principles of Research Integrity. The Institute for the Study of Labor (IZA) in Bonn is a local and virtual international research center and a place of communication between science, politics and business. IZA is an independent nonprofit organization supported by Deutsche Post Foundation. The center is associated with the University of Bonn and offers a stimulating research environment through its international network, workshops and conferences, data service, project support, research visits and doctoral program. IZA engages in (i) original and internationally competitive research in all fields of labor economics, (ii) development of policy concepts, and (iii) dissemination of research results and concepts to the interested public. IZA Discussion Papers often represent preliminary work and are circulated to encourage discussion. Citation of such a paper should account for its provisional character. A revised version may be available directly from the author.
IZA Discussion Paper No. 10388 November 2016
ABSTRACT
The Impact of the 1896 Factory and Shops Act on Victorian Labour Markets*
This paper examines the effects of the Victorian Factory and Shops Act, the first minimum wage law in Australia. The Act differed from modern minimum wage laws in that it established Special Boards, which set trade-specific minimum wage schedules. We use trade-level data on average wages, employment, and other outcomes to examine the effects of changes in minimum wages. Although the minimum wages were binding, we find that the effects on employment and other outcomes were modest. We speculate that this was partly because the Special Boards, which were comprised mostly of employers and union officials, followed labour market conditions when setting wages for their trades. JEL Classification: J38, N37 Keywords: minimum wages, Australia, Factory and Shops Act Corresponding author: Andrew Seltzer Department of Economics Royal Holloway, University of London Egham, Surrey TW20 0EX United Kingdom E-mail: [email protected]
* We wish to thank Steph Brophy for research assistance, André Sammartino for drawing our attention to the data used in this paper, and Ian McLean for sharing his Melbourne price series. Andrew Seltzer wishes to acknowledge funding from the Economic History Society’s Carnevali Small Research Grants Scheme. We have also benefitted from comments by participants at seminars at the London School of Economics; Royal Holloway, University of London; University of Adelaide; and University of Melbourne and at the Australia/New Zealand Economic History Society Conference in Canberra; the Department of Work and Pensions Conference in Sheffield; the Economic History Society Conference in Telford; and the World Economic History Congress in Kyoto.

1
Australia has had amongst the longest histories of legislated minimum wages in the world.
The first Australian minimum wage law, the 1896 Factory and Shops Act (henceforth FSA)
in the colony (later state) of Victoria, was the second minimum wage law ever passed,
following only an 1894 New Zealand law which covered far fewer workers. The FSA created
trade-specific Special Boards, which were empowered to set gender, age, and occupation-
specific minimum wages. Initially the FSA created Special Boards for six trades that were
believed to be particularly prone to sweating (boots, bread, clothing, furniture, shirts, and
underclothing). Later amendments to the FSA expanded the scope of the law, allowing the
formation of Special Boards for essentially any trade. By 1913 there existed 126 Special
Boards, which covered approximately 110,000 workers (Report of the Chief Inspector 1914).
The Victorian experience with minimum wages was observed with great interest by
contemporary Australian, British, and American economists; social reformers; and
government administrators, many of whom sailed out to Australia to observe the working of
the law first-hand. Many of these observers regarded the FSA as having successfully
increased the wages of the low paid, while causing little economic hardship for employers.
Social reformer and future United States Supreme Court Justice Louis Brandeis stated that
the law “had created much better conditions in industry than had existed prior to its passage”
(Brandeis 1915, p. 494). The influential British economist and social reformer Sidney Webb
wrote, “In the sweated trades to which the law was first applied, wages have gone up, the
hours of labor have invariably been reduced, and the actual number of persons employed, far
from falling, has in all cases, relatively to the total population, greatly increased” (Webb
1912, pp. 973-4). Perhaps the most comprehensive contemporary study was by the American
economist and Vice Chairman of the Ohio Industrial Commission Matthew Hammond, who
spent six months in Victoria in 1911-12 observing the Special Boards and interviewing
employers and workers. Hammond concluded that the main effects of the FSA were higher
wages in covered trades, a virtual elimination of sweating, and a general improvement in
industrial relations (Hammond 1915a and 1915b). Hammond also examined several potential
negative effects of minimum wages, such as substitution between different types of workers,
unemployment of older and slower workers, and relocation of firms to other Australian states,
and concluded that there was little evidence for these effects.
However, support for the FSA was not universal. Opponents of the FSA argued that the
minimum wage decrees did little more than institutionalize the prevailing wage structure and

2
had unintended negative consequences such as advantaging employers who were willing to
break the law, “speeding up” the pace of work, and creating unemployment in affected trades.
The British scholar Mary Rankin, who spent several months in Victoria observing the FSA,
concluded of the boot trade that after the minimum wages were first set, “They secured
employment only to the more competent, and tended to raise their wage value by excluding
the less competent from consideration” (Rankin 1916, p. 60). Perhaps the most important
dissenting voice was William Irvine, the Victorian Premier between 1902 and 1904, who
argued that the FSA was “practically strangling industries which were in a very flourishing
condition before the Act was passed” (Hammond, 1915b, p. 133).
Despite the attention received by the FSA, the existing evidence on its effects on wages and
employment is surprisingly impressionistic. Numerous contemporary observers claimed that
average wages increased substantially in covered trades as a result of the establishment of
minimum wages. The substance of these claims, however, was typically that wages had
increased between the 1890s and a later period, often well after the initial implementation of
the minimum rates (Webb 1912 and Hammond 1915a). Australia was particularly hard hit by
the depression of the 1890s, and thus it would be surprising if there was no subsequent wage
growth, even in the absence of minimum wages. It is possible that observed wage increases
were due to inflation, changing technology, cyclical factors resulting in increased labour
demand, shortages of suitable labour, or other exogenous factors. Contemporary scholars
noted the difficulty in distinguishing between the effects of the minimum wage and the
effects of the overall business cycle, and, to the best of our knowledge, no subsequent studies
have addressed this issue (Rankin 1916).
This paper examines the wage, employment, and other effects of the minimum wages
established under the FSA. Our basic methodological approach is drawn from an extensive
literature on minimum wages. The standard model of the minimum wage assumes perfect
competition in the labour market (Ehrenberg and Smith 2012). In this context, a minimum
wage is simply a price floor. If the minimum rate is set below the market rate, it will have no
effect on the labour market; if it is set above the market rate, it will increase wages but also
reduce employment or have other unintended consequences. The extent of employment
reduction is an empirical matter, which has been the subject of a substantial literature. We are
guided by this literature in our analysis of the effects of the FSA. Most minimum wage

3
studies examine the US and UK labour markets, and we focus on the main conclusions of this
literature below.
The US studies can be usefully divided into three waves. In the 1970s and 1980s, most
research on minimum wages estimated time-series regressions of the effect of changes in the
national minimum wage on aggregate employment (Brown et. al 1982). These studies
generally found that minimum wages reduced employment of low-wage workers; however,
subsequent research has called into question both the underlying methodology and
conclusions of this work. A new approach came in the early 1990s with the rise of state laws
which caused state-level variation in minimum wages. One group of studies used a panel
regression approach to examine the effect of changes to state-level minimum wages on state-
level employment (Neumark and Wascher, 1992). Another group of studies used a case study
approach, applying quasi-experimental methods on establishment-level employment data
(Card and Krueger 1994). These studies compare changes in employment following an
increase in the minimum wage between a treatment group of establishments, that needed to
increase some workers’ wages to match an increase in the minimum wage, and a control
group, that did not need to increase wages. Both the panel and case study approaches have
focused on low-wage workers most likely to be affected by the minimum wage, such as
teenagers or workers in the fast food sector. A third recent wave of studies has sought to
refine the earlier state-level analyses by resolving econometric issues relating to
identification. This has primarily involved paying greater attention to controlling for selection
effects; in particular, the role of geographic variation in labour market conditions (Dube et al.
2010, Allegretto et al. 2011, Neumark et al. 2014a, Neumark et al. 2014b). A first objective
has been to establish a methodology for defining treatment and control regions such that
underlying labour market conditions prior to a minimum wage increase are as similar as
possible; or, alternatively, to correct for differences in underlying conditions between
geographically adjacent labour markets. A second objective has been to address the potential
endogeneity of changes in the minimum wage to state-level variation in economic conditions
by using methods such as IV (Baskaya and Rubinstein, 2012). The overall evidence from
these studies is mixed. Studies that have used new approaches to define treatment and
control groups find no employment effects or modest effects on the order of one to three
percent employment declines following a ten percent increase in the minimum wage; whereas
some studies that seek to focus on exogenous variation in the minimum wage have found
larger employment effects.

4
A small set of UK studies examine the effects of Wage Councils, which set minimum rates
from 1909 to their abolition in 1993 (Dickens et al. 1999). The UK Wage Councils
functioned in much the same way as the Victorian Special Boards, setting industry-specific
rates in low paid sectors. The evidence suggests that between 1978 and 1993 minimum wages
set by the Wages Councils significantly reduced the within-industry dispersion of earnings,
but did not create unemployment (Dickens et al. 1999). Later UK research has focused on the
national minimum wage which was introduced in 1999 (Stewart 2004 and Dickens et al.
2015). These studies have used differences in the impact of increases to the minimum wage
between workers – according to their position in the earnings distribution or their geographic
region – to identify the employment effects of the minimum wage. As with much of the rest
of the literature, the evidence from these studies is mixed.
Another issue addressed in the literature has been that adjustment to a binding minimum
wage may occur on margins other than employment. As with the literature on employment
effects, there is not a strong consensus on other possible outcomes of minimum wage
increases. The most widely studied non-wage outcome is hours of work. Some of these
studies have found that hours of work tend to experience small declines following minimum
wage increases (Brown 1999, Couch and Wittenburg 2001, and Stewart and Swaffield 2008).
However, other studies have found no measurable effects (Connolly and Gregory 2002 and
Zavodny 2000). Likewise, the evidence on other outcomes is mixed. Card and Krueger
(1997) find that state-level minimum wage increases in the 1990s had no effect on fast food
prices or on the likelihood that workers receive free meals; whereas Seltzer (1997) finds
considerable anecdotal evidence to suggest that the initial imposition of the American federal
minimum wage in 1938 led to increases in night shift work in southern textile industries.
For our purposes, there are three main lessons to be drawn from the extensive existing
literature. A first major lesson is the importance of extensive variation in the minimum wage
in order to be able to identify its effect on employment. This was the main justification for the
shift in the US from time-series analysis to studies using state-level variation in minimum
wages (Kennan 1995). A second major lesson is the importance of controlling for labour
market conditions at the level of the market at which the minimum wage applies. If this is not
done then the estimated coefficient on the minimum wage variable may be biased due to
correlation between the change in the minimum wage and underlying conditions in labour

5
market to which that change is applied. For example, a major concern for the US literature
that uses cross-state variation in minimum wages is that changes to those minimum wages
may be correlated with regional trends in employment (Dube et al. 2010 and Allegretto et al.
2011). A third lesson is that it is important to consider whether changes to the minimum wage
can be considered exogenous to market conditions. If the process of setting the minimum
wage is done on the basis of current economic conditions – at least to some degree – then
there may be reverse causation between employment and the minimum wage and standard
estimates of the effect of minimum wages will be biased.
The nature of the minimum wages set under the FSA and the available data enable us to at
least partially address the empirical issues that have been raised in the literature. The
decentralised nature of minimum wage setting under the FSA meant that considerable
variation in minimum wages existed across trades and over time during the period of our
study. Our data are drawn from the annual Report of the Chief Inspector of Factories, Work-
rooms, and Shops. The Reports contain trade-level data on employment and average wages
grouped by age and gender of workers and a list of minimum rates applying to every
occupation within each covered trade. Our main analytical approach is to estimate panel
regressions on trade-level changes in average wages, employment, and other outcomes as a
function of changes in the relevant minimum wage. We control for market conditions by
including year dummies and trade fixed effects in all models. In addition, in some regression
specifications we include lagged changes in employment in order to capture time-varying
trade-specific conditions. We address the possibility of endogeneity in minimum wage
determination using an instrumental variables approach. Our instrument is based on a discrete
change in the minimum wage setting process following the Federal-level Harvester
Judgement in 1907, which established the principle of a living wage. It will be shown that,
while the Harvester Judgment did not apply directly to workers in our sample, it had spillover
effects to wage setting by the Victorian Special Boards, especially for the lowest-wage
workers. Finally, we examine a variety of other outcomes such as substitution between
different types of workers, hours of work, the maximum ratio of apprentices and improvers to
adult workers, and Sunday and overtime pay.
We find that minimum wages under the FSA were binding, at least for some workers. The
ratio of the minimum wage to the average wage was much higher than occurs in modern
labour markets. There was a strong trade-level relationship between increases in minimum

6
rates and increases in average wages. This relationship is much stronger for trades that
previously paid average wages close to the lowest minimum rate. We also find that the
minimum rates had relatively little effect on employment. Ordinary least squares regressions
suggest a small negative employment effect, similar to estimates in modern studies. However,
this result is not robust across specifications and we do not find a statistically significant
causal effect using an IV approach. Similarly, we find very limited evidence that increases
minimum wages had significant effects on other margins. We speculate that the absence of a
large employment effect was partially due to the fact that the membership of the Special
Boards was comprised of insiders who closely followed market conditions for their trade
when setting minimum wages. However, even when attention is restricted to wage changes
that can plausibly be regarded as exogenous to market conditions, the absence of an effect on
employment persists.
The outline for the remainder of this paper is as follows. The second section describes our
data. The third section provides a brief historical overview of the Victorian Factory and
Shops Act, specifically focussing on the manner in which minimum wages were set and
enforced. The fourth section estimates the effects of minimum wages on wages, employment,
and other labour market outcomes. The fifth section discusses the econometric findings and
concludes.
II. Data
The primary source of data for this study is the annual volume Report of the Chief Inspector
of Factories, Work-Rooms, and Shops. The Reports are an exceptionally rich source of data,
providing detailed information about minimum wage rates, average wages, and employment
in covered trades. To the best of our knowledge, this is the most comprehensive data set
covering early minimum wage laws that has yet been collected. The Reports contain a list of
all provisions of the FSA, updates on the state of the Victorian economy, a summary of
conditions and enforcement for each trade covered by a Special Board, and a summary of
prosecutions. The Reports also contain several appendices, which provide most of the data
used in this paper. We obtained data from the following appendices. Employment and
average wages in covered trades are from “Special Board Trades” (henceforth SBT);
employment and wages in uncovered trades, from “Chief Inspector of Factories’ Report”
(henceforth CIFR); minimum wage rates and other terms set by the Special Boards from

7
“Wages Fixed by Special Boards” (henceforth WFSB); and prosecutions for violations of the
Act from “Analysis of Prosecutions”. We have gathered data on employment, average wages,
and minimum wages in covered trades beginning in 1900, the first year in which these data
are reported in a consistent manner, through 1913. We chose to stop at 1913 because of the
disruption to labour markets caused by the First World War and the large-scale switch from
state to Federal minimum wage legislation in the 1920s (Hatton and Withers 2014).
The main data used in this paper are drawn from the Special Board Trades and Wages Fixed
by Special Boards Appendices. The SBT Appendix reports age-specific average nominal
wages and employment by gender in each trade covered by a Special Board. In addition, it
provides separate employment figures for adults who were subject to the minimum wage,
piece rate workers, “general workers”, and youths working as apprentices or improvers.
Figures for apprentices and improvers are recorded for each age between 13 and adulthood
(typically 21, but up to 24 in a few trades). The cell sizes for the different age groups are
often very small and thus in the analysis we have pooled workers into four sub-groups: piece
rate workers, adults subject to the minimum wage rate, youths aged 13-18, and youths aged
19-adult. The SBT Appendix does not specify a survey date, and it is likely that different
employers returned their surveys at different points in time. Because we cannot be certain of
the timing of the collection of these data relative to the timing of changes to the minimum
wage, in the empirical analysis we include a lagged minimum wage variable as well as a
contemporaneous variable. The WFSB Appendix lists all time-based minimum wages for
trades covered by Special Boards, but not piece rates. The number of separate minimum
wages set by the Special Boards was frequently very large; with up to 200 separate minimum
rates within a single trade. Most trades had separate occupation-specific (and sometimes
location-specific) minimum rates for adult men and women, apprentices, and improvers.
There are two important inconsistencies between the SBT and WFSB Appendices in the way
data is recorded. Employment and average wages are aggregated to the trade level in the SBT
Appendix, whereas minimum wage rates are recorded at the occupation level in the WFSB
Appendix. A second inconsistency is that minimum wage rates for apprentices and learners
were typically based on years of experience, whereas employment and earnings were always
reported by age. We have handled these inconsistencies in the data in the following manner.
Our approach to recording minimum wages has been to aggregate rates up to the trade level,
with separate rates based on gender and age. This was necessitated by the fact that the

8
Reports do not contain information on average wages or employment at the occupation level,
and thus we need to select a single minimum wage for all workers in each trade in each year.
This will introduce noise into our regressions, as any minimum rate that we select will not
have been applicable to all workers in the trade. However, we believe that this effect is likely
to be small as there tended to be a fairly close correlation over time between the different
occupation-specific minimum rates within trades.1 We construct gender-specific and age-
specific minimum wages based on the overall distribution of minimum rates. Specifically, we
use the lowest, median, and highest adult minimum wage rates for both men and women and
the age 16 and age 19 (or second and fifth year of experience) minimum wage rates for
apprentices and improvers for each trade covered by a Special Board. In our analysis, we use
the lowest adult minimum rate for our main specification, and other minimum wage rates in
additional regressions as a robustness check. As an additional robustness check, we have
constructed the minimum wage variables using only occupations that were specifically listed
in the WFSB Appendix in every year of our sample period that the trade was covered by a
Special Board.2
The Awards also specified several non-wage terms of employment. We have collected data
on several terms that were recorded fairly consistently over the period of this study, namely,
the maximum number of hours in the standard workweek, the maximum number of
apprentices and improvers per adult male and adult female worker, and the rates of pay for
Sundays and overtime. It is likely that other terms may have been more important in specific
trades, but, in the absence of systematic data, they are not suitable for quantitative analysis. In
our analysis, we have recorded the data on other outcomes as it is reported in the WFSB
Appendix. We have standardised the units of measurement and have made several decisions
about how to enter data where multiple values are reported in these series, but have not
1 We have estimated the correlation coefficients between the lowest, median, and highest real minimum wages for adult males over time and across Special Boards. These coefficients are 0.75 for the lowest and median minimum rates, 0.39 for the lowest and highest minimum rates, and 0.75 for the median and highest minimum rates. 2 The logic behind this approach is that smaller occupations were sometimes initially ignored by Special Boards, but were later given separate rates. The addition of new minimum rates for these occupations often implied changes to our calculated lowest and median minimum rates, without actually changing the minimum rates that actually applied to most workers. For example, Fosters Brewery complained in 1902 that an earlier decree meant that they had to overpay three workers employed to clean bottles (Victoria, Papers of Special Boards, VPRS 5466, Brewer’s Board, unit 16). Subsequent decrees had a minimum rate for bottle cleaners, and this was the lowest minimum for the trade. More generally, in over half of the cases with a decline in the lowest nominal minimum wage, it was because of the addition of a new occupation, rather than a decline in an existing occupation-specific minimum rate.

9
extrapolated for missing data.3 The Awards often specified different standard working hours
across occupations within a single trade. However, unlike the minimum wage rates, which
typically took a wide range of values across occupations, most trades had a single standard
workweek and very few had more than two or three different values for maximum hours. In
cases where more than one value of standard hours is specified we use the value from a single
occupation over the entire sample period. We chose an occupation that had the most
commonly specified standard hours in the first year the trade was covered under an award.4
Some awards specified multiple overtime rates, typically with the rate increasing as the
number of hours over the standard workweek increased. In all cases, we record the overtime
rate as the rate for the first hour past the standard workweek. Finally, both the overtime and
Sunday rates were normally listed as a percentage of salaries, but occasionally as fixed
amounts per hour. In these cases were have converted the fixed rates into percentages using
the lowest minimum wage divided by the standard number of hours as the base salary.
We use two additional sources of data. We use information from the historical files of the
Special Boards, held at the Victorian Public Record Office in North Melbourne (Victoria,
VPRS 5466 various years). These records, which are uneven in coverage and quality, provide
descriptive evidence on market conditions prior and subsequent to the establishment of
Special Boards and insights to the process of minimum wage setting. Finally, we use McLean
and Woodland, series X-5, Melbourne prices, to deflate the nominal wage data from the
original sources into real wages (McLean and Woodland 1992).
III. The Victorian Minimum Wage Law
Victoria was among the first places to pass protective labour legislation, dating back to the
1873 Factory Act. Although the Factory Act was passed later than the first laws in European
industrial powerhouses such as the UK (1833) and Germany (1853), it pre-dates legislation in
other European and new world nations (Huberman and Meisner 2010). Even the other
3 We have also constructed alternative apprentice ratios, improver ratios, Sunday rates, and overtime rates extrapolating for missing data. We substitute the improver ratio for the apprentice ratio wherever an apprentice pay scale exists but the apprentice ratio is missing and visa versa. We also substitute Sunday rates for missing overtime rates and visa versa and male apprentice and improver ratios for missing female ratios if there is female employment in the trade. The number of missing observations is relatively small, except for the apprentice ratios, which were not listed in the WFSB Appendix between 1903 and 1909. 4 In the absence of data on employment by occupation, the choice of occupation used to construct the hours variable was somewhat arbitrary. Fortunately, this is unlikely to have much of an effect on the analysis because changes to the number of hours specified in the Awards were usually made for all occupations at the same time.

10
Australian colonies only began legislating in the 1890s. The 1873 Act was limited in scope,
covering only factories with at least ten workers. It restricted employment of women to no
more than eight hours per day under most circumstances; prohibited employment of young
children; allowed inspectors to enter the workplace; and created a board which could regulate
factories’ warmth, cleanliness, and sanitation based on the recommendations of the inspectors
(Hagan 1964). An amended Factories and Shops Act, passed in 1885, increased coverage to
include shops, reduced the minimum establishment size to six workers, and increased the
number of inspection staff. More importantly, the 1885 Act required the Chief Inspector to
produce an annual report of workplace conditions, employment, wages, and enforcement. It is
from these reports that most of the data used in this paper are drawn.
The FSA was amended again in 1890 and 1894, but for the purposes of this paper, the most
important amendment came in 1896. The 1896 amendment established the principle of
minimum wages set by Special Boards. Initially Special Boards were established for only six
trades: boots, bakeries, bread-making, clothing, underclothing, and furniture. These trades
were chosen because they were thought to be prone to “sweating” and because they employed
large numbers of women (boots, clothing, underclothing), employed large numbers of
Chinese workers (furniture), or because they were important to the public health (bakeries
and bread). The Boards began to set minimum wages in 1897. A series of amendments to the
FSA in 1900, 1902, 1905, and 1908 established the permanence of Special Boards and
expanded their scope. From 1900, minimum wages could be set for any factory-based trade.
From 1908, coverage was extended to virtually all trades, not just those based in factories. As
a result of these amendments, the number of Special Boards and hence workers covered by
minimum wages, grew rapidly after 1900. Figure 1 shows the number of trades and workers
covered between 1898 and 1913. The total number of covered workers increased
approximately tenfold during this period from 11,332 to 113,807. As can be seen in Figure 1,
this increase was due to both an increase in coverage and the growth of Victorian industry.
Minimum wages under the FSA were set in the following manner. The process began when
either employers or employees petitioned for coverage under a Special Board. If a petition
was successful, a Board would be appointed. The Boards were comprised of between two and
five elected representatives of the workers, an equal number of elected representatives of the

11
employers, and a neutral chairman agreed by the other Board members (Hammond 1915a).5
Following its appointment, the Board heard evidence from interested parties concerning
factors such as the cost of living, the level of demand in the trade, the cost of doing business,
and the availability of imported substitutes. After hearing this evidence, the Board would set
a minimum wage schedule. Prior to 1907, the FSA dictated that the Special Boards “were to
base their Determinations on the rates paid by reputable employers to employees of average
capacity” (Rankin 1916, p. 16). Later amendments to the Act simply stated that the Special
Boards needed to consider several market-related factors in setting minimum rates, such as
the nature of work, the age and sex of workers, place and time of work, whether employment
was casual or long-term, etc (Rankin 1916). Although in principle a minimum wage schedule
could be passed by a bare majority of votes, contemporary observers generally noted that the
Special Boards usually worked by consensus and were characterized by cooperation and
compromise. For example Hammond wrote, “More than once in a wage board meeting I have
heard employers admit … that an increase in the rates of pay was necessary. On the other
hand, I have seen workers regretfully agree to accept lower rates of pay than those for which
they were contending, because they were convinced that the trade would not at the time stand
the full increase demanded” (Hammond 1915a, pp. 499-500). The schedule of rates agreed
upon by the Boards were often extremely detailed with separate minimum rates for men and
women, for specific occupations, for workers under age 21, for different locations, and for
learners and apprentices. In addition to setting minimum wages, the Special Boards were also
empowered to set minimum piece rates; maximum weekly hours; Sunday and overtime rates
of pay; limits on the number of children, apprentices, and improvers who could be employed;
and a schedule for the progression of apprentices to minimum wage workers (Report of the
Chief Inspector, Rankin 1916).
The testimony before the Special Boards provides insights as to the motives of both workers
and employers. Testimony from the hearings of the Boot, Pastry Cook, and Jam Boards
suggests that adult male workers typically argued for the establishment of Boards not only to
achieve a higher average level of wages, but also to increase the wage relativities of women
and children to reduce competition (Victoria, VPRS 5466, Boot Board (unit 11), Jam Board
(units 111-12), and Pastry Cook Board (unit 135)). Employers who argued for the
5 Between 1902 and 1905 the chair was chosen by the employers, giving them effective veto power over any new decrees.

12
establishment of Boards generally did so on the basis that it would prevent other employers in
their trade from being able to charge lower prices by paying their workers sweating rates
(Victoria, VPRS 5466, Flour Board (unit 71), Ironmoulders Board (units 109-10), and
Printing Board (units 147-48)). There were, of course, many employers who opposed the
establishment of Boards based on the belief that their effect would be to raise their labour
costs (Victoria, VPRS 5466, Aerated Water Board (unit 1) and Boot Board (unit 11)).
As with earlier legislation in Europe, the initial purpose of the FSA was the protection of
women and children, who were considered to be particularly vulnerable to exploitation. The
original 1873 Act did not govern employment terms for adult men. The earliest Special
Boards covered trades that disproportionately employed women and children. Subsequent
boards covered increasingly male-intensive trades. Females (children under age 16)
comprised 51.18 percent (33 percent) of total 1913 employment in the original six trades. The
corresponding figures were 28.09 percent (3.49 percent) and 14.80 percent (2.62 percent),
respectively for trades first covered between 1901 and 1908 and between 1909 and 1913.
In addition to the change in the composition of covered trades, there was a within-trade
decline in employment of women and children over the period of this study. Overall, the
percentage of females among workers covered by Special Boards dropped from 57.79 in
1900 to 31.67 in 1913 and the percentage of children under age 16 dropped from 6.27 to 3.22.
Scholars have long argued that one of the biggest obstacles to effective minimum wage
legislation is the absence of effective enforcement (Ashenfelter and Smith 1979, Gramlich et
al. 1976, Seltzer 1997). Evasion of labour law is notoriously difficult to measure and we are
not able to directly estimate the extent of compliance with the FSA. However, there is
considerable evidence to suggest widespread voluntary compliance, backed by active judicial
enforcement. When Victoria first passed minimum wage provisions in 1896, it already had
over two decades of experience with factory legislation. Many of the previous amendments to
the FSA were specifically designed to increase compliance. The 1885 Act established a
centralized inspectorate and eliminated enforcement by local councils, which most
contemporaries believed to be relatively ineffective (Coghlan 1918, Hammond 1915a, Reeves
1923). The 1885, 1890, and 1894 amendments increased employers’ reporting requirements,
required the publication of the names of business owners convicted of non-compliance,
increased the size of the inspectorate, and granted inspectors greater access to employers. The

13
establishment of Special Boards probably further increased compliance through the indirect
mechanism of strengthening trade unions.6
The direct evidence from the Report of the Chief Inspector generally suggests high levels of
compliance with the minimum wage decrees. From around 1898 onwards, the factory
inspectors usually reported high levels of compliance in most trades, with the exception of
those dominated by Chinese workers (Report of the Chief Inspector various years and Rankin
1916). The Reports also suggest a willingness of the courts to enforce the law. For example,
in 1898 the Chief Inspector stated, “the penalties inflicted by the magistrates have been
somewhat in proportion to the offenses and the difficulties of obtaining evidence” (Report of
the Chief Inspector 1898, p. 20). The Reports provide annual data on the number of
prosecutions, number of convictions, fines, and court costs imposed for violations of the
FSA. These data show that over the period of this study there was an increase in the number
of violations successfully prosecuted and penalties imposed, roughly paralleling the increase
in coverage shown in Figure 1.7 Other contemporary evidence also generally suggests that the
FSA was effectively enforced. Rankin argues that during the depressed conditions of the
1890s, evasion was fairly common, but by the early-1900s compliance was the norm (Rankin
1916). Hammond argues that many of the early violations of the law resulted from confusion
about which rates were meant to cover specific workers, but as the determinations were
clarified over time, “most of the difficulties [were] overcome, and … employers [were]
showing an increased willingness to observe the law” (Hammond 1915b, p. 619).
There were two other Australian legislative developments concerning minimum wages during
the period of this study that deserve a brief mention. First, beginning in 1900, other states
followed Victoria and passed their own minimum wage laws. These laws were established in
South Australia (1900), New South Wales (1901), Western Australia (1902), Queensland
(1908), and Tasmania (1910) (Neumark and Wascher, 2008). Secondly, the potential for
conflicts between state laws for employers operating in more than one state led to the passage
6 The employee representatives on the Special Boards were almost always union officials. This effectively guaranteed unions a place at the bargaining table, and, as a result, union membership increased dramatically after 1900. This, in turn, proved to be important for enforcement of the FSA because prosecutions typically began with a worker complaining to their local union official about violations of the Act, followed by a brief investigation and a union report to the factory inspectors (Hammond 1915a, Hammond 1915b). 7 The number of cases prosecuted increased from 14 in 1897 to 30 in 1900, 40 in 1905, 63 in 1910, and 166 in 1913. There was considerable year-to-year variation in conviction rates and average fines. Over the period 1897-1913, 71.3 percent of prosecutions resulted in a conviction and fines plus court costs averaged £117.04 per prosecution.

14
of a Federal law, the Conciliation and Arbitration Act (CCA) of 1904. Prior to the 1920s,
very few cases were tried under the CCA, which only applied when there existed the
possibility of industrial disputes extending beyond one state. Far more workers were covered
by the various state laws (Hatton and Withers 2014). However, the CCA is nonetheless very
important for our study because of one case, the 1907 Harvester Judgement (Commonwealth
Arbitration Reports, 2CAR1). The case established the principle that industries receiving
tariff protection were required to pay a living wage. Between 1907 and 1914 the living wage
was set to 42s per week for an unskilled adult male (henceforth the “Harvester standard”).
The Harvester standard was deemed to be “fair and reasonable” and, based on an examination
of Melbourne working class household budgets, sufficient to support a family (Isaac 2008).
Importantly for our purposes, the Harvester standard was exogenous to broader labour market
conditions. Although the Harvester standard only applied to firms covered by the CCA and
was not a legal requirement under the FSA, contemporary and subsequent scholars have
argued that from 1907 onwards Special Boards used it as a benchmark in setting wage rates
(Hammond 1913, Hammond 1915, McCarthy 1968). Because the Harvester standard was
explicitly divorced from prevailing market factors, we use it in a series of instrumental
variable regressions.
IV. Empirical Results
Our underlying empirical approach closely follows that of several recent minimum wage
studies. As with virtually all of the minimum wage literature, our main interest is to estimate
the impact of minimum wage increases on employment. We also examine the effect of
minimum wages on average wages, as a necessary condition for a minimum wage to have
any effect on employment is that it is binding, at least for some workers. Finally, we examine
the effects on a variety of other outcomes to determine whether adjustment to changes in
minimum rates occurred on margins other than employment. All of our estimates consider the
impact of changes in existing minimum wages, as the nature of the data does not allow us to
examine the impact of the initial establishment of Special Boards.8
8 In theory, the impact of the initial establishment of a minimum wage may have been larger than that of a later increase in an existing minimum rate because never-covered firms are likely to be more heterogeneous in terms of labour cost. Unfortunately, we do not believe that the data in the Report of the Chief Inspector is sufficiently consistent across appendixes for us to test this possibility. The CIFR Appendix contains average wages and employment in uncovered trades, which, in principle, could be linked to data from the SBT Appendices to obtain a panel of wages and employment prior and subsequent to coverage under a Special Board. However, a majority of trades covered by Special Boards were not previously listed in the CIFR Appendix. Even where the

15
1. Wage Effects
There is considerable descriptive evidence from the reports of contemporaries suggesting that
the minimum rates were binding for at least some workers. Rankin (1916) devotes a full
chapter to examining the wage effects of the FSA. Although she argues that the wage effects
varied substantially across trades and that much of the wage increase over the period was due
to broader market factors, she nonetheless concludes that the FSA had substantial effects on
several trades. For example, she noted, “the raising of that Minimum at any time have
invariably been followed by a rise in the average rate of wages paid to each employee in the
trade. … It would seem to be evident, then, that the … Minimum [Wages] do affect wages”
(Rankin 1916, pp. 75, 80). She also provides specific examples of trades where the minimum
rates were clearly binding. She noted of the minimum established for the boot trade, “it seems
evident that [it] … caused in 1898 a rise in the standard of wages. That this rise was artificial,
and considerably … restricted the Trade … is openly recognized” (Rankin 1916, p. 86).
Similarly, Hammond quotes a 1902 Royal Commission study of the clothing trade which
noted, “There are clothing factories where no woman or girl receives more than 20s a week
[the minimum wage]. Evidence furnished to the Commission showed that in this industry
many if not most of the employees had been receiving less than 20s a week prior to the
determination” (Hammond 1915b, p. 580).
A widely used measure of the wage effect is the “bite” – the ratio of the minimum wage to
the average wage. Figure 2 shows the average bite across all Special Boards over the sample
period. Across all trade/year pairs, the ratio averaged 0.80 for men and 0.87 for women, and
was increasing over time. These ratios are considerably higher than those of contemporary
minimum wages. According to OECD figures, in 2013 the bite ranged from 0.27 for the
United States to 0.69 for Turkey, with most countries at less than 0.50 (OECD 2015). The
bite varied considerably across trades; in some trade/year pairs the average wage barely
exceeded the lowest minimum rate, in about a third of trade/year pairs the average wage
exceeded the highest minimum rate.9 Although the high average bite is suggestive of a
same trades are listed in both Appendices, it is unclear whether the trades are defined the same way and thus whether all workers listed in the CIFR Appendix were later covered by Special Boards. 9 In a few cases the lowest minimum wage exceeded the average wage. In almost all of these cases, there was a substantial increase in the minimum wage schedule from the previous year. It is likely that in these cases the

16
binding minimum wage, there are two important caveats to this conclusion. First, the
denominator of our measure of the bite is the trade-specific average, rather than the national
average used in the OECD measures. Other cases of industry-specific minimum wages have
also resulted in high values of the bite. For example, the minimum wages set by UK wage
councils between 1976 and 1992 had an average bite between 0.65 and 0.70 (Dickens et al.
1999). Secondly, one of the defining characteristics of the Australian labour market in the
late-nineteenth and early-twentieth centuries was the relatively high earnings of unskilled
labour and low skill premium (Allen 1994, McCarthy 1968, Seltzer 2014). A compressed
earnings distribution implies that a minimum wage rate could have been set close to average
earnings and nevertheless had relatively little effect on wages.
To more formally examine the relationship between the minimum wage decrees and wages,
we run a series of regressions examining the percentage change in average real wages in
covered trades. The independent variables of primary interest are the percentage changes in
the real minimum wage and in the lagged real minimum wage. The lagged value is included
as an independent variable in these regressions because we do not observe the timing of the
surveys in the SBT Appendix and thus we are unable to determine whether the minimum
wage in effect at the time of the average wage observation was from the current or previous
year. In addition, the inclusion of the lagged change in the minimum wage captures the
possibility that the full effects of the minimum wage may occur with a delay (for example,
due to firms adopting new labour-saving machinery over time). Our wage regressions follow
the general form:
1) ∆ , , ∝ ∆ , , ∆ , , ∑ ∑ , ,
∆ , , is the annual percentage change in the real wage of workers of type j (j=adult male, adult female, etc.) in trade i at time t
∆ , , and ∆ , , are the annual percentage changes in the lowest real minimum wage covering workers of type j in trade i at time t (and time t-1)
is a vector of year dummy variables is a vector of trade fixed effects
wage and employment survey preceded the Special Board decree, and thus firms were complying with the existing decree at the time of the survey.

17
Our data set is an unbalanced panel of trade/year pairs constructed using the SBT and WFSB
Appendices. To control for the various demand-side factors that influenced wages and
employment, we include a set of year dummies and trade-level fixed effects. All regressions
are estimated with robust standard errors. We run separate regressions for six different groups
of workers: adult males, adult females, males age 19-21, males age 13-18, females age 19-21,
and females age 13-18.
This approach is, by necessity, somewhat different from standard approaches in the
literature.10 It is well established that the best way to measure the wage effects of a minimum
wage is to examine the entire distribution of wages prior and subsequent to the passage of the
minimum (Lester 1960, Card and Krueger 1997, Dickens et al. 1999). Unfortunately, the SBT
Appendix only provides average wages. Examining average wages is far from ideal as the
impact of even a strongly binding minimum wage on the average wage may be relatively
small and difficult to measure. A second problem with this approach stems from possible
omitted variable bias. The econometric approach described above implicitly assumes that
market factors influencing average wages are fully captured by the trade fixed effects and
year dummies included in the regressions. If this assumption does not hold, the estimated
relationship between minimum wages and average wages may be biased. For example, if
increases in trade-specific demand caused wage increases and simultaneously led the Special
Boards to increase minimum rates, we would expect to estimate a positive relationship
between minimum rates and average wages even if the minimum wages were not binding.
We address these issues by splitting the sample based on the bite of the minimum wage in the
previous year, in addition to running regressions on the full sample of trades. For each
observation we calculate the lagged bite. We then split the adult male (female) sample into
two subsamples comprising roughly the bottom and top third (bottom and top half) of the
distribution of the lagged bite.11 The split points are at a lagged bite of 0.75 and 0.85 for men
10 Most of the literature uses relative minimum wage measures such as the bite or the Kaitz index (the bite multiplied by the coverage rate). An implicit assumption of this approach is that the minimum wage does not affect average hourly earnings (the denominator of these indexes). This assumption is reasonable if the denominator is the average wage across all sectors of the economy. However, it is clearly not reasonable in the case of the FSA, where the denominator is the average wage for the individual trades and virtually all occupations in covered trades were subject to a minimum wage. The first difference specification has been used in a few previous studies examining industry-specific minimum wages (Machin and Manning 1994). 11 It was necessary to split the female sample into halves rather than thirds to ensure an adequate sample size in the split sample regressions. This is because over half of the trades did not employ any adult women. We did not

18
and 0.85 for women. We then ran separate regressions on the high-bite and low-bite
subsamples. If the estimated effects for the full sample were due to binding increases in the
minimum wage, then we would expect increases in the minimum rate to have much larger
effects on the high-bite subsample, where the minimum wage was already likely to have been
binding. However, if the estimated relationship for the full sample simply captures
unmeasured market influences, we would expect that increases in the minimum wage would
have similar effects for the two subsamples.
Table 1 shows the regression results. Consistent with the descriptive evidence, the results
suggest that the minimum wage was binding at least for some workers.12 The point estimate
varies across sample groups but is in the range of a 1.5 to 4.2 percent increase in average
wages over two years following a 10.0 percent increase in the minimum wage. For adult men,
the coefficients on the minimum wage variables in the full sample regressions are positive
and statistically significant. Moreover, the estimated coefficients are substantially higher for
the high-bite subsample than for the sample as a whole. The reverse holds for the low-bite
subsample. A similar pattern emerges for adult women. The only statistically significant
coefficient across all adult female regressions is for the high-bite subsample.
2. Employment Effects
The potential and actual employment effects of the minimum wages dominated contemporary
discussion of the FSA. Contemporary views on the employment effects were mixed. The
earlier Special Board hearings such as those in the boot and aerated water trades contained
the testimony of multiple employers who feared that minimum wages would lead to reduced
output and unemployment, whereas the later Special Board hearings typically contained far
less discussion of employment effects (Victoria, VPRS 5466, Boot Board (unit 11) and
Aerated Water Board (unit 1)). The general tone of the Reports of the Chief Inspector is that
the FSA had little effect on employment and that skilled workers were generally able to
obtain employment, although in some trades a few slower workers may have been displaced,
there was limited substitution of machinery for workers, and there may have been a decline in
estimate split sample regressions for youth workers because attaining a sufficiently large sample for youth workers would require us to pool youths of different ages, who were covered by different minimum rates. 12 In addition to the regressions shown in Table 2, we have also run regressions using the median and highest real minimums by trade and using minimum wage variables constructed using only occupations covered every year. The results in Table 2 prove to be very robust to specification.

19
exports due to higher costs. Most contemporary scholars concluded that the employment
effects were minimal or non-existent (Brandeis 1915, Hammond 1915b, Webb 1912). On the
other hand, Rankin (1916) concluded that the employment effects in some trades, such as
boots and furniture, were quite large. Virtually all of these sources note the difficulty in
separating the effects of the minimum wage from those of general economic conditions.
To more formally examine the relationship between increases in the minimum wage and
employment, we run a series of regressions on the percentage change in employment in
covered trades. The basic specification of these regressions is analogous to that used in the
wage regressions, substituting employment for hours as the dependent variable. In addition,
we also estimate the specification below to allow for substitution between different types of
workers in response to minimum wage increases:
2) ∆ , , ∝ ∆ , , ∆ , , ∆ , , ∆ , , ∑
∑ , ,
Where:∆ , , is employment of workers of type j in trade i and time t ∆ , , is the minimum wage of workers of type k in trade i and time t
We estimate this model for adult males, adding the contemporaneous and lagged minimum
wages for adult females.13 The basic theory of labour demand predicts that employment will
fall in response to increases in own wage (i.e. β1 and β2 are expected to be negative) but
increase in response to increases in the wages of substitute workers (i.e. β3 and β4 are
expected to be positive). In addition to the basic specifications, we also ran several additional
regressions to check the robustness of the results. These regressions 1) replace the lowest
minimum wage with the median or highest minimum wage, 2) use only occupations reported
every year when calculating the lowest minimum wage, 3) include a lagged dependent
13 There are a large number of trades that did not have any minimum rates specified for adult females. When estimating male employment, we adjusted for missing adult female minimum wages as follows. First, if a trade employed any adult women over the sample period, we assumed that they were governed by the same minimum wage schedule as men. This approach is validated by the data, as the average wages of women in these trades tended to cluster at exactly the lowest male minimum rate. If a trade never employed any adult women during the sample period, we assumed that the percentage change in the effective real minimum wage was zero, as the existing minimum rate already priced out female workers. We also ran the regressions assuming a zero percent change for all observations when no adult female schedule existed. The results are substantively the same as those reported.

20
variable as an additional independent variable in order to control for trade-specific demand
shocks, and 4) split the sample based on lagged bite, as above with the wage regressions.
The regression results are shown in Table 2. The point estimates of the coefficients on the
minimum wage variables are fairly consistent across the full sample specifications for adult
males, ranging between -0.1 and -0.3. The coefficients on the minimum wage variables are
significant at a five percent level in several specifications. The significance increases
somewhat and the point estimates remain roughly the same when we provide more precise
controls for market conditions using lagged change in employment as an independent
variable. The specification including the current and lagged changes in the adult female
minimum suggests that, consistent with the observations of Rankin (1916) and Hammond
(1915b) there was some substitution between different types of workers. However, the split
sample regressions do not suggest that employment losses were concentrated among the
workers who received the largest wage increases. Across all specifications for adult males,
the level of significance is greater than one would expect to occur at random; however, the
results are not particularly robust. The results for other groups of workers generally do not
suggest large employment effects. The estimated coefficients on the minimum wage variables
are not consistent across groups of workers and no results are significant at a five percent
level.
One problem with the results shown in Table 2 is that the controls for labour demand are, in
most specifications, limited to trade fixed effects and year dummies. Even if time and trade
broadly describe market conditions, it is possible that these specifications do not fully capture
the varied demand-side forces that affected minimum wage setting in the individual trades.
This is problematic, since if the Special Boards were influenced by unobservable market
factors when setting minimum wages and these factors also affected wages and employment,
our OLS coefficients would suffer from omitted variable bias.
To examine whether the estimated effects of minimum wages under the FSA were causal in
nature, we have run a series of instrumental variable regressions on adult male employment.
Our instrument is based on the 1907 Harvester Judgement, which established 42s per week as
a living wage. Prior to 1907, there was little or no pressure outside of market forces for
Special Boards to raise the wages of the lowest paid workers. Scholars have argued that the
Special Boards focussed much more on relatively high-wage workers (McCarthy 1968).

21
From 1907 onwards, the Harvester Judgement created additional pressure to raise the wages
of unskilled workers. To capture this effect, we use the difference between the lagged
minimum wage and the Harvester standard as an instrument for the percentage change in the
lowest (and median) male minimum wage rate, i.e.:14
0 19070 1907 42
42 1907 42
The appendix to this paper describes the instrument in detail. To summarise briefly: the
Harvester Judgement was an exogenous event which appears to have had a substantial impact
on the minimum wage decrees issued by the Special Boards.
The results of the IV regressions are shown in Table 3. The instrument for the minimum
wage is constructed using data from the year prior to the current observation of the dependent
variable, and hence there is no longer any question as to whether changes in the minimum
wage predate changes in average wages or employment. For this reason, we do not include a
lag value of the instrument in the regressions.15 As with the OLS regressions we also include
trade fixed effects and year dummies as controls for demand-side factors. The point estimates
in Table 3 are very similar to those in Table 2, although the coefficient on the instrumented
minimum wage variable is never significant.
3. Other effects
The papers of the Special Boards, the Chief Inspector’s Reports, and the work of
contemporary scholars contain much less discussion about outcomes other than wages or
employment. Nevertheless there is at least some evidence that in specific trades adjustment to
the minimum wage occurred on margins other than employment. The discussion of other
possible effects was most vigorous for the boot trade. A spokesman for the boot-making
employees argued that the effect of the initial imposition of the minimum wage was “the men
in [the] trade were being thrown out of work, and being replaced by improvers and boys.
14 We do not attempt to instrument for the highest minimum rate, as this was over 42s in virtually all trades after 1907. We also do not use the IV approach for groups other than adult males, as they were not covered by the Harvester Judgement. 15 There is a second, more practical, reason not to include the lagged instrument in the first stage of our IV regressions, namely the correlation between the instrument and lagged instrument is very high (0.97).

22
Those in work were racing around for dear life” (Anonymous, 1898a). The claims that adult
workers were replaced by low-wage apprentices and improvers and that there was “speeding
up” of the working pace were relatively common (Rankin 1916 and Anonymous 1898b).
Rankin (1916) also noted a variety of other effects in different trades including cuts in hours
in the boot trade; reduced meal time in the clothing trade; and replacing home work with
factory work in the clothing, shirt, and underclothing trades.
Our approach to estimating these effects of the Awards is very similar to the approach we use
for wages in Table 1 and employment in Table 2. As with the wages and employment
regressions, the regressions on other outcomes are estimated in first differences and we
control for other supply and demand factors using trade fixed effects and year dummies. The
dependent variables for the other outcome regressions are constructed from two broad types
of outcomes for which the Reports of the Chief Inspector provides systematic data across
trades and time. First, we use the SBT Appendix to construct employment shares of adult
males, adults, male piece rate workers, and female piece rate workers. As with the average
wage and employment data used in Tables 1 and 2, we are unable to determine whether
changes to Award terms came before or after the changes in the minimum wage rate. Thus
our regressions on these outcomes include both the contemporaneous and lagged changes in
the lowest minimum wage rate as independent variables. Secondly, the WFSB appendix
reports several Award terms other than minimum wages such as the maximum hours in the
standard workweek, the maximum ratio of apprentices and improvers to adults, and Sunday
and overtime pay rates. These outcomes were terms of the Awards and thus were
implemented at the same time as the minimum wages; and thus there is no uncertainty about
the timing of the dependent and independent variables as in the other regressions.
Consequently, we do not include the lagged minimum wage as an independent variable in
these regressions.
Table 4 shows the results of the other-outcome regressions. The first four rows use
employment ratios as the dependent variable and the last nine rows use Award determinations
other than wages as the dependent variable. In each regression, the minimum wage
variable(s) were chosen to correspond to the dependent variable; specifically, we use the
percentage change in the lowest adult male (female) minimum rate in regressions on male
(female) outcomes. The one exception to this is that we use the change in the (age 16
minimum rate/lowest adult minimum rate) for the adult employment ratio. The overall
23
evidence suggests that the minimum wages had little or no effect on outcomes other than
wages and employment. The evidence suggesting that employers substituted between
different types of labour in rows 1-4 of Table 4 is fairly weak. The minimum wage variables
are only significant in the regressions on piece rates. However, the sign on the minimum
wage variable is positive (as the model predicts) in the male regression and negative in the
female regression. There are no significant results in the regressions on other Award
conditions, perhaps because these conditions changed much less frequently than nominal
minimum wages.16 The considerable rigidity of non-wage terms suggests that it is unlikely
that the Special Boards used these terms to either offset or reinforce the effects of minimum
rate changes. Finally, we have run all of the regressions using several alternative
specifications, such as constructing the dependent variable with extrapolations for missing
observations, excluding the year dummies, and using the median minimum wage as the
independent variable. There is little difference between the results in the alternative
specifications and the results shown in Table 4.
V. Conclusions and Discussion
Taken together, the results in the previous section suggest that increases in the minimum
wages under the FSA did not cause major disruption to the Victorian labour market. The
evidence that the minimum wages had an effect on average wages is fairly strong. Across all
trade-year pairs for adult males, the lowest minimum wage was at least 80 percent of the
average wage in almost 60 percent of observations. Our regressions show that average wages
increased following increases in the minimum rates. Our split sample regressions show that
this increase was greater for trades which previously had a minimum wage that was close to
the average. However, the results also show that the minimum wages had, at most, a
relatively modest effect on employment. The point estimates of the employment effect for
adult males are on the order of a two percent decline in employment following a ten percent
increase in the minimum wage. This estimate is fairly robust to specification, although it is
not significant in all OLS or any IV specifications. The estimated employment effects for
other groups of workers differ across groups, are not robust to specification, and are generally
16 The lowest nominal minimum rate changed in about 22.5 percent of sample observations. By contrast, the analogous figures for non-wage conditions were generally under ten percent, with only the male apprentice ratio changing about as frequently (20.88 percent) as wage.

24
insignificant. The overall evidence that increases in the minimum wage had other effects on
labour markets is also very weak.
The absence of major labour market effects is consistent with some, all though by no means
all of the contemporary literature on minimum wages. Because of recent findings that
minimum wages may not have the employment effects predicted by the traditional model, a
recent strand of the literature has examined potential mechanisms to explain why increases in
minimum rates do not have large effects on employment. One explanation is monopsony
power created by search frictions. Economists have long understood that an increase in the
minimum wage potentially increases both wages and employment if employers have
monopsony power (Stigler 1946). More recent treatments of monopsony have emphasized
search frictions; for example, due to commuting costs (Bhaskar and To 1999, Bhaskar et al.
2002). However, the evidence from Victoria provides little support for the monopsony model.
Our employment estimates, although small and imprecise, consistently point in the direction
of negative employment effects. Another key prediction of the monopsony model is not
supported by the evidence in Table 2. The model predicts that search frictions will be
greatest where labour markets are thinnest. Unskilled workers generally can switch between
employers more easily than skilled workers, and thus the model predicts that positive
employment effects should be concentrated among the more skilled workers. Table 2 shows
similar employment effects across the range of the distribution of minimum rates, with, if
anything, slightly larger estimated effects when we use the median and highest minimum
rates (which applied to more skilled workers) as independent variables. Moreover, the
available indirect evidence suggests that the extent of search frictions was likely to have been
relatively small. Victorian employment, particularly in factory-based trades was very heavily
concentrated in Melbourne. The difference in transport costs across alternative employers
was probably fairly small for most workers.
Another potential explanation is that employment effects were non-existent to small because
the Special Boards, which were comprised of trade insiders, were able to set minimum wages
in line with market conditions. There exists a sizable Australian industrial relations literature
arguing that in later periods Australian minimum wage-setting bodies gave serious
consideration to market conditions (Hancock 1983, Mulvey 1986, Norris 1986, Withers
1986). This literature has focussed on the extent to which minimum wages set by third-party
state and Federal tribunals caused wage outcomes in Australia to depart from what would

25
otherwise have occurred. The main empirical approach in this debate involves comparing
wage levels and adjustment in Australia to other countries identified as having wage
outcomes that were more responsive to market forces. The consensus from this research is
that Australia differed from the US and UK in having less dispersion in earnings across
different skill levels. Moreover, it is possible to identify episodes, such as equal pay cases of
1969 and 1972, where a tribunal in Australia acted as a “wage leader”.17 This suggests that
Australian minimum wage legislation had an important effect on overall wages. At the same
time, there is also strong evidence that the tribunals assigned a major role to market forces in
deciding on wage outcomes. The bulk of the evidence from econometric studies concludes
that arbitrated wage outcomes in Australia incorporated market pressures; and there is little
evidence of differences in wage adjustment to market conditions between Australia and other
developed countries (Mulvey 1986, Withers 1986). Keith Hancock summarised this evidence as
showing that “the tribunals bend to economic and industrial pressures external to themselves”
(Hancock 1983).
Our results suggest that the market-based approach characterised Australian minimum wage
setting from the very beginning. The FSA specifically required the Special Boards to take
market factors into account when setting minimum wages. The papers of several of the
Special Boards indicate that market factors, particularly competition from interstate or
overseas and the possibility of creating unemployment, were considered during the hearings
to set minimum rates. For example, unskilled wages in the boot trade were initially set at 45s
per week. Employers quickly complained that this was too high and in 1897 the Special
Board met again and voted to reduce the lowest minimum rate to 36s. The Chairman, stated
on his decision to side with employers, “I was inclined to give my voice in favour of a
reduction as I was convinced from the evidence given that if the higher rate was adhered to, it
would have the effect of forcing a large number of men out of the factories; more machinery
would be introduced; and the intercolonial trade could be crippled if not altogether lost”
(Victoria, VPRS 5466, Boot Board (unit 11)). Hammond also notes that on several additional
occasions Special Boards reduced minimum wages following employer appeals that the rates
17 The equal pay cases established the principle that the minimum wages of women should be the same as those of men. Following the cases, the ratio of the female to male “award rates” increased from 0.71 in 1968 to 0.93 in 1978 (Hatton and Withers 2014, Norris 1986).

26
were too far above market levels and were reducing employment or causing hardship for
employers (Hammond 1915b).18
The importance of market factors during the period of our study can be examined by
comparing average wages in the covered and uncovered sectors. Figure 3 shows a
comparison of average real wages for adult men and women between the original six covered
trades and 23 uncovered trades that are reported in a consistent manner in the CIFR
Appendix.19 The series are constructed as fixed weight averages, using 1900 employment
shares throughout the entire period, in order to eliminate any potential effects of changes in
the between-trade composition of employment on average wages. For both men and women
there is a very strong correlation between average wages in the covered and uncovered
sectors over the period. This correlation holds for both the level and year-on-year changes of
wages, suggesting a common influence of market factors.
Although this suggests that market factors had a strong influence on minimum wage setting,
it does not provide a complete explanation for the absence of employment effects. The IV
regressions in table 3 estimate the local average treatment effect of minimum wage increases
unrelated to market factors. The regressions show no statistically significant effect on
employment. This, as with the evidence from many contemporary studies, suggests a lack of
employment effects that are not easily explained by standard models.
18 The trades concerned were artificial manure, boiler-making, bread, builders’ labourers, commercial clerks, fell-mongers, fuel and fodder, and ice. 19 The trades used to construct the average wage series for the uncovered sector are distilleries, marble and masons work, cement, tents, stone crushing, paper patterns, ink, hats, modelling, photography, chemicals, tobacco and cigarettes, cutlery, eucalyptus oil, lenses, furriers, blinds, florists and manufacturing bouquets, umbrellas, biscuits, flock, corsets, and hosiery.
27
Appendix
The Harvester Judgement and Wages Set by Victorian Special Boards
The Special Boards were explicitly instructed to consider market factors when setting
minimum wages. This raises the possibility of endogeneity in our employment regressions;
i.e. minimum wages were more likely to be raised when employment in a trade was
increasing due to market factors that we are unable to measure. To address this possibility we
use an instrumental variable identification strategy. Our instrument derives from the 1907
Sunshine Harvester Judgment (Australia 2CAR1). In his decision, Justice H. B. Higgins ruled
that employers had an obligation to meet “the normal needs of an average employee” defined
by the “fair and reasonable” wage of 42s per week. While this decision only directly applied
to firms which operated in more than one state and thus were covered by Federal arbitration,
there exists a literature in Australian industrial relations that argues that the Victorian Special
Boards used the Harvester standard as a benchmark when issuing their own determinations.
Hammond noted that “the standard set up in this case has steadily served as the precedent in
other cases … [and] has generally been accepted by other courts in Australasia and even to
some extent by wages boards” (Hammond 1913, p. 268). Later scholars have generally come
to similar conclusions. McCarthy noted, “For most of the unskilled, adverse labour market
conditions caused wages to stick at a level markedly lower than the Harvester standard [prior
to 1907]. ... [M]ost … boards were concerned primarily with skilled or semiskilled workers”
(McCarthy 1968, p. 123). McCarthy saw the Harvester ruling as the beginning of a change in
approach to wage setting by the Special Boards, noting that after 1907, “The process was first
for boards to apply a 36s to 42s a week standard for work done by full labourers, and later to
gradually draw sub-labouring grades of work done by adult males up to the lower figure of
36s. The last stage was to lift all up to the Harvester standard wage of 42s” (McCarthy 1968,
p. 128).
This discussion implies that between 1906 and 1907 there would have been a change in the
nature of minimum wage setting for trades with minimum wages under 42s per week. We
capture this change in our regressions using the interaction of time period (t > 1907 = 1) and
difference between current wage and the Harvester Standard [MAX(0, 42 – lagged
minimum)] as an instrument for the change in the minimum wage. The instrument measures
the wage increase needed to bring the minimum rate in line with the Harvester standard.
Minimum rates already at or above the Harvester standard needed no further increase to reach

28
this level, so in these cases our instrument takes on a value of zero. Prior to 1907, the
Harvester ruling had not been issued and thus could not have affected the reasoning of the
Special Boards. In these cases our instrument also takes on a value of zero. Crucially, this
instrument is exogenous to either wages or employment, as the 42s level was determined
based on the needs of the average adult male worker, not on market factors affecting the
demand for labour. The Harvester standard did not apply to women or youths, and thus we do
not consider these workers in our IV regressions.
To address the validity of this instrument, we examine changes in Special Board minimum
wage determinations after 1907, compared to those issued earlier. A simple inspection of all
judgements (issued across occupations, rather than trades) from 1907 onwards shows that the
Special Boards did not fully adopt the Harvester standard. Approximately 6.1 percent of new
determinations between 1907 and 1913 were less than 42s. Minimum rates of exactly 42s
were relatively rare, averaging about five percent of new determinations between 1907 and
1913, and only exceeding ten percent in 1909. The number of determinations at 45s exceeded
the number at 42s over this period. However, even though there remained minimum rates
below the Harvester standard and there was relatively little clustering at exactly 42s, it is
nevertheless possible that the Special Boards focussed increasingly on raising the lowest
wages following the Harvester case. Figure A1 shows the proportion of workers employed in
trades for which the lowest and median minimum wages were less than the Harvester
standard.20 It is evident that there was a steep drop in the proportion of workers in trades with
minimum rates below 42s between 1906 and 1907 followed by a gradual further decline
thereafter.
As a further test of the effect of the Harvester standard on Victorian minimum wages, we
examine the relationship between our instrument and individual determinations using the full
set of occupation-level minimum wages from the WFSB Appendix. We regress the
percentage change in the nominal minimum wage on 1) MAX (42 – lagged minimum, 0) and
2) MAX (42 – lagged minimum, 0) interacted with the Harvester time dummy. We also
include a time trend and year dummies as control variables in two specifications. In each
specification we include Special Board fixed effects. The results are presented in Table A1.
20 In virtually every trade/year pair, the highest minimum rate exceeded 42s per week and thus we do not instrument for the highest minimum wage in this analysis.

29
The regressions show that the Harvester Judgment had a strong effect on the Special Boards.
Prior to the Harvester Judgement, there was a significant negative relationship between MAX
(42 – lagged minimum, 0) and the percentage increase in the minimum rate. In other words,
the lowest skilled workers received the lowest increases in minimum rates. After the
Harvester Judgment, there was a significant positive relationship. Some idea of the magnitude
of this effect can be obtained by examining the predicted values of the regression at different
initial minimum rates. For example, the first specification implies that the predicted increase
in the minimum wage for an occupation with a minimum wage of 42s or more was 1.59
percent per year over the entire period. By contrast, the predicted increase for an occupation
with a minimum wage of 35s was 0.08 percent per year between 1900 and 1906 and 5.21
percent per year from 1907. These differences are quantitatively large and strongly
statistically significant, thus suggesting a large, exogenous change in wage setting policy
from 1907.
The second exclusion restriction for the suitability of a potential instrument is that there is no
plausible channel by which it affects the dependent variable in the main regression, other than
through the correlation with the independent variable of interest. There is no formal test for
this restriction, but it appears to have been met in practice. Although the Sunshine Harvester
case is widely viewed as the most important decision in Australian industrial relations
history, this is because of the switch from state-level to federal-level minimum wage setting
a decade after the period of our study. The direct impact of the decision on our sample was
negligible. The CCCA did not cover any workers in our sample and only covered relatively
few workers state-wide before the 1920s and so had little direct or indirect, market-based
effects on wages in our sample.

30
References Allen, R. C. (1994) Real incomes in the English-speaking world, 1879-1913. In Grantham, G. and MacKinnon, M. eds. Labour Market Evolution: The Economic History of Market Integration, Wage Flexibility and the Employment Relation (London: Routledge), pp. 107-38. Allegretto, S., Dube, A., and Reich, M. (2011) Do minimum wages really reduce teen employment? Accounting for heterogeneity and selectivity in state panel data. Industrial Relations, 50(2): 205-40. Anonymous (1898a), The boot trade, The Argus, 8 February. Anonymous (1898b), The boot trade and the Factories Act, The Age, 9 February. Ashenfelter, O. and Smith, R. S. (1979) Compliance with the minimum wage law. Journal of Political Economy, 87(2): 333-50. Australia (1907) Commonwealth Arbitration Reports. Aves, E. (1908) Report to the Home Office on the wages boards and industrial conciliation and arbitration acts of Australia and New Zealand. Parliamentary Papers. Balaska, Y. and Rubinstein, Y. (2012), ‘Using federal minimum wages to identify the impact of minimum wages on employment and earnings across the US states’, mimeo. Bhaskar, V. and To, T. (1999) Minimum wages for Ronald McDonald monopsonies: a theory of monopsonistic competition. Economic Journal, 109(455): 190-203. Bhaskar, V. Manning, A., and To, T. (2002) Oligopsony and monopsonistic competition in labor markets. Journal of Economic Perspectives, 16(2): 155-74. Brandeis, L. D. (1915) The Constitution and the minimum wage: defence of the Oregon minimum wage law before the United States Supreme Court. The Survey: 490-94, 521-24. Brown, C. (1999) Minimum wages, employment, and the distribution of income. In O. Ashenfelter, and D. Card, eds. Handbook of Labor Economics, Amsterdam; New York and Oxford: Elsevier Science, pp. 2101-2163. Brown, C., Gilroy, C., and Kohen, A. (1982) The effect of the minimum wage on employment and unemployment. Journal of Economic Literature, 20(2): 487-528. Card, D. and Krueger, A. B. (1994) Minimum wages and employment: a case study of the fast-food industry in New Jersey and Pennsylvania. American Economic Review, 84(4): 772-93. Card, D. and Krueger, A. B. (1997) Myth and Measurement: The New Economics of the Minimum Wage (Princeton: Princeton University Press).

31
Coghlan, T. A. (1918) Labour and Industry in Australia from the First Settlement in 1788 to the Establishment of the Commonwealth in 1901 (Melbourne: Cambridge University Press). Connolly, S. and Gregory, M. (2002) The national minimum wage and hours of work: implications for low paid women, Oxford Bulletin of Economics and Statistics, 64 (s1): 607-31. Couch K. A. and Wittenburg, D. C. (2001) The response of hours of work to increases in the minimum wage. Southern Economic Journal, 68(1): 171-7. Dickens, R., Machin, S., and Manning, A. (1999) The effects of minimum wages on employment: theory and evidence from Britain. Journal of Labor Economics, 17(1): 1-22. Dickens, R., Riley, R., and Wilkinson, D. (2015) A re-examination of the impact of the UK national minimum wage on employment. Economica, 82(328): 841–64. Dube, A., Lester, T. W., and Reich, M. (2010) Minimum wage effects across state borders: estimates using contiguous counties. Review of Economics and Statistics, 92(4): 945-64. Ehrenberg, R. G. and Smith R. S. (2012) Modern Labor Economics: Theory and Public policy, Eleventh ed. (Boston: Prentice Hall). Gramlich, E. M., Flanagan, R. J., and Wachter, M. L. (1976) Impact of minimum wages on other wages, employment, and family incomes. Brookings Papers on Economic Activity, 2: 409-61. Hagan, J. (1964) Trade unions and the first Victorian factory acts. Labour History, 7(1): 3-11. Hammond, M. B. (1913) Judicial interpretation of the minimum wage in Australia. American Economic Review, 3(2): 259-86. Hammond, M. B. (1915a) Where life is more than meat: the Australian experience with wage boards. The Survey: 495-502. Hammond, M. B. (1915b) Wages boards in Australia: IV. social and economic results of wages boards. The Quarterly Journal of Economics, 29(3): 563-630. Hancock, K. (1983) The Arbitration Tribunals and the Labour Market (Melbourne, CEDA). Hatton, T. and Withers, G. (2014) The labour market. In Ville, S. and Withers, G. eds. The Cambridge Economic History of Australia (Melbourne: Cambridge University Press), pp. 351-72. Huberman, M. and Meissner, C. M. (2010) Riding the wave of trade: the rise of labor regulation in the golden age of globalization. The Journal of Economic History, 70(3): 657-85. Isaac, J. (2008) The economic consequences of Harvester, Australian Economic History Review, 48 (3): 280-300.

32
Kennan, J. (1995) The elusive effects of minimum wages. Journal of Economic Literature, 33(4): 1950-65. Lester, R. A. (1960) Employment effects of minimum wages. Industrial and Labor Relations Review, 13(2): 254-64. McCarthy, P. G. (1968) Victorian wages boards: their origins and the doctrine of the living wage. Journal of Industrial Relations, 10(2): 116-34. Machin, S. and Manning, A. (1994) Minimum wages, wage dispersion and employment: evidence from the UK Wages Councils. Industrial and Labor Relations Review, 47(2): 319–29. McLean, I. W. and Woodland, S. J. (1992) Consumer prices in Australia 1850-1914 (Working Paper 92-4, Department of Economics, University of Adelaide). Mulvey, C. (1986) Overview of the debate. In Blandy, R. and Niland, J. eds. Alternatives to Arbitration (Sydney: Allen and Unwin), pp. 11-28. Neumark, D. and Wascher, W. L. (1992) Employment effects of minimum and subminimum wages: panel data on state minimum wage laws. Industrial & Labor Relations Review, 46(1): 55-81. Neumark, D. and Wascher, W. L. (2008) Minimum Wages (Boston: MIT Press). Neumark, D., Salas, J. M. I., and Wascher, W. (2014a) More on recent evidence on the effects of minimum wages in the United States. IZA Journal of Labor Policy, 3(24). Neumark, D., Salas, J. M. I., and Wascher, W. (2014b) Revisiting the minimum wage-employment debate: throwing out the baby with the bathwater? Industrial and Labor Relations Review, 67(3): 608-48. Norris, K. (1986) The wages structure: does arbitration make any difference? In Niland, J. ed. Wage Fixation in Australia (Sydney: Allen and Unwin), pp. 183-202. OECD, Minimum relative to average wages of full-time workers, OECD.com, https://stats.oecd.org/Index.aspx?DataSetCode=MIN2AVE (accessed 24/07/2015). Rankin, M. T. (1916) Arbitration and Conciliation in Australasia: The Legal Wage in Victoria and New Zealand (London: Allen and Unwin). Reeves, W. P. (1923) State Experiments in Australia & New Zealand (London: Allen and Unwin). Seltzer, A. J. (1997) The effects of the Fair Labor Standards Act of 1938 on the Southern seamless hosiery and lumber industries. Journal of Economic History, 57(2): 396-415. Seltzer, A. J. (2014) Labour, skills, and migration. In Ville, S. and Withers, G. eds. The Cambridge Economic History of Australia (Melbourne: Cambridge University Press), pp. 178-201.

33
Stewart, M. B. (2004) The impact of the introduction of the U.K. minimum wage on the employment probabilities of low-wage workers. Journal of the European Economic Association, 2(1): 67–97. Stewart, M. B. and Swaffield, J. K. (2008). The other margin: do minimum wages cause working hours adjustments for low-wage workers? Economica, 75(297), new series, 148-67. Stigler, G. (1946) The economics of minimum wage legislation. American Economic Review, 36(3): 358-65. Victoria (1896-1913) Papers of Special Boards, Victoria Public Record Office, North Melbourne, VPRS 5466. Victoria (various years) Report of the Chief Inspector of Factories, Work-Rooms, and Shops (Melbourne, Government Printer). Webb, S. (1912) The economic theory of a legal minimum wage. Journal of Political Economy, 20(10): 973-98. Withers, G. (1986) Australian wages and labour market adjustment: a comparative international assessment. In Niland, J. ed. Wage Fixation in Australia (Sydney: Allen and Unwin), pp. 243-55. Zavodny, M. (2000) The effect of the minimum wage on employment and hours, Labour Economics 7: 729–50.

34
Table 1 OLS Regressions on Average Wages
Sample Minimum Lagged
Minimum R2 F N
Adult males, all observations 0.071*** (4.82)
0.150*** (9.22)
0.805 203.81*** 603
Adult males, lag(bite)<0.75 0.061*** (4.05)
-0.024 (0.25)
0.746 95.76*** 188
Adult males, lag(bite)>0.85 0.098** (2.04)
0.239*** (4.06)
0.875 374.22*** 258
Adult females, all observations 0.110 (0.91)
0.038 (1.13)
0.558 70.64*** 259
Adult females, lag(bite)<0.85 0.078 (0.55)
0.004 (0.03)
0.475 212.44*** 149
Adult females, lag(bite)>0.85 0.254* (2.03)
0.170 (1.04)
0.769 179.60*** 118
Males, 19-21, all observations 0.009 (0.47)
0.019 (0.48)
0.023 2.53*** 548
Males, 13-18, all observations 0.036 (0.79)
0.144*** (2.81)
0.083 7.01*** 586
Females, 19-21, all observations 0.306** (2.77)
-0.021 (0.21)
0.291 203.56*** 150
Females, 13-18, all observations 0.145*** (2.84)
0.054 (1.43)
0.323 28.06*** 249
Notes: *** = Significance at the 1% level; ** = Significance at the 5% level; * = Significance at the 10% level. Absolute value of t-statistics in parentheses.

35
Table 2 OLS Regressions on Employment
Minimum Wage Variable Sample Minimum Lagged
Minimum Female
Minimum Lagged Female
Minimum R2 F N
% ∆ lowest real minimum Adult males -0.125 (1.63)
-0.204 (1.53)
0.037 2.79*** 604
% ∆ lowest real minimum
Adult males Lag (bite)<0.75
-0.170*** (2.77)
0.117 (1.02)
0.126 7.64*** 188
% ∆ lowest real minimum
Adult males Lag (bite)>0.85
0.548 (1.44)
-0.430* (1.79)
0.060 3.27*** 259
% ∆ lowest real minimum (includes lagged dependent variable)
Adult males -0.270*** (5.49)
-0.064 (0.74)
0.093 6.06*** 542
% ∆ lowest real minimum
Adult males Restricted sample
-0.113 (1.49)
-0.152 (1.42)
0.035 3.28*** 603
% ∆ median real minimum Adult males -0.149** (2.60)
-0.118 (1.30)
0.034 2.59*** 604
% ∆ highest real minimum Adult males -0.140*** (3.62)
-0.146 (1.42)
0.035 2.87*** 604
% ∆ lowest nominal minimum Adult males -0.126 (1.57)
-0.218 (1.59)
0.037 2.75*** 604
Ln (lowest real minimum wage) Adult males 0.029 (0.28)
-0.367* (1.66)
0.006 18.28*** 716
% ∆ in lowest real minimum
Adult males -0.197*** (2.64)
-0.179 (1.31)
0.307** (2.32)
0.047 (0.40)
0.040 3.33*** 604
% ∆ in lowest real minimum Adult Females -0.482 (0.62)
-1.113 (1.30)
0.036 1.54 271
% ∆ lowest real minimum
Adult Females Lag (bite)<0.85
0.476 (0.78)
0.577* (1.87)
0.222 11.30*** 105
% ∆ lowest real minimum
Adult Females Lag (bite)>0.85
-2.358 (1.26)
-0.862 (0.75)
0.038 3.59*** 166
% ∆ in lowest real minimum Males, 19-21 -0.123 (1.58)
-0.033 (0.32)
0.038 4.28*** 554
% ∆ in lowest real minimum Males, 13-18 -0.130 (1.00)
-0.193 (1.23)
0.040 7.80*** 588
% ∆ in lowest real minimum Females, 19-21 1.025* (1.82)
0.262 (0.81)
0.124 12.56*** 154

36
Table 2, continued OLS Regressions on Employment
Minimum Wage Variable Sample Minimum Lagged
Minimum Female
Minimum Lagged Female
Minimum R2 F N
% ∆ in lowest real minimum Females, 13-18 -0.086 (0.37)
0.632 (1.21)
0.041 2.18** 259
Notes: Restricted sample indicates that the lowest minimum wages was calculated using only occupations that were covered from the time of the
initial establishment of a Special Board. Other notes are the same as Table 1.

37
Table 3 IV Regressions on Adult Male Employment
Specification Minimum
(instrumented)Female
Minimum Lagged Female
Minimum R2 F N
% ∆ Employment, Lowest minimum -0.161 (0.31)
0.029 87.77*** 643
% ∆ Employment, Lowest minimum Restricted sample
-0.183 (0.34)
0.029
87.29*** 641
% ∆ Employment, Lowest minimum -0.276 (0.48)
0.366 (1.47)
0.031 91.95*** 643
% ∆ Employment, Lowest minimum -0.603 (0.98)
0.451* (1.74)
-0.093 (0.58)
0.024
81.10*** 605
% ∆ Employment, Median minimum -0.187 (0.31)
0.029 87.89*** 643
Notes: The first stage regressions are strongly significant show a close relationship between our instrument and the trade-level minimum wage.
In the regressions instrumenting for the lowest minimum rate, the F-statistic for the first stage is 62.03 and the coefficient on the instrument is 0.648 (Z-statistic = 5.58). Other notes are the same as in Tables 1 and 2.

38
Table 4 OLS Regressions on Other Outcomes
Outcome variable Minimum Lagged Minimum R2 F N
Adult male employment ratio -0.019 (1.32)
-0.026 (1.52)
0.058 3.91*** 609
Adult employment ratio 0.008 (0.51)
-0.012 (.82)
0.066 5.05*** 609
Male piece rate ratio 0.033** (2.43)
0.026 (1.49)
0.046 1.96** 510
Female piece rate ratio -0.102* (1.74)
-0.096* (1.94)
0.065 1.48 240
Hours worked -0.003 (1.14)
0.030 0.93 632
Male apprentice proportion 0.234 (0.93)
0.008 4.55*** 273
Male improver proportion -0.007 (1.15)
0.051 1.84** 623
Female apprentice proportion -1.60 (1.26)
0.194 0.90 119
Female improver proportion -2.80 (0.77)
0.048 3.25*** 217
Male overtime rate 0.023 (0.46)
0.047 1.43 598
Male Sunday rate 0.455 (0.84)
0.036 0.81 302
Female overtime rate 0.167 (1.54)
0.128 --- 272
Female Sunday rate 0.114 (0.97)
0.031 0.24 122
Notes: See Table 1.

39
Table A1 The Determinants of Occupation-Level Adult Male Minimum Wage Rates
1 2 3 MAX (42 – lagged minimum, 0) -0.215***
(-5.90) -0.092**
(2.45) -0.092**
(2.46) MAX (42 – lagged minimum, 0) * after Harvester
0.732*** (17.56)
0.617*** (14.54)
0.639*** (14.68)
Year -0.290*** (11.87)
Year Dummies NO NO YES Constant 1.587***
(20.53) -1.061***
(4.50) -0.086 (0.21)
F 168.50*** 161.54*** 50.74*** Adjusted R2 0.093 0.111 0.136 N 7100 7100 7100
Notes: Dependent variable is the percentage change in the real minimum wage rate, at the
occupation level. Other notes are the same as Table 1.

40
Figure 1 Numbers of Special Boards and Covered Workers 1898-1913
Source: Victoria, Report of the Chief Inspector.
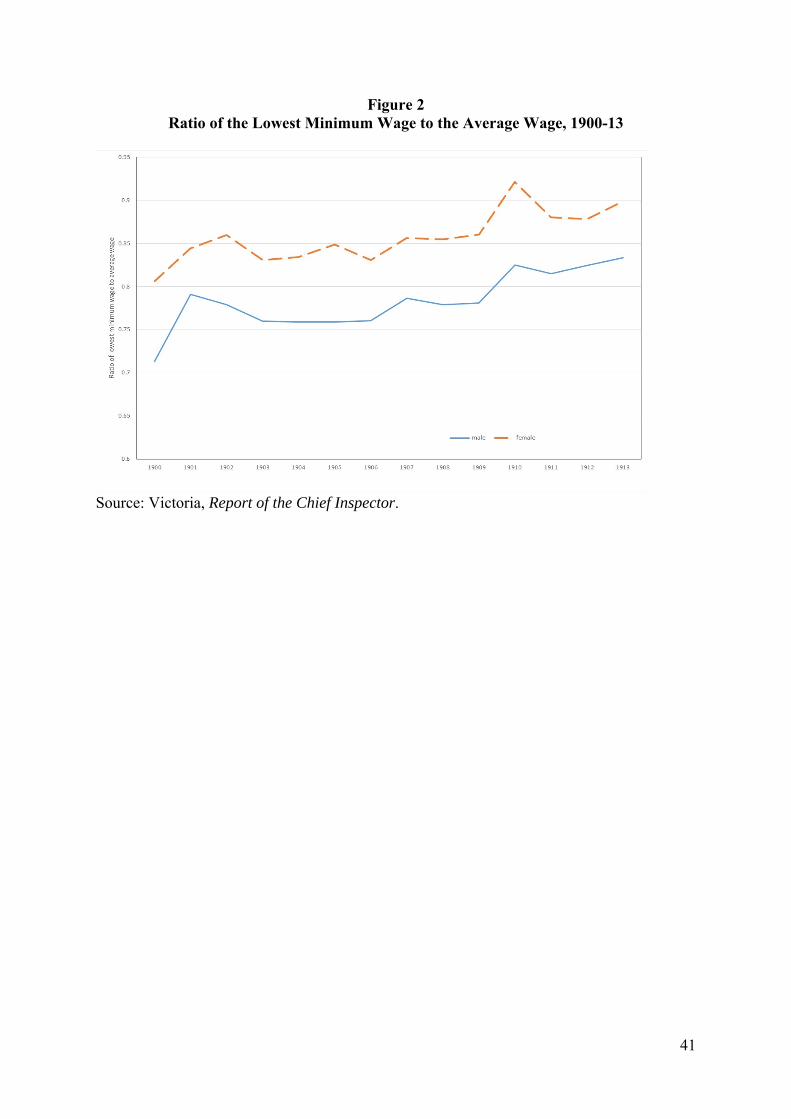
41
Figure 2 Ratio of the Lowest Minimum Wage to the Average Wage, 1900-13
Source: Victoria, Report of the Chief Inspector.
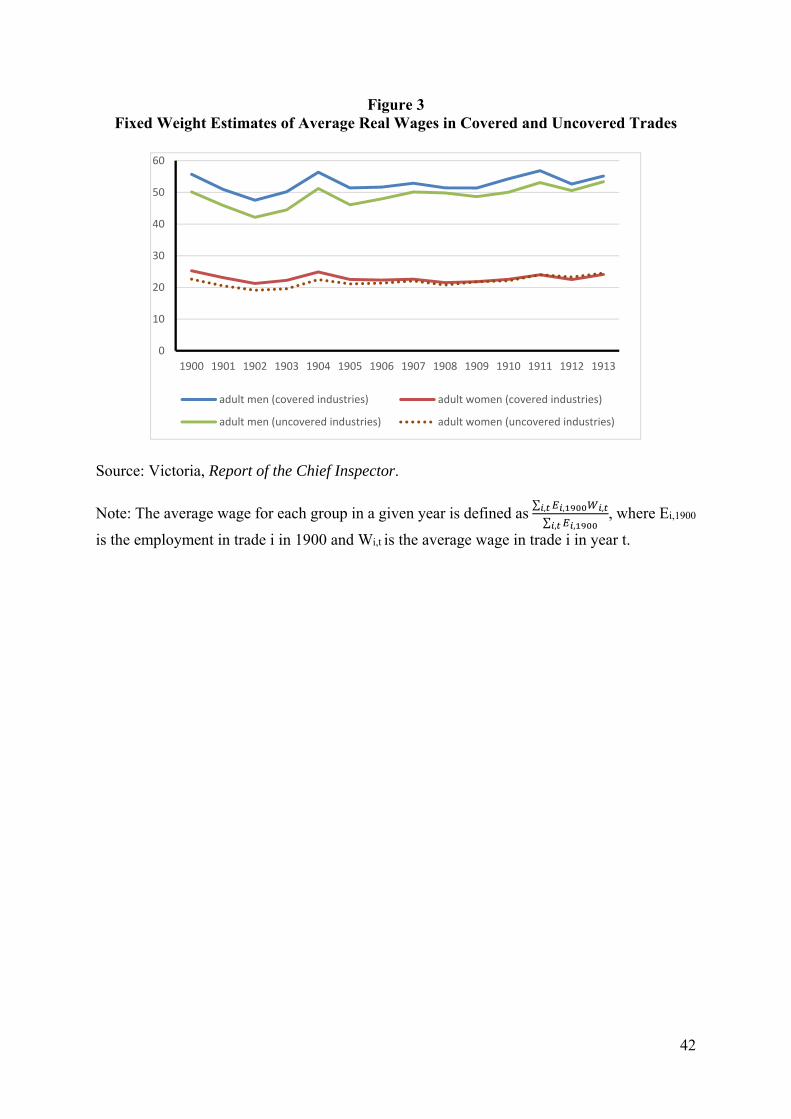
42
Figure 3 Fixed Weight Estimates of Average Real Wages in Covered and Uncovered Trades
Source: Victoria, Report of the Chief Inspector.
Note: The average wage for each group in a given year is defined as ∑ , ,,
∑ ,,, where Ei,1900
is the employment in trade i in 1900 and Wi,t is the average wage in trade i in year t.
0
10
20
30
40
50
60
1900 1901 1902 1903 1904 1905 1906 1907 1908 1909 1910 1911 1912 1913
adult men (covered industries) adult women (covered industries)
adult men (uncovered industries) adult women (uncovered industries)

43
Figure A1 Percent of Adult Male Workers in Trades with Minimum Rates Under 42s per Week
Source: Victoria, Report of the Chief Inspector.