the impact of the quality of a marketing decision support ... · the impact of the quality of a...
TRANSCRIPT

International Journal of
Research in Marketing
ELSEVIER Intern. J. of Research in Marketing 13 (1996) 331-343
The impact of the quality of a marketing decision support system: An experimental study
Gerrit H. van Bruggen *, Ale Smidts, Berend Wierenga Rotterdam School of Management, Department of Marketing Management. Erasmus Unit,ersity Rotterdam, P.O. Box 1738. 3000 DR
Rotterdam. The Netherlands
Received 1 October 1994: accepted 4 June 1996
Abstract
In this paper we present the results of an experimental study of the impact of the quality of a marketing decision support system (MDSS). The experiment was conducted in the MARKSTRAT environment. The quality of an MDSS was operationalized as the predictive precision of its simulation models. The results show that marketing decision-makers using a high-quality MDSS outperform marketing decision-makers using a medium-quality MDSS. The superior performance with the high-quality MDSS was obtained for both low and high time-pressure.
Keywords: Decision support; System quality; Laboratory experiment; MARKSTRAT
1. Introduct ion
Since the early 1960s the literature of marketing science has been enriched by a great number of publications on marketing decision support systems (MDSS). Most of this literature focuses on the de-
celopment of these decision aids, more specifically on marketing modell ing (Montgomery and Urban, 1969; Naert and Leeflang, 1978; Lilien et al., 1992).
Although the aim of MDSS I is to increase the effectiveness of decision-makers, little attention has been paid to the issue of whether these systems really improve performance. The two best-known
Corresponding author. Phone: + + 31-10-4082258; fax: + + 31 - 10-2120544; e-mail: GBRUGGEN @ FAC.FBK.EUR.NL
] Henceforth. the abbreviation MDSS is used for both Market- ing Decision Support System (singular) and Marketing Decision Support Systems (plural).
studies of the effectiveness of MDSS are the labora- tory experiments performed by Chakravarti et al. (1979) and Mclntyre (1982). Chakravarti et al. (1979) found that the use of ADBUDG did not improve the quality of advertising decisions and in fact led to poorer decisions. Mclntyre (1982) reported, contrary to the results of Chakravarti et al. (1979), that deci- sion calculus models can produce better decisions. Thus, the results of the two previous empirical stud- ies of the effectiveness of MDSS are mixed.
We propose that the extent to which an MDSS affects the performance of decision-makers using the system is dependent on four categories of variables: ( i ) the MDSS itself, ( i i ) the marketing decision- maker, (i i i) the marketing problem, and (its) the decision-environment.
In studies of the effectiveness of MDSS, the emphasis has been on use versus non-use of MDSS and how this influenced the performance of
0167-8116/96/$15.00 Copyright © 1996 Elsevier Science B.V. All rights reserved. PII S0167-8116(96)00017-1

332 G.H. L,an Bruggen et a l . / lntern. J. of Research in Marketing 13 (1996) 331-343
decision-makers. This is an all-or-none perspective on category (i). In category (ii), decision-maker variables, Mclntyre (1982) analyzed the effects of variables such as mathematical ability and cognitive style, and Zinkhan et al. (1987) studied the effects of risk aversion, cognitive differentiation, involvement, age, and both managerial and DSS experience. In category (iii), problem characteristics, Mclntyre (1982) investigated the influence of problem size on the effectiveness of MDSS. Finally, category (iv), the decision-environment also was studied by Mcln- tyre (1982) in examining the influence of the noise level in the environment on the effectiveness of an MDSS.
So far, to our knowledge, the influence of charac- teristics of the MDSS itself (category (i)) on the performance of marketing decision-makers has not been studied, even though one might expect the quality of the MDSS to have a major effect. In this paper we compare the effects of two different MDSS, a medium-quality system and a high-quality system. We focus on the following research question: does the quality of a Marketing Decision Support System influence its effects, and does this influence depend on the time-pressure under which the decisions have to be made?
The effect of the MDSS is operationalized as two sets of variables: objective and subjective. The per- formance of marketing decision-makers and the in- tensity with which the systems are used are mea- sured objectively. The subjective measures concern the confidence decision-makers show in the deci- sions they made and the perceived usefulness of the system that was used. Both variables describe the psychological effects of the quality of the MDSS.
The effects of the quality of the MDSS are inves- tigated for both low time-pressure and high-time pressure conditions. Marketing decision-makers of- ten have to operate under a substantial time-pressure; for example, the availability of scanner data on a repetitive basis makes it necessary to make decisions very frequently. We expect time-pressure may possi- bly eliminate the performance advantage of a high- quality MDSS.
We carried out a laboratory experiment in a simu- lated marketing environment, the MARKSTRAT en- vironment (Larrrch6 and Gatignon, 1990), which can be characterized as comprehensive and dynamic.
MARKSTRAT is considered a realistic environment for studying marketing decision-making and has been extensively used in previous studies (Hogarth and Makridakis, 1981; Glazer et al., 1987; Glazer et al., 1989; Curren et al., 1992; Glazer et al., 1992; Glazer and Weiss, 1993).
The organization of this paper is as follows: in Section 2, we describe the theory relating to the main variables, leading to their hypothesized effects; in Section 3, the methodology of the study is described; the results of our study are presented in Section 4; and finally in Section 5 we discuss our most impor- tant findings and their implications.
2. Hypotheses
2.1. Quality of the MDSS
It seems reasonable to expect that better-quality MDSS will have a more positive impact on the performance of marketing decision-makers than sys- tems with lower quality. Here we define the quality of an MDSS as the predictive precision of its simula- tion models. We look at the effects of two MDSS, which differ in the quality of their simulation mod- els. The first MDSS makes predictions, for the out- comes of marketing-mix programs, which show a reasonable precision (the 'medium-quality' MDSS). The second MDSS has higher predictive precision (the 'high-quality' MDSS).
We expect that since the high-quality MDSS pro- vides more accurate predictions than the medium-qu- ality MDSS, it will be superior in improving perfor- mance. We also expect that the high-quality MDSS will be used more intensively than the medium-qual- ity MDSS. This latter expectation is supported by the Deshpand6 and Zaltman (1982) finding that increas- ing the quality of market research enhances its use. Further, since the high-quality MDSS produces pre- dictions that deviate less from the actual results than the medium-quality MDSS, we expect that the high- quality MDSS increase decision-confidence and will be perceived as more useful than the medium-quality MDSS.
In order to test the hypotheses, we compare the results of both groups of MDSS decision-makers (users of the medium-quality MDSS and users of the

G.H. ran Bruggen et al./ Intern. J. of Research in Marketing 13 (1996) 331-343 333
high-quality MDSS) with the results of decision- makers who did not use any MDSS,
We hypothesize that:
H. la. Decision-makers using the high-quality MDSS will outperform decision-makers using the medium-quality MDSS. Decision-makers using the medium-quality MDSS will outperform the unaided decision-makers.
H.lb. Decision-makers using the high-quality MDSS will use the system more intensively than decision-makers using the medium-quality MDSS.
ferences with respect to both the objective and the subjective measures between users of the high-qual- ity MDSS and users of the medium-quality MDSS will be larger when decision-makers operate under low time-pressure, relative to working under high time-pressure.
We hypothesize that:
H.2a. Under low time-pressure the difference in performance between marketing decision-makers us- ing the high-quality MDSS and marketing decision- makers using the medium-quality MDSS will be larger than under high time-pressure.
H. lc. Decision-makers using the high-quality MDSS will show more decision-confidence than de- cision-makers using the medium-quality MDSS. De -~ cision-makers using the medium-quality MDSS will show more decision-confidence than unaided deci- sion-makers.
H.ld. Decision-makers using the high-quality MDSS will perceive their system as more useful than decision-makers using the medium-quality MDSS.
2.2. Time-pressure
Decision-making under time-pressure is definable as a situation in which the amount of time does not suffice to find a solution to the particular problem at hand or to reach the most effective result possible (Bronner, 1973). According to Rothstein (1986), time-pressure causes utilization of less information, which produces an overall performance decrement. Time-pressure also should affect information gather- ing and processing. Wright (1974), for example, found that high time-pressured subjects take fewer dimensions into account when evaluating cars.
To be able to maximally exploit the opportunities a high-quality MDSS offers, a decision-maker needs enough time. Under high time-pressure, both the medium-quality MDSS and the high-quality MDSS provide the decision-maker with sufficient if not optimal information on alternative marketing mixes. However, when there is enough time, the high-qual- ity MDSS can be used to obtain more precise infor- mation, which the medium-quality MDSS is not able to deliver. Therefore, we expect that (positive) dif-
H.2b. Under low time-pressure the difference in the intensity of use between the high-quality MDSS and the medium-quality MDSS will be larger than under high time-pressure.
H.2c. Under low time-pressure the difference in decision-confidence between users of the high-qual- ity MDSS and users of the medium-quality MDSS will be larger than under high time pressure.
H.2d. Under low time-pressure the difference in perceived usefulness between the high-quality MDSS and the medium-quality MDSS will be larger than under high time pressure.
3. Methodology
3.1. Design
The experimental variables in our study were quality of the MDSS (QUALITY) and time-pressure (TIPR). QUALITY has three levels: no MDSS, medium-quality MDSS, and high-quality MDSS. TIPR has two levels: low time-pressure and high time-pressure. In the 3 * 2 factorial design, six exper- imental groups, consisting of 20 subjects each, were created.
3.2. Subjects
Participants in the experiment were 120 master- level students in business administration or business economics. The selected students all had passed a

334 G.H. L,an Bruggen et al. / Intern. J. of Research in Marketing 13 (1996) 331-343
substantial number of courses in marketing. Subjects were assigned randomly to the six experimental groups. No systematic differences appeared in the groups' analytical capabilities as measured by the Embedded Figures Test (Witkin et al., 1971) ( F = 0.755, p = 0.584) or experience in working with computers as measured by the mean number of weekly hours they used a computer ( F = 0.521, p = 0.750).
3.3. Experimental task
The subjects adopted the role of marketing deci- sion-makers in the MARKSTRAT world. MARK- STRAT provides an environment in which a fixed number of firms (five) compete, using a large set of marketing instruments in markets with heteroge- neous consumer preferences (for a complete descrip- tion see Gatignon (1987) and Larrrch6 and Gatignon (1990)). Specifically, the subjects were the market- ing decision-makers of MARKSTRAT Company Two. This company was marketing two brands, called SEMI and SELF, of a consumer-durable electronic product. The objective given to the decision-makers was to maximize the total market-share of their company. They were told, however, that "profits are also very important because the profit in one period determines the marketing budget in the next". To obtain a certain market-share, the decision-makers had to make decisions concerning the advertising budget, the percentage of the advertising budget allocated to advertising research, and the price and the quantity of products to be produced. These deci- sions had to be made for both brands: SEMI and SELF. Furthermore, in each period decisions had to be made on the sales force size and the allocation of this sales force over the distribution channels. The market-share obtained for both brands was a function of their own decisions, the decisions of competitors, and environmental factors in the MARKSTRAT world.
Subjects had to make their decisions for four consecutive periods. To avoid an 'end-of-game' ef- fect the subjects were not told in advance the number of periods to be played.
In addition to the company of the decision-maker, four other competitive companies were active in the industry. Each of these four companies was market-
ing two brands. These four companies were 'phan- tom' companies. All decisions for these phantom companies were programmed by the experimenter in advance. The competitive behavior can be character- ized as rational and is in conformity with the princi- ples of the Growth-Share Matrix of the Boston Con- sulting Group (Aaker, 1992): brands with profit- potential were provided with more marketing support than less promising brands, which were treated as cash-cows. The phantom company approach means that each subject faced the same starting situation and the same competitors. The subjects did not compete with each other which makes the perfor- mance of subjects independent of other subjects. Consequently, the results of the subjects are compa- rable.
3.4. Game information
In each period all decision-makers received the standard MARKSTRAT computer output. In addi- tion to this information, the decision-makers operat- ing in the MDSS conditions had an MDSS at their disposal. The MDSS consisted of both a data base and a model base. The MDSS enabled the decision- makers to investigate the effects of a number of alternative marketing actions by performing 'what- if' analyses. For this purpose the MDSS contained a simulation model. Input for the data base of the MDSS in each period were marketing research data, financial data concerning the company, and data about general economic conditions. These data were generated by the MARKSTRAT-program. To per- form what-if analyses, the user of the system had to enter self-chosen values for the decision-variables for the brands SEMI and SELF. The MDSS then predicted the values of: the number of distributors in each channel, brand awareness, the amount of sales, the net marketing contribution (profit).
The users of the MDSS were allowed to make as many simulations as they wanted in order to help them design a marketing plan. The MDSS also had the option of presenting graphs for the relationship between advertising expenditures and brand aware- ness. Graphics were also available for the relation- ship between distribution efforts and the number of distributors for a brand.

G.H. t,an Bruggen et al. / Intern. J. of Researeh in Marketing 13 (1996) 331-343 335
3.5. OL,erall measurement plan
For each subject, market-share (SHARE) was measured as the performance variable. In total four periods were played. Therefore, we have four (re- peated) measurements for SHARE. The number of simulations (SIMUL) made with both the medium- quality and the high-quality MDSS was counted as a measure for the intensity with which the two MDSS were used. SIMUL was measured in all four deci- sion-making periods for the decision-makers having an MDSS at their disposal. Decision-confidence (CONFIDENCE) was measured twice for all sub- jects: after the subjects made decisions in the second and fourth periods. Finally, the perceived usefulness of the MDSS (USEFUL) was measured twice: after making decisions in the second and fourth periods. USEFUL was measured only for decision-makers who used an MDSS. The measures of these variables were as follows.
3.6. Measures
3.6.1. Objectit,e ~,ariables 1. Market Share (SHARE). The performance of
the subjects was measured by the level of the mar- ket-share and profit they obtained for the two brands combined. Analyses were performed for both mar- ket-share and profit. Since the results in our study were very similar for these two variables ( r = 0.89, p < 0.000), we report only the market-share results. SHARE was calculated as the combined market share (in volume) of the brands SEMI and SELF.
2. Number of Simulations (SIMUL). The inten- sity with which the two MDSS were used was measured by the number of ' w h a t - i f ' simulations. Each time the decision-maker used the MDSS to investigate the consequences of a certain marketing action, it was counted as a simulation.
sional and attained a Cronbach alpha reliability of 0.73.
2. Perceived Usefulness of the MDSS (USEFUL). To measure how useful the subjects perceived the MDSS to be, we adopted the USEFUL-scale devel- oped and validated by Davis (1989) (see also Adams et al., 1992; Hendrickson et al., 1993). On six items, subjects were asked to assess how useful they per- ceived the MDSS in making decisions (see Appendix B). The USEFUL-scale was also uni-dimensional and attained a Cronbach alpha reliability of 0.89.
3.6.3. Independent L, ariables 1. Quality of a Marketing Decision Support Sys-
tem (QUALITY). For the QUALITY factor, three different modes of marketing decision support were applied: no MDSS, medium-quali ty MDSS and high-quality MDSS. In the non-MDSS situation sub- jects had only the standard M A R K S T R A T informa- tion at their disposal. The quality-difference between the two MDSS were the following:
Medium-quality MDSS. The decision-makers oper- ating in the medium-quali ty MDSS condition had an MDSS at their disposal which showed a mean absolute percentage error (MAPE) in its forecasts of 23% (standard deviation 16%) for the simula- tion of 100 realistic marketing-mix combinations. 2 High-Quality MDSS. The simulation model of the high-quality MDSS gave very good predictions for the various phenomena in the market. In a simula- tion of the same 100 marketing-mix programs mentioned above, the MAPE was 3% (standard deviation 2.6%). So the MAPE of the high-quality MDSS was set exactly 20 percentage-points lower than the MAPE of the medium-quali ty MDSS. We chose such a high level because the use of such an accurate MDSS gives us an idea of the potential a very good MDSS has.
3.6.2. Subjective variables 1. Decision-Confidence (CONFIDENCE). To
measure the confidence decision-makers showed in their decisions, we developed a CONFIDENCE-sca le in which subjects were asked to rate five items (see Appendix A for the wording of the items). The CONFIDENCE-sca le appeared to be uni-dimen-
2 Not very much is known about the predictive power of marketing models used in real-life settings. This makes it difficult to assess what a realistic level of the predictive power of an MDSS is. However, in the field of time-series models, Wheel- wright and Makridakis (1985) report an average MAPE of 24 time-series methods which was 22.1%. So the forecasting error of 23% for our medium-quality MDSS is comparable with the MAPE of these time-series methods.

336 G.H. can Bruggen et al. / Intern. J. of Research in Marketing 13 (1996) 331-343
Table 1 Results of the four ANOVAs
SS DF MS F Sig of F
SHARE (between subjects) RESIDUAL 9759.81 114 85.61 QUALITY 2287.15 2 1143.58 13.36 0.000 TIPR 532.99 1 532.99 6.23 0.014 QUALITY * TIPR 302.95 2 151.47 1.77 0.175
SHARE (within subjects) RESIDUAL 4028.50 342 11.78
Huynh Feldt a 236.23 PERI 914.77 3 304.92 25.89 0.000
Huynh Feldt 2.07 25.89 0.000 QUALITY * PERI 57.47 6 9.58 0.81 0.560
Huynh Feldt 4.14 0.81 0.522 TIPR * PERI 14.58 3 4.86 0.41 0.744
Huynh Feldt 2.07 0.41 0.670 QUALITY * TIPR * PERI 49.50 6 8.25 0.70 0.650
Huynh Feldt 4.14 0.70 0.597
SlMUL (between subjects) RESIDUAL 28076.73 76 369.43 QUALITY 120.05 1 120.05 0.32 0.570 TIPR 5248.80 1 5248.80 14.21 0.000 QUALITY * TIPR 0.61 1 0.61 0.00 0.968
SlMUL (within subjects) RESIDUAL 15779.07 228 69.21
Huynh Feldt 190.40 PERI 841.41 3 280.47 4.05 0.008
Huynh Feldt 2.51 4.05 0.012 QUALITY * PERI 1623.38 3 54 I. 13 7.82 0.000
Huynh Feldt 2.51 7.82 0.000 TIPR * PERI 428.32 3 142.77 2.06 0.106
Huynh Feldt 2.51 2.06 0.118 QUALITY * TIPR * PERI 29.31 3 9.77 0.14 0.935
Huynh Feldt 2.51 0.14 0.909
CONFIDENCE (between subjects) RESIDUAL 135.43 114 I. 19 QUALITY 1.63 2 0.81 0.68 0.507 TIPR 2.30 1 2.30 1.93 0.167 QUALITY * TIPR 0.02 2 0.01 0.01 0.993
CONFIDENCE (within subjects) RESIDUAL 35.93 114 0.32 PERI 7.80 1 7.80 24.76 0.000 QUALITY * PERI 0.63 2 0.32 1.00 0.371 TIPR * PERI 0.01 I 0.01 0.03 0.869 QUALITY * TIPR * PERI 0.17 2 0.08 0.26 0.768
USEFUL (between subjects) RESIDUAL 82.15 76 1.08 QUALITY 0.30 1 0.30 0.28 0.600 TIPR 0.87 1 0.87 0.80 0.374 QUALITY * TIPR 4.85 1 4.85 4.49 0.037
G.H. t'an Bruggen et al. / Intern. J. of Research in Marketing 13 (1996) 331-343 337
Table 1 (continued)
SS DF MS F Sig of F
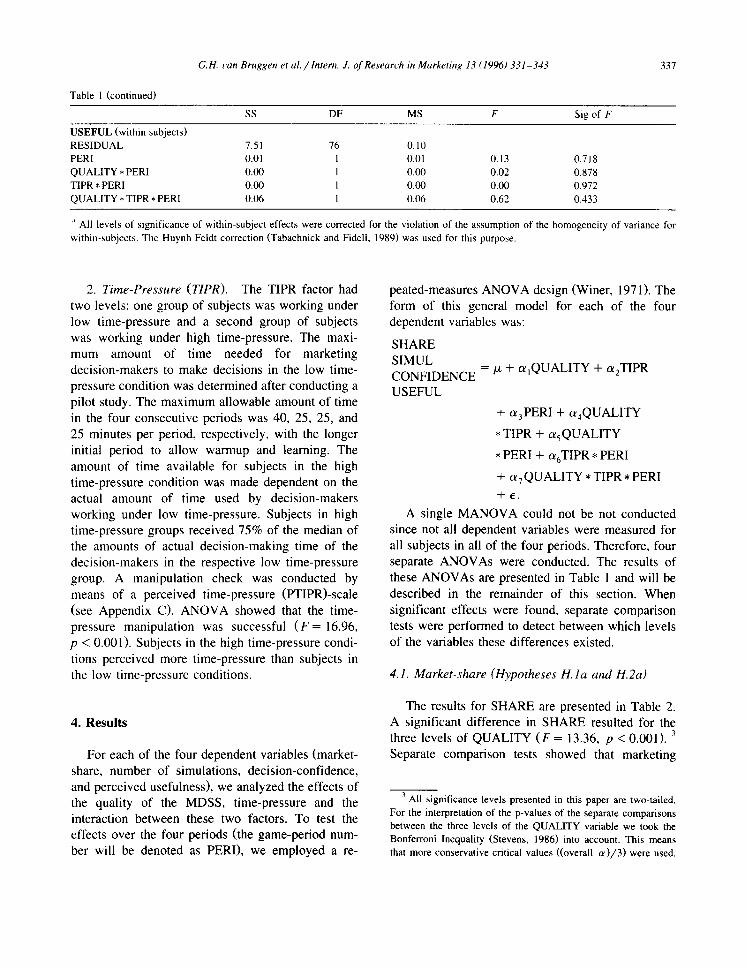
USEFUL (within subjects) RESIDUAL 7.51 76 0.10 PERI 0.01 1 0.01 0.13 0.718 QUALITY * PERI 0.00 1 0.00 0.02 0.878 TIPR * PERI 0.00 1 0.00 0.00 0.972 QUALITY * TIPR * PERI 0.06 1 0.06 0.62 0.433
All levels of significance of within-subject effects were corrected for the violation of the assumption of the homogeneity of variance for within-subjects. The Huynh Feldt correction (Tabachnick and Fidell, 1989) was used for this purpose.
2. Time-Pressure (TIPR). The TIPR factor had two levels: one group of subjects was working under low time-pressure and a second group of subjects was working under high time-pressure. The maxi- mum amount of time needed for marketing decision-makers to make decisions in the low time- pressure condition was determined after conducting a pilot study. The maximum allowable amount of time in the four consecutive periods was 40, 25, 25, and 25 minutes per period, respectively, with the longer initial period to allow warmup and learning. The amount of time available for subjects in the high time-pressure condition was made dependent on the actual amount of time used by decision-makers working under low time-pressure. Subjects in high time-pressure groups received 75% of the median of the amounts of actual decision-making time of the decision-makers in the respective low time-pressure group. A manipulation check was conducted by means of a perceived time-pressure (PTIPR)-scale (see Appendix C). ANOVA showed that the time- pressure manipulation was successful ( F = 16.96, p < 0.001). Subjects in the high time-pressure condi- tions perceived more time-pressure than subjects in the low time-pressure conditions.
4. Results
For each of the four dependent variables (market- share, number of simulations, decision-confidence, and perceived usefulness), we analyzed the effects of the quality of the MDSS, time-pressure and the interaction between these two factors. To test the effects over the four periods (the game-period num- ber will be denoted as PERI), we employed a re-
peated-measures ANOVA design (Winer, 1971). The form of this general model for each of the four dependent variables was:
SHARE SIMUL CONFIDENCE USEFUL
= / x + c~IQUALITY + c~2TIPR
+ c%PERI + cqQUALITY
* TIPR + c~sQUALITY
* PERI + c~rTIPR * PERI
+ a7 QUALITY * TIPR * PERI + ~ .
A single MANOVA could not be not conducted since not all dependent variables were measured for all subjects in all of the four periods. Therefore, four separate ANOVAs were conducted. The results of these ANOVAs are presented in Table 1 and will be described in the remainder of this section. When significant effects were found, separate comparison tests were performed to detect between which levels of the variables these differences existed.
4.1. Market-share (Hypotheses H.la and H.2a)
The results for SHARE are presented in Table 2. A significant difference in SHARE resulted for the three levels of QUALITY ( F = 13.36, p < 0.001). 3 Separate comparison tests showed that marketing
3 All significance levels presented in this paper are two-tailed. For the interpretation of the p-values of the separate comparisons between the three levels of the QUALITY variable we took the Bonferroni Inequality (Stevens, 1986) into account. This means that more conservative critical values ((overall a ) / 3 ) were used.

338 G.H. van Bruggen et al. / Intern. J. of Research in Marketing 13 (1996) 331-343
Table 2 Mean market shares (in percentages) for the six experimental groups in the four periods and averaged over the four periods (at bottom of cells) a
Marketing decision Time-pressure
support system Low High
No MDSS (control group) Group 1 Group 2
1. 17.42 1. 17.15 (2.28) (1.99)
2. 17.49 2. 16.54 (3.76) (3.07)
3. 19.30 3. 17.65 (5.61) (4.48)
4. 21.70 4. 20.30 (6.83) (4.84)
18.98 17.91 (4.09) (3.22)
5.54, p = 0.021). These results support hypothesis H.la.
Overall, marketing decision-makers performed worse under high time-pressure than under low time-pressure ( F = 6.23, p = 0.014). However, there was no significant interaction effect between QUAL- ITY and TIPR ( F = 1.77, p = 0.175). This means that the QUALITY-effect does not differ for the two different time-pressure conditions. Therefore, hy- pothesis H.2a cannot be accepted.
4.2. Number of simulations (Hypotheses Hl.b and H2.b)
The results for SIMUL are presented in Table 3. No main effect of QUALITY shows up (F = 0.32,
MDSS (medium-quality) Group 3 Group 4
1. 21.73 1. 20.19 (4.24) (4.47)
2. 9.69 2. 19.05 (5.91) (5.65)
3. 20.98 3. 20.14 (6.98) (6.73)
4. 22.84 4. 22.25 (6.23) (6.60)
21.31 20.41 (5.03) (5.34)
MDSS (high-quality) Group 5 Group 6
1. 24.69 1. 21.42 (3.29) (3.90)
2. 25.40 2. 19.35 (5.60) (5.36)
3. 25.62 3. 21.10 (6.93) (6.31)
4. 28.13 4. 24.56 (7.45) (7.81)
25.96 21.61 (4.85) (4.90)
a Standard deviations in parentheses. Each group: n = 20.
decision-makers using the high-quality MDSS out- performed decision-makers using the medium-qual- ity MDSS ( F = 7.48, p =0.008) , while decision- makers using the medium-quality MDSS outperform the decision-makers not using an MDSS at all ( F =
Table 3 Mean number of simulations for the four experimental groups using an MDSS, in the four periods and averaged over the four periods (at bottom of cells) a
Marketing decision Time-pressure
support system Low High
MDSS (medium-quality) Group 3 Group 4
1. 23.1 1. 17.7 (20.6) (15.9)
2. 17.4 2. 10.2 (15.3) (7.4)
3. 18.5 3. 8.6 (12.1) (6.2)
4. 18.6 4 9.0 (12.2) (6.1)
19.4 11.4 (12.7) (7.4)
MDSS (high-quality) Group 5 Group 6
1. 17.6 1. 12.8 (12.4) (11.1)
2. 16.1 2. 10.0 (10.6) (7.6)
3. 23.3 3. 13.2 (13.7) (6.8)
4. 25.8 4. 14.0 (15.0) (8.2)
20.7 12.5 (10.7) (6.4)
Standard deviations in parentheses. Each group: n = 20.

G.H. van Bruggen et al. / Intern. J. of Research in Marketing 13 (1996) 331-343 339
Table 4 Mean decision-confidence for the six experimental groups, two measures and averaged value (at bottom of cells) ~
Marketing decision Time-pressure
support system Low High
No MDSS (control group) Group 1 Group 2
2. 2.O4 2. 1.88 (0.81) (0.76)
4. 2.42 4. 2.14 (0.63) (0.63)
2.23 2.01 (0.61) (0.70)
MDSS (medium-quality) Group 3 Group 4
2. 1.91 2. 1.69 (0.86) (1.05)
4. 2.13 4. 1.99 (0.78) (1.12)
2.02 1.84 (0.75) (0.98)
MDSS (high-quality) Group 5 Group 6
2. 1.84 2. 1.59 (0.81) (0.99)
4. 2.28 4. 2.16 (0.86) (O.89)
2.06 1.88 (0.70) (0.83)
Standard deviations in parentheses. Each group: n = 20. High scores stand for high decision-confidence.
p = 0.570). However, there was a significant interac- tion between QUALITY and PERI ( F = 7.82, p < 0.001). In period 1 the medium-quality MDSS was used more intensively than the high-quality MDSS. However, this difference was not significant ( F = 2.26, p = 0.137). In period 2 there was no difference ( F = 0.09, p = 0.771) in the use of the two systems while in the periods 3 and 4 the high-quality MDSS was used more intensively than the medium-quality MDSS (period 3, F = 3.47, p = 0.066; and period 4, F = 5.15, p = 0.026). Therefore, from period 3 on- wards, hypothesis H . lb is supported.
There was no interaction between QUALITY and TIPR, implying that the effect of QUALITY on SIMUL was not different for the two time-pressure
conditions ( F = 0.01, p = 0.968). Accordingly, hy- pothesis H.2b cannot be accepted. Overall, decision- makers made fewer simulations under high time- pressure than under low time-pressure ( F = 14.21, p < 0.001).
4.3. Decision-confidence (Hypotheses 11. lc and H.2c)
The results for CONFIDENCE are presented in Table 4. There was no significant difference in CONFIDENCE between the three levels of QUAL- ITY ( F = 0.68, p = 0.507). The results for users of both types of systems were not different even when compared to the unaided decision-makers. Overall, although CONFIDENCE increased between period 2 and period 4 ( F = 24.76, p < 0.001), this did not differ between the different QUALITY levels ( F = 1.00, p = 0.371). Therefore, hypothesis H. 1 c cannot be accepted.
Although the results in Table 4 show higher decision-confidence for experimental groups making decisions under low time-pressure than for decision- makers working under high time-pressure, this dif-
Table 5 Mean perceived usefulness of the MDSS for the four experimental groups using an MDSS. two measures and averaged value (at bottom of cells) ~
Marketing decision Time-pressure
support system Low High
MDSS (medium-quality) Group 3 Group 4
2. 3.89 2. 4.43 (0.84) (0.71)
4. 3.96 4. 4.41 (0.66) (0.72)
3.92 4.42 (0.73) (0.68)
MDDS (high quality) Group 5 Group 6
2. 4.20 2. 3.96 (0.59) (0.90)
4. 4.17 4. 4.01 (0.70) (0.96)
4.18 3.98 (0.61 ) (0.89)
Standard deviations in parentheses. Each group: n = 20.

340 G.H. l'an Bruggen et al. / Intern. J. of Research in Marketing 13 (1996) 331-343
5
4.8
4.6
4.4
4.2
4
3.8 I i m e d i u m high
Quality MDSS
Low T i m e - p r e s s u r e ' High T i m e - P r e s s u r e
Fig. 1. Perceived usefulness of the MDSS for subjects working under low time-pressure (n = 40) and subjects working under high time-pressure (n = 40).
ference was not significant ( F = 1.93, p = 0.167). This finding did not differ for the different QUAL- ITY levels ( F = 0 . 0 1 , p=0 .993 ) . Therefore, we cannot accept hypothesis H.2c.
4.4. Perceived usefulness (Hypotheses H.ld and H.2d)
Results in Table 5 showed no significant USE- FUL-difference as a result of quality differences of the MDSS ( F = 0.28, p = 0.600). Subjects per- ceived both systems as useful. The average score on the seven-point USEFUL scale was 5.22. Therefore, hypothesis H.ld cannot be accepted.
As to low and high time-pressure, there was no significant main effect of TIPR ( F = 0.80, p = 0.374). However, the results in Table 5 and Fig. 1 show an interaction between TIPR and QUALITY ( F = 4.49, p = 0.037). Under low time-pressure, de- cision-makers tended to perceive the high-quality MDSS as more useful than did those using the medium-quality MDSS although this difference was not significant ( F = 1.52, p = 0.225). However, un- der high time-pressure the medium-quality MDSS was perceived more useful ( F = 3.00, p = 0.091). Both findings mean H.2d cannot be accepted.
5. Discussion
In this paper we investigated the impact of the quality of MDSS. In Table 6 we summarize our findings.
We find that decision-makers using the high-qual-
ity MDSS outperform those using the medium-qual- ity MDSS, both for low and high time-pressure conditions. This implies that it pays to develop and
Table 6 Summary of findings
Hypotheses Results
Decision-makers using the high-qu- Accepted ality MDSS will outperform deci- sion-makers using the medium-qual- ity MDSS. Decision-makers using the medium-quality MDSS will out- perform the unaided decision- makers. Decision-makers using the high-qu- ality MDSS will use the system more intensively than decision- makers using the medium-quality MDSS. Decision-makers using the high-qu- ality MDSS will show more deci- sion-confidence than decision- makers using the medium-quality MDSS. Decision-makers using the medium-quality MDSS will show more decision-confidence than un- aided decision-makers. Decision-makers using the high-qu- ality MDSS will perceive their sys- tem as more useful than decision- makers using the medium-quality MDSS.
Under low time-pressure the differ- ence in performance between mar- keting decision-makers using the high-quality MDSS and marketing decision-makers using the medium- quality will be larger than under high time-pressure. Under low time-pressure the differ- ence in the intensity of use between the high-quality MDSS and the medium-quality MDSS will be larger than under high time-pressure. Under low time-pressure the differ- ence in decision-confidence between users of the high-quality MDSS and users of the medium-quality MDSS will be larger than under high time pressure. Under low time-pressure the differ- ence in perceived usefulness be- tween the high-quality MDSS and the medium-quality MDSS will be larger than under high time pressure.
H.la:
H. lb:
H. lc:
H.ld:
H.2a:
H.2b:
H.2c:
H.2d:
Accepted for pe- riod 3 and 4
Not accepted, no difference
Not accepted, de- pends on amount of time-pressure
Not accepted, no impact of time- pressure
Not accepted, no impact of time- pressure
Not accepted, no impact of time- pressure
Partially accepted

G.H. t'an Bruggen et aL / lntern. J. of Researc'h in Marketing 13 (1996) 331-343 341
use MDSS which show a predictive precision as high as possible, even for decision-makers who operate under high time-pressure. We expect that by using scanning technology more data with a higher quality can be collected and, as a consequence, this enables " . . . marketing scientists to develop and test models with much more precision than ever before" (Lilien, 1994, p. 13). This implies that the effectiveness of MDSS used in practice can also increase.
We find that the high-quality MDSS is used more intensively than the medium-quality MDSS, although it took some time before this difference appeared. One might question whether the observed better performance of the high-quality MDSS users should be attributed to quality of MDSS as such, or to the fact that the high-quality MDSS is used more fre- quently. The results show that only in period 3 and period 4 the users of the high-quality MDSS used their system more intensively (conducted more simu- lations) than users of the medium-quality MDSS. However, because the performance of the users of the high-quality MDSS was higher in all of the four periods, differences in the performance of the users of the two systems can not be explained completely by differences in the use of the system. At least for period 1 and period 2 the difference in performance must have been caused by the quality of the MDSS as such.
Although we did find the hypothesized rank-order in market-share performance corresponding with the QUALITY-levels, no differences in decision-confi- dence were found. Apparently, high performance does not necessarily lead to high confidence. A factor which in general may improve the CONFI- DENCE of subjects is more insight in the way the market reacts on marketing-mix variables. The MDSS in our study were 'black-box' systems, which did not provide the decision-makers with this kind of understanding.
Time-pressure for the decision-maker does affect the perceived usefulness of the systems. The medium-quality MDSS is perceived as more useful than the high-quality MDSS under high time-pres- sure (although performance is objectively worse). Under low time-pressure both systems are perceived as equally useful, whereas we expected the high-qu- ality MDSS would be more valued with more time. A possible explanation for this finding might be that
users of the medium-quality MDSS realize that it is very difficult to predict outcomes of marketing deci- sions, since they experience a deviation between predictions of their system and the actual results. When they also have to operate under high time- pressure, they are confronted with another source of uncertainty. Under these circumstances, subjects might attach more value to having an MDSS avail- able, even when it does not make perfect predictions.
The overall picture of our results shows that QUALITY has more impact on the objective vari- ables of decision-making performance than it has on the subjective variables. Mclntyre (1982) reported a similar finding when he found that models, which do increase the effectiveness of the decision, do not necessarily engender a better understanding of mar- ket response. Providing decision-makers with a deci- sion-aid, even if it increases effectiveness, does not automatically increase decision-confidence. Appar- ently, users do not easily recognize the quality of an MDSS. In future research it would be interesting to investigate whether systems which also provide deci- sion-makers with insight in the mechanisms through which their decisions work (e.g., a marketing knowl- edge-based system), do help decision-makers to be- come not only more effective but also more confi- dent.
As a consequence of the between-subjects design of our study, the subjects were confronted with only one level of decision support and thus did not have any reference-point. In future research it might be investigated whether in a within-subject research de- sign, in which one subject works with different levels of decision-support (a medium-quality MDSS and a high-quality MDSS), decision-makers do per- ceive systems which differ in quality as differentially useful. It would be interesting to see whether in such conditions subjects are able to detect quality-dif- ferences between MDSS.
The lack of effects on the subjective variables has implications for the diffusion of MDSS in compa- nies. Subjects do not seem to be able to recognize the quality of an MDSS as such. Decision-makers should be provided with information on the useful- ness of systems and the opportunities they offer for making better decisions. Wierenga and Oude Ophuis (1994) find communication to be important for the adoption of MDSS.
342 G.H. van Bruggen et aL / Intern. J. of Research in Marketing 13 (1996) 331-343
In future studies investigating the effects of MDSS it might be considered to start the experiment after all subjects have gained experience in the decision- making environment. This way, as an anonymous reviewer suggested, the confounding effect of the fact that by being given an MDSS subjects also get more information, might be avoided.
In our study we investigated the impact of the quality of MDSS on the quality of decisions made by individuals. Many complex decisions in organiza- tions are made by groups of people. In future re- search it would be interesting to study the impact of so-called Group DSS (DeSantis and Gailupe, 1985) and the effect of the quality of such a system on group marketing-decisions.
Finally, we raise the question of the generalizabil- ity of our findings. Three factors can threaten this generalizability. These are the characteristics of the research environment, of the subjects, and of the systems that were used. In this study we used the experimental laboratory approach. As an experimen- tal environment we used MARKSTRAT, which can be characterized as a complete and dynamic market- ing-mix decision environment. Research by Kinnear and Klammer (1987) shows that managers, working in diverse industries, believe that MARKSTRAT does reflect a real marketing environment.
In our experiment only business students partici- pated. Locke (1986) states that students and employ- ees appear to respond similarly to goals, feedback, incentives, participation, and so forth, perhaps be- cause the similarities among these subjects (such as in values) are more crucial than their differences. Therefore, we think that students can be used as 'surrogates' for managers in an experiment like the one we conducted, in particular since they are trained in solving marketing problems. A replication of the study with experienced decision-makers as subjects should make clear whether for experienced decision-makers the effects of the quality of an MDSS are different.
The two MDSS were realistic systems which could be applied in real-life settings. The data in the MDSS were typical marketing research data which are available from syndicated marketing research companies. The models were standard econometric models. MDSS (van Campen et al., 1991) have not been widely adopted in real-life situations yet. How-
ever, it is our belief that MDSS, like the ones studied here, will be developed for real-life settings too if the worth of high-quality systems continues to be proven and publicized.
Acknowledgements
The authors are grateful to John Rossiter and two anonymous reviewers for their valuable comments.
Appendix A. Decision-Confidence items (mea- sured on a 'strongly disagree 1 - 2 - 3 - 4 - 5 strongly agree' scale)
Item 1. In my opinion, I defended my market share as
well as I could with the decisions I made 2. I have a great deal of confidence in the
decisions I made 3. I don't think it would have been possible to
make better decisions than the ones I made over this period
4. I have doubts about the correctness of the decisions I made
5. Given the circumstances, I made the best possible decisions
Cronbach alpha: 0.73
Appendix B. Perceived Usefulness items (mea- sured on a 'likely 1 - 2 - 3 - 4 - 5 - 6 - 7 unlikely' scale)
Item 1. Using the MDSS enabled me to make the
decisions more quickly 2. Using the MDSS increased the quality of my
decision-making 3. Using the MDSS increased my productivity 4. Using the MDSS enhanced my effectiveness 5. Using the MDSS made it easier to make the
decisions 6. I found the MDSS useful for making deci-
sions Cronbach alpha: 0.89

G.H. t,an Bruggen et a L / Intern. J. of Research in Marketing 13 (1996) 331-343 343
Appendix C. Perceived Time-Pressure items (measured on a 'strongly disagree 1 - 2 - 3 - 4 - 5 strongly agree' scale)
I tem
1. The availabil i ty o f more dec i s ion -mak ing t ime
would have made it poss ib le to make bet ter
dec i s ions
2. I felt rushed when playing M A R K S T R A T
3. There was insuff ic ient dec i s ion -mak ing t ime
to make acceptable dec i s ions
4. There was t ime-pressure
5. Whi le p lay ing M A R K S T R A T , I had suffi-
c ient t ime to make we l l - cons ide red dec i s ions
6. I had to hurry whi le p laying M A R K S T R A T
Cronbach alpha: 0.85
References
Aaker, D.A., 1992. Strategic market Management. New York: Wiley.
Adams, D.A., R.R. Nelson and P.A. Todd, 1992. Perceived usefulness, ease of use, and usage of information technology: A replication. MIS Quarterly (June), 227-247.
Bronner, R., 1973. Entscheidung unter Zeitdruck. T'tibingen: Pub- lisher?.
Chakravarti, D., A. Mitchell and R. Staelin, 1979. Judgment based marketing decision models: An experimental investigation of the decision calculus approach. Management Science 25 (3), 251-263.
Curren, M.T., V.S. Folkes and J.H. Steckel, 1992. Explanations for successful marketing decisions: The decision maker's per- spective. Journal of Marketing 56, 18-31.
Davis, F.D., 1989. Perceived usefulness, perceived ease of use, and user acceptance of information technology. MIS Quarterly (Sept.), 318-340.
DeSantis, G. and B. Gallupe, 1985. Group decision support systems: A new frontier. Data Base (Winter).
Deshpand& R. and G. Zaltman, 1982. Factors affecting the use of market research information: A path analysis. Journal of Mar- keting Research XIX (Feb.), 14-31.
Gatignon, H., 1987. Strategic studies in markstrat. Journal of Business Research 15, 469-480.
Glazer, R., J.H. Steckel and R.S. Winer, 1987. Group process and decision performance in a simulated marketing environment. Journal of Business Research 15, 545-557.
Glazer, R., J.H. Steckel and R.S. Winer, 1989. The formation of key marketing variable expectations and their impact on firm performance: Some experimental evidence. Marketing Science 8 (1)+ 18-34.
Glazer, R., J.H. Steckel and R,S. Winer, 1992. Locally rational decision making: The distracting effect of information on
managerial performance. Management Science 38 (2), 212- 226.
Glazer, R. and A.M. Weiss, 1993. Marketing in turbulent environ- ments: Decision processes and the time-sensitivity of informa- tion. Journal of Marketing Research XXX (Nov.), 509-521.
Hendrickson, A.R., P.D. Massey and T.P. Cronan, 1993. On the test-retest reliability of perceived usefulness and perceived ease of use scales. MIS Quarterly (June), 227-230.
Hogarth, R.M. and S. Makridakis, 1981. The value of decision making in a complex environment: An experimental approach. Management Science 27 (1), 93-107.
Kinnear, T.C. and S.K. Klammer, 1987. Management perspectives on Markstrat. Journal of Business Research 15, 491-501.
Larr6ch~, J.C. and H. Gatignon, 1990. MARKSTRAT2. Redwood City: The Scientific Press.
Lilien, G.L., 1994. Marketing models: Past, present and future. In: G. Laurent, G.L. Lilien and B. Pras (Eds.), Research traditions in marketing. Boston, MA: Kluwer Academic Publishers.
Lilien, G.L., P. Kotler and K.S. Moorthy, 1992. Marketing mod- els. Englewood Cliffs, NJ: Prentice Hall.
Locke, E.A., 1986. Generalizing from laboratory to field settings, Research findings from industrial-organizational psychology, organizational behavior, and human resource management. Lexington, MA: Lexington Books.
McIntyre, S.H., 1982. An experimental study of the impact of judgment-based marketing models. Management Science 28 (1), 17-33.
Montgomery, D.B. and G.L. Urban, 1969. Management science in marketing. Englewood Cliffs, NJ: Prentice Hall.
Naert, P. and P. Leeflang, 1978. Building implementable market- ing models. Leiden: Martinus Nijhoff.
Rothstein, H.G., 1986. The effects of time pressure on judgment in multiple cue probability learning. Organizational Behavior and Human Decision Processes 37, 83-92.
Stevens, J., 1986. Applied multivariate statistics for the social sciences. Hillsdale, NJ: Lawrence Erlbaum.
van Campen, P.A.F.M., K.R.E. Huizingh, P.A.M. Oude Ophuis and B. Wierenga, 1991. Marketing decision support systemen bij Nederlandse bedrijven. Delft: Eburon.
Wheelwright, S.C. and S. Makridakis, 1985. Forecasting methods for management, 4th edition. New York: Wiley.
Wierenga, B. and P. Oude Ophuis, 1994. Marketing decision support systems: Adoption, sophistication, use and satisfac- tion, Management report series, no. 181. Rotterdam School of Management, Erasmus University Rotterdam.
Winer, B.J., 1971. Statistical principles in experimental design. New York: McGraw-Hill.
Witkin, H.A., P.K. Oltman, E. Raskin and S.A. Karp, 1971. A manual for the embedded figures tests. Palo Alto, CA: Con- sulting Psychologists Press, Inc.
Wright, P., 1974. The harassed decision maker: Time pressure, distractions and the use of evidence. Journal of Applied Psy- chology 59 (5), 555-561.
Zinkhan, G.M., E.A. Joachimsthaler and T.C. Kinnear, 1987. Individual differences and marketing decision support system usage and satisfaction. Journal of Marketing Research XXIV, 208-214.