the impact of the saint lawrence valley on warm season precipitation distribution, 1979-2008
DESCRIPTION
The Impact of the Saint Lawrence Valley on Warm Season Precipitation Distribution, 1979-2008. Giselle C. Dookhie, John R. Gyakum, and Eyad H. Atallah Department of Atmospheric and Oceanic Sciences McGill University Montreal, QB. Purpose. - PowerPoint PPT PresentationTRANSCRIPT

The Impact of the Saint Lawrence Valley on Warm Season Precipitation
Distribution, 1979-2008
Giselle C. Dookhie, John R. Gyakum, and Eyad H. Atallah Department of Atmospheric and Oceanic Sciences
McGill UniversityMontreal, QB
11/5/2010 NROW XII

Purpose
1. To identify synoptic-scale flow associated with extreme precipitation
2. To examine mesoscale modulations by existing orography
11/5/2010 NROW XII
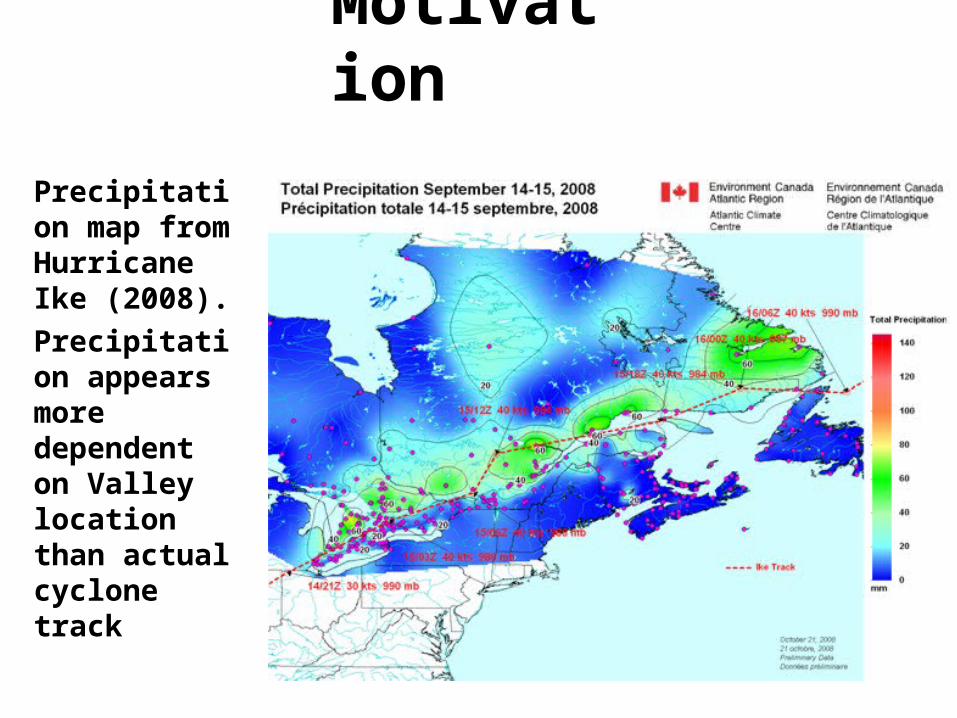
Precipitation map from Hurricane Ike (2008). Precipitation appears more dependent on Valley location than actual cyclone track
Motivation

11/5/2010 NROW XII
dpdp
dr
gma
s
1
P
-Fred Sanders
•P : Precipitation Rate•g : gravity•ω: vertical ascent•(drs/dp)ma: Saturation mixing ratio along a moist adiabat•p:pressure
Quantification of expected precipitation inspired by:
Data Environment Canada hourly surface observations
and 24hrly accumulated precipitation amounts at Montreal/Pierre Elliott Trudeau International Airport, Quebec (YUL) for the period 1979-2008
National Centers for Environmental Prediction (NCEP) North American Regional Reanalysis (NARR) and Global Reanalysis
National Oceanic and Atmospheric Administration (NOAA) National Hurricane Center (NHC) Best Track Data
11/5/2010 NROW XII

Methodology: Created a heavy precipitation dataset
11/5/2010 NROW XII
Calculated 90th Percentile
Threshold: 20mm
24hourly accumulated precipitation
Legend: Data-redProcess- Green Result- yellow

11/5/2010
Criteria for an event:
Hourly surface Obs.
Select the date with the heaviest 24hrly accumulated precipitation
CHECK: Are consecutive days related?
20mm in 1day or20mm in 2 consecutive days
Legend: Data-redProcess- Green Result- yellow
Step 1:
Step 2:

11/5/2010 NROW XII

Seasonality 221 precipitation
events (blue) Highest frequency of
precipitation events in August, with the highest frequency of hurricane events in September
11/12yrs that a tropical storm has an influence on a heavy precipitation event; hurricanes ranked within the top 2 events of each year11/5/2010 NROW XII

11/5/2010 NROW XII
Selected all cases of tropical storm influences over 30yr period regardless of intensity
Selected heaviest precipitation event for each year
Ranked heavy precipitation events within each year from largest-smallest
221 Events
45 Events

Composite Anomaly and Mean 500hPa Geopotential Height
11/5/2010 NROW XII
Source: the NOAA-ESRL Physical Sciences Division, Boulder Colorado from their Web site at http://www.esrl.noaa.gov/psd/

ZONAL FLOW CATEGORY: EXAMPLE OF PARTITIONING TECHNIQUE AND COMPOSITING
Methodology:
11/5/2010 NROW XII

11/5/2010NROW XII
…
…
•Partitioning 45 cases based on 500mb flow pattern•Below are sample individual cases of the heaviest precipitation day within the zonal flow category
Those averages are used to create a composite plot, for example: Zonal Flow category containing 8 individual cases
•Within the zonal flow category, the heaviest precipitation day of each individual case are averaged over a 24hour period

Zonal flow (n=8): Amplified flow(n=13):
11/5/2010 NROW XII
500hPa composite heights (m; contoured) and absolute vorticity (10-5 s-1; shaded) averaged over the event day with the heaviest precipitation
500hPa Height and Vorticity

MSLP and 1000-500hPa thickness
Zonal flow cases (8 individual cases): MSLP (solid) and 1000-500hPa thickness (dotted) Amplified flow cases (13 individual cases): MSLP
(solid) and 1000-500hPa thickness (dotted)
11/5/2010 NROW XII

250hPa Wind maxima (kts; contoured) representative of individual cases within each category
250hPa Wind Maxima Variability
Zonal flow (n=8): Amplified flow (n=13):
11/5/2010 NROW XII

11/5/2010 NROW XII
Amplified Flow Category
Zonal Flow Category

Precipitable water: Weighted climatology subtracted from composite precipitable water for each
case
11/5/2010 NROW XII
2
1
1 P
Pwdp
gPWTR
Where:•PWTR = precipitable water (kgm-2)•w(p) = mixing ratio at pressure p•Averaged over 1000hPa-300hPa
Amplified flow CategoryZonal flow Category

Total frontogenesis
Frontogenesis (10-1K 100km-13h-1): 975-900hPaAgeostrophic component Geostrophic component
11/5/2010 NROW XII
Zonal Flow Category
Amplified Flow Category

Mesoscale: Possible Impacts of the saint Lawrence valley
11/5/2010 NROW XII

11/5/2010 NROW XII

Conclusions Structural differences:
Baroclinicity Moisture supply O(1) from Gulf of Mexico and
Atlantic, for Zonal flow and Amplified flow category respectively
Mesoscale Influences: Frontogenesis along the axis of the Saint
Lawrence Valley Wind channeling (Northeasterly-Southwesterly)
11/5/2010 NROW XII

Continued Research
For each group:Composite analysis: Moisture
and InstabilityCase studies
11/5/2010 NROW XII

References• Atallah, Eyad H. and John R. Gyakum. The Impact of the Saint Lawrence Valley on the
Precipitation Distributions of Hurricanes Katrina and Rita. Nov. 2009. PowerPoint.• Carrera, M. L., J. R. Gyakum, and C. A. Lin, 2009: Observational study of wind channeling
within the St. Lawrence River Valley. Journal of Applied Meteorology and Climatology, 48, 2341-2361.
• Durnford, D. A., 2001-Thesis: An Analysis of Montreal’s Record-Breaking Heavy Rainfall Event of 8-9 November 1996, and a Comparison with its Best Analogue.
• Environment Canada Climate Data Online (http://www.climate.weatheroffice.gc.ca/climateData/canada_e.html)
• Fischer, A. P., 1998 –Thesis: A Synoptic Climatology of Montreal Precipitation.• Kalnay, E., and Coauthors, 1996: The NCEP/NCAR 40-Year Reanalysis Project. Bull. Amer.
Meteor. Soc., 77, 437–471.• Koch, S. E., M. DesJardins, and P. J. Kocin, 1983: An interactive Barnes objective map analysis
scheme for use with satellite and conventional data. J. Climate Appl. Meteor., 22, 1487–1503.• Milrad, Shawn. “Re: EPI equation?” E-mail to Giselle Dookhie. 28 Oct. 2010.• National Hurricane Center (NHC) best-track archive dataset (http://www.nhc.noaa.gov)
11/5/2010 NROW XII

ADDITIONAL SLIDE(S)
11/5/2010 NROW XII

11/5/2010 NROW XII
Alberta-Clipper Type Category (n=4)
500mb Trough West of Montreal Category (n=7)
500mbTrough over Montreal Category (n=13)