the impact of the security transaction taxes on … mckenna college the impact of the security...
TRANSCRIPT

Claremont CollegesScholarship @ Claremont
CMC Senior Theses CMC Student Scholarship
2013
The Impact of the Security Transaction Taxes onStock Prices and Stock Liquidity; Evidence fromthe NYSEVedika AgarwalClaremont McKenna College
This Open Access Senior Thesis is brought to you by Scholarship@Claremont. It has been accepted for inclusion in this collection by an authorizedadministrator. For more information, please contact [email protected].
Recommended CitationAgarwal, Vedika, "The Impact of the Security Transaction Taxes on Stock Prices and Stock Liquidity; Evidence from the NYSE"(2013). CMC Senior Theses. Paper 651.http://scholarship.claremont.edu/cmc_theses/651

CLAREMONT McKENNA COLLEGE
THE IMPACT OF THE SECURITY TRANSACTION TAXES ON STOCK
PRICES AND STOCK LIQUIDITY; EVIDENCE FROM THE NYSE
SUBMITTED TO
PROFESSOR ERIC HUGHSON
AND
DEAN GREGORY HESS
BY
VEDIKA AGARWAL
FOR
SENIOR THESIS
SPRING, 2013
APRIL 29th,
2013

1

2
Acknowledgements
I would like to take this opportunity to thank everyone who has helped in their own way
for this thesis project. I want to start by thanking my family, especially my parents and
my grandmother for their exceptional trust and faith in me. Without their hard work I
would not be at Claremont McKenna College. I would like to thank my economic
professors for their teachings. Without the knowledge they imparted, I would not be able
to understand many concepts used in this paper. Finally I would like to thank my reader,
Professor Eric Hughson. His guidance, support and encouragement helped me from the
start to the finish of this project. He was always more than willing to discuss and answer
my questions and queries on the thesis topic. His insights and suggestions go a long way
to make this thesis possible.

3
Abstract
Security Transaction taxes have been in place in many countries for many years now. Yet
we do not fully know how these taxes effect prices, volumes, bid-ask spreads and
volatility and in turn if they are good for the economy or not. This paper is an attempt to
understand how security transaction taxes decrease volume of trading, decrease prices of
stocks and increase bid-ask spreads. It analyses the effect the STTs implemented by the
state and federal government in New York on June 1st 1905 and December 1
st 1914
respectively, had on the stocks of the New York Stock Exchange. These results will help
us analyze whether future implementations of STTs will harm or benefit the market.

4
Table of Contents
I. Introduction……………………………………………………………..........1
II. Literature Review…………………………………………………………….3
III. Model………………………………………………………………………..13
IV. Data………………………………………………………………………….17
V. Results……………………………………………………………………….30
VI. Discussion of Results………………………………………………………..32
VII. Conclusion…………………………………………………………………...34
VIII. References…………………………………………………………………...35

1
I. Introduction
Security Transaction Taxes (STTs) are attracting a lot of interest today. This is
because some of the member states of the European Union are implementing STTs in
2014. Moreover the United States of America has also seen many proposals for
implementation of STTs. The reason countries in general want to implement STTs, is
because it is a good source of revenue. The governments of these countries have a budget
deficit from bailing out insolvent financial organizations as a result of the financial crisis
of 2007-2009. The government feels that because the financial industry is partly
responsible for the crisis, it should pay their dues by bearing the cost of STTs. However,
because there is uncertainty about the effects these taxes have on the economy,
governments are hesitant in implementing these taxes.
Even though there is a dearth of evidence on the effects of these taxes, there have
been some theoretical and empirical studies in this field. Fortunately, historically we have
a natural experiment which can help us study the effects of STTs. In 1905 the state of
New York implemented a state STT of 2 basis points per 100$ of par value. In 1914 the
US government implemented a federal tax of 2 basis points per 100$ of par value. This
raised the total STT in New York to 4 basis points per 100$ of par value in 1914. This
paper uses this natural financial experiment to analyze the effect of STT on the economy.
This paper looks specifically at the effect the STT imposed on 1st June 1905 and
1st December 1914 in New York City, has on volume, prices and bid- ask spreads. It
looks at the monthly change in volume, price, bid-ask spread and bid-ask percent to see
the direction these variables change in because of the tax. It also calculates whether these
changes are statistically significant.

2
After analyzing the above observations it was found that price and bid-ask spreads
move in the opposite direction as proposed in the hypothesis. The paper hypothesis that
volumes and prices should decrease, while bid-ask spreads should increase as a result of
STTs. However, analysis of the experiment shows that price tends to increase when it
should decrease, while bid-ask spreads tend to decrease when it should increase.
Moreover, these changes are not statistically significant. Volume is seen to mostly
decrease. This agrees with the proposed hypothesis. There are some statistically
significant changes in volume, price and bid-ask spreads that take place months before
and after the implementation of the tax. In general there is no specific trend seen after the
implementation of the tax, with prices and bid-ask spread being very volatile in the
months before and after the tax.
The following section of this paper is section II on the Literature Review. It looks
at the background of STTs and recent news about their implementation in the European
Union. This section also looks into the history of STTs in United States of America and
elaborates some existing theoretical and empirical work on the effects of STTs on the
economy. Section III lays down the hypothesis and the reasons for these claims. It then
talks about the model used for the experiment. Section IV describes the data and
methodology. Section V contains the results while section VI discusses the meaning of
these results. Section VII lays down the conclusion.
3
II. Literature Review
Securities Transaction tax, is a tax imposed on the purchase and sale of securities.
This tax could apply to stocks, bonds, derivative instruments, mutual funds, exchange-
traded funds (ETFs) and other securities. Sometimes STTs can be specific and apply to
transaction involving certain securities like stocks and derivatives but not bonds and
mutual funds. Other times STTs can be specific in terms of the type of traders it applies
to. It can apply to all traders, or be limited to institutional traders while not including
individual traders. This tax has been around for a long time and has been implemented in
many countries. Currently at least 29 countries-including Australia, Brazil, China,
France, Hong Kong, India, Ireland, Japan, Russia, South Korea, Switzerland, Taiwan and
the United Kingdom - have some form of STT.
The most recent news in the field of STTs is about the European Union Financial
transaction tax (EU FTT). A proposal by the European commission, will introduce FTT
within some EU member states by 2014. This proposal imposes a 0.1% tax on equity and
bonds and a 0.01% tax on derivative transactions. It is said that this tax has the capability
to raise 57 billion Euros per year. It is implemented to make the financial sector pay for
the bailouts it received during the crisis. However, this tax has been very controversial
with the proposal failing to get unanimous support for an EU wide implementation of
FTTs in October 2012. The European Commission allowed the use of enhanced co-
operation1 to implement tax in those EU member states that wanted to do so. This
proposal supported by eleven EU members including France, Germany, Italy, Austria,
1 A procedure which allows a minimum of nine EU member states to implement advanced integration or
cooperation, without involving the other EU members as long as the majority of EU’s 27 countries give
their permission. This is also used for divorce and patents in EU.

4
Belgium, Estonia, Greece, Italy, Portugal, Slovakia and Spain was approved by the
European Parliament in December 2012 and the Council of the European Union in
January 2013 (Economist article- Europe’s financial-transaction tax- 23rd
February 2013)
People have different opinions about the EU FTT. Banks and businesses in
Europe are worried that the FTT will drive share, currency and derivative trading out of
Europe. This tax which is implemented by only eleven of the EU member states might
have a negative impact on the whole of Europe. To partially mitigate this risk, the EU
commission proposes to tax transaction based on issuance and residency. People are also
worried that because the tax is not implemented all over Europe it might drive trading to
member states outside the eleven EU member states involved. UK already imposes a
stamp tax on its traders since 1694 and maybe this FTT will help improve trading in UK.
Sweden levied a FTT in the 1980’s which led to 60% of its trading volume moving to
London. This tax was repealed in 1991. Being a firsthand witness to the movement of
stock market trade outside its country, Sweden cautioned against the implementation of
the EU FTT. Moreover, it is said that this tax may have a global effect also. Many
countries including USA buy and sell stocks and bonds in European markets and engage
in business with European banks. Many people think that the best solution to this
problem is a global STT. (The Guardian: EU approves financial transaction tax for 11
eurozone countries-22nd
January 2013)
STT have been around for a long time. The oldest FTT that is still in existence is
the stamp duty put on the London stock exchange in 1694. During 1694, stamp duty was
a tax paid on instruments like written documents which were given a physical stamp.
During the 18th
and 19th
century this tax extended to many more items like newspaper,

5
playing cards, hats etc. The money collected would go to the government directly. In the
recent years the number of goods this stamp tax covers has decreased a lot. In 1986 stamp
duty reserve tax was imposed on shares and other securities. On 1st December 2003
stamp duty was mostly abolished apart from duty on shares and securities. Stamp duty
land tax was introduced on the same day on land transactions
Today, the stamp tax in UK is 50 basis points or 0.5%. This tax has caused
trading in UK to move to securities that are not taxed. So while trades in equities have
decreased, trading in options and derivatives (that are not taxed) have increased. Rather
than trading stocks of firms listed on the London Stock Exchange, investors are trading
American Depositary Receipt2s (ADRs). Moreover investors are using Contracts for
Differences 3(CFDs) to avoid transaction tax (Investment company institute-STT)
United States of America has also implemented STTs in the past. The state of
New York imposed a STT in 1905, to help generate money to ease the state deficit. In the
next eight decades the tax was revised approximately nine times with prices moving up
and down. In 1932 the tax which was initially 2 cents on 100$ par value was doubled
(because of the effects of the Great Depression). In March 1933 firms lowered their par
value to less than $10 from $100, reducing tax paid by a lot. As a result, in June 1933 the
tax was changed to per share rather than per $100 par value. In 1966, John V. Lindsay-
the mayor of New York City- raised the tax by 25%. The immediate effect was the NYSE
threatening to move across the Hudson River to New Jersey. In the late 1970’s the tax
started to phase out and was completely phased out in 1981. Till today, the state of New
2 Securities of non-US companies that are traded on US financial markets
3 Contract between a buyer and a seller stating, that the seller will pay to the buyer the difference between
the current value of the asset and its value at the time of transaction. If this difference is negative the buyer
pays the seller

6
York collects STTs which accounts to billions of dollars but returns it to the traders
immediately (New York Times- In Wall St. Tax, a Simple Idea but Unintended
Consequences- 26th
February 2013).
The introduction of this tax reduced the profits of traders and hence they traded
more in an attempt to earn back their lost profits. As a result in the first month under this
tax, the turnover rate in the New York Stock Exchange jumped from an already high
191% in 1905 to 244% in 1905 and 240% in 1906. Shares were changing hands once
every twenty weeks (Wall Street Journal-Why a Financial-Transaction Tax Could
Backfire-13th
December 2011)
NYC state tax 1905-1981 4
Date Year Tax (dollar/ dollar of par value) Information
June 1st 1905 $0.02
two cents per $100 of par value on
stocks traded, transferred or delivered
in NY state
March 1st 1932 $0.04
four cents on $100 par value of stock
transferred in NY state on round lots.
Tax doubled, one of the reasons
can be the after effects of the great
recession (1929-32)
P<$5 $5<P<$10 $10<P<$20 $20<P
June 2nd 1933 $0.030 $0.040 changed to per share basis
July 1st 1945 $0.010 $0.020 $0.030 $0.040 reduced for stock less than $10
July 1st 1966 $0.013 $0.025 $0.038 $0.050
25% increase. NYSE threatened to
move outside NY to evade tax.
October 1st 1968 $0.013 $0.025 $0.038 $0.050
An amendment was made which
capped the max tax on one trade at
$350
August 1st 1975 $0.016 $0.031 $0.047 $0.063 25 % surcharge
August 1st 1978 $0.013 $0.025 $0.038 $0.050 25 % surcharge expires
October 1st 1979 $0.009 $0.002 $0.026 $0.035 after 30% rebate
October 1st 1980 $0.005 $0.010 $0.015 $0.020 after 60% rebate
October 1st 1981 $0.000 $0.000 $0.000 $0.000 after 100% rebate
4 Taken from: Pomeranets Anna and Daniel Weaver. “Security Transaction Taxes and Market Quality”

7
After World War I, Civil War and Spanish-American War, the federal
government of USA was not in a very good financial condition. To help share the
financial burden, the federal government imposed a STT of 2 basis points per 100$ of par
value from 1914-1965. It was increased to a range between 4 to 6 basis points from 1932
through 1941. The tax was repealed in 1965. In 1966 the calculated STT was 0.1% on
security issuance and 0.04% on transfer.
Currently the Securities and Exchange Commission (SEC) imposes a tax of 0.224
basis points on stock transaction under the “Section 31 fee”. The proceeds from this STT
are used to fund the agency.
Federal tax 1914-19665
Date Year
Tax (dollar/ dollar of
par value) Information
P <$20 P >$20
December 1st 1914 $0.020
two cents per $100 of par value to help pay for
the cost of US involvement in WWI
September 1916 $0.000 tax was repealed
December 1917 $0.020 Reinstated
June 21st 1932 $0.040 $0.050
stocks without par value where taxed on a per
share basis
September 20th
1941 $0.050 $0.060 tax increased
January 1966 $0.000 $0.000 after 100% rebate
Except for the presence of the small STT by the SEC, the US government has not
implemented STTs for a long time now. However, recently a number of proposals to
implement STTs have been proposed in the 112th
United States Congress. H.R 3313, H.R
3638, H.R 5727, S.1787 and S. 2252 are proposals that want to impose a three-basis-
point fee on non-consumer transactions involving stocks, bonds, futures, options swaps
and credit default swaps. H.R. 1125 is another proposal that wants to impose a 1%
5 Taken from: Pomeranets Anna and Daniel Weaver. “Security Transaction Taxes and Market Quality”

8
transaction fee on all transactions in the economy not only security transactions. The
objective of these proposals is to eliminate national debt and individual income tax.
H.R 3313 is one of the more famous proposals. It was introduced in the House of
Representatives by Representative Peter DeFazio and Senator Tom Harkin on November
2nd
, 2011. This proposal is called “Wall Street Trading and Speculators Tax Act” and
asked for a tax of 3 basis points on the purchase of a security. This is more than 10 times
the tax that the SEC charges currently. This tax applies to stocks, notes, bonds,
debentures, derivatives-options, futures and swaps. It exempts initial issuance, securities
lending and debt with a fixed maturity of 100 days or less. In case of stocks, partnership
interests and debt, the base for this tax is the fair market value of these securities. While
in the case of derivatives, the base of this tax is the cash flow generated by the contracts.
There have been many debates on the effect that this tax will have. Some people believe
that this proposal like any other STT would hurt the financial markets. The tax could
reduce volume and liquidity resulting in wider bid-ask spreads. This would also increase
taxes on middle-class investors, depress the value of the financial asset and increase
hedging costs.
This is where the study of the STTs on the NYSE in 1905 and 1914 can be useful.
Understanding the effects the 1905 and 1914 STTs had on the NYSE can help forecast
the impact the new STT might have on the US financial markets. There are some
differences between the proposed DeFazio-Harkin tax and the STTs of 1905 and 1914.
The former applies to a wider range of securities while the latter applied only to stock
transfers. From 1914 to 1958 the latter tax applied to the par value of the stock while the
new STT will apply to the market value of the stock. A stocks par value is usually less
9
than its market value. It was only in 1959 that the older STTs applied to the stocks market
value and became more comparable to the DeFazio/Harkin tax. Transaction costs have
decreased a lot since 1965. Hence a STT of this magnitude would have a far greater
impact proportionally on investments today than it had in 1914. Moreover, algorithmic
trading6 which is present today was not in existence 1905. Algorithmic traders provide
liquidity which could counteract the decreasing effect STTs have on liquidity.
The effect of STTs on the economy is being debated since 1987. This is because
we are not sure how these taxes effect price, volume, bid-ask spreads and volatility.
While some argue that STT will improve the economy, others are against it, and think it
might harm the economy. The following paragraphs state the arguments and conclusions
of a few theoretical and empirical papers on the effect of STTs on the economy,
particularly its effect on volume, price, bid-ask spread and volatility.
The papers by Stiglitz (1989) and Summers and Summers (1989) consider STTs
of a lower rate between 0.5-1% and 0.5% of the value of the transactions respectively.
They both agree that this kind of STT can be beneficial to the economy. While both of
them say that STTs will discourage speculative trading leading to a reduction in
volatility, Stiglitz (1989) also mentions that STTs will not lead to an increase in spreads.
Schwert and Seguin (1993) slightly disagree with them and say that while STTs may not
affect volatility, they can increase bid-ask spreads. Moreover they say that STTs reduce
volume and prices.
The papers by Stiglitz (1989) and Summers and Summers (1989) state that STTs
mainly affect those who buy and sell in the same day, or with a few days or weeks. These
6 When trading orders are entered using an algorithm by electronic platforms. These algorithms are pre-
programmed trading instructions and may initiate the order without human interaction.

10
kinds of transactions are generally carried by noise traders. Because STTs mainly reduce
the activity of speculators, price volatility deceases. STTs hardly affect those people who
have long term investments. If the proportion of investors that invest in long term assets
increase, firms will need to shift their attention from short term to long term investments.
This reorientation of managerial focus because of STTs can help the economy. Schwert
and Seguin (1993) seem to have a different view on the effect of STTs on volatility. They
say that STTs may not necessarily lead to a decrease in volatility. According to Schwert
and Seguin (1993), STTs may not reduce price volatility because STT affects all traders
equally. Hence it will reduce the activities of price-stabilizing, liquidity providing
informed traders as well as the activities of noise traders. It is not very clear whether
STT will have a greater effect on price-stabilizing or price de-stabilizing traders. Because
of this uncertainty, the upward or downward movement in price volatility is also
uncertain.
Stiglitz (1989) says that STTs may not have an effect on bid-ask spreads and
hence may not lead to larger spreads. He says that STT may discourage some buyers and
sellers from trading. If this effect is symmetric, it will lead to thinner markets. Because in
thinner markets, it takes a longer time for a buyer to be matched to a seller, the market
maker needs to buy the security and hold it till the seller arrives. The market makers need
to be compensated for this function which includes the risk they bear and the capital
which is tied up. Hence a STT may increase the spreads. However, Stiglitz points out that
for stocks that are widely sold, market makers do not need to step in. Hence STTs may
not necessarily lead to larger spreads. Schwert and Seguin (1993) have a different view
about the effect of STTs on bid-ask spreads. They say that STTs will increase bid-ask

11
spreads. They believe that because the different components of the spread are increasing,
the spread increases as a whole.
Schwert and Sequin (1993) say that a tax on transaction will reduce prices. STTs
increase the total cost of transacting in the secondary market. Because required rates of
return are directly proportional to transacting costs, an increase in transacting cost will
increase the required rate of return. This would thus reduce the asset price. They also say
that more liquid and actively traded security would experience a larger drop in prices.
According to Schwert and Sequin (1993) STTs will lead to a decrease in volume.
This is because of three reasons. Firstly, STTs discourage trading. Secondly, this tax
would induce distortions. Short term trades need to be rolled over often, which may be
costly because of a STT. Hence traders might shift to long term assets. Both buyers and
sellers would reorganize the structure and quantities of assets they hold to reduce the
payment of taxes. Thirdly, in extreme circumstances the volume could fall to zero, if
trading moves to a different country.
According to Stiglitz (1989), STTs promotes economic efficiency. This is done
through the exchange and the capital-raising functions. Just as tariffs have a negative
effect on the exchange of goods; STTs impede the exchange of assets. However,
inefficiency in exchange is not that big. This is because first, the proposed taxes are
sufficiently small that the deadweight loss that is generated is negligible. Secondly, it is
very difficult to interpret the welfare loss associated with reduced trades based on
incorrect expectations. The second way that STTs promote market efficiency is by
making it easier for firms to raise money. Because STT reduce volatility, buyers of stocks
bear less risk concerning the selling price they will receive. Moreover, reducing volatility

12
also leads to better allocation of capital for firms. Firms issue more shares when their
share value is over-valued. This investment is not socially desirable because of
unreasonable expectations. Because STT reduce volatility the prices of stocks will not be
over-valued and hence firms will not make undesirable investments. Unlike Summers and
Summers (1989) and Stiglitz (1989), Schwert and Seguin say that STT will reduce
market efficiency by raising cost of trades that take advantage of asset mispricing. It also
leads to an increase in the cost of transacting by directly increasing transaction costs and
indirectly increasing bid-ask spreads. This could lead to more asset mispricing.
13
III. Model
This paper hypothesis that implementation of STTs will decrease volume,
decrease price and increase the bid-ask spreads. The following paragraphs give reasons
for these claims. The hypothesis relies on the logic that when spreads increase, volume
and price decrease. As said in Amihud and Mendelson (1986), the spread between the bid
and the ask price is a measure of illiquidity because it is the sum of the buying premium
and the selling concession. This spread is negatively related to liquidity. As the spread
increases, liquidity characteristics like trading volume, the number of shareholders and
the number of market makers trading the stock decrease. Because of this negative
relationship it makes sense to say that volume decrease as spreads increase. As spreads
increase, price of stocks are said to fall because according to Amihud and Mendelson
(1986) there is a positive relation between stock returns and illiquidity. When bid-ask
spreads increase, the liquidity decreases (as mentioned in the above paragraph). This
reduction in liquidity or increase in illiquidity increases the rate of returns, which reduce
the price of the asset. Therefore, if bid-ask spreads increase volume and prices will both
decrease
The bid-ask spread can be decomposed into three parts, order processing,
inventory risk and information asymmetry. Because the different components of the
spread are increasing, the spread increases as a whole (Schwert and Seguin, 1993). The
order processing cost/ clearing cost is the fixed cost the market-maker charges for trade
execution. As the volume decreases with the implementation of STT, the number of
transaction across which the fixed cost could be spread decreases. This leads to an
increase in the fixed cost. The inventory risk/ inventory carrying costs are the market

14
maker’s compensation for holding on to risky assets. Equity traders use derivatives to
hedge their risky assets. A tax of these securities will increase their cost on hedging.
Because the cost for hedging increases, the cost of inventory risk will also increase. The
information asymmetry represents the likelihood that a market maker is facing an
informed trader who had superior knowledge of the assets fundamental value. If it is
believed that STT reduces the activities of noise traders more than it reduces the activity
of informed traders, the probability of the market maker facing an informed trader
increases. This increases the information asymmetry element of the bid-ask spread. All
the elements of the bid-ask spreads increase with the issuance of STTs which leads to an
increase in the bid-ask spread.
Other reasons for the increase in bid-ask spread can be attributed to the reduction
in the activities of noise traders due to the implementation of STTs. Reduction in the
activities of noise traders leads to less market liquidity. Because markets are thinner (less
liquid) it is difficult for buyers and seller to get matched quickly and as a result the
market maker needs to hold on to the security. The market maker need to be compensated
for holding on to the asset because firstly, he is using his capital which he could have
invested elsewhere and secondly, holding on to a security is risky. This compensation to
market makers increase bid-ask spreads. A similar event is seen in 1914 with the
implementation of a federal tax of 2 basis points per 100$ par value. This increased the
total tax in New York to 4 basis point per 100$ par value (this is because the state tax of 2
basis points per 100$ par value was already present). This increase in STT, wiped out the
profits of floor traders and as a result the number of floor traders dropped from 200 to 50
(Meeker 1922). Floor traders are type of dealers who traded in the stock market for very
15
small and quick profits. They executed their own trade and hence did not need to pay
commission to a broker. The increase in STT reduced the liquidity in the markets because
the floor traders decreased significantly. This affected the specialists, who could execute
orders either for themselves or act as stock brokers. The specialist who acted as dealers
had the opportunity to buy more securities only to sell them at a slightly higher price
later. This is very similar to the job of market makers today. These specialists had to take
into account the STT and hence sold the securities for a higher price. As a result the bid-
ask spread increased.
For this study, I follow the methodology outlined below. I have monthly data on
volume, price, bid-ask spread and bid-ask percent for all the stocks in the NYSE for six
months before and after the implementation of the 1905 and 1914 taxes. I sort all the
stocks by month and then calculate the monthly average and monthly change in volume,
price and bid-ask spread. This is done first with all the observations. Then the data set is
refined for robustness. The same test is performed with all the data used in the first test
but after removing the outliers. The observations which are more than three standard
deviations away from the mean are removed to perform this test. Then the test is done
with stocks that have been checked for outliers as well as have data for all six months.
This removes almost half of the observations, because many stocks had data for only one
or two months rather than for all six months. After that, the test was done with stocks that
were checked for outliers, had data for six months as well as were present before and
after the tax. This led to the removal of more observations. There were many stocks that
had data for the six months before the tax but were not present after the tax or vice versa.
This is done to prevent stocks that were present for a short period of time but had extreme

16
values to affect the analysis. It also prevents stocks that were present before the tax but
not after the tax from skewing the results. Then I find t-statistics for the above tests to
understand which of these changes were significant.
I also calculate how many stocks increased or decreased after the implementation
of both the taxes. This was done using data only for one month before and after the tax.
These months included May 1905 and June 1905 for the June 1st 1905 tax and July 1914
and January 1915 for the December 1st 1914 tax. The data was cleaned to include only
those stocks that were present before and after each tax.

17
IV. Data
The data set used for the following tables includes monthly data for volume,
price, bid-ask spreads and bid-ask spread percentage for all the stocks on the NYSE for a
period of six months before and after the implementation of both the taxes. For the period
six months before and after the June 1st 1905 tax, I considered the months from
December 1904 to May 1905 and the months of June 1905 to November 1905
respectively. For the period six months before and after the December 1st 1914 tax, I
considered the months of February 1914 to July 1914 and the months of January 1915 to
June 1915 respectively. I do not look at data for the months of August 1914-December
1914 as the NYSE was closed because of the effects of World War I that started on July
31st 1914. The data set does not have volumes for all the stocks and so the analysis for the
change in volume due to the tax might be affected. This is alright because even though
the effect of STTs on price bid-ask spread and volatility is not known for sure. Most
people agree that STTs reduce volume.
The Terminology used in this paper is outlined below. The Price in the data set is
the average of the ask closing price and the bid closing price. The Bid-ask spread is the
difference between the ask closing price and the bid closing price. The bid-ask spread
percentage is the difference in the ask closing price and the bid closing price divided by
the price. The volume is the number of shares traded.
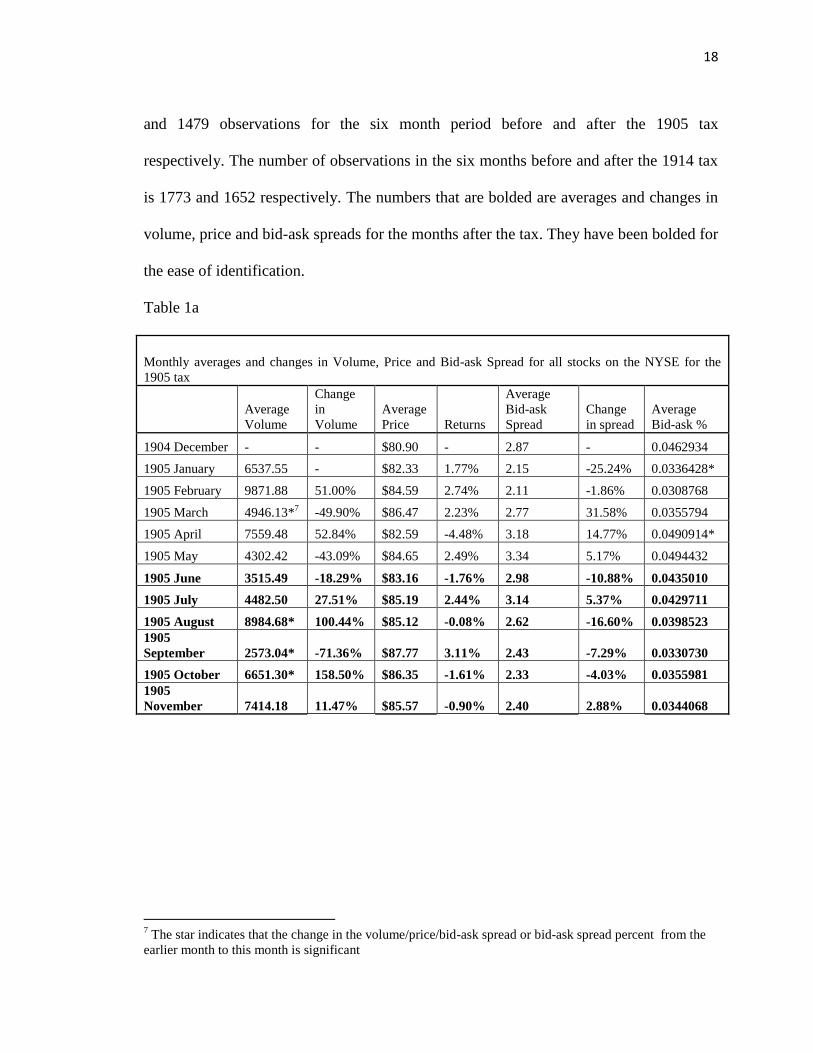
The following paragraphs talk about the tests performed to understand the change
in volume, price, bid-ask spread and bid-ask percent. For table 1a and 1b, data for six
months before and after the tax was used as it is, without deleting any stock. The monthly
average and change in volume, price and bid-ask spread was calculated. There are 1502
18
and 1479 observations for the six month period before and after the 1905 tax
respectively. The number of observations in the six months before and after the 1914 tax
is 1773 and 1652 respectively. The numbers that are bolded are averages and changes in
volume, price and bid-ask spreads for the months after the tax. They have been bolded for
the ease of identification.
Table 1a
Monthly averages and changes in Volume, Price and Bid-ask Spread for all stocks on the NYSE for the
1905 tax
Average
Volume
Change
in
Volume
Average
Price Returns
Average
Bid-ask
Spread
Change
in spread
Average
Bid-ask %
1904 December - - $80.90 - 2.87 - 0.0462934
1905 January 6537.55 - $82.33 1.77% 2.15 -25.24% 0.0336428*
1905 February 9871.88 51.00% $84.59 2.74% 2.11 -1.86% 0.0308768
1905 March 4946.13*7 -49.90% $86.47 2.23% 2.77 31.58% 0.0355794
1905 April 7559.48 52.84% $82.59 -4.48% 3.18 14.77% 0.0490914*
1905 May 4302.42 -43.09% $84.65 2.49% 3.34 5.17% 0.0494432
1905 June 3515.49 -18.29% $83.16 -1.76% 2.98 -10.88% 0.0435010
1905 July 4482.50 27.51% $85.19 2.44% 3.14 5.37% 0.0429711
1905 August 8984.68* 100.44% $85.12 -0.08% 2.62 -16.60% 0.0398523
1905
September 2573.04* -71.36% $87.77 3.11% 2.43 -7.29% 0.0330730
1905 October 6651.30* 158.50% $86.35 -1.61% 2.33 -4.03% 0.0355981
1905
November 7414.18 11.47% $85.57 -0.90% 2.40 2.88% 0.0344068
7 The star indicates that the change in the volume/price/bid-ask spread or bid-ask spread percent from the
earlier month to this month is significant

19
Table 1b
Monthly averages and changes in Volume, Price and Bid-ask Spread for all stocks on the NYSE for the
1914 tax
Average
Volume
Change
in
Volume
Average
Price
Return
%
Average
Bid-ask
Spread
Change
in spread
Average
Bid-ask %
1914 February - - $73.53 - 3.11 - 0.0639482
1914 March - - $72.46 -1.46% 2.93 -6.04% 0.0595775
1914 April - - $69.85 -3.60% 3.50 19.77% 0.0722078*
1914 May - - $70.98 1.62% 3.33 -5.01% 0.0689481
1914 June - - $72.03 1.48% 3.74 12.48% 0.0720647
1915 July - - $63.29* -12.13% 4.69 25.31% 0.0966773*
1915 January - - $64.39 1.73% 2.51* -46.42% 0.0739094*
1915 February - - $62.17 -3.45% 2.97 18.34% 0.0865452
1915 March - - $68.34 9.93% 2.29 -23.05% 0.0563669*
1915 April - - $74.80 9.45% 2.72 18.78% 0.0486937
1915 May - - $70.73 -5.44% 3.61* 32.86% 0.0756710*
1915 June - - $71.44 1.01% 3.06 -15.22% 0.0679748
Summary Statistics
Summary statistics for data 6 months before 1905 tax
Variable Obs Mean Std. Dev. Min Max
Volume 783 6753.347 20949.93 5 238600
Price 1502 83.56945 59.6422 0.875 392.25
Bid-ask spread 1502 2.71401 5.154977 0.025 64
Bid-ask spread % 1501 0.040663 0.063654 0.000705 0.470588
Summary statistics for data 6 months after 1905 tax
Variable Obs Mean Std. Dev. Min Max
Volume 798 5757.001 16359.96 5 182100
Price 1479 85.59051 60.49272 0.8125 475
Bid-ask spread 1479 2.639487 4.566945 0.125 57
Bid-ask spread % 1479 0.038083 0.058814 0.000579 0.433862

20
Summary statistics for data 6 months before 1914 tax
Variable Obs Mean Std. Dev. Min Max
Volume 0
Price 1773 70.65302 52.91788 0.625 490
Bid-ask spread 1773 3.53927 6.97017 0.125 85
Bid-ask spread % 1773 0.071958 0.099332 0.000593 0.5
Summary statistics for data 6 months after 1914 tax
Variable Obs Mean Std. Dev. Min Max
Volume 0
Price 1652 69.05782 52.59493 0.2955
423.7
5
Bid-ask spread 1652 2.885347 5.443673 0.029 80
Bid-ask spread % 1652 0.067996 0.097224 0.000764 0.5
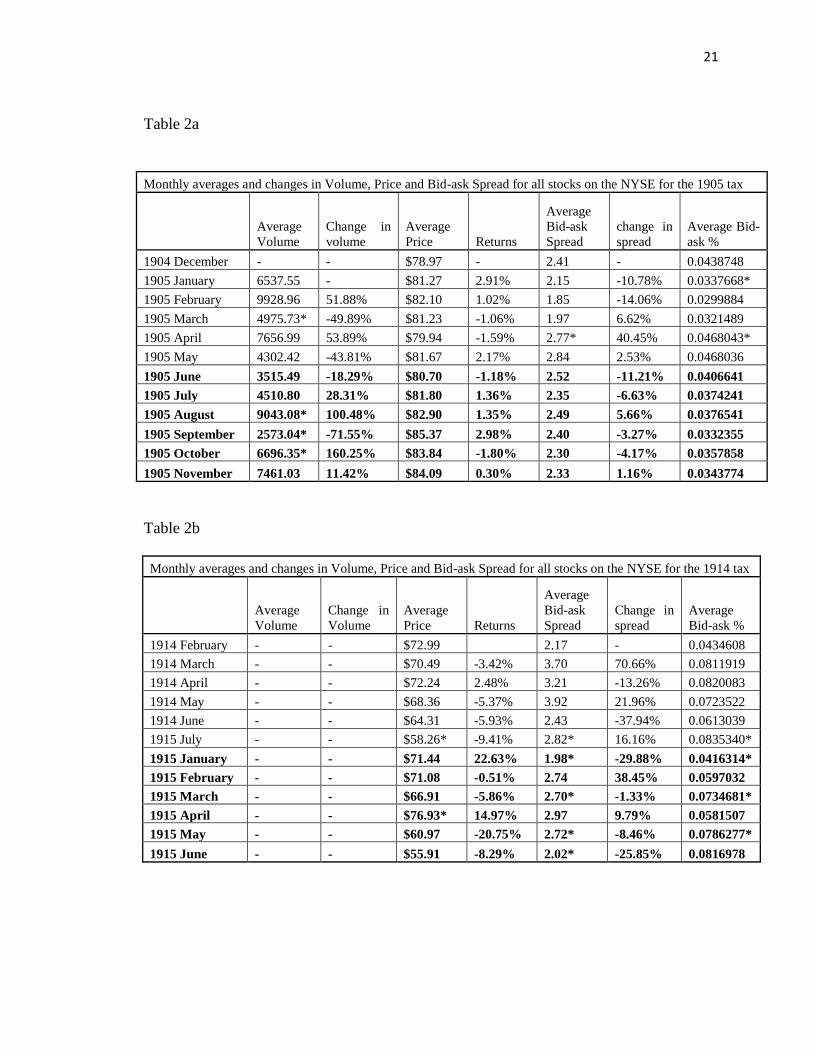
The data set used for this table removes the outliers that were present in the earlier
test. The number of observations removed six months before and after the 1905 tax are
24 and 19 respectively. While the number of observations removed before and after the
1914 tax is 22 and 18 respectively. The observations that were significantly three
standard deviations away from the mean were considered as outliers.
21
Table 2a
Table 2b
Monthly averages and changes in Volume, Price and Bid-ask Spread for all stocks on the NYSE for the 1914 tax
Average
Volume
Change in
Volume
Average
Price Returns
Average
Bid-ask
Spread
Change in
spread
Average
Bid-ask %
1914 February - - $72.99 2.17 - 0.0434608
1914 March - - $70.49 -3.42% 3.70 70.66% 0.0811919
1914 April - - $72.24 2.48% 3.21 -13.26% 0.0820083
1914 May - - $68.36 -5.37% 3.92 21.96% 0.0723522
1914 June - - $64.31 -5.93% 2.43 -37.94% 0.0613039
1915 July - - $58.26* -9.41% 2.82* 16.16% 0.0835340*
1915 January - - $71.44 22.63% 1.98* -29.88% 0.0416314*
1915 February - - $71.08 -0.51% 2.74 38.45% 0.0597032
1915 March - - $66.91 -5.86% 2.70* -1.33% 0.0734681*
1915 April - - $76.93* 14.97% 2.97 9.79% 0.0581507
1915 May - - $60.97 -20.75% 2.72* -8.46% 0.0786277*
1915 June - - $55.91 -8.29% 2.02* -25.85% 0.0816978
Monthly averages and changes in Volume, Price and Bid-ask Spread for all stocks on the NYSE for the 1905 tax
Average
Volume
Change in
volume
Average
Price Returns
Average
Bid-ask
Spread
change in
spread
Average Bid-
ask %
1904 December - - $78.97 - 2.41 - 0.0438748
1905 January 6537.55 - $81.27 2.91% 2.15 -10.78% 0.0337668*
1905 February 9928.96 51.88% $82.10 1.02% 1.85 -14.06% 0.0299884
1905 March 4975.73* -49.89% $81.23 -1.06% 1.97 6.62% 0.0321489
1905 April 7656.99 53.89% $79.94 -1.59% 2.77* 40.45% 0.0468043*
1905 May 4302.42 -43.81% $81.67 2.17% 2.84 2.53% 0.0468036
1905 June 3515.49 -18.29% $80.70 -1.18% 2.52 -11.21% 0.0406641
1905 July 4510.80 28.31% $81.80 1.36% 2.35 -6.63% 0.0374241
1905 August 9043.08* 100.48% $82.90 1.35% 2.49 5.66% 0.0376541
1905 September 2573.04* -71.55% $85.37 2.98% 2.40 -3.27% 0.0332355
1905 October 6696.35* 160.25% $83.84 -1.80% 2.30 -4.17% 0.0357858
1905 November 7461.03 11.42% $84.09 0.30% 2.33 1.16% 0.0343774

22
Summary statistics
Summary statistics for data 6 months before 1905 tax
Variable Obs Mean Std. Dev. Min Max
Volume 778 6786.916 21011.98 5 238600
Price 1478 80.88987 54.80004 0.875 290
Bid-ask spread 1478 2.329993 3.558681 0.025 27
Bid-ask spread % 1478 0.038834 0.059809 0.000705 0.470588
Summary statistics for data 6 months after 1905 tax
Variable Obs Mean Std. Dev. Min Max
Volume 794 5782.477 16397.19 5 182100
Price 1460 83.10933 54.4026 0.8125 282
Bid-ask spread 1460 2.398152 3.690835 0.125 25
Bid-ask spread % 1460 0.036638 0.055104 0.000579 0.433862
Summary statistics for data 6 months before 1914 tax
Variable Obs Mean Std. Dev. Min Max
Volume 0
Price 1751 67.97348 46.14568 0.625
287.
5
Bid-ask spread 1751 3.047473 4.315096 0.125 32
Bid-ask spread % 1751 0.070389 0.097443 0.000593 0.5
Summary statistics for data 6 months after 1914 tax
Variable Obs Mean Std. Dev. Min Max
Volume 0
Price 1634 66.70862 46.23191 0.2955 242
Bid-ask spread 1634 2.521936 3.551972 0.029 25
Bid-ask spread % 1634 0.066743 0.095804 0.000764 0.5
The data set used for this test is free from outliers and includes only those stocks
that have data for all six months before and after the tax. There are many stocks that did
not have data for all six months and hence a large number of observations had to be
deleted. From the data set used in the previous table, 662 and 704 observations were
deleted before and after the 1905 tax. 581 and 806 observations are deleted before and

23
after the 1914 tax. Almost half the data set is deleted because of stocks had missing
information for some months.
Table 3a
Monthly averages and changes in Volume, Price and Bid-ask Spread for all stocks on the NYSE for the
1905 tax
Average
Volume
Change in
volume
Average
Price Returns
Average
Bid-ask
Spread
change
in spread
Average
Bid-ask %
1904
December - - $79.85 - 2.00 - 0.0345559
1905 January 6237.69 - $81.18 1.68% 2.15 7.60% 0.0349499
1905 February 6731.92 7.92% $82.87 2.08% 1.62 -25.02% 0.0266443
1905 March 4295.79 -36.19% $83.48 0.74% 2.01 24.40% 0.0291666
1905 April 5017.20 16.79% $80.22 -3.91% 2.20 9.56% 0.0383824
1905 May 3260.15 -35.02% $79.90 -0.40% 2.72 23.62% 0.0470337
1905 June 3365.17 3.22% $82.79 3.62% 2.65 -2.57% 0.0410362
1905 July 4836.56 43.72% $83.36 0.69% 2.51 -5.34% 0.0372834
1905 August 8652.46 78.90% $85.97 3.13% 2.66 5.87% 0.0404236
1905
September 2655.25* -69.31% $86.83 1.01% 2.58 -3.01% 0.0360410
1905 October 6154.65* 131.79% $86.68 -0.18% 2.38 -7.50% 0.0353837
1905
November 8512.37 38.31% $86.82 0.16% 2.79 16.83% 0.0382900

24
Table 3b
Monthly averages and changes in Volume, Price and Bid-ask Spread for all stocks on the NYSE for the 1914
tax
Average
Volume
Change in
Volume
Average
Price Returns
Average
Bid-ask
Spread
Change
in spread
Average
Bid-ask %
1914 February - - $72.58 - 2.00 - 0.0397391
1914 March - - $71.88 -0.97% 2.10 4.71% 0.0418981
1914 April - - $69.53 -3.27% 2.48 18.33% 0.0511039
1914 May - - $71.32 2.57% 2.10 -15.37% 0.0477408
1914 June - - $70.33 -1.38% 2.38 13.09% 0.0483217
1915 July - - $63.47 -9.76% 3.75* 57.65% 0.0808949*
1915 January - - $60.80 -4.22% 1.65* -55.91% 0.0544427*
1915 February - - $60.11 -1.13% 1.79 8.64% 0.0630340
1915 March - - $63.05 4.89% 1.20* -33.20% 0.0351965*
1915 April - - $70.19 11.32% 1.85* 54.11% 0.0401926
1915 May - - $65.59 -6.55% 2.25 21.91% 0.0552950*
1915 June - - $66.91 2.01% 1.76 -21.81% 0.0455662
Summary statistics
Summary statistics for data 6 months before 1905 tax
Variable Obs Mean Std. Dev. Min Max
Volume 413 5225.167 12624.79 5 86000
Price 816 81.25005 52.58022 6.375 248.75
Bid-ask spread 816 2.118045 3.010067 0.125 24
Bid-ask spread % 816 0.035122 0.052789 0.000705 0.470588
Summary statistics for data 6 months after 1905 tax
Variable Obs Mean Std. Dev. Min Max
Volume 402 5819.724 14924.32 25 123100
Price 756 85.58334 56.85381 7.625 256
Bid-ask spread 756 2.595888 3.857173 0.125 25
Bid-ask spread % 756 0.037983 0.055585 0.000579 0.433862

25
Summary statistics for data 6 months before 1914 tax
Variable Obs Mean Std. Dev. Min Max
Volume 0
Price 1170 69.84519 45.95 0.6875 249.5
Bid-ask spread 1170 2.469658 3.609462 0.125 30
Bid-ask spread % 1170 0.051649 0.073754 0.000593 0.5
Summary statistics for data 6 months after 1914 tax
Variable Obs Mean Std. Dev. Min Max
Volume 0
Price 828 64.37262 45.29722 0.3125 238.5
Bid-ask spread 828 1.748412 2.649525 0.125 25
Bid-ask spread % 828 0.049038 0.079917 0.000764 0.5
The data set used for this table is checked for outliers. Moreover, only those
stocks that have data for all six months as well as those that are present before and after
the tax are taken into consideration. There were many stocks present only before or after
the tax and had to be removed. From the data set used in the previous table, 360 and 300
observations were deleted before and after the 1905 tax. 516 and 174 observations are
deleted before and after the 1914 tax.

26
Table 4a
Monthly averages and changes in Volume, Price and Bid-ask Spread for all stocks on the NYSE for the 1905 tax
Average
Volume
Change in
volume
Average
Price Returns
Average
Bid-ask
Spread
change in
spread
Average Bid-
ask %
1904 December - - 79.85 - 2.00 - 0.0345559
1905 January 6237.69 - 81.18 1.68% 2.15 7.60% 0.0349499
1905 February 6731.92 7.92% 82.87 2.08% 1.62 -25.02% 0.0266443
1905 March 4295.79 -36.19% 83.48 0.74% 2.01 24.40% 0.0291666
1905 April 5017.20 16.79% 80.22 -3.91% 2.20 9.56% 0.0383824
1905 May 3458.54 -31.07% 84.51 5.35% 3.11 41.01% 0.0552795
1905 June 2485.43 -28.14% 85.05 0.64% 2.66 -14.35% 0.0468204
1905 July 4032.28 62.24% 86.26 1.42% 2.43 -8.60% 0.0400240
1905 August 8652.46 78.90% 85.97 3.13% 2.66 5.87% 0.0404236
1905 September 2655.25 -69.31% 86.83 1.01% 2.58 -3.01% 0.0360410
1905 October 6154.65 131.79% 86.68 -0.18% 2.38 -7.50% 0.0353837
1905 November 8512.37 38.31% 86.82 0.16% 2.79 16.83% 0.0382900
Table 4b
Monthly averages and changes in Volume, Price and Bid-ask Spread for all stocks on the NYSE for the 1914
tax
Average
Volume
Change in
Volume
Average
Price Returns
Average
Bid-ask
Spread
Change in
spread
Average
Bid-ask %
1914 February - - $64.81 - 1.12 - 0.0289965
1914 March - - $64.73 -0.12% 1.38 22.57% 0.0338316
1914 April - - $62.44 -3.55% 1.53 11.25% 0.0360138
1914 May - - $63.94 2.41% 1.48 -3.52% 0.0406861
1914 June - - $62.97 -1.51% 1.60 8.54% 0.0378764
1915 July - - $55.62 -11.68% 2.38* 48.21% 0.0648861*
1915 January - - $60.24 8.31% 1.54* -35.14% 0.0523119
1915 February - - $59.46 -1.29% 1.57 1.71% 0.0554226*
1915 March - - $61.89 4.08% 1.05* -32.77% 0.0320926*
1915 April - - $68.41 10.54% 1.57 49.29% 0.0343515
1915 May - - $63.70 -6.89% 1.99 26.38% 0.0503484*
1915 June - - $65.01 2.06% 1.47 -25.85% 0.0420511

27
Summary statistics
Summary statistics for data 6 months before 1905 tax
Variable Obs Mean Std. Dev. Min Max
Volume 224 5948.518 14927.06 5 86000
Price 456 85.96116 58.47635 6.375 248.75
Bid-ask spread 456 2.344463 3.049527 0.125 24
Bid-ask spread % 456 0.040922 0.061624 0.000705 0.470588
Summary statistics for data 6 months after 1905 tax
Variable Obs Mean Std. Dev. Min Max
Volume 224 4729.772 13870.11 25 113000
Price 456 86.84641 58.0498 7.625 256
Bid-ask spread 456 2.644901 3.470108 0.125 20.5
Bid-ask spread % 456 0.043938 0.063439 0.000579 0.433862
Summary statistics for data 6 months before 1914 tax
Variable Obs Mean Std. Dev. Min Max
Volume 0
Price 654 62.4203 46.36545 1.5625 249.5
Bid-ask spread 654 1.58104 2.420615 0.125 20.5
Bid-ask spread % 654 0.040382 0.062874 0.000593 0.5
Summary statistics for data 6 months after 1914 tax
Variable Obs Mean Std. Dev. Min Max
Volume 0
Price 654 63.11829 46.12188 0.3125 238.5
Bid-ask spread 654 1.533219 2.419717 0.125 25
Bid-ask spread % 654 0.04443 0.074273 0.000764 0.5
The data set used for this table includes the observations for one month before and
after the 1905 and 1914 tax was used. This includes the months of May 1905 and June
1905 for the 1905 tax and the months of July 1914 and January 1915 for the 1914 tax.
Only stocks that are present both before and after the tax were taken into consideration

28
Table 5a
Number of stocks that increased or decreased in Volume, Price, Bid-ask spread and bid-ask spread percentage after the 1905 tax
Normal stocks (Total 124)
increase % increase decrease % decrease remained the same
% remained the same
lacking in data
Volume 18 - 33 - 7 - 66
Price 84 67.74% 29 23.39% 11 8.87% -
Bid-ask spread 47 37.90% 48 38.71% 29 23.39% -
Bid-ask spread % 50 40.32% 63 50.81% 11 8.87% -
Preferred stocks (Total 88)
Increase % increase Decrease % decrease Same % same lacking in data
Volume 13 - 11 3 61
Price 54 61.36% 26 29.55% 8 9.09% -
Bid-ask spread 32 36.36% 36 40.91% 20 22.73% -
Bid-ask spread % 33 37.50% 50 56.82% 5 5.68% -
Table 5b
Number of stocks that increased or decreased in Volume, Price, Bid-ask spread and bid-ask spread percentage
after the 1914 tax
Normal stocks (Total 126)
increase
%
increase decrease
%
decrease
remained
the same
%
remained
the same
lacking in
data
Volume - - - - - - -
Price 108 85.71% 16 12.70% 2 1.59% -
Bid-ask spread 39 30.95% 68 53.97% 19 15.08% -
Bid-ask spread % 41 32.54% 84 66.67% 1 0.79% -
Preferred stocks (Total 71)
Increase
%
increase Decrease
%
decrease Same % same
lacking in
data
Volume - - - - - - -
Price 52 73.24% 17 23.94% 2 2.82% -
Bid-ask spread 15 21.13% 51 71.83% 5 7.04% -
Bid-ask spread % 17 23.94% 54 76.06% 0 0.00% -

29
Summary Statistics
Summary statistics for the month of May 1905
Variable Obs Mean Std. Dev. Min Max
Volume 115 3414.23 8163.45 15.00 40900
Price 213 81.97 58.80852 0.88 382
Bid-ask spread 213 3.34 5.60387 0.13 40
Bid-ask spread % 213 0.05 0.072206 0.00 0.434783
Summary statistics for the month of June 1905
Variable Obs Mean Std. Dev. Min Max
Volume 105 3063.62 7472.497 10.00 41500
Price 213 82.98 58.80281 0.88 372.5
Bid-ask spread 213 3.03 5.423346 0.13 40
Bid-ask spread % 213 0.04 0.063672 0.00 0.394366
Summart stats for the month of July 1914
Variable Obs Mean Std. Dev. Min Max
Volume 0
Price 268 63.29128 47.61601 0.6875 287.5
Bid-ask spread 268 4.691698 8.153737 0.125 85
Bid-ask spread % 268 0.096677 0.113983 0.002413 0.5
Summart stats for the month of January 1915
Variable Obs Mean Std. Dev. Min Max
Volume 0
Price 243 64.38861 53.11323 0.2955 418.5
Bid-ask spread 243 2.513597 4.711778 0.029 61
Bid-ask spread % 243 0.073909 0.10466 0.001046 0.5

30
V. Results
Tables 1-4, calculate the monthly average and change in the volume, price, bid-
ask spread and bid-ask percentage. In table 1a there is a drop in volume, price, bid-ask
spread and bid-ask percent in the month after the implementation of the 1905 tax.
However, none of these changes are statistically significant. In table 1b there is an
increase in price and a decrease in bid-ask spread and bid-ask percent in the month after
the 1914 tax is implemented. While the increase in price is not statistically significant the
decrease in bid-ask spread and bid-ask percent is significant but in the opposite direction.
The hypothesis claims that the bid-ask spread should increase, but it is decreasing in this
case. The other changes that are statistically significant are months before or after the tax.
In table 2a there is a drop in volume, price, bid-ask spread and bid-ask percent in
the month after the implementation of the 1905 tax. These changes are very similar to the
changes seen in table 1a and are not statistically significant. In table 2b there is an
increase in price and a decrease in bid-ask spread and bid-ask percent in the month after
the 1914 tax is implemented. These changes are in the same direction as the change seen
in table 1b. However there seems to be a greater increase in the price and a weaker
decrease in bid-ask spread and bid-ask percent. While the increase in price is not
statistically significant the decrease in bid-ask spread and bid-ask percent is significant
but in the opposite direction. The other changes that are statistically significant are
months before or after the tax.
In table 3a there is an increase in volume and price and a decrease in bid-ask
spread and bid-ask percent in the month after the implementation of the 1905 tax. None
of these changes are significant. In table 3b there is a decrease in price, bid-ask spread

31
and bid-ask percent in the month after the 1914 tax is implemented. While the decrease in
price is not statistically significant the decrease in bid-ask spread and bid-ask percent is
significant but in the opposite direction. The other changes that are statistically
significant are months before or after the tax.
In table 4a there is decrease in volume, bid-ask spread and bid-ask percent while
the price increases slightly. None of these changes are significant. In table 4b the price
increases while the bid-ask spread and bid-ask percent decreases. The change in the price
and bid-ask percent is not significant, but the change in the bid-ask spread is. The other
changes that are statistically significant are months before or after the tax.
Section 5 shows the number of stocks that increase or decreased in volume, price,
bid-ask spread and bid-ask percent. In table 5a the price for 67.74% of the normal stocks
and 61.36% of the preferred stocks increase. The bid-ask spread for 38.71 % of the
normal stocks and 40.91% of the preferred stocks decrease. There is not a very large
difference in the number of stocks that increase or decrease for the bid-ask spread and
bid-ask percent. There are 33 normal stocks that decrease in volume while only 11
preferred stocks. 66 stocks have missing data, so it will not be very helpful to conclude
the change in volume looking at this table. In table 5b the price of 85.71% of the normal
stocks and 73.34% of the preferred stocks increase. The bid-ask spread for 53.97 % of the
normal stocks and 71.8% of the preferred stocks decrease. The bid-ask percent for
66.67% of the normal stocks and 76.06% of the preferred stocks decrease.

32
VI. Discussion of Results
Most of the above tests lead to a decrease in volume, bid-ask spread and bid-ask
percent and an increase in the price after the implementation of the tax. Only the change
in the volume moves in the direction claimed by the hypothesis. The price and the bid-ask
spread move in the opposite direction from the changes proposed in the hypothesis.
After the implementation of the 1905 the volume mostly decreases (except table
3a, where volume increases slightly). Even though the change in volume moves in the
direction proposed in the hypothesis, none of these changes were significant. This can be
due to the lack of data on volume for many stocks. The price decreases sometimes (table
1a and 2a) and increases sometimes (table 3a and 4a) after the implementation of the
1905 tax. However, the changes in price are very small and not statistically significant.
The bid-ask spread shows a more stable trend and decreases in all tests after the
implementation of the 1905 tax. This movement is in the opposite direction of the
proposed change in bid-ask spread. None of these changes are significant. The price and
bid-ask spread are very volatile and jump up and down even in the months were there
was no change in taxes.
After the implementation of the 1914 tax, the bid-ask spread and bid-ask percent
decrease (the bid-ask percent is not significant in 4b). This change seems to be significant
but in the opposite direction as proposed in the hypothesis. While the hypothesis claims
that the price should decrease, the price increases (in most of the tables except table 3b)
after the 1914 tax. None of these changes are significant. The data on volume for all the
stocks around 1914 and 1915 is missing. So, the analysis in the change in the volume
cannot be done. The price and bid-ask spreads are very volatile and jump up and down

33
even in the months were there was no tax change. The abnormal changes in the price and
the bid-ask spread can be attributed to the outbreak of World War I on 28th
July 1914,
four months before the implementation of the STT on 1st December 1914. World War I
also led to the closing down of the NYSE for four months. These events and the months
leading up to them were a period of uncertainty. This could be a reason for the high
volatility seen in the price and bid-ask spread.

34
VII. Conclusion
The effect of the tax of 1st December 1914 is not a very good indicator of the
effects of STTs in general. This is because WWI and the shutdown of NYSE were major
events that also occurred during that period, which could affect the volume, bid-ask
spread and price more than the STTs could. The implementation of the STT on June 1st
1905 is a much better date, to study the effects of the STT. However, it is seen that the
price and bid-ask spreads move around a lot in the months before and after the1905 tax
also. There were many changes in federal and state taxes till 1981, which could be good
experiments for studying the effects of STTs further.
The 1905 and 1914 taxes did not show a very stable trend, with the changes in
price and bid-ask spread not being big enough to be statistically significant. This may be
because the STT was very small. I think a small tax in the range of 0.5%-1% may not
affect prices and bid-ask spreads a lot. Hence it would be a good way to create revenue.
The tax in 1905 was 2 basis points per 100$ of par value, which comes to be 0.02%. The
tax in 1914 was another 2 basis points per 100$ of par value which increased the total tax
in New York to 4 basis points per 100$ of par value. This accounts to 0.04% which is still
smaller than 1%. Studying STTs which are 1% or greater can give a more definite change
in price and bid-ask spreads. These studies could give a better answer to the question,
“Do STTs help or harm the economy?”

35
References
Amihud, Yakov and Haim Mendelson. “Asset Pricing and the Bid-Ask Spread.” Journal
of Financial Economics 17 (1986) 223-249
Economist: Europe’s financial-transaction tax Bin it- Plans for a transaction tax ought to
be dropped- 23rd
February 2013
Investment Company Institute (nation association of US investment companies)
Meeker, James Edward. 1922. The Work of the Stock Exchange. New York: The Ronald
Press Company
New York Times: In Wall St. Tax, a Simple Idea but Unintended Consequences-26th
February 2013
Pomeranets, Anna and Daniel Weaver. “Security Transaction Taxes and Market Quality”
(Working paper)
Schwert, G. William, and Paul J. Sequin. 1993. “Securities Transaction Taxes: An
Overview of Costs, Benefits and Unresolved Questions.” Financial Analysts Journal, 27-
35
Stiglitz, Joseph E. 1989. “Using tax policy to curb speculative short-term trading.”
Journal of Financial Services Research, 3:101-115
Summers, Lawrence H. and Victoria P. Summers. 1989. “When Financial markets work
too well: a cautious case for a securities transaction tax.” Journal of Financial Service
Research, 3:163-188.
The Guardian: EU approves financial transaction tax for 11 eurozone countries-22nd
January 2013
Wall Street Journal-Why a Financial-Transaction Tax Could Backfire- 13th
December
2011