the impacts of remittances on developing countries
TRANSCRIPT


DIRECTORATE-GENERAL FOR EXTERNAL POLICIES
POLICY DEPARTMENT
EP/EXPO/B/DEVE/FWC/2013-08/Lot5/12 EN
February 2017 - PE 578038 © European Union, 2017
STUDY
Addressing Developing Countries’ Challenges in Free Trade Implementation
ABSTRACT
The present study places the potential effects of Economic Partnership Agreement (EPA) liberalisation on government revenue in signatory states within the broader context of regional integration and global liberalisation. Based on a review of the secondary literature it finds that the revenue effect may be severe in some, but by no means all, cases and that the forecasts now need to be updated by country-level studies using the details of liberalisation schedules actually agreed. The evidence also suggests that poor countries find it very hard to replace government revenue lost through liberalisation but that where there have been successes the measures taken include those needed to increase any gains from regional and global trade integration. Such reforms require sustained commitment (by donors and recipients) over many years. The stresses created by EPAs (and regional liberalisation) increase the need for such commitment; but they also offer an opportunity since they include an appropriate framework for providing appropriate assistance. Yet data on flows of aid for trade do not indicate that an adequate commitment has yet been made. Six recommendations are made on actions that the European Parliament might champion to reduce the risks of an ‘EPA revenue squeeze’ in ways that support recipients’ capacity to benefit from greater regional and global integration.

Policy Department, Directorate-General for External Policies
This paper was requested by the European Parliament's Committee on Development (DEVE) at the proposal of the Delegation to the ACP-EU Joint Parliamentary Assembly
English-language manuscript was completed on 02 February 2017.
Printed in Belgium.
Author(s): Isabella MASSA (independent consultant, Research Associate at the Overseas Development Institute) and Christopher STEVENS (independent consultant, Senior Research Associate at the Overseas Development Institute).
Official Responsible: Valerie RAMET
Editorial Assistant: Simona IACOBLEV
Editor: Trans European Policy Studies Association (TEPSA), Belgium
Feedback of all kind is welcome. Please write to: [email protected]
To obtain copies, please send a request to: [email protected]
This paper will be published on the European Parliament's online database, 'Think tank'.
The content of this document is the sole responsibility of the author and any opinions expressed therein do not necessarily represent the official position of the European Parliament. It is addressed to the Members and staff of the EP for their parliamentary work. Reproduction and translation for non-commercial purposes are authorised, provided the source is acknowledged and the European Parliament is given prior notice and sent a copy.
ISBN: 978-92-846-0504-0 (pdf) ISBN: 978-92-846-0505-7 (paper)
doi: 10.2861/444555 (pdf) doi: 10.2861/393935 (paper)
Catalogue number: QA-04-17-023-EN-N Catalogue number: QA-04-17-023-EN-C (paper)
Addressing developing countries’ challenges in free trade implementation
1
Table of contents
List of tables, figures and boxes 2
List of abbreviations 3
Executive summary 4
1 Introduction 7
2 The impact of ongoing regional integration processes and EPAs in ACP countries on customs revenues 8
2.1 The importance of trade taxes for EPA states 9
2.2 How much revenue may be lost? 11
2.3 How quickly will revenue be lost? 15
3 Customs and fiscal reform: pre-conditions for better integration into regional and global markets 16
3.1 Increasing other taxes 17
3.2 Reforming customs and fiscal administration 19
4 The strategies to overcome these challenges 21
4.1 The broader picture 21
4.2 Aid for Trade 22
4.3 EPAs and the EDF 28
5 Conclusions and recommendations 30
5.1 Main conclusions 30
5.2 Recommendations 31
Bibliography 32
Appendix 35

Policy Department, Directorate-General for External Policies
2
List of tables, figures and boxes TABLE 1: TRADE TAXES AS A SHARE OF ACP GOVERNMENT REVENUE .......................................................................................10
TABLE 2: RELATIVE IMPORTANCE OF EU AS SOURCE OF IMPORTS ..............................................................................................11
TABLE 3: EPA LIBERALISATION TIMETABLES .................................................................................................................................15
TABLE 4: TRADE FACILITATION AND TRADE-RELATED ADJUSTMENT: GROSS DISBURSEMENTS FROM DAC EU MEMBERS
AND THE EUROPEAN COMMISSION, 2006 – 14 (USD MILLIONS 2014) .....................................................................27
FIGURE 1: TAXES ON INTERNATIONAL TRADE (% OF GOVERNMENT REVENUE 2012) ...........................................................10
FIGURE 2: TAXES ON INTERNATIONAL TRADE (PER CENT OF GOVERNMENT REVENUE) FOR SELECTED COUNTRIES, 2000 – 2012 ..........................................................................................................................................................................14
FIGURE 3: TOTAL AFT NET DISBURSEMENTS TO AFRICAN EPA STATES, 2002 – 2014 (USD MILLION) ..........................24
FIGURE 4: AFT TO TRADE FACILITATION: NET DISBURSEMENTS TO AFRICAN EPA STATES, 2002 – 2014 (USD MILLION) ...................................................................................................................................................................................................25
FIGURE 5: AFT TO TRADE POLICY AND ADMINISTRATIVE MANAGEMENT: NET DISBURSEMENTS TO AFRICAN EPA STATES, 2002 – 2014 (USD MILLION) .............................................................................................................................................25
FIGURE 6: AFT TO RTAS: NET DISBURSEMENTS TO AFRICAN EPA STATES, 2002 – 14 (USD MILLION) .........................26
FIGURE 7: AFT FOR TRADE-RELATED ADJUSTMENT: NET DISBURSEMENTS TO AFRICAN EPA STATES, 2002 – 2014
(USD MILLION) .......................................................................................................................................................................26
BOX 1: IMPLEMENTATION OF FTAS AND RTAS – THEORY AND PRACTICE ................................................................................... 8
BOX 2: TARIFFS, TRADE TAXES AND GOVERNMENT REVENUE ....................................................................................................... 9
BOX 3: DIFFERENCES IN MODELLING APPROACH .........................................................................................................................12
BOX 4: REVENUE DEPENDENCE ON THE EU VARIES OVER TIME ..................................................................................................13
BOX 5: PROBLEMS WITH LIBERALISATION DATA...........................................................................................................................17
BOX 6: ILLUSTRATIVE EXAMPLES OF CUSTOMS REFORM AND REVENUE RAISING ....................................................................20
BOX 7: PROBLEMS OF TAX COLLECTION IN POOR STATES ...........................................................................................................20
BOX 8: THE BROAD CASE FOR AND AGAINST FTAS .....................................................................................................................21
BOX 9: THE WTO AND TRADE FACILITATION ...............................................................................................................................23

Addressing developing countries’ challenges in free trade implementation
3
List of abbreviations ACP African, Caribbean and Pacific group of states
AfT Aid for trade
CARIFORUM Caribbean Forum
CGE computable general equilibrium model
COMESA Common Market for Eastern and Southern Africa
CRS Creditor Reporting System
DAC OECD Development Assistance Committee
EAC East African Community
ECOWAS Economic Community of West African States
EDF European Development Fund
EPAs economic partnership agreements
EU European Union
FTAs free trade agreements
OECD Organisation for Economic Co-operation and Development
RTAs regional trade agreements
PEM partial equilibrium model
SADC Southern African Development Community
UNCTAD United Nations Conference on Trade and Development
VAT value-added tax
WTO World Trade Organisation

Policy Department, Directorate-General for External Policies
4
Executive summary This Study, commissioned to support the European Parliament’s consent procedures for Economic Partnership Agreements (EPAs), will feed into the discussions that are currently taking place within the European Parliament and the EU-ACP (African, Caribbean, Pacific) Joint Parliamentary Assembly. It addresses a broad canvas of the investment and the policy/administrative reforms needed to enable ACP states to gain more from regional integration, but with a specific focus. This is on the customs and fiscal changes that will address inter alia one consequence of EPAs and any regional trade agreements (RTAs) to which the ACP partners also belong: the loss of an, often important, source of tax revenue for governments as tariffs on imports are removed.
The main message The main message is that there does exist a tax revenue problem, but not necessarily the one that is most frequently voiced. There will certainly be tax revenue losses as a result of the EPAs and RTAs just as there is from broader liberalisation. Removing tariffs on ‘substantially all’ imports must result by the end of the implementation period in a loss of ‘substantially all’ tariff revenue on imports from partners. And in many poor countries, tariffs form an important part of governments’ tax base.
The problem results from a mismatch between the likely challenge (which may be very large only in a few cases) and the responses currently underway (which are very limited). Although the scale of the revenue challenge may have been exaggerated in some commentaries, there has been an offsetting underestimate of the problems in coping with even a modest revenue challenge.
Few poor countries have been able to replace substantially the tax revenue they have lost through tariff liberalisation. But as the reforms and investment required to do so may have a much wider impact, helping countries cope with EPAs could also increase any gains from regional, or global, integration. Improving the response to the specific and immediate challenge of the EPA revenue squeeze will help address the broader mismatch between what is needed and what is being done.
This is a task that the European Parliament is well placed to shoulder. It requires dialogue with both the European institutions (as well as Member States) and with ACP partners given that resolution of the problems requires sustained action by both parties.
The problem of shifting the tax base Despite the certainty of some government revenue loss, many uncertainties remain. There are few robust forecasts for EPA signatories based on a detailed analysis of what has actually been agreed. In some cases revenue might increase in the shorter-term (as imports volumes rise) but this may be offset by a diversion of imports towards EPA/RTA suppliers and away from countries that still pay full tariffs.
Not only have widely differing forecasts been made of the reduction in government revenue from the loss of tariffs and other trade taxes, opinions also differ over its impact since losing one source of tax does not necessarily mean an equivalent reduction in total government revenue. But the limited empirical information on the actual revenue impact of liberalisation is cautionary: one study of the fiscal effects of liberalisation found that on average low income countries recovered no more than around 30 % of the lost tariff revenue. Success tends to be associated with a broad customs and fiscal reform programme, which is the ‘big picture’ of which the EPA/RTA revenue challenge is just one part. Such reforms are desirable in their own right in many ACP countries.
But the investment and reforms associated with the big picture take a long time and substantial commitment (by both the implementing state and donors) to have an effect. Moreover, revenue replacement tends to be seen as a secondary side-effect. While the EU is a major Aid for Trade (AfT) donor

Addressing developing countries’ challenges in free trade implementation
5
and EPA signatories have received substantial disbursements, very little has been directed to the sub-categories most directly relevant to meeting the EPA/RTA revenue squeeze challenge.
An analysis of EU AfT to the countries at highest fiscal risk show very low levels of disbursements to the project sub-category that includes shifting the tax revenue base: trade-related adjustment. Three received no such aid in the period 2006 – 2014 and for a further three disbursements averaged less than USD 10 000 a year; only three received total support over the nine years exceeding USD 1 million. The annual average disbursements for the remainder was USD 173 750.
The EPA enabling framework for support from the European Development Fund (EDF)
The EPAs provide a clear framework for the EU to support through the EDF and other channels both broad and narrow (revenue adjustment) customs/fiscal reforms, but strategy needs to take account of what other actors are doing and how adequate current efforts appear to be. The Trade Facilitation Agreement of the World Trade Organisation (WTO) offers both a donor-recipient forum and a source of modest additional funds, but the big AfT flows have so far come significantly from Europe via Union and bilateral level programmes.
But very little has been disbursed to the areas most relevant to the narrow revenue adjustment challenge – though what has been provided by Europe has come exclusively from the Union institutions. And this is not just because some EPAs are not yet ratified. Even the earlier EPA texts, which lack detailed references to adjustment support, are phrased in a way that permits aid to be used in this way and funds already exist in the 10th and 11th EDFs to support adjustment.
The data suggests that a continuation of current practices will be insufficient to meet the challenge. This raises the question of why disbursements have been so low, particularly given that what is needed to meet the narrow EPA revenue challenge will also contribute to the much broader changes needed to support regional and global integration. There are suggestions that recipients as well as donors may be reluctant to give a very high priority to the required change.
If true, this would place the European Parliament in a unique position to move forward the agenda. It can exert a direct influence on a major AfT donor and it can dialogue with recipients through the Joint Parliamentary Assembly. The Study’s recommendations identify practical ways in which the European Parliament can build on its position.
Recommendations
The Study makes six recommendations for the European Parliament to consider. They build on responses to the narrow challenge of adjusting to a loss in government revenue consequent upon the EPA and any RTAs to which signatories belong and then move out to the broader responses needed to enhance any gains from regional integration and global liberalisation.
1. There should be a very early, detailed analysis of the revenue implications of what has actually been agreed in every EPA signatory that wishes to have one (and is willing to provide the data on tax collection needed to underpin robust findings).
2. Whilst the timescale for all such studies needs to be measured in a very small number of years if not in terms of months, priority should be given to those states identified in the existing forecasts as being most vulnerable.
3. The outputs from such work could feed into any agreement required to underpin the commitments in the EPAs with the East African Community (EAC) and Economic Community of West African States

Policy Department, Directorate-General for External Policies
6
(ECOWAS) for the EU to offer transitional relief (and in other EPAs where there is no such explicit commitment).
4. They may also be used to support medium-term plans for all EPA states that wish them for a fundamental reform to fiscal and customs policy and administration that will aim for a much broader impact than simply mitigating the revenue effect. The aim would be both to shift the public revenue base onto a firmer footing and to remove obstacles preventing states from maximising any gains from EPAs and other RTAs to which they belong.
5. Any such plans for fiscal and customs reform should be subject ex ante to an audit to estimate their potential distributional impact (for vulnerable socio-economic and gender groups) and ex post to an impact analysis to monitor actual distributional effects. The latter may require the systematic collection of data relating to these vulnerable groups (such as changes to the prices and availability of goods in their consumption basket).
6. The European Commission should be required to submit regular information reports to the European Parliament on all of these points.

Addressing developing countries’ challenges in free trade implementation
7
1 Introduction This Study has been commissioned to support the European Parliament’s consent procedures for the Economic Partnership Agreements (EPAs) and will feed into the discussions that are currently taking place within the European Parliament and the EU-ACP (African, Caribbean and Pacific) Joint Parliamentary Assembly. It draws on the evidence arising from a wide range of regional and free trade agreements (RTAs and FTAs) as well as on broader liberalisation undertaken in the past as part of multilateral liberalisation or structural adjustment.
Parliament has voiced concerns from the outset about the potential economic and social impact of EPAs. A particular concern is the expected loss of ACP government revenues following the decrease of customs duties and other taxes applied to imports of most EU products. The Study analyses these challenges (in the context of parallel RTAs) and proposes ways to overcome them.
Although many of the potential consequences of EPAs are contested, the broad fiscal effects are relatively straightforward to identify and are similar to those arising from any other exercises that include trade liberalisation. Removing tariffs on ‘substantially all’ imports, as is planned in the EPAs, must result by the end of the implementation period in a loss of ‘substantially all’ tariff revenue on imports from partners. This effect on government revenue from an important form of tax will be compounded by similar liberalisation within any regional trade agreements (RTAs) to which the ACP partners also belong. It will also be affected by any ‘trade diversion’ whereby ACP importers switch their sources of supply away towards countries inside the EPA or RTA in order to benefit from the tariff cut. This will also reduce tariff revenue on goods currently imported from partners unaffected directly by the tariff cuts.
Nonetheless there remains much uncertainty and scope for disagreement over the scale of the revenue effect (see Box 1). This is evident from the widely differing forecasts that have been made. And opinions also differ over impact, since losing one source of tax does not necessarily mean an equivalent reduction in total government revenue.
The disagreements rage partly because there is very little empirical information on what has actually happened to revenue after liberalisation in poor countries. Even robust forecasts for EPA/RTA signatories based on a detailed analysis of what has actually been agreed are relatively few in number.
Whilst the problem-focus of this Study is strictly revenue loss, solutions to the problem are broader ranging. And their desirability is not limited to coping with the narrow effects of one specific agreement – the core changes are needed to benefit from deepened regional and global integration. While maintaining the principal focus on government revenue, the Study widens the net to discuss these broader effects when considering solutions.
Section 2 of the Study summarises the information that is available to assess the potential scale and speed of EPA-related revenue loss (Box 2). The evidence on how successfully (and how fast) developing countries can restore government revenue lost through liberalisation is assessed in Section 3. On the basis of these two sets of evidence the Study examines in Section 4 the adequacy of current international efforts to assist EPA states to mitigate any adverse consequences of tariff revenue loss. Finally, the report draws conclusions from the evidence presented and makes a set of recommendations in Section 5.

Policy Department, Directorate-General for External Policies
8
BOX 1: IMPLEMENTATION OF FTAS AND RTAS – THEORY AND PRACTICE
The economic aim of FTAs and RTAs is to increase the integration of the signatories. Like the global integration fostered by the removal of trade barriers through the World Trade Organisation (WTO) and by technology, the hope is that welfare will be increased overall due, among other factors, to greater economies of scale and reduced transactions costs. There remain questions over how far this hope is fulfilled in specific cases and over the distributional effects of change both within and between states (Stevens et al 2015).
Changes to border controls on trade are central to achieving the hoped-for gains. On the one hand, moving goods and services more easily and cheaply between countries is a fundamental mechanism for achieving economies of scale and reducing transactions costs. On the other, when governments remove taxes on trade it not only opens up their domestic industries to fiercer competition (as well as potentially benefitting their consumers and import-dependent producers) but also reduces their revenue. Reforms to customs and fiscal policy and administration are key. They are needed to reduce transactions costs and they may help governments mitigate the associated revenue problems.
Partly because of the sensitivities created, it is not uncommon for the implementation of trade agreements to vary from the timetables set out in the treaties. And in some cases, even the signed text is vague on the timetable or scope of liberalisation. This is especially the case for many of the South-South RTAs which have been notified to the WTO under what is known as ‘the Enabling Clause’. These include the Common Market for Eastern and Southern Africa (COMESA), the East African Community (EAC) and the Economic Community of West African States (ECOWAS). Unlike the EPAs and some other South-South FTAs (such as SADC) which are notified to the WTO under Article 24, the Enabling Clause does not include the disciplines (found in Article 24) that liberalisation must cover ‘substantially all trade’ and be completed within a reasonable period of time.
Even when tariff reductions proceed as planned, there may be offsetting changes that alter the revenue impact. Although the EAC is a well-established RTA, the 2014 East African Market Scorecard finds that all of the Member States except Rwanda have replaced some intra-regional tariffs with ‘charges of equivalent effect’ (World Bank, EAC 2014: pages 78, 80, 84, 86). Since tariffs have not effectively been reduced as planned, the revenue effects will not be the same as any that had been forecast.
Note: Notification under Article 24 is for goods; the equivalent for FTAs on services is GATS Article 5. The EAC provisions on goods are notified under the Enabling Clause but those on services under GATS Article 5.
2 The impact of ongoing regional integration processes and EPAs in ACP countries on customs revenues
This section explains the different pathways along which revenues will be lost and their broad timetables. To the extent possible from the existing literature, it presents a broad quantitative indication of the potential importance of trade taxes for ACP countries both absolutely and relatively (e.g. in relation to current aid flows). Using this analysis, it reviews the potential effects of both the on-going regional integration processes and the impact of the EPAs on these revenues.
The impact of cutting trade taxes within an EPA (and other RTAs) will depend on:
• the importance of trade taxes for a particular state;
• how much tax revenue is lost;
• how quickly it is lost;
• the extent to which it can be replaced from other sources;
• any differences in the effects of these alternative sources.
The first three of these are covered in this Section. The other two are dealt with in Section 3.

Addressing developing countries’ challenges in free trade implementation
9
2.1 The importance of trade taxes for EPA states Tariffs are one form of ‘trade tax’, which form one source of government revenue (Box 2). They are a relatively important source of government revenue in poor states because they tend to be easier than many other taxes to collect. This is evident from data derived from a range of sources.
• Figures for 97 low- and middle-income countries (1975 – 2000) indicate that trade taxes contribute between one-quarter and one-third of total tax revenue (IMF Fiscal Affairs Department, 2005).
• Sub-Saharan African states rely more heavily on trade taxes than do some other countries, such those in Asia (Baunsgaard and Keen, 2005). One analysis found that in the Economic Community of West African States (ECOWAS) plus Mauritania, import duties account on average for 14.7 % of government revenues excluding grants (Busse and Groβmann, 2007). This average ranges from highs of 34 % for the Gambia and 25 % for Cape Verde to just 5 % for Nigeria.
• In the Caribbean Forum (CARIFORUM) states, there is a similarly wide range of dependence on trade taxes around a 2002 regional average of 15 % (Busse and Lüehje, 2007). The Bahamas (46 %) and Belize (19 %) are the most dependent countries, while Trinidad and Tobago is the least (5 %).
BOX 2: TARIFFS, TRADE TAXES AND GOVERNMENT REVENUE
Discourse on EPAs often conflates tariffs, trade taxes and government revenue. But the EPAs, like other FTAs and RTAs, affect only one set of government revenue sources: ‘trade taxes’ which sit alongside income, company, sales and other taxes.
‘Tariffs’ are one type of trade tax and, typically in poor countries, the most substantial trade tax. Other trade taxes can include excise duties on goods that are wholly (or mainly) imported and export taxes. Other consumer taxes (such as sales tax or value added tax) will normally be collected on imported goods at the border by the customs service at the same time as any tariff. But, because they are (at least notionally) also applied to domestically-produced goods they are not classified as trade taxes.
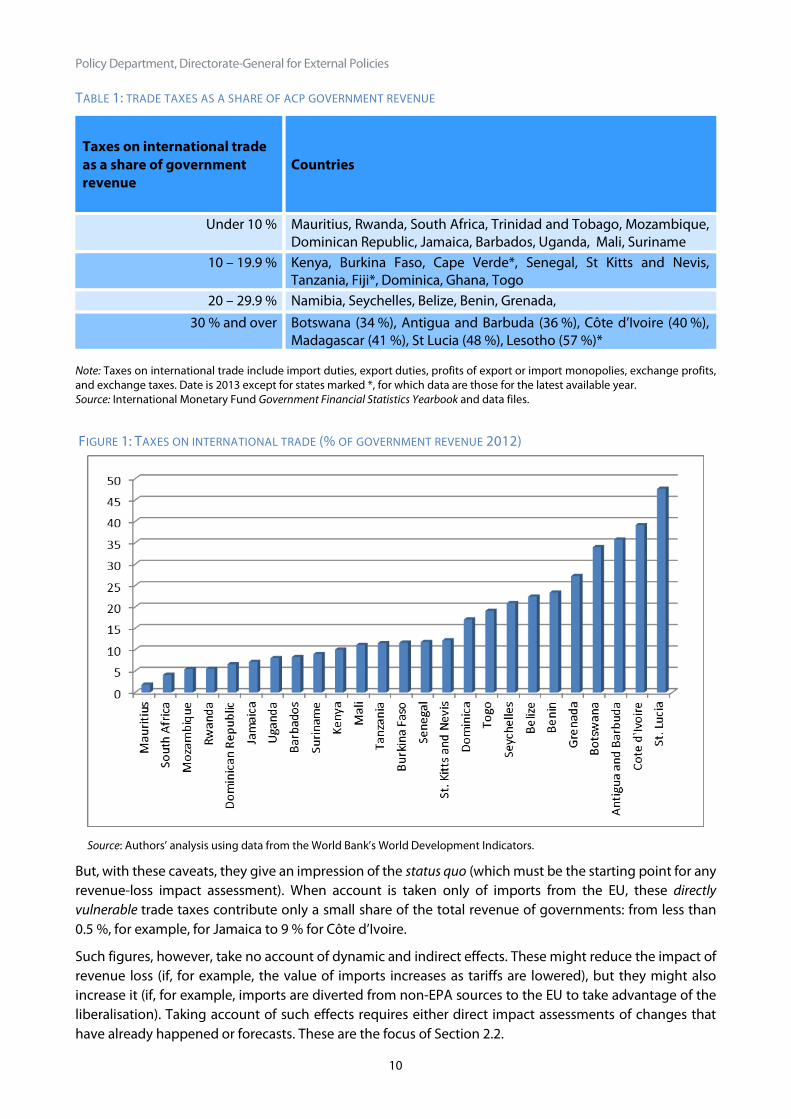
This range is illustrated in Table 1, which shows the share of trade taxes in total government revenue for those ACP states for which recent data are available. Although the data are incomplete, they show clearly that dependence varies widely: from less than one-tenth (for 38 % of the countries in the table) to more than one-third (for 17 %). This range is also illustrated in Figure 1.
There are no systematically published data on how much trade revenue is collected by the countries in Table 1 on imports from the EU. But a very broad impression of the importance of EPA-related taxes may be obtained by considering the share of imports originating in the EU (Table 2).
These figures must be used very cautiously. They assume that the distribution of imports from the EU between different tariff bands is the same as for total imports, and they take no account of any EPA-related trade diversion. Moreover, the tables miss a number of countries that have signed EPAs, or may soon do so, because the data are not available.
Policy Department, Directorate-General for External Policies
10
TABLE 1: TRADE TAXES AS A SHARE OF ACP GOVERNMENT REVENUE
Taxes on international trade as a share of government revenue
Countries
Under 10 % Mauritius, Rwanda, South Africa, Trinidad and Tobago, Mozambique, Dominican Republic, Jamaica, Barbados, Uganda, Mali, Suriname
10 – 19.9 %
Kenya, Burkina Faso, Cape Verde*, Senegal, St Kitts and Nevis, Tanzania, Fiji*, Dominica, Ghana, Togo
20 – 29.9 % Namibia, Seychelles, Belize, Benin, Grenada, 30 % and over Botswana (34 %), Antigua and Barbuda (36 %), Côte d’Ivoire (40 %),
Madagascar (41 %), St Lucia (48 %), Lesotho (57 %)* Note: Taxes on international trade include import duties, export duties, profits of export or import monopolies, exchange profits, and exchange taxes. Date is 2013 except for states marked *, for which data are those for the latest available year. Source: International Monetary Fund Government Financial Statistics Yearbook and data files.
FIGURE 1: TAXES ON INTERNATIONAL TRADE (% OF GOVERNMENT REVENUE 2012)
Source: Authors’ analysis using data from the World Bank’s World Development Indicators.
But, with these caveats, they give an impression of the status quo (which must be the starting point for any revenue-loss impact assessment). When account is taken only of imports from the EU, these directly vulnerable trade taxes contribute only a small share of the total revenue of governments: from less than 0.5 %, for example, for Jamaica to 9 % for Côte d’Ivoire.
Such figures, however, take no account of dynamic and indirect effects. These might reduce the impact of revenue loss (if, for example, the value of imports increases as tariffs are lowered), but they might also increase it (if, for example, imports are diverted from non-EPA sources to the EU to take advantage of the liberalisation). Taking account of such effects requires either direct impact assessments of changes that have already happened or forecasts. These are the focus of Section 2.2.

Addressing developing countries’ challenges in free trade implementation
11
TABLE 2: RELATIVE IMPORTANCE OF EU AS SOURCE OF IMPORTS
Imports from the EU as share of total
Country
Under 5 % Bahamas, Swaziland, Lesotho, Belize
5 – 9.9 % Liberia, Jamaica, Haiti, Antigua, Dominica, Namibia, Guyana, Dominican Republic, Tanzania
10 – 14.9 % Uganda, Madagascar, St Vincent, Botswana, Kenya
15 – 19.9 % Rwanda, Mozambique, Fiji, Niger, Burundi
20 – 24.9 % The Gambia, Mauritius, Côte d’Ivoire, Zimbabwe
25 – 29.9 Suriname, South Africa, Ghana
30 – 34.9 Benin, Nigeria, Togo, Burkina Faso
Over 35 Senegal (43 %), Guinea (49 %), Mauritania (52 %), Cape Verde (78 %)
Source: Authors’ analysis using data from the International Tax Compact.
2.2 How much revenue may be lost?
Experience from other FTAs
The ideal guide to the scale and impact of revenue loss would be the actual experience of countries that have already completed free trade agreements. But it is largely non-existent: even the five year review of the EU-CARIFORUM EPA used average tariffs for a selection of countries and it did not take account of para tariffs or the effect of fiscal adjustment (Singh, Silva and Thompson, 2014: B27; Joint CARIFORUM-EU Council, 2015: para. 15).
A systematic review of 144 studies on 45 FTAs found in relation to revenue loss that ‘no study of a mature FTA estimated the actual effects (or analysed the impact of government’s response)’ (Stevens et al., 2015: p. vi). This problem applies equally to RTAs between developing countries. Although the review of impact studies examined a number that were related to South-South accords, none made robust assessments of revenue effects.
This finding was an extreme example of a broader problem to which we return in Sections 4 and 5. This is that the high level of interest in FTAs as they are being negotiated dwindles sharply after they have been signed (and the details known). The database underpinning the analysis contained almost ten times as many studies undertaken whilst an FTA was under negotiation as of those that were fully implemented (Stevens et al., 2015: p. 28).
Forecasts of EPA effects
There being no assessments of actual revenue impacts in fully or substantially completed FTAs, reliance must be put on forecasts. As with other aspects of FTAs under negotiation, there have been numerous pre-signature forecasts of the revenue effects of EPAs, including the sustainability impact assessments funded by the European Commission as part of the EPA negotiation process. RTAs have also been subject to (less numerous) forecasts but, for those notified to the WTO under the Enabling Clause, the timescale and extent of liberalisation is even less predictable than for those agreements such as EPAs that are notified under Article 24 (see Box 1).

Policy Department, Directorate-General for External Policies
12
Many of these forecasts have been assessed for this Study, with a focus on those that have been published and, hence, subjected either to formal peer review or, at least, expert scrutiny post-publication1. But these vary widely in their findings2.
Such variation is to be expected given that ACP states have widely different levels of dependence on trade taxes (see Table 1). But it also results from the use of different methodologies and assumptions by the various authors, which accentuates this variation in findings (see Box 3).
BOX 3: DIFFERENCES IN MODELLING APPROACH
The assessed forecasts make different methodological choices. These contribute to their widely differing conclusions.
Some methodological differences relate to modelling approach. Most studies use a partial equilibrium model (PEM) but a few use a computable general equilibrium (CGE) model. CGE modelling can take account of inter and intra‐sectoral effects caused by a change in trade policy. But it is often hampered by the lack of data on developing countries, requiring as it does the use of input‐output tables. Additionally, more assumptions have to be made than with PEM. Moreover, as CGE modelling works with large aggregates, there is a loss in the level of detail of analysis. The advantages of PEM in these respects are offset by the fact that it only allows the calculation of direct effects on trade creation and diversion, price, revenue, and welfare.
Another major methodological difference concerns the base level of revenue collected before the EPA comes into effect. By definition, no more revenue can be ‘lost’ than is collected at present (though, of course, restrictions on ‘policy space’ could alter how much might have been collected in future). In this area, the main differences in the forecasts’ assumptions concern how much is collected now, which taxes will be cut, and how fast.
Since no EPA states publish data on how much tax is collected on imports from a particular source, the forecasts must make assumptions. The amount actually collected may often be less than the theoretical maximum because of legitimate rebates, administrative shortcomings, and corruption. One review of West Africa concluded that revenue foregone as a result of customs exemptions could be as much as an average 2.3 % of GDP (Montagnat-Rentier and Parent, 2012: table 3)3. The best forecasts take account of this; they include Busse and Groβmann (2007) as well as Nielsen and Zouhon-Bi (2007), which takes partial account of under-collection.
The phasing of liberalisation will have a big impact on revenue loss, which only a few studies have tried to simulate through alternative scenarios (e.g. de Melo and Regolo, 2014; Mkenda and Hangi, 2009). Not all tariffs will be liberalised at all, and some liberalisation will be deferred for many years. The effect that this has on revenue loss will be heavily influenced by the negotiating decisions taken by ACP states on exclusions and deferments.
Broadly speaking, very high tariffs raise relatively less revenue than do mid-range ones because their primary purpose is to suppress imports to protect domestic producers. When selecting which goods to exclude from any liberalisation and which to liberalise only towards the end of the implementation period, countries have had to choose to an extent between protecting domestic producers and conserving government revenue (Bilal and Roza, 2007: Annex 1; Milner, Morrissey and Zgovu, 2007). One study of the revenue loss for six EPA regions quantifies the difference: on a scenario in which exclusions from liberalisation are concentrated on sensitive goods, the average losses would be 25 % of total tariff revenue; but if the exclusions were focused on revenue-generating goods, the loss would be reduced to 19 % (Fontagné, Laborde and Mitaritonna, 2010).
Tariffs are not the only source of government revenue from imports which will be affected by EPAs. There are also ‘para tariffs’: taxes and charges that, although not described as tariffs, are applied primarily to imports, such as special levies or service charges that exceed the cost of delivery. These are not generally taken into account in the studies assessed; even though, as pointed out in the main text, they may be very important in some countries.
1 Either directly for the more recent studies or indirectly for earlier studies included in meta-analyses, although a sample of these has also been assessed directly for benchmarking purposes. 2 Even the CARIFORUM-EU EPA has been in force for such a short period of time that any revenue effects are only starting to occur and the impact has not yet been analysed. 3 Simple average of 12 countries’ most recent reported data.
Addressing developing countries’ challenges in free trade implementation
13
A meta-analysis of some 30 studies covering EPA revenue effects in Africa (Bilal, Dalleau and Lui, 2012) found that there had been a general tendency to overestimate the direct fiscal losses (especially in some of the earlier studies). But it concluded, nonetheless, that the consequences could be very serious in some countries. Whilst cautioning that a true picture will emerge only from country-level case studies, the report identifies four groups of states according to the EPA fiscal impact.
• Very high: total tax revenues may fall by between a minimum of 6 % and a maximum of 43 % in eight countries — Benin, Cape Verde, Comoros, Djibouti, the Gambia, Ghana, Guinea Bissau and Togo.
• High: fall of a minimum 3 % to a maximum 16 % in 15 countries mainly in Central or West Africa.
• Modest: 12 countries mainly in Eastern and Southern Africa.
• Low: seven countries — Botswana, Lesotho, Malawi, Namibia, Nigeria, Swaziland and Zambia.
This league table is partly determined by the importance of tariffs in government revenue and the share of imports sourced from the EU. The modest impact expected in Eastern Africa, for example, is not surprising when allowance is made for the low EU share in total imports in some countries: 15 % in Rwanda and 14 % in Uganda (de Melo and Regolo, 2014; see also Zgovu and Kweka, 2007).
More recent forecasts do not significantly alter this broad picture4. For example, the recent sustainability impact assessment of the SADC EPA finds a relatively low revenue effect (as would be expected from the Bilal, Dalleau and Lui league table) but it also finds that the effect in Mozambique (though modest) is about three times greater than the average, no doubt reflecting that all other signatories have already accommodated the tariff cuts in the EU-South Africa Trade, Development and Co-operation Agreement, which was fully implemented by 2012 (European Commission, 2016: table 15).
Nor does the extension of the analysis beyond Africa alter the broad picture. For the CARIFORUM EPA, the forecast revenue loss is relatively modest for the region as a whole: one forecast covering all EPA regions found CARIFORUM to be one of the least affected (Fontagné, Laborde and Mitaritonna, 2010). But there could still be a significant impact in specific countries. Of 11 countries analysed by Busse and Lüehje (2007), the greatest revenue loss forecast was for St. Lucia (2.67 % of government revenue), Dominica (2.40 %), Antigua and Barbuda (2.13 %), Barbados (2.12 %), and St. Kitts and Nevis (2. 09%).
At the same time, it must be borne in mind that the relative importance of trade taxes as a share of government revenue does change over time as does the share of imports originating in the EU (Box 4). A flavour of the changing importance of trade axes is provided in Figure 2. This covers the ACP states for which a consistent time series is available for the period 2000–2012. It shows that the share of trade taxes in total revenue has varied quite sharply from year to year, and for many of the states, it has trended downwards over this period.
BOX 4: REVENUE DEPENDENCE ON THE EU VARIES OVER TIME
A specific example illustrates both areas of fluctuation. Busse and Groβmann (2007) indicate that at the time of their study, tariffs were particularly important in Cape Verde and the Gambia and also that imports from the EU accounted for 74 % and 62 % of the total respectively. But the picture indicated by the more recent data in Tables 1 and 2 is a little different. There are no recent data on the relative importance of trade taxes in the Gambia, but in Cape Verde they accounted for only 12 % of total government revenue in 2009. And although the EU remains a very important source of Cape Verde’s imports (Table 2) the same is not true for the Gambia, to which the EU supplied only 23 % of imports in 2013.
4 This statement is based on our assessment of the rigour of the following studies: Berthelot, J., 2014; Busse and Lüehje, 2007; de Melo and Regolo, 2014; European Commission, 2016; Mkenda and Hangi, 2009; Morrissey and Zgovu, 2007; Nwali and Arene, 2015; Onogwu and Arene, 2014.

Policy Department, Directorate-General for External Policies
14
Any EPA effects will be additional to those caused by concurrent liberalisation within an RTA, but these are often harder to forecast (see Box 1). On almost every point covered above, the data available to calculate potential revenue losses caused by an RTA to which EPA states also belong is non-existent or too fragmentary to be used. All that may be said is that there will be additional effects determined by the scope, implementation speed and selection of tariff lines within the RTA.
The effect of liberalising imports will also be accentuated in some cases by the restrictions found on export taxes in all the EPAs. These have not generally been taken into account in the analyses reviewed above. It is very hard to do so other than on a country-specific basis – the need for which is accentuated when attention turns to RTAs which have very different (or no) rules on export taxes. The incidence of such taxes varies widely between EPA signatories and much will depend on how governments respond to any EPA restriction. In some cases, for example, it may be possible to tax major (often extractive) industries in different, ‘EPA-legal’ ways (such as through royalties) or to impose domestic taxes that encourage the same activities that any export tax is intended to achieve (e.g. increased domestic processing).
FIGURE 2: TAXES ON INTERNATIONAL TRADE (PER CENT OF GOVERNMENT REVENUE) FOR SELECTED COUNTRIES, 2000
– 2012
Source: Authors’ analysis using data from the World Bank’s World Development Indicators.
A further important consideration emphasising the need for country-level analysis is that the impact of any given fall in revenue will also be determined by the overall budget position of a government. Annual variations occur in this position for a range of reasons in addition to the share of trade taxes in revenue or of imports from the EU or an RTA partner. The volatility of government revenues differs between countries: a relatively small revenue loss for one state could have a greater destabilising effect than a larger loss for another (Bilal and Roza, 2007: Annex 2).
This reinforces the point made in the meta-analysis of Bilal, Dalleau and Lui (2012) that revenue impact can only be assessed realistically at a country level. Nonetheless, this Study can help the European Parliament in two important ways:
• by juxtaposing a broad-brush picture of the potential scale and incidence of tariff revenue loss against the evidence on how easy it will be to recover this revenue;
0
10
20
30
40
50
60
70
2000 2001 2002 2003 2004 2005 2006 2007 2008 2009 2010 2011 2012
Antigua and Barbuda Belize Benin
Botswana Cote d'Ivoire Dominica
Grenada Seychelles St. Lucia
Togo

Addressing developing countries’ challenges in free trade implementation
15
• by identifying the priority list for country studies by flagging those that are expected to be most seriously affected.
But before moving onto these tasks we address the vital question of how quickly any support will need to be provided to avoid adverse effects.
2.3 How quickly will revenue be lost? The answer to this question is of considerable importance: it determines for ACP states how fast they will need to adjust (by finding new revenue sources or cutting expenditure), and for donors how quickly they must mobilise support for it to be useful. It is also a relatively straightforward question at a country level, but only a broad indication is possible at a regional level.
The timetable for tariff elimination established in the EPAs provides the main, but not the only, parameter. For most of the EPAs, the formal requirement is that tariffs are to be removed in stages over a period that is as short as eight years in some cases and up to 25 years in others (Table 3). But in most cases each separate state has a unique liberalisation schedule. Even within CARIFORUM, despite the existence of the Caribbean common market, each of the 17 ACP EPA signatories has a separate and different liberalisation schedule (Stevens, Kennan and Meyn, 2009).
TABLE 3: EPA LIBERALISATION TIMETABLES
EPA Tariff liberalisation period Para-tariff removal by
year: Start Year End Year
CARIFORUM* 1 25 7 – 10
CEMAC* 1 16 1 – 6
EAC 1 25 1
ECOWAS 1 20 1
ESA* 6 15 1
Pacific* 1 15 1
SADC 1 8 1
Note: Periods expressed in relation to years after the start of the process in the agreement text (given that both the formal and the effective starting dates vary between the agreements). Source: For asterisked regions: interim or full EPAs initialled/signed in 2007/8; for others, latest version on the European Commission’s website.
Without an analysis of each country’s specific liberalisation schedule, it is not possible to forecast accurately when the biggest revenue falls will occur. Although tariff revenue must fall by the time of full implementation, it will not be a linear descent and could even rise at some points. Imports of goods facing very high tariffs (designed to suppress trade) may actually increase as the tariffs fall cushioning the decline in revenue. Although some studies considered such factors (Box 3), only a detailed analysis of the agreed liberalisation schedules can take them fully into account.
Even at a country-level, some uncertainties remain, even for EPAs and even more so for RTAs. As described in Box 1, states may not adhere strictly to the agreed timetable (either using agreed standstill provisions or by default). As of 2014, for example, only 10 of the 15 CARIFORUM states had given effect to the agreed tariff reductions (Silva 2014). Moreover, all the EPAs include trade defence measures (which are also normal in RTAs) including the introduction of safeguard tariffs. Although temporary, such safeguards may continue for numerous years. And, while their main purpose is to restrict imports, they may nonetheless generate significant revenue.

Policy Department, Directorate-General for External Policies
16
For all of these reasons, the most prudent assumption is that in many cases the peak period of revenue fall will be towards the middle of the implementation period. This is on the twin expectations that the first tranches of liberalisation will include goods that are already duty-free or face very low tariffs, and that the last stages will often comprise goods that are imported only at a low level (because they are sensitive). Whilst imports of these sensitive goods may increase sharply as tariffs finally come down, the revenue currently collected on them (and hence vulnerable to being lost) is small.
In the case of EPAs (in contrast to the norm in RTAs), the early onset of revenue loss may be affected in some states by the standard provision regarding ‘para tariffs’ – charges required to import a good that exceed the actual cost of providing any service to which they are notionally associated (and which are therefore effectively additional import charges). These generally have to be removed either on entry into force of the EPA or within ten years.
By how much will the elimination of para-tariffs increase the figures cited in Section 2.2? This is a grey area: none of the EPAs list the charges to be removed and there is much scope for the signatories to disagree over any particular charge. It will often be open to interpretation, for example, whether or not a particular charge exceeds cost recovery (capital and recurrent) for the service against which it is being levied.
But their inclusion could increase significantly the fiscal impact of EPAs in some countries. In particular, they could front-load the revenue impact. They are, for example, very important in some CARIFORUM states. An analysis of Jamaica’s import-related taxes in 2013, for example, found that a nominal import duty of 100 % increased to 260 % after the imposition of additional stamp duty (FAO, 2014: p. 44).
3 Customs and fiscal reform: pre-conditions for better integration into regional and global markets
The evidence noted in Section 2 is that despite some exaggerated forecasts and wide differences between EPA signatories:
• some states may face a significant ‘revenue shock’, at least by the end of the EPA implementation period and probably earlier than that;
• the removal of para-tariffs could create a very early ‘revenue shock’ in some states.
Part of the response to the revenue loss caused by the EPAs and RTAs to which states belong will normally involve efforts to improve the legal and administrative effectiveness of trade facilitation. The Section examines the broader literature on customs and fiscal reform to analyse the modernisation needs of the customs administration in order to facilitate the implementation of the regional integration goals of RTAs, the EPAs and other international commitments.
This is a vastly broad area of activity but one in which many ACP states are already engaged and which establishes the environment for the narrower task of replacing trade taxes lost through tariff reductions. There are three stylised (and combinable) responses to the loss of government revenue each of which will have a different consequence. They are:
1. for expenditure to be reduced accordingly;
2. for the shortfall to be made up by other taxes and more efficient collection;
3. for the shortfall to be filled from other sources (such as aid).
Option 1 is a major cause for concern, not least because government spending is one of three major pathways along which trade affects poor people (McCulloch, Winters and Cirera, 2011). The scope for avoiding this outcome via Option 2 is considered in this Section, whilst the possibilities for using Option 3 are examined in the next Section.

Addressing developing countries’ challenges in free trade implementation
17
3.1 Increasing other taxes As described in Box 2, trade taxes are not the only source of government revenue, and tariffs are not the only type of trade tax. And in theoretical terms a shift from tariffs to other sources of government revenue has much to commend it.
The case for tax diversification is made in several analyses of revenue loss as well as in the broader literature (e.g. OECD and ITC, 2015). One succinct formulation is that:
‘for a small economy, a strategy of increasing domestic consumption taxes (slightly less than) one-for-one with tariff cuts has the attractive properties of leaving consumers better off (because the consumer price falls), preserving the production efficiency gain from the tariff reform, and increasing the government’s revenue (since consumption is a wider tax base than imports) (Baunsgaard and Keen, 2005: p. 3).’
But the same authors also point to the practical downside: an attraction of tariffs compared to other sources of tax revenue in countries with weak administrations is that they tend to be easier to collect. Hence the ‘yield’ from any given rate may be higher than from alternative taxes. This is a factor that appears not to be taken fully into account in some forecasts5.
3.1.1 Lower yields The question of whether countries that have liberalised have actually recovered the revenues lost from other sources ‘surprisingly […] seems to have received virtually no attention’ (Baunsgaard and Keen, 2005: p. 4). As noted in Section 2, no rigorous analyses have been found of the revenue effects of (substantially) completed FTAs. But there are data on the experience of countries with trade liberalisation resulting from other events (see Box 5), and so this sub-section ranges much more widely than the narrow ‘EPA/RTA’ focus. Based on an analysis of panel data for 111 countries over 25 years, Baunsgaard and Keen find that whereas rich and middle income states have largely replaced lost tariff revenue from other sources, low income countries ‘have on average recovered no more than around 30 cents of each lost dollar’ (Baunsgaard and Keen, 2005: p. 22).
Two other studies have used more or less the same dataset (Box 5) and their analyses add some nuances. Out of 39 low-income countries in an extended version of this database used by one study, tax revenue fell in 28; only six fully replaced these losses; while a further 10 did so partially (Glenday, 2006). The other study also showed that total tax revenue fell in many low income states after liberalisation (IMF Fiscal Affairs Department, 2005). And a more recent but unpublished work using a different database found that, after five years, less than a half of the countries had recovered all the lost revenue and, in over a quarter of cases, the authors adjudged the loss to be permanent as an average of over 20 years had passed without the revenue being recouped (Cagé and Gadenne, 2012).
BOX 5: PROBLEMS WITH LIBERALISATION DATA
Ideally, the evidence used to judge the scope to replace lost tariff revenue should be drawn from the experience of completed FTAs – but this doesn’t exist (see Section 2.2). The datasets that are available use episodes of liberalisation that have occurred for a variety of reasons. This means that the liberalisation is not necessarily to zero tariffs and nor does it necessarily cover ‘substantially all’ trade. On the other hand, the timeframe for liberalisation may (or may not) be more rapid than with EPAs.
5 For example Keck and Piermartini (2005), in their forecast of the revenue impact of the SADC EPA, conclude that for the five states in the sample that are not part of the Southern African Customs Union, consumption tax needs increase by only around 1.1 % – 1.5 % to recover lost tariff revenues, but the assumptions made about collection efficiency are not made clear.
Policy Department, Directorate-General for External Policies
18
An analysis of Kenyan liberalisation in the 1990s, for example, indicates that tax revenue actually rose (at least in current value) due in ‘large part’ to an increase in revenue from international trade (Cheeseman and Griffiths, 2005: p. 7). But as the authors point out, this was largely due to the fact that, despite the liberalisation that had occurred, tariffs were still quite high – and that a fall in revenue was to be expected as the liberalisation progressed.
At the same time, sharp country differences remain: the IMF survey of 125 countries found that, in a number of low income states, revenue actually increased (IMF Fiscal Affairs Department, 2005). The latter include several involved with EPAs: Benin, Burundi, Ghana, Malawi, Papua New Guinea and Zimbabwe. And in Rwanda, reforms to tax legislation and administration together with a broadening of the tax base is reported to have resulted in an increase of about one-half in total tax revenues as a share of GDP over the period 2001 – 13 despite a decline in import duties (OECD and ITC, 2015).
3.1.2 Distributional effects Apart from the lower collection efficiency of alternative taxes, their distributional effects may be different. Until tax reform plans are proposed and analysed, the nature and extent of such effects cannot be gauged, but an illustrative example shows the impact pathways.
One alternative to tariffs is a sales or value-added tax (VAT) which has the attraction that, in developing countries, often half or more of VAT receipts are collected on imports at the border (Baunsgaard and Keen, 2005; Cheeseman and Griffiths, 2005). An analysis of 125 countries found that in those cases where it proved possible to fill the gap left by declining tariff revenue, the principal vehicles were domestic consumption taxes as well as income taxes (IMF Fiscal Affairs Department, 2005).
Under such a switch of taxes, customs officials would simply stop collecting a tariff and start collecting sales tax/VAT on the same goods. But this tax would apply equally to imports from EPA/RTA partners and from other states for which it would be in addition to the non-liberalised tariff. And, whilst it is common to have different rates of sales tax/VAT on different goods, such fine-tuning tends to be less extensive than is the case with tariffs. Hence the price of some imports would rise: those from non-EPA/RTA sources and those facing rates for tariffs that are lower than those set under the replacement tax. And, to the extent that it can be collected, the sales tax would also apply to domestic production.
The consequence is that relative prices would change: some might go down (if the sales tax rate is lower than the tariff it is replacing) while others would go up (if the sales tax is additional to the tariff or on domestic production). Since different socio-economic groups have different consumption baskets, there could be a knock-on effect on poverty. And there could be gendered differences between the relative ‘winners’ and ‘losers’ from these changes (Goldman, 2000).
The apparent implication of the finding that many poor states failed to recover more than a small share of the lost tariff revenue is that the ‘income generating target’ for the alternative taxes should be set at a much higher level than the tariff target it replaces to take account of lower collection rates. This would increase the tax burden on those who are unable to avoid payment (to compensate for under-payment by others).
But contrary evidence is also provided by the IMF survey of 125 states (IMF Fiscal Affairs Department, 2005). This found that, among the minority of poor countries that had been able to maintain revenue, the increase in domestic consumption taxes often broadly corresponded to the loss of trade tax revenue. The phrase in italics is important: it suggests that some of the potential adverse effects of switching to alternative taxes can be avoided in states that successfully make the transition. So, attention needs to be focussed on the requirements for making the transition successfully instead of simply concluding that revenue must necessarily fall (or, if it does not, that there will be significant distributional effects). This is the subject of Section 3.2.

Addressing developing countries’ challenges in free trade implementation
19
3.2 Reforming customs and fiscal administration One possible explanation for the IMF survey finding is that success in replacing lost tariff revenue requires more than just increasing other taxes; it needs to be a part of a broader customs and tax reform programme. In most if not all EPA states (and non-EPA ACP countries), customs reform and broader measures to remove unwanted barriers to trade are desirable in their own right to foster global and regional integration. But, additionally, they may also help reduce any revenue shock resulting from EPAs as well as parallel RTAs.
The required actions are often broad, combining hard and soft infrastructure as well as policy reform (both inter-governmental and domestic). In the case of customs administration, the hard infrastructure may for example include new border posts to increase the potential throughput of trucks or of roads to the border. It may also include new informatics that allow officials on the border to assess the correct charges more accurately (to reduce the need for appeals) and for their decisions to be monitored (reducing the scope for corruption). Improved networking may also be needed to allow the government to monitor what is happening to its revenue (a basic requirement for adjusting in good time). For fiscal reform it may include investment in informatics and decentralised tax offices to permit taxes to be assessed and levied more broadly within the economy.
But there is substantial evidence that such hard infrastructure needs to be complemented by ‘soft infrastructure’ such as capacity building for key officials, and regulatory reform. A decision by neighbours to adopt one-stop border posts, for example, has the capacity to cut border transit times by half – but the evidence suggests that it achieves such dramatic reductions only when complemented by soft infrastructure reforms (Commonwealth Secretariat, 2015: Box 3.3). If change at the border post is not complemented, for example, by measures that allow required documents to be obtained at the border (rather than at a particular ministry in the capital city) it may not reduce transactions costs. And tax reform is likely to have significant distributional (and, hence, political) ramifications and to require close legal drafting.
What evidence is there on the success of efforts to undertake the broad reforms within which those needed to adjust to the revenue effects of RTAs/EPAs fall? Unfortunately, most analyses of customs reform programmes use, as their main metric of outputs, the effect on the volume of trade or the speed with which goods clear customs. They tend not to record the enhanced revenue raising that may have resulted. Nonetheless, some insights may be obtained from this literature both for the broader question posed in the title to this Section and for the narrower revenue-impact question.
A systematic review of 26 studies on the impact of different types of trade facilitation found that reforms improving customs efficiency are the second most effective in increasing trade volumes and reducing trade costs (Basnett and Massa, 2015). The impact analyses reviewed concluded that improving infrastructure was the most effective of the three types of intervention assessed in the literature. Surprisingly, the literature also suggested that the third type of intervention — reform to improve the regulatory and business environment — was the least effective (though it has certainly seen some success). But this ordering may reflect the focus and methodology of the research studies analysed. Some observers argue that reforms improving the regulatory and business environment may play a key role in enhancing the effects of the other reforms (Commonwealth Secretariat, 2015; Rippel, 2011).
Improving revenue administration has been found to be an important contributory factor in those countries that have been able to offset the fall in tariff revenue (IMF Fiscal Affairs Department, 2005). To the extent that it can improve collection efficiency (whether by streamlining procedures and administrative reforms or by cutting corruption) it may mitigate the EPA revenue shock. Although tariff revenue on liberalised goods will eventually fall to zero, it will continue to be collected on imports from

Policy Department, Directorate-General for External Policies
20
other sources and on EPA/RTA imports during implementation on the goods that have not yet been liberalised.
The evidence is limited to a set of specific country studies. These do not form a strong foundation for generalisable conclusions, but they do illustrate the possible effects of customs reform in increasing revenue (Box 6).
BOX 6: ILLUSTRATIVE EXAMPLES OF CUSTOMS REFORM AND REVENUE RAISING
Customs reforms in Ethiopia are said to have increased revenues by over one-half, while in Burundi they rose one-quarter (OECD and WTO, 2013). A World Customs Authority project in Ethiopia to reform customs and support trade facilitation also reported that it had resulted in a 52 % increase in tax revenue between 2005/6 and 2009/10 (Mawete, 2011: p. 6).
There is also some evidence that in Cape Verde tax revenue grew steadily over the period 2000 – 2007 as a share of GDP as a result of a shift to domestic consumption taxes in the form of a VAT (Marking, 2010).
A review of Mauritius’ recent customs reforms concluded that, although not the sole cause, they did contribute to an increase in revenue through ‘an increase in the number of customs offences detected and additional revenue collected by way of upliftment of values, enforcement activities and fines imposed’ (Purmah, 2011: p. 19). This was achieved by introducing new control work methods and techniques.
Similarly, a side-effect of upgrading the Chirundu border post in SADC has been improved revenue collection (Amoako-Tuffour et al., 2016: p.12). Reform can further ease financial constraints by speeding up collection (improving the state’s cash flow) and improving tax liability assessment (Likeng, Cantens and Bilangna, 2009).
But the literature also makes clear that (unsurprisingly given the scale of the task as described above) the process takes significant time and requires a strong commitment from the implementing government as well as from donors6. One analysis made by the Organisation for Economic Co-operation and Development (OECD) and the International Tax Compact (ITC) of seven country case studies concludes that ‘[tax system] reform is a long-term process which often implies steps forward and back’ (OECD and ITC, 2015: p. x). As noted, inputs of ‘hard infrastructure’ have to be married to ‘soft infrastructure’ if they are to have the desired outcomes (Commonwealth Secretariat, 2015: section 3.4). A similar view that capacity building must be at the centre of change is taken in various reports on customs reform projects (Mawete, 2011; Purmah, 2011) and so must political ownership (Commonwealth Secretariat, 2015).
Tax reform, especially reform of the tax administration, is a long process. Donors can expect that reform efforts might take a decade to have a profound impact. The structure typical of poor countries makes it hard to levy income and company taxes on a broad section of society (see Box 7).
BOX 7: PROBLEMS OF TAX COLLECTION IN POOR STATES
A review of secondary evidence in Kenya provides a list (that would apply to many states) of the factors believed to hinder domestic tax collection, such as low levels of formal employment, poverty wages and a high dependency ratio (Cheeseman and Griffiths, 2005). Among the factors that have been identified as dampening the tax capacity of low income countries are the large size of subsistence farming as well as the agricultural sector more generally (resulting in widely dispersed business activity) together with a large informal sector and a large unskilled labour force with wages falling below income-tax thresholds (or in the lowest brackets). Consequently, many economic operators keep poor records, and there are relative few professional accountants to maintain tax records for tax purposes (OECD and ITC, 2015; Glenday, 2006).
6 See for example Likeng, Cantens and Bilangna (2009), Mawete (2011), Montagnat-Rentier and Parent (2012) and Purmah (2011).

Addressing developing countries’ challenges in free trade implementation
21
4 The strategies to overcome these challenges The task of enhancing the gains from regional or global integration is very broad and relates to RTAs/EPAs at many points. The guiding parameters of this relationship have been identified in Sections 2 and 3. The evidence from these Sections is that:
• some, but by no means all, EPA signatories will face a potentially sharp squeeze in government revenue;
• the timing of this will vary between states (as will its disruptive potential) but it could start within a few years, especially in states for which para-tariffs are important;
• the available data indicate that poor countries find it very difficult to replace from other sources most of the revenue lost through tariff liberalisation;
• but in the small number of successful cases, replacing tariff revenue with other taxes has been part of a broader fiscal and customs reform programme;
• which is desirable in its own right in many EPA states — but is hard and slow to achieve, requiring inter alia strong, sustained commitment from both implementing states and donors.
In other words, although the scale of the revenue challenge may have been exaggerated in some commentaries, there has been an offsetting underestimate of the problems in coping with even a modest revenue challenge.
This section pays considerable attention to what has been done up to now as it forms the foundation on which any activity within EPAs will be based. If recent past practice is lacking, a policy of ‘business as usual’ will fail to address the new problems. And, because the challenges identified in Section 3 are not specific to EPAs, any failures in past practice will not necessarily be addressed just because EPAs have been signed. Aid to support customs and fiscal reform has been required (and to a degree provided) for the past decade or more; the EPAs merely add an extra twist to the need and an extra vehicle for providing support.
4.1 The broader picture As with other cases of trade liberalisation and rule making, the effects of EPAs are contested (see Box 8). The record on whether or not FTAs have resulted in increased trade is mixed. Most robust studies find that FTAs have positive effects on the value of trade in at least some cases but there is a wide range of estimated effects — and some partners are found to have gained nothing (Stevens et al., 2015: p. v).
BOX 8: THE BROAD CASE FOR AND AGAINST FTAS
In very broad terms the debate is as follows (see Stevens et al, 2015 for further discussion). Supporters argue that, as with any liberalisation, the removal of barriers to trade will result at an aggregate level in an increase in the welfare of both parties. The rules within FTAs are also perceived as providing a more predictable policy environment (which would foster economic activity and investment) and as being a ‘cement’ to bind together regional integration schemes.
Critics argue that governments need to retain the flexibility to shield some domestic producers from import competition and that over-rigid rules remove this necessary policy flexibility. They fear, for example, that the adjustment to increased imports will be borne mainly by the poor and vulnerable whose alternative employment opportunities are the most limited.
Where both supporters and critics are in agreement is that the removal of obstacles to trade such as inadequate infrastructure and inefficient administrations would help countries (EPA and RTA signatories and non-signatories alike) to maximise any potential gains from trade and, hence, from regional

Policy Department, Directorate-General for External Policies
22
integration. Among the factors explaining the wide differences in country outcomes from FTAs is the capacity of each economy to increase supply of products for which the FTA or RTA has boosted demand (as well as the specific features of each agreement). This ‘supply-response’ is determined by a wide range of factors including not only government policies but also the country’s physical and institutional infrastructure, its human resources and all the other elements determining the short-term flexibility of an economy. If attention shifts beyond the ‘quantity’ of FTAs effects to the ‘quality’ (such as distributional effects especially on vulnerable groups), the range of determining factors is even broader.
The challenge to maximise the gains from EPAs and RTAs is accordingly very broadly-based, extending into almost every aspect of public policy and private action. In the longer term, countries must make their economies more productive and flexible; in the shorter term they need to remove those bottlenecks that are hindering nascent exports, and foster regional integration (Commonwealth Secretariat, 2015).
Trade facilitation is one part of this broad canvas but aspects of it are controversial. While policymakers and the international business community have called for greater transparency, efficiency and uniformity of trade related procedures, trade facilitation is a balancing act between economic efficiency gains and regulatory objectives. Key economic actors are seeking to reduce the risks and transaction costs of moving goods across international borders. But national authorities also have to protect legitimate regulatory objectives such as ensuring that prohibited or restricted goods such as drugs or weapons do not enter into the domestic market, protecting both consumer welfare and environmental wellbeing and, of course, safeguarding what remains of trade tax collection (Commonwealth Secretariat, 2015).
As one aspect of trade facilitation, revenue raising is subject to the same balancing act. But, with such caution in mind, it is clear that aid for trade (AfT) has a role to play in helping countries meet the EPA revenue challenge. Two findings in Section 3 are particularly worth repeating:
1. the question of whether countries that have liberalised have actually recovered the lost revenue from other sources seems to have received virtually no attention, according to authors writing in 2005; despite the fact that
2. low income countries have on average recovered no more than around 30 cents of each dollar lost through tariff liberalisation.
4.2 Aid for Trade 4.2.1 The World Trade Organisation and trade facilitation The WTO has been central to the recent evolution of AfT and a wider recognition of the importance of trade facilitation (Box 9). A recent initiative is the creation of a WTO Trade Facilitation Agreement Facility which became operational at the end of 2014 to assist members ‘find the donor support they need by making information available on assistance programmes and, where needed, conduct matchmaking between donors and recipients’ (OECD and WTO, 2015: p. 128). Where no other support is available, the facility can offer grants for project preparation and for implementation support (up to USD 200 000 in the case of the latter).
But the bulk of the funds available to support AfT come through the normal programmes of aid donors. The EU has been a major AfT provider through the efforts of member states and EU institutions. Out of a global 2013 total of USD 41.6 billion, some USD 7.1 billion was provided by the EU institutions, USD 3.4 billion by Germany, USD 1.9 billion by France and USD 1.4 billion by the UK (Mendez-Parra and te Velde, 2016: p. 54).
Addressing developing countries’ challenges in free trade implementation
23
BOX 9: THE WTO AND TRADE FACILITATION
AfT in its current form was launched at the 2005 Hong Kong ministerial conference of the WTO, which called, in its declaration, for assistance to help countries implement trade agreements. It has become central to the WTO Trade Facilitation Agreement, which aims to reduce trade costs. A recommendation of the WTO Task Force on operationalising AfT recognised six categories of aid as falling within AfT: support for trade policy and regulation, trade development, trade-related infrastructure, building productive capacity, and trade-related adjustment and other trade-related needs (WTO, 2006).
The WTO agreement on trade facilitation was concluded at the 2013 Bali ministerial conference and will enter into force once two-thirds of the members have accepted it. The agreement ‘contains approximately thirty-five technical measures to expedite the movement, release and clearance of goods […]. These technical measures impose obligations on WTO members to: 1) increase transparency; 2) improve governance through disciplines on rule and decision-making processes; 3) implement streamlined and modernised border procedures and control techniques; and 4) enhance the movement of goods in transit’ (OECD and WTO, 2015: p.112).
Although many would see such actions as being desirable in their own right, there have been concerns about making their attainment mandatory within an international agreement. Supporters of the agreement have been at pains to point out that special and differential treatment exists in two main areas. Some of the ‘obligations’ imposed by the agreement are of the ‘best endeavours’ variety rather than being mandatory. And developing/least developed country members are able to identify in advance those measures that can be implemented only after appropriate assistance has been made available and a transitional implementation period. But doubts remain and the agreement has not yet come into force 7.
Despite the centrality of the WTO, the role of the Trade Facilitation Agreement and its associated Facility in tackling the EPA revenue squeeze is to support the broader architecture within which efforts to improve tax collection are situated. The main focus of the agreement is to reduce the costs of trade rather than revenue raising. None of the examples cited in an OECD/WTO review of the agreement on the beneficial effects of trade facilitation refer to increased tax revenue (OECD and WTO, 2015: ch. 4). As noted in Section 3, revenue raising is normally seen as an additional, side benefit of trade facilitation and regulatory reform rather than a central objective.
As part of this ‘broader architecture’, implementation of the Trade Facilitation Agreement is not an essential complement to the efforts of any country that has made a clear decision to support regulatory reform. Nor is the provision of donor support dependent upon its coming into force. Willing donors and recipients can, and do, work together on the kinds of reform that would feature in any ‘EPA revenue adjustment’ plan.
4.2.2 How much AfT are EPA states receiving?
The aggregate picture
The increase in AfT since the WTO Hong Kong ministerial conference is evident in data on net disbursements to African EPA states. All of the aid statistics in this Section are drawn from the OECD Creditor Reporting System (CRS) database which provides data over a relatively long time span on both aid commitments and disbursements and is comprehensive, authoritative, consistent and coherent. Aid statistics are notoriously difficult to interpret as definitions and practices may change and differ between donors, so most AfT studies use the CRS (Basnett et al 2012).
Figure 3 shows that African EPA states have received a steady increase in total AfT disbursements from all donors over the period 2002 – 2014. By the end of this period, disbursements had reached USD 8 billion a year.
7 On 27 September 2016, Bangladesh became the 94th of the WTO’s 164 members to ratify.

Policy Department, Directorate-General for External Policies
24
But how much of this money was directed towards the type of reforms identified in Section 3 as being needed to cope with the EPA/RTA revenue challenge? A precise answer to this question cannot be provided. But the broad-brush answer is that only small sums have been directed to the AfT sub-categories that appear to be most relevant to tackling the EPA revenue squeeze.
The uncertainty arises because AfT covers a wide range of disparate activities with many projects probably spanning several different elements. Building on and adapting the initial classification of the WTO (Box 9), the OECD Development Assistance Committee (DAC) has classified AfT flows into separate categories that identify the main purposes to which the aid is put. The six sub-categories of AfT that support ‘trade policy and regulations and trade-related adjustment’ are listed in the Appendix.
But in practice, there are serious problems in allocating flows between these sub-categories. Donors ‘self classify’ their aid and perceptions vary between them over the category within which a particular project should be classified. And some projects span several categories but are allocated to only one.
FIGURE 3: TOTAL AFT NET DISBURSEMENTS TO AFRICAN EPA STATES, 2002 – 2014 (USD MILLION)
Source: OECD Aid for Trade Statistical Queries
This may be one reason why disbursements to the single DAC sub-category that seems most relevant to the EPA revenue squeeze ‘are far lower than those classified under other categories […] across all major country classifications, irrespective of the year chosen’ (Silva, 2013: p. 298). This is the sub-category of ‘trade-related adjustment’ on which major overviews of AfT are ‘largely silent’ (Silva, 2013: p. 298). It is the category into which an UNCTAD typology puts shifting ‘the tax revenue base’ (UNCTAD, 2010).
But poor categorisation appears not to be the only reason for the small share of AfT attributed to trade-related adjustment: donor and recipient preferences may also play a part. In the view of some observers, donor AfT strategies show ‘in several instances’ a clear preference for programmes ‘that are not directly linked to addressing adjustment costs’ (Silva, 2013: p. 321). The same author also observes that the low share of trade-related adjustment does not only reflect donor priorities: there is evidence that recipients may also accord it a relatively low priority.
In addition, there is clear evidence of procedural and other difficulties in accessing and implementing AfT support for some purposes (OECD and WTO, 2015: table 4.5). There is a lack of what has been called ‘conceptual and empirical clarity’ over what exactly should fall under the trade-related adjustment category (Silva, 2013: p. 301).
AfT for fiscal reform in EPA states
The low level of flows to the AfT sub-categories that appear most relevant to the EPA revenue challenge is also evident in the data on disbursements to African EPA states. Of the six sub-categories created by the DAC for support to ‘trade policy and regulations and trade-related adjustment’, the four that appear most relevant to meeting the revenue challenge are: trade policy and administrative management, trade
0100020003000400050006000700080009000
2002 2003 2004 2005 2006 2007 2008 2009 2010 2011 2012 2013 2014

Addressing developing countries’ challenges in free trade implementation
25
facilitation, regional trade agreements, and trade-related adjustment8. Figures 4 to 7 show the level of annual disbursements to African EPA states over the period 2002 – 2014 from EU DAC members and the European Commission in each of these categories.
Of the four groups, only disbursements for trade facilitation (which can include a large infrastructure element) have breached the USD 100 million level, and only very recently (Figure 4). This is no doubt partly because of the calls for donor assistance in the WTO agreement on trade facilitation. The EU (Member States and European Commission), together with the USA and the World Bank accounted for 78 % of all trade facilitation support in 2013 (OECD and WTO, 2015: p. 125).
By contrast, aid to the other sub-categories has been much lower. Aid for trade policy and administrative management (Figure 5) has hovered around the USD 40 million mark for most of the period. Aid to support RTAs (which is more related to negotiation than adjustment) has been under USD 5 million in most years (Figure 6). And apart from two spikes in 2008 and 2009, flows to trade related disbursements (the category of most direct relevance to the EPA revenue challenge) have been at very low levels or zero (Figure 7).
FIGURE 4: AFT TO TRADE FACILITATION: NET DISBURSEMENTS TO AFRICAN EPA STATES, 2002 – 2014 (USD MILLION)
Source: OECD Aid for Trade Statistical Queries
FIGURE 5: AFT TO TRADE POLICY AND ADMINISTRATIVE MANAGEMENT: NET DISBURSEMENTS TO AFRICAN EPA STATES, 2002 – 2014 (USD MILLION)
Source: OECD Aid for Trade Statistical Queries
8 DAC codes 33110, 33120, 33130 and 33150.
020406080
100120140160
2002 2003 2004 2005 2006 2007 2008 2009 2010 2011 2012 2013 2014
020406080
100120140
2002 2003 2004 2005 2006 2007 2008 2009 2010 2011 2012 2013 2014

Policy Department, Directorate-General for External Policies
26
FIGURE 6: AFT TO RTAS: NET DISBURSEMENTS TO AFRICAN EPA STATES, 2002 – 14 (USD MILLION)
Source: OECD Aid for Trade Statistical Queries
FIGURE 7: AFT FOR TRADE-RELATED ADJUSTMENT: NET DISBURSEMENTS TO AFRICAN EPA STATES, 2002 – 2014
(USD MILLION)
Source: OECD Aid for Trade Statistical Queries
Even the apparently high level of disbursements for trade facilitation turns out to be more apparent than real when the spotlight is shone on the experience of specific countries. This is done in Table 4 which summarises annual data (see the Appendix) for all ACP EPA states for which data are available. It shows disbursements in two categories over the period 2002 – 2014: trade facilitation (which has received the largest share of the four covered by Figures 4 – 7) and trade-related adjustment. Although the figures are a total for the EU member states and the EU institutions, the latter have been major contributors, accounting for 47% of the disbursements for trade facilitation and 100% of those for trade-related adjustment.
The relatively large disbursements for trade facilitation have been concentrated on a very small number of countries. Only 5 of the 37 states in the table have received average annual disbursements for trade facilitation that exceed USD 1 million, a threshold that was met for only two states for trade-related adjustment.
For most states, flows under both categories have been low and sporadic. Only 16 have received any aid under both headings. And for many, the annual average disbursements have amounted only to a few tens of thousands of dollars. In 19 states, disbursements in at least one category have averaged less than USD 100 000 a year.
0
2
4
6
8
10
12
2002 2003 2004 2005 2006 2007 2008 2009 2010 2011 2012 2013 2014
0
5
10
15
20
25
2002 2003 2004 2005 2006 2007 2008 2009 2010 2011 2012 2013 2014

Addressing developing countries’ challenges in free trade implementation
27
TABLE 4: TRADE FACILITATION AND TRADE-RELATED ADJUSTMENT: GROSS DISBURSEMENTS FROM DAC EU MEMBERS
AND THE EUROPEAN COMMISSION, 2006 – 14 (USD MILLIONS 2014)
Country Trade Facilitation (33120)
Trade-related adjustment (33150)
Total Annual average Total Annual average
Belize 0.323 0.036 0 0
Dominica 0 0 0.111 0.012
Dominican Rep 6.255 0.695 0 0
Grenada 0 0 0.509 0.057
Haiti 3.634 0.404 0 0
Jamaica 0 0 26.15 2.906
St Lucia 0 0 16.84 1.871
St Vincent & Grenadines 0.138 0.015 6.113 0.679
Benin 0.118 0.013 0.070 0.008
Botswana 0.802 0.089 0 0
Burkina Faso 0.149 0.017 0.016 0.002
Burundi 2.796 0.311 1.055 0.117
Cameroun 26.979 2.998 0.031 0.003
Côte d'Ivoire 0.398 0.044 2.22 0.247
The Gambia 0 0 1.572 0.175
Ghana 6.550 0.728 0 0
Guinea-Bissau 1.339 0.149 0.395 0.044
Kenya 11.292 1.255 0 0
Lesotho 1.242 0.138 0 0
Madagascar 0.622 0.069 0.993 0.110
Mali 2.376 0.264 0 0
Mauritania 1.572 0.175 0.614 0.068
Mauritius 0.523 0.058 0 0
Mozambique 1.965 0.218 0 0
Namibia 0.367 0.041 0 0
Niger 0.018 0.002 0 0
Rwanda 7.788 0.865 8.936 0.993
Senegal 12.319 1.369 10.778 1.198
Sierra Leone 1.208 0.134 0.106 0.012
South Africa 2.512 0.279 0 0
Swaziland 0.300 0.033 0 0

Policy Department, Directorate-General for External Policies
28
Tanzania 24.802 2.756 5.704 0.634
Togo 0.008 0.001 6.495 0.722
Uganda 27.241 3.027 0 0
Zimbabwe 0.655 0.073 4.391 0.488
Fiji 0.013 0.001 0 0
Papua New Guinea 1.709 0.120 1.094 0.122
Source: OECD Creditor Reporting System
Those countries identified in the meta-analysis of fiscal impact studies as being of very high or high risk are shown in red as are those Caribbean states forecast to face the most severe fiscal impact (Bilal, Dalleau and Lui, 2012; Busse and Lüehje, 2007)9. Only three of these (St Lucia, Senegal and Togo) have received total trade-related adjustment support over the nine years that exceeds USD 1 million. At the other end of the scale, three have received no such aid at all, and for a further three, average annual disbursements have been below USD 10 000. The annual average for the remainder is USD 173 750.
It is possible that more aid has been disbursed but has been classified as regional rather than in relation to specific countries. However, the regions recognised in the CRS are much broader than those relating to EPAs, and so it has not been possible to check. As with the possibility of some flows being misclassified, this counsels caution in stretching the data too far when drawing conclusions. But even allowing for a significant level of under-reporting these transfers are, in the main, trivial compared to the task and give no confidence that sufficient support is being provided to cope with the EPA revenue squeeze.
4.3 EPAs and the EDF 4.3.1 The EPA framework The EPAs provide a clear, robust framework for support to the efforts by signatories to adjust to the revenue effects through fiscal and customs reform. This is despite the fact that the earlier EPAs included only brief and rather general references to the aid available to support signatories meet the wide challenges posed by their new agreements. The EPA for Central Africa was the most explicit (see Appendix, which supplies the main relevant texts in the cited EPAs). It referred to the need for ‘an in-depth dialogue on the fiscal measures to be taken which could restore budget balance in the long term’ (Article 10.2). ‘Absorbing the net fiscal impact’ of the EPA was foreseen as one of the uses to which aid and technical assistance could be put (Article 10.3). And there was recognition of the early need for a ‘methodology for estimating net fiscal impact’ (Article 10.4).
The later EPAs provide a much more extensive treatment of the flanking assistance to help EPA signatories meet their challenges. Indeed, they imply that some forms of compensatory funding might be made available. The EAC EPA, for example, commits the EU, ‘with regard to revenue losses linked to the reduction of tariffs’, inter alia to ‘provide financial resources to cover transitionally the agreed losses of government revenue arising from elimination and or substantial reduction in customs tariffs’ (Article 100.1.c). It also refers explicitly to the role of the European Development Fund (EDF) to contribute to funding measures needed to support regional integration and the EPA-related development strategies and projects.
The ECOWAS text specifies, as one of the objectives of the EPA development programme, meeting the adjustment costs and facing the challenges associated with implementation (Article 56:2). It specifically
9 No data were found for two of the African states (Cape Verde and Guinea) or for three of the Caribbean states (Antigua, Barbados and St Kitts and Nevis).

Addressing developing countries’ challenges in free trade implementation
29
commits the EU ‘to provide funding to cover the fiscal impact agreed by the Parties for the period of tariff dismantling’ (Article 60.3).
These more explicit texts make specific reference to the role of the EDF in funding these activities. But this does not mean that only the later EPAs provide an appropriate enabling framework or identify the EDF as a source of funding. This is for two reasons:
1. The broad phraseology in the earlier EPAs permits a similarly broad range of activities to be funded. Indeed, the more specific phraseology used in the EAC and ECOWAS EPAs could be used to support (if there were any doubt in the matter) that adjustment to fiscal loss is an appropriate area for EU financial and technical assistance.
2. Even the EAC and ECOWAS EPAs avoid creating any sources of funds that are separate from those already available to ACP states, notably the EDF, aid from the EU budget and the bilateral programmes of the Member States.
4.3.2 The role of the EDF These texts indicate that the EPAs provide an appropriate enabling framework for assistance that can, narrowly, help countries adjust to an EPA/RTA revenue squeeze and, more broadly, enhance any gains from regional and global economic integration. Even in the earlier EPAs, there is no reason why the substantial AfT that the EU has provided should not continue and be deployed to support the activities identified in Section 3 as being necessary to avoid a major revenue squeeze in some ACP states. And while both Member States and EU institutions will continue as donors, the later EPA texts put a particular focus on the EDF.
But, as also noted in Section 4.2.2, whilst the EU is a substantial AfT donor, its disbursements for trade-related adjustment are very limited. It appears that what is needed is a substantial boost in what has been done up until now and for support to be sustained over many years given the lengthy timeframe for successful reform identified in Section 3. This does not need to wait until EPAs are signed. Not only are funds for EPA implementation available from the 10th and 11th EDF, but as noted in Section 3, some major areas of support are much broader than the EPAs and so can be funded without specific reference to EPA- adjustment.
At the same time, AfT flows reflect the priorities of both donors and recipients. The latter may not select trade-related adjustment as a major priority. In the CARIFORUM EPA, for example, fiscal reform is the second area of ‘primary focus’ in the opening chapter but only one signatory, Antigua and Barbuda, has made it a focal point (Singh, Silva and Thompson, 2014: table 3).
Although ACP EPA signatories must have the final decision on how much AfT they need and the precise purposes to which it is put, there is an important role for the European Parliament:
• On the one side, it can work to ensure that adequate funds for revenue-related adjustment are available if requested. An opportunity to ensure that adequate weight is given is provided by the current revision underway of the 2006 EU Aid for Trade strategy; a Commission staff working document is expected in 2017.
• On the other, it can dialogue with ACP partners, including through the Joint Parliamentary Assembly, to identify their perceptions of the areas in which support is most needed and how any ‘demand-side’ constraints to its effective use for trade-related adjustment can be overcome.

Policy Department, Directorate-General for External Policies
30
5 Conclusions and recommendations The task of this Section is to pull the threads together to support the European Parliament. Despite some exaggerated forecasts and wide differences between EPA signatories, some states may face a significant ‘revenue shock’ and in some cases this could start to be felt within a few years; yet the fiscal and customs reform needed to adjust (and to benefit more widely from regional and global integration) typically takes many years and sustained commitment to achieve. Yet, even though the EU is a substantial AfT donor, there is no evidence that disbursements for revenue adjustment have been either sustained or significant in most cases.
5.1 Main conclusions There are six main conclusions from the Study that the European Parliament may wish to consider during its consent procedures.
1. Whilst all EPA signatories are likely to suffer a degree of government revenue loss (which could be substantial for some), the scale and timetable can only be judged realistically at a country level. The numerous forecasts made during the negotiation process need to be updated to take account of the details of what has been agreed. These include the specifics of which products will be liberalised and when, and the current sources of supply for these goods (to judge whether there may be a diversion of imports that could exacerbate the EPA induced revenue loss).
2. The existing forecasts can be used to identify which countries have the highest priority for such studies. In broad terms, West Africa is seen as the region with the greatest concentration of states at higher risk.
3. But neither accurate estimation of the revenue effects nor the broader reform of fiscal and customs policy and administration needed to gain from regional and global integration can be achieved without the strong, sustained support of both EPA signatories and donors. This is needed at every level. Most narrowly, estimating revenue effects requires access to data on current collection that may not be in the public domain. And more broadly, an OECD/ITC analysis concludes that ‘[tax system] reform is a long-term process which often implies steps forward and back’ (OECD and ITC, 2015: p. x). Reform efforts might take a decade to have an impact that is sufficiently profound merely to mitigate the narrow challenge of EPA-related revenue loss, let alone the broader one of re-orientating systems so that countries may gain more from regional and global integration.
4. Data on AfT flows to EPA states give no cause for complacency that the task has yet been seriously engaged, despite the need for an early start if they are to produce results in good time. Even allowing for misallocation between AfT categories, disbursements to those most directly related to the EPA revenue challenge are so insubstantial and sporadic as to raise serious doubt that the urgency of the task has been recognised. And while ratification of all the EPAs may remove some institutional constraints to a freer flow of resources, for some time there has existed scope to devote far larger sums to the key challenges than has been done.
5. The EPAs provide an enabling framework for the use of European aid, via the EDF and other channels, to help EPA signatories meet the revenue squeeze challenge (and more broadly to equip them to take advantage of liberalisation). But using the funds in this way requires both donors to make adequate funds available for these tasks and recipients to request that they be used in these ways. There is some suggestion that, more generally, neither donors nor recipients have been keen to use AfT for trade adjustment measures.
6. The later EPAs place commitments on the EU to ‘provide financial resources’ — using the phrasing in the EAC EPA — ‘to cover transitionally the agreed losses of government revenue arising from

Addressing developing countries’ challenges in free trade implementation
31
elimination and or substantial reduction in customs tariffs’ (Article 100.1.c). But the use of the word ‘transitionally’ (or, in the ECOWAS EPA, the phrase ‘for the period of tariff dismantling’) indicates that these will not be permanent replacements for lost revenue even if all parties agree on the scale of such loss. In the medium term, the protection of domestically-resourced public expenditure requires countries to make the difficult shift towards other taxes that, whilst harder to collect, may have more favourable welfare effects.
5.2 Recommendations The European Parliament may wish to consider six recommendations both during its consent procedures and in its dialogue within the EU-ACP Joint Parliamentary Assembly. They build on responses to the narrow challenge of adjusting to a loss in government revenue consequent upon the EPA and any RTAs to which signatories belong and then move out to the broader responses needed to enhance any gains from regional integration and global liberalisation.
1. There should be a very early, detailed analysis of the revenue implications of what has actually been agreed in every EPA signatory that wishes to have one (and is willing to provide the data on tax collection needed to underpin robust findings).
2. Whilst the timescale for all such studies needs to be measured in a very small number of years if not in terms of months, priority should be given to those states identified in the existing forecasts as being most vulnerable.
3. The outputs from such work could feed into any agreement required to underpin the commitments in the EAC and ECOWAS EPAs for the EU to offer transitional relief (and in other EPAs where there is no such explicit commitment).
4. They may also be used to support medium-term plans for all EPA states that wish them for a fundamental reform to fiscal and customs policy and administration. The aim would be both to shift the public revenue base onto a firmer footing and to remove obstacles preventing states from maximising any gains from EPAs and other RTAs to which they belong.
5. Any such plans for fiscal and customs reform should be subject ex ante to an audit to estimate their potential distributional impact (for vulnerable socio-economic and gender groups) and ex post to an impact analysis to monitor actual distributional effects. The latter may require the systematic collection of data relating to these vulnerable groups (such as changes to the prices and availability of goods in their consumption basket).
6. The European Commission should be required to submit regular information reports to the European Parliament on all of these points.
Policy Department, Directorate-General for External Policies
32
Bibliography Amoako-Tuffour, J., Balchin, N., Calabrese, L. and Mendez-Parra, M., ‘African transformation forum 2016 trade facilitation and economic transformation in Africa’, African Center for Economic Transformation and Overseas Development Institute, Kigali, March 2016.
Basnett, Y., Engel, J., Kennan, J., Kingombe, C., Massa, I., te Velde, D.W., ‘Increasing the effectiveness of Aid for Trade: the circumstances under which it works best’, Working Paper 353, Overseas Development Institute, London, August 2012. Available at https://www.odi.org/sites/odi.org.uk/files/odi-assets/publications-opinion-files/7793.pdf
Basnett,Y. and Massa, I., ‘Rapid Evidence Appraisal – Trade Facilitation’, Overseas Development Institute, London, April 2015.
Baunsgaard, T. and Keen, M, ‘Tax Revenue and (or?) Trade Liberalization’, IMF Working Paper, WP/05/112, Washington, June 2005.
Berthelot, J., ‘Losses of tariff revenues linked to the West Africa's Economic Partnership Agreement’, mimeo, 7 September 2014.
Bilal, S., Dalleau, M., Lui, D., ‘Trade liberalisation and fiscal adjustments: the case of EPAs in Africa’, ECDPM Discussion Paper No 137, European Centre for Development Policy Management, Maastricht, November 2012. Available at www.ecdpm.org/dp137
Bilal, S. and Roza,V., ‘Addressing the Fiscal Effects of an EPA’, European Centre for Development Policy Management (ECDPM), Maastricht, May 2007.
Busse, M., and Groβmann, H., ‘The trade and fiscal impact of EU/ACP economic partnership agreements on West African countries’, The Journal of Development Studies, Vol 43 No 5, 2007, pp. 787-811.
Busse, M., and Lüehje, S., ‘Should the Caribbean Countries Sign an Economic Partnership Agreement with the EU?’, Journal of Economic Integration, Vol 22 No 3, 2007, pp. 598-618.
Cagé, J., and Gadenne, L., ‘The Fiscal Cost of Trade Liberalization’, mimeo, June 2012. Available at http://piketty.pse.ens.fr/files/CageGadenne2012.pdf
Cheeseman, N., and Griffiths, R., ‘Increasing tax revenue in sub-Saharan Africa: The case of Kenya’, OCGG Economy Analysis No 6, The Oxford Council on Good Governance, October 2005. Available at https://www.files.ethz.ch/isn/110036/Analysis-6_Increasing_Tax_Revenue_SubSaharan_Africa.pdf
Commonwealth Secretariat, ‘The Commonwealth in the Unfolding Global Trade Landscape: Prospects Priorities Perspectives’, Commonwealth Trade Review 2015, London, 2015.
De Melo, J. and Regolo, J., ‘Revenue and Welfare Implications for Rwanda and Uganda of Finalizing an Economic Partnership Agreement with the EU’, IGC Working Paper, International Growth Centre, 2014.
European Commission, ‘The economic impact of the EU – SADC EPA group economic partnership agreement: An analysis prepared by the European Commission's Directorate-General for Trade’, Brussels, June 2016. Available at http://trade.ec.europa.eu/doclib/html/154663.htm
FAO, ‘Jamaica review of agricultural sector support and taxation’, Food and Agriculture Organisation, Rome, 2014.
Fontagné, L., Laborde, D., Mitaritonna, C., ‘An Impact Study of the Economic Partnership Agreements in the Six ACP Regions’, Journal of African Economies, Vol 20 No 2, 2010, pp. 179-216.
Glenday, G., ‘Towards fiscally feasible and efficient trade liberalization’, mimeo, May 2006. Available at: https://fds.duke.edu/db/attachment/828

Addressing developing countries’ challenges in free trade implementation
33
Goldman, T., ‘Customs and excise’, in Debbie Budlender (ed.), The Fifth Women’s Budget, IDASA, Cape Town and Pretoria, 2000.
IMF Fiscal Affairs Department, ‘Dealing with the Revenue Consequences of Trade Reform’, Background Paper for Review of Fund Work on Trade, International Monetary Fund, Washington D.C., February 2005.
Joint CARIFORUM-EU Council, ‘Five year review of the CARIFORUM-EU economic partnership agreement joint working document’, 14 July 2015. Available at http://trade.ec.europa.eu/doclib/docs/2016/january/tradoc_154165.pdf
Keck, A., and Piermartini, R., ‘The Economic Impact of EPAs in SADC Countries’, Staff Working Paper ERSD-2005-04, World Trade Organisation, Geneva, 2005.
Likeng, M. L. L., Cantens, T., Bilangna, S., ‘“Gazing into the Mirror” Operational Internal Control in Cameroon Customs’, Discussion Paper No 8, Regional and Transport – RIT Series, World Bank, Washington D.C., January 2009.
Marking, A., ‘Trade Liberalization and Tax Reforms in Cape Verde’, Minor Field Studies Series No 202, Department of Economics at the University of Lund, 2010.
Mawete, Z., ‘Customs Reform and Trade Facilitation in Ethiopia’, Aid for Trade: Case Story, World Customs Organization (WCO), February 2011.
McCulloch, N., Winters, L.A. and Cirera, X. ‘Trade Liberalization and Poverty: A Handbook’, Centre for Economic Policy Research, London, 2011.
Mendez-Parra, M., te Velde, D.W., ‘Aid for Trade as a complement to a new UK trade policy’ in Mendez-Parra, M., te Velde, D. W., Winters, L. A. (eds), The impact of the UK's post-Brexit trade policy on development: an essay series, Overseas Development Institute, UK Trade Policy Observatory, London, September 2016.
Milner, C., Morrissey, O., Zgovu, E., ‘Adjusting to Bilateral Trade Liberalisation under an EPA: Evidence for Mauritius’, CREDIT Research Paper No 07/11, Centre for Research in Economic Development and International Trade, University of Nottingham, Nottingham, 2007.
Mkenda, B., and Hangi, M., ‘Revenue implications of EPA in Tanzania’, Part of a series of Publications by CUTS GRC in conjunction with National Partners and under the Assistance of Deutsche Gesellschaft für Technische Zusammenarbeit (GTZ), BIEAC Project, August 2009.
Montagnat-Rentier, G. and Parent, G., ‘Customs Administration Reform and Modernization in Francophone Sub-Saharan Africa, 1995–2010’, IMF Working Paper WP/12/259, International Monetary Fund, Washington D.C., 2012.
Morrissey, O., and Zgovu E., ‘The Impact of Economic Partnership Agreements on ACP Agriculture Imports and Welfare’, CREDIT Research Paper 07/09, Centre for Research in Economic Development and International Trade, University of Nottingham, Nottingham, 2007.
Nielsen, L., and Zouhon-Bi, S.G., ‘ECOWAS fiscal revenue implications of the prospective economic partnership agreement with the EU’, Africa Region Working Paper Series, No 103, World Bank, Washington D. C., 2007.
Nwali, C. S., and Arene, C. J., ‘Effects of Economic Partnership Agreements on Agricultural Trade Between Nigeria and the EU’, International Journal of Food and Agricultural Economics, Vol 3 No 2, Special Issue, 2015, pp. 63-74.
OECD and ITC, ‘Examples of Successful DRM Reforms and the Role of International Co-operation’, Discussion Paper, July 2015.
OECD and WTO, ‘Aid for Trade in Action’, OECD Publishing, Paris, 2013.

Policy Department, Directorate-General for External Policies
34
OECD and WTO ‘Aid for trade at a glance 2015: reducing trade costs for inclusive sustainable growth’ OECD Publishing, Paris, 2015.
Onogwu, G. O., and Arene, C. J., ‘Trade, Revenue and Welfare Effects Under an Economic Partnership Agreement Between Burkina Faso and the European Union’, Russian Journal of Agricultural and Socio-Economic Sciences, No 2(14), 2014, pp. 44-54.
Purmah, S. S., ‘Trade Facilitation Implementation in Republic of Mauritius’, Mauritius Revenue Authority-Customs Department, October 2011.
Rippel, B., ‘Why Trade Facilitation is Important for Africa’, Africa Trade Policy Notes No 27, The World Bank, Washington D.C., 2011.
Silva, S., ‘Aid for trade adjustment: implications for small and vulnerable economies and least developed countries’ in Razzaque, M., te Velde, D.W. (eds), Assessing aid for trade: effectiveness, current issues and future directions, Commonwealth Secretariat, London, 2013.
Silva, S., ‘Implementation challenges: Insights from the first CARIFORUMEUEPA fiveyear review’, GREAT Insights Magazine, Vol 3 No 9, ECDPM, Maastricht, October/November 2014. Available at http://ecdpm.org/great-insights/economic-partnership-agreements-beyond/implementation-challenges-insights-first-cariforum-eu-epa-five-year-review/
Singh, R. H., Silva, S.P., Thompson, K-A., ‘Monitoring the Implementation & Results of the CARIFORUM – EU EPA agreement: Final Report’, B & S Europe and Linpico, September 2014. Available at http://trade.ec.europa.eu/doclib/docs/2016/february/tradoc_154237.pdf
Stevens, C., Kennan, J., Meyn, M., ‘The CARIFORUM and Pacific ACP Economic Partnership Agreements: Challenges Ahead?’, Economic Paper Series, Commonwealth Secretariat, 1 February 2009.
Stevens, C., Irfan, I., Massa, I. and Kennan, J., ‘The Impact of Free Trade Agreements between Developed and Developing Countries on Economic Development in Developing Countries: A Rapid Evidence Assessment’, Overseas Development Institute, London, 2015.
UNCTAD, ‘Adjustment costs and trade liberalization’, United Nations Conference on Trade and Development, Geneva, 2010.
World Bank, EAC, ‘East African Common Market Scorecard 2014’, Washington and Arusha, 2014.
WTO, ‘Recommendations of the task force on aid-for-trade’, World Trade Organisation, Geneva, 2006.
Zgovu, E. K., and Kweka, J. P., ‘Empirical Analysis of Tariff Line-Level Trade, Tariff Revenue and Welfare Effects of Reciprocity under an Economic Partnership Agreement with the EU: Evidence from Malawi and Tanzania’, paper prepared for the African Economic Conference 2007 'Opportunities and Challenges of Development for Africa in the Global Arena', 15-17 November 2007, Addis Ababa, 2007.

Addressing developing countries’ challenges in free trade implementation
35
Appendix CATEGORIES OF AID FOR TRADE FOR TRADE POLICY AND REGULATIONS AND TRADE-RELATED ADJUSTMENT
CRS CODE
DESCRIPTION Clarifications / Additional notes on coverage
33110 Trade policy and administrative management
Trade policy and planning; support to ministries and departments responsible for trade policy; trade-related legislation and regulatory reforms; policy analysis and implementation of multilateral trade agreements e.g. technical barriers to trade and sanitary and phytosanitary measures (TBT/SPS) except at regional level (see 33130); mainstreaming trade in national development strategies (e.g. poverty reduction strategy papers); wholesale/retail trade; unspecified trade and trade promotion activities.
33120 Trade facilitation
Simplification and harmonisation of international import and export procedures (e.g. customs valuation, licensing procedures, transport formalities, payments, insurance); support to customs departments; tariff reforms.
33130 Regional trade agreements (RTAs)
Support to regional trade arrangements [e.g. Southern African Development Community (SADC), Association of Southeast Asian Nations (ASEAN), Free Trade Area of the Americas (FTAA), African Caribbean Pacific/European Union (ACP/EU)], including work on technical barriers to trade and sanitary and phytosanitary measures (TBT/SPS) at regional level; elaboration of rules of origin and introduction of special and differential treatment in RTAs.
33140 Multilateral trade negotiations
Support developing countries’ effective participation in multilateral trade negotiations, including training of negotiators, assessing impacts of negotiations; accession to the World Trade Organisation (WTO) and other multilateral trade-related organisations.
33150 Trade-related adjustment
Contributions to the government budget to assist the implementation of recipients’ own trade reforms and adjustments to trade policy measures by other countries; assistance to manage shortfalls in the balance of payments due to changes in the world trading environment.
33181 Trade education/training
Human resources development in trade not included under any of the above codes. Includes university programmes in trade.
Source: OECD Development Assistance Committee
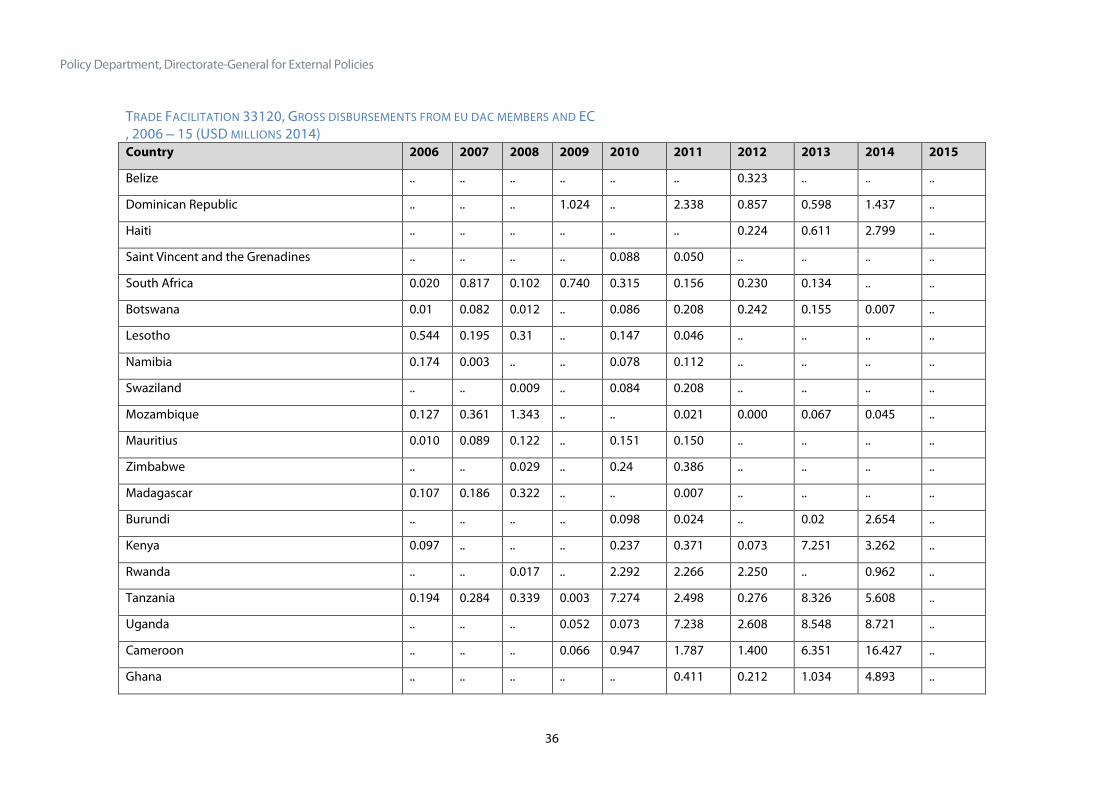
Policy Department, Directorate-General for External Policies
36
TRADE FACILITATION 33120, GROSS DISBURSEMENTS FROM EU DAC MEMBERS AND EC , 2006 – 15 (USD MILLIONS 2014) Country 2006 2007 2008 2009 2010 2011 2012 2013 2014 2015
Belize .. .. .. .. .. .. 0.323 .. .. ..
Dominican Republic .. .. .. 1.024 .. 2.338 0.857 0.598 1.437 ..
Haiti .. .. .. .. .. .. 0.224 0.611 2.799 ..
Saint Vincent and the Grenadines .. .. .. .. 0.088 0.050 .. .. .. ..
South Africa 0.020 0.817 0.102 0.740 0.315 0.156 0.230 0.134 .. ..
Botswana 0.01 0.082 0.012 .. 0.086 0.208 0.242 0.155 0.007 ..
Lesotho 0.544 0.195 0.31 .. 0.147 0.046 .. .. .. ..
Namibia 0.174 0.003 .. .. 0.078 0.112 .. .. .. ..
Swaziland .. .. 0.009 .. 0.084 0.208 .. .. .. ..
Mozambique 0.127 0.361 1.343 .. .. 0.021 0.000 0.067 0.045 ..
Mauritius 0.010 0.089 0.122 .. 0.151 0.150 .. .. .. ..
Zimbabwe .. .. 0.029 .. 0.24 0.386 .. .. .. ..
Madagascar 0.107 0.186 0.322 .. .. 0.007 .. .. .. ..
Burundi .. .. .. .. 0.098 0.024 .. 0.02 2.654 ..
Kenya 0.097 .. .. .. 0.237 0.371 0.073 7.251 3.262 ..
Rwanda .. .. 0.017 .. 2.292 2.266 2.250 .. 0.962 ..
Tanzania 0.194 0.284 0.339 0.003 7.274 2.498 0.276 8.326 5.608 ..
Uganda .. .. .. 0.052 0.073 7.238 2.608 8.548 8.721 ..
Cameroon .. .. .. 0.066 0.947 1.787 1.400 6.351 16.427 ..
Ghana .. .. .. .. .. 0.411 0.212 1.034 4.893 ..

Addressing developing countries’ challenges in free trade implementation
37
Côte d'Ivoire 0.015 0.132 .. .. 0.006 0.005 0.166 0.024 0.05 ..
Papua New Guinea .. .. .. 0.128 0.553 0.399 .. .. .. ..
Fiji .. .. .. .. .. .. .. .. 0.013 ..
Benin 0.013 0.005 0.1 .. .. .. .. .. .. ..
Burkina Faso .. .. 0.124 0.001 0.023 .. .. .. .. ..
Guinea-Bissau 0.038 .. .. 0.350 0.149 0.370 0.366 0.066 .. ..
Mauritania .. .. .. .. 0.007 .. 0.6 0.313 0.652 ..
Mali 0.008 .. 0.329 0.813 0.483 0.317 .. .. 0.426 ..
Niger 0.017 .. .. 0.001 .. .. .. .. .. ..
Senegal 0.008 .. .. 0.012 8.031 0.924 1.118 1.308 0.918 ..
Sierra Leone .. .. .. .. 0.146 1.062 .. .. .. ..
Togo 0.008 .. .. .. .. .. .. .. .. ..
Source: OECD Creditor Reporting System (CRS).

Policy Department, Directorate-General for External Policies
38
TRADE-RELATED ADJUSTMENT 33150, GROSS DISBURSEMENTS FROM DAC EU MEMBERS AND EC , 2006 – 15 (USD MILLIONS 2014) Country 2006 2007 2008 2009 2010 2011 2012 2013 2014 2015
Benin 0.070 Burkina Faso 0.016 Burundi 1.055 Cameroon 0.031 Cote d’Ivoire 2.22 The Gambia 1.572
Guinea Bissau 0.395 Madagascar 0.993 Mauritania 0.614 Rwanda 8.936 Senegal 10.778 Sierra Leone 0.106
Tanzania 5.213 0.482 0.009 Togo 6.103 0.392
Zimbabwe 4.391 Dominica 0.111
Grenada 0.509 Jamaica 0.916 3.276 21.958
Saint Lucia 11.033 5.807 Saint Vincent and the Grenadines 5.798 0.315
Papua New Guinea 1.094
Source: OECD Creditor Reporting System (CRS).

Addressing developing countries’ challenges in free trade implementation
39
RELEVANT EPA TEXTS
Central Africa
Article 10 Co-operation on fiscal adjustment
1. The Parties recognise the challenges which the elimination or substantial reduction of the customs duties provided for in this Agreement may pose for signatory Central African States, and they agree to establish a dialogue and cooperation in this area. 2. In the light of the dismantling schedule approved by the Parties to this Agreement, the latter agree to establish an in-depth dialogue on the fiscal adjustment measures to be taken which could restore budget balance in the long term. 3. Further to paragraphs 1 and 2 of this Article, the Parties agree to cooperate, within the framework of Article 7, and undertake to implement technical and financial assistance measures in the following areas: (a) contribution to absorbing the net fiscal impact in full complementarity with the fiscal reforms; (b) support for fiscal reform together with dialogue in this area. 4. The Parties undertake to agree, within the EPA Committee and as soon as possible, on the methodology for estimating net fiscal impact. In this same context the Parties shall subsequently agree on the complementary measures and studies to be undertaken.
EAC
Article 100 Areas of Cooperation
1. With regard to revenue losses linked to the reduction of tariffs, the EU shall: (a) engage in an enhanced dialogue on fiscal adaptation measures and reforms; (b) establish cooperation modalities to support fiscal reform; (c) provide financial resources to cover transitionally the agreed losses of government revenue arising from elimination and or substantial reduction in customs tariffs. 2. To ensure that the economies of the EAC Partner States take full advantage of this Agreement, the EU agrees to work with the EAC Partner States to undertake appropriate cooperation activities aiming at: (a) improving competitiveness of productive sectors within EAC Partner States; (b) improving productive and professional capacities of the workforce of EAC Partner States including training of workers displaced with closure of firms or equipping them with new skills for new activities etc.; (c) supporting measures towards sustainable environment; (d) building capacity to enhance macro-economic discipline; (e) mitigating the possible impacts affecting food and nutrition security, rural development, livelihood security and export earnings in the EAC Partner States; (f) addressing other possible cooperation areas related to the implementation challenges of this Agreement.
TITLE X: RESOURCE MOBILISATION
Article 101 Principles and objectives
1. Recognising the EU’s commitment to support the implementation of this Agreement and the EAC Partner States own efforts to financing their development needs, the Parties agree to work both jointly and

Policy Department, Directorate-General for External Policies
40
independently to mobilise financial resources to support the implementation of this Agreement, regional integration and EAC Partner States’ development strategies. 2. The objective of joint resource mobilisation is to complement, support and promote in the spirit of interdependence, the efforts of the EAC Partner States in pursuing alternative sources of funding to support regional integration and the development strategies, in particular the EPA Development Matrix, contained in this Agreement.
Article 102 Obligations
1. The EAC Partner States shall: (a) commit resources from their financing mechanisms on a timely and predictable basis to support regional integration and the EPA related development strategies and projects as contained in the EPA Development Matrix; (b) develop their development strategies with due regard for the right of the EAC Partner States to determine the direction and the sequence of their development strategies and priorities; (c) establish an EPA fund to channel EPA related resources; (d) incorporate the priorities of the EPA Development Matrix in regional and national strategies. 2. The EAC Partner States shall formulate rules and regulations for the management of the Fund to ensure transparency, accountability and value for money in the utilisation of these resources. Without prejudice to other partners’ contributions to the EAC EPA Fund, the channelling of the EU resources will be made provisional on a successful assessment of the Fund’s operating procedures by the EU. 3. The EU shall commit resources on a timely and predictable basis taking particularly into account the supply side constraints of the EAC Partner States linked to the implementation of this Agreement, including financing gaps identified in the EPA Development Matrix, through: (a) the European Development Fund (EDF) (national and regional facilities); (b) the EU Budget; (c) any other instrument that will be used to implement EU’s Official Development Assistance (ODA). In addition, the EU shall work towards mobilising resources in a timely and predictable manner from its Member States. 4. The Parties shall jointly commit to work towards mobilising the following resources: (a) funds of other donors (multilateral and bilateral donors); (b) grants, concessional loans, public-private partnerships, and specialised facilities; (c) any other ODA resources available from development partners.
ECOWAS
Article 55 The EPA Development Programme
To support the autonomous efforts of the region to ensure its development, the Parties shall make the financial and technical arrangements necessary for implementation of the EPA Development Programme and achievement of its objectives, in accordance with the provisions of Article 54 of this Agreement, in order to give concrete form to the development aspect hereof.
Article 56 Objectives of the EPA Development Programme
1. The EPA Development Programme is part of a long-term vision for the achievement of the development

Addressing developing countries’ challenges in free trade implementation
41
objectives of this Agreement. Its overall objective is to build a regional economy that is competitive, harmoniously integrated with the world economy and stimulates growth and sustainable development. Consistency shall be established between the EPA Development Programme and the aid for trade programme for the West African region and regional strategies for the regional economic and sectoral development of this region. 2. The specific objective to be attained by the EPA Development Programme is to enable the West African region to fully benefit from the opportunities offered by the EPA and to meet the adjustment costs and face the challenges associated with implementation of this Agreement. 3. To this end, the EPA Development Programme must contribute to: (a) the achievement of rapid, sustained economic growth that creates jobs and contributes to sustainable development and reducing poverty in the West African region; (b) increasing the diversity and competitiveness of the economies of the West African region; (c) increasing the population's output and income; (d) deepening the process of regional integration and increasing intra-regional trade; (e) increasing the market shares of the West African region on the European market through such measures as improving access to the said market; (f) promoting investment in West Africa, partnership between the private sectors of the European Union and West Africa and improving the business environment in the West African region.
Article 57 Goals of the EPA Development Programme
The areas for action covered by the EPA Development Programme are based on five goals: (a) diversifying and increasing production capacities; (b) developing intra-regional trade and facilitating access to international markets; (c) improving and reinforcing national and regional infrastructures linked to trade; (d) making essential adjustments and taking account of other needs linked to trade; (e) implementation and monitoring/evaluation of the EPA by the West African region.
Article 58 EPA Development Programme implementation arrangements
1. The EPA Development Programme is the subject of Protocol No. 3 set out in Annex F to this Agreement, and which is an integral part hereof. The arrangements for the implementation of the EPA Development Programme are defined in that Protocol. 2. The EPA Development Programme shall be implemented through a matrix of activities combined with a financial assessment, a schedule and indicators for monitoring implementation. The matrix of activities shall be covered by a financial commitment by the European Union and its Member States to implement it, in accordance with the provisions of Article 54 of this Agreement. 3. The EPA Development Programme shall be subject to assessment at intervals agreed between the Parties. The EPA Development Programme shall be revised regularly on the basis of the results of its implementation and the impact of this Agreement. To this end, an arrangement based on jointly defined indicators shall make it possible to continuously monitor implementation of the EPA Development Programme and assess its impact. 4. As part of the joint assessment referred to in paragraph 3 of this Article, the Parties shall look for synergies between the rate of implementation of the commitments made by the West African region and the progress made in carrying out the activities and programmes of the EPA Development Programme, in
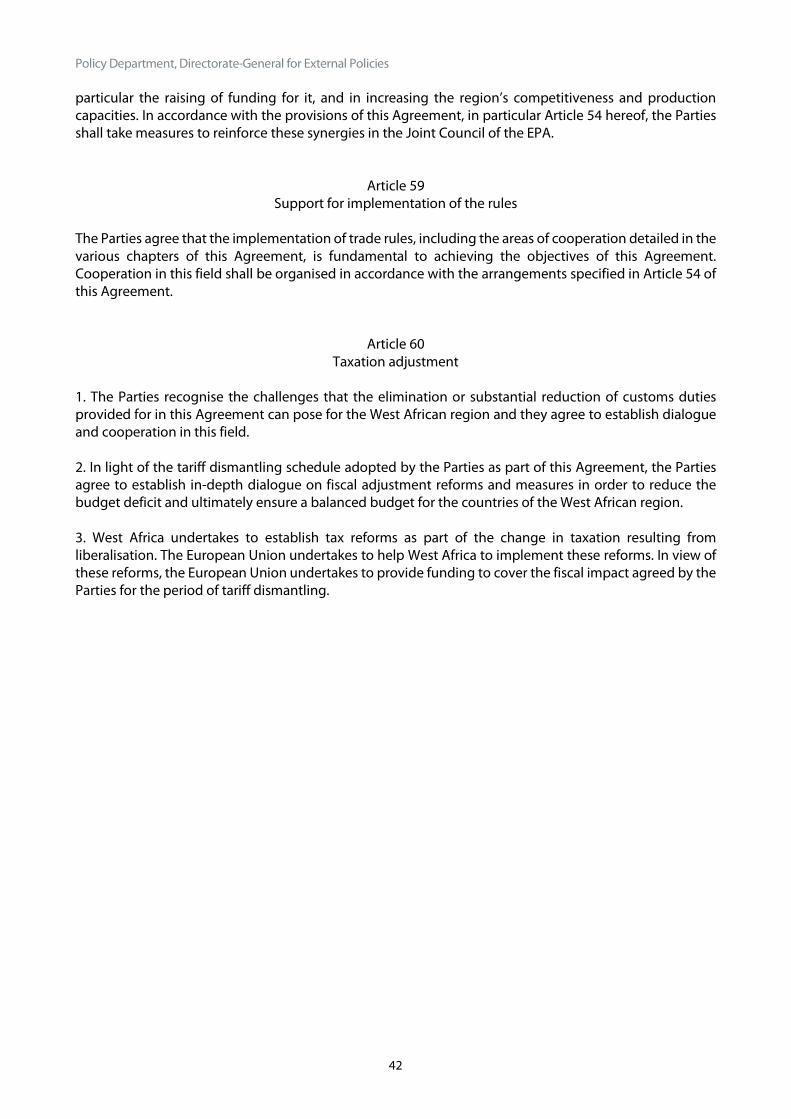
Policy Department, Directorate-General for External Policies
42
particular the raising of funding for it, and in increasing the region’s competitiveness and production capacities. In accordance with the provisions of this Agreement, in particular Article 54 hereof, the Parties shall take measures to reinforce these synergies in the Joint Council of the EPA.
Article 59 Support for implementation of the rules
The Parties agree that the implementation of trade rules, including the areas of cooperation detailed in the various chapters of this Agreement, is fundamental to achieving the objectives of this Agreement. Cooperation in this field shall be organised in accordance with the arrangements specified in Article 54 of this Agreement.
Article 60 Taxation adjustment
1. The Parties recognise the challenges that the elimination or substantial reduction of customs duties provided for in this Agreement can pose for the West African region and they agree to establish dialogue and cooperation in this field. 2. In light of the tariff dismantling schedule adopted by the Parties as part of this Agreement, the Parties agree to establish in-depth dialogue on fiscal adjustment reforms and measures in order to reduce the budget deficit and ultimately ensure a balanced budget for the countries of the West African region. 3. West Africa undertakes to establish tax reforms as part of the change in taxation resulting from liberalisation. The European Union undertakes to help West Africa to implement these reforms. In view of these reforms, the European Union undertakes to provide funding to cover the fiscal impact agreed by the Parties for the period of tariff dismantling.
