the impacts of roll-on/roll-off transport system in the ... · it is well recognized in the...
TRANSCRIPT
For comments, suggestions or further inquiries please contact:
Philippine Institute for Development Studies Surian sa mga Pag-aaral Pangkaunlaran ng Pilipinas
The PIDS Discussion Paper Series constitutes studies that are preliminary and subject to further revisions. They are being circulated in a limited number of copies only for purposes of soliciting comments and suggestions for further refinements. The studies under the Series are unedited and unreviewed.
The views and opinions expressed are those of the author(s) and do not necessarily reflect those of the Institute.
Not for quotation without permission from the author(s) and the Institute.
The Research Information Staff, Philippine Institute for Development Studies 18th Floor, Three Cyberpod Centris – North Tower, EDSA corner Quezon Avenue, 1100 Quezon City, Philippines Tel Numbers: (63-2) 3721291 and 3721292; E-mail: [email protected] visit our website at http://www.pids.gov.ph
The Impacts of Roll-On/Roll-Off Transport System in the Philippines
DISCUSSION PAPER SERIES NO. 2017-22
Kris A. Francisco
June 2017
The Impacts of Roll-on/Roll-off (Ro-Ro) Transport System in the Philippines
Kris Francisco1
Abstract
It is well recognized in the literature that a country’s transport system plays a central role in its
development. In this paper, we show the economic impacts of improvements in the transport system
by studying experience of the Philippines with the Roll-on/Roll-off (Ro-Ro) policy that promotes the
use of Ro-Ro ferry terminal system. Using difference-in-difference strategies in analyzing agricultural
household income and children’s education, we find that the operation of Ro-Ro ports largely
benefitted the households living near the Ro-Ro ports. More specifically, our estimates suggest that
agricultural households gained higher income from the operation of these ports because both
agriculture and non-agriculture related activities were stimulated. Our results also imply the boost in
non-agriculture related activities on the islands where the Ro-Ro ports are located. Meanwhile, our
analysis on children’s education reveals an increase in school attendance of males and females in
municipalities near the Ro-Ro ports. We likewise confirm that there was an increase in family income
in these areas, thereby suggesting the increased capacity of households to send children to school. As
a whole, our study demonstrates some examples of short-run and long-run impacts of improving a
country’s transport system. Likewise, it highlights the importance of an efficient and affordable
transport system in an archipelagic country like the Philippines.
Keywords: Transport system, Roll-on/Roll-off policy, Agriculture, Education
1 The paper was initially drafted when the author was working as a Research Analyst II at the Philippine Institute for Development Studies (PIDS). Data used in the analyses are property of PIDS.
1. Introduction
It has long been recognized that a country’s transport system plays a central role in its development.
Over the years, researchers have looked at the impact of investing in transport infrastructure and
produced numerous studies showing evidence of economic growth2, increases in productivity3 and
reduction of income inequality4. In an archipelagic setting like the Philippines however, the role of
transport system is more fundamental because it is needed to link the 7,500 islands together to
facilitate the movement of goods and services within the country. Moreover, it is essential in fostering
inclusive growth by connecting small island economies together and increasing the mobility of the
population.
The Philippine transport system is composed of road, railway, water and air; where road transport
accounts for 98 percent of passenger traffic and 58 percent of cargo traffic5 and water transport is the
dominant mode of inter-island transfer. Inter-island connectivity in the country is relatively weak and
is often blamed for its uneven economic development. Basilio et al. (2010) explains that the
consequences of weak inter-island connectivity are poverty and underdevelopment because it limits
trade opportunities and economic integration. Although achieving inclusive growth has always been a
priority goal of the government, much of the economic growth in the country is not felt by the poor
since they are mostly found in rural areas. The weak logistics network caused by the country’s
inadequate infrastructure remains as a critical constraint to the livelihood opportunities in rural
communities (ADB, 2012). A heavier impediment to rural development is the fact that most transport
infrastructure are located in Manila, which is the country’s capital city6. Data from the Philippine
Statistics Authority (PSA) shows that most of the economic growth in the country comes from the
National Capital Region (NCR), where Manila is located. In 2012 to 2014 for instance, the NCR
region contributed about 35-36 percent of growth, while the rest of the regions showed only less than
5 percent, except for Calabarzon, Central Luzon and Central Visayas7.
In 2003, a policy intervention was done to improve the connectivity of small island economies in the
Philippines. The government implemented the Roll-on/Roll-off (Ro-Ro) policy to establish a seamless
inter-island connectivity between Luzon, Visayas and Mindanao8, which aims to enhance local trade
and tourism. This policy was able to integrate the road with water transportation, by allowing the
vehicles to directly board the ship without unloading their cargo and be easily transferred from one
2 See for instance Easterly and Rebelo, 1993. 3 Studies such as Calderon and Serven, 2003, Demetriades and Mamuneas, 2000, Canning, 1999, Fernald, 1999, Baltagi and
Pinnoi, 1995, Holtz-Eakin, 1994, Aschauer, 1989. 4 Some examples are Estache, 2003, Brenneman and Kerf, 2002, Jalan and Ravallion, 2002, Galiani et al., 2002, Jacoby,
2000, Gannon and Liu, 1997, Lee et al., 1997, Lavy et al., 1996, Ferreira, 1995, Behrman & Wolfe, 1987. 5 Asian Development Bank. (2012). Philippines Transport Sector Assessment, Strategy and Road Map. Manila, Philippines. 6 See Lambino (2010) for a detailed discussion. 7 Accessed from http://nap.psa.gov.ph/grdp/datacharts.asp on 13 February 2017. 8 See Appendix 1 for a map of these major island groups.

island to another, through the Ro-Ro ferry terminal system (RRTS). The Ro-Ro policy was the
government’s attempt to expand the country’s transport system with minimal investment. Instead of
investing in new port infrastructure, the authorities allowed the conversion of existing ports into Ro-
Ro ports and encouraged private sector participation.
By definition, the RRTS is a network of Ro-Ro ferry terminals that link the country together through
Ro-Ro ships. This system is composed of three nautical highways namely Western, Central and
Eastern Nautical Highway, which started operation in 2003, 2008 and 2009, respectively. It also
borrows some links from the pre-existing Maharlika/Pan-Philippine Highway9. The RRTS was
essentially designed to reduce the cost of inter-island transfer within the country and serve as an
alternative option to the Load-on/Load-off (Lo-Lo) system. Prior to 2003, the Lo-Lo system is the
dominant mode of shipping. However, it was too costly for small-scale shippers as its containerized
method usually involves layers of fees for cargo handling and wharfage. By eliminating the need for
containerization, the RRTS significantly reduced the cost of inter-island shipping and travel time.
Estimates show that it was able to cut the travel time between Mindanao and Luzon by about 12
hours. It was also able to lower the cost of freight and passenger transport by about 30 percent and 40
percent, respectively (ADB, 2012). Furthermore, the operation of the RRTS expanded the scope of
regional markets by introducing new inter-island connections.
In this study, we aim to track the economic changes in areas near the Ro-Ro ports, to provide
empirical evidence on the impact of the Ro-Ro policy. More specifically, we seek to investigate two
things. First, we examine changes in agricultural household income. Our analysis is motivated by the
fact that one of the primary goals of implementing the Ro-Ro policy is to stimulate local trade by
reducing transport cost. Rationally, we expect that the operation of the Ro-Ro ports will immediately
affect the income of agricultural households in the short-run. Second, we aim to study the effect on
children’s education by looking at the changes in their school attendance. Our curiosity for this topic
arises from the possibility that welfare gains of parents can also be transferred to children through
human capital investment. In this analysis, our goal is to capture the long-term impact of the Ro-Ro
policy.
Our study will be useful to policymakers because it will serve as a reliable guide on the effectiveness
of the Ro-Ro policy. More importantly, it is the first to offer an empirical assessment on the economic
impacts of this policy as previous studies remain descriptive. The rest of our paper is organized as
follows: in Section 2, we explain the empirical strategies used for each of our topic then we cite of
data sources in Section 3. In section 4 we present our results and finally, give our conclusions in
Section 5.
9 See Appendix 2 for the map of these nautical highways.

2. Empirical Strategy
We investigate our each of our topics using two empirical models that are designed using difference-
in-difference (DID) structure from the seminal work of Ashenfelter and Card (1985). The advantage
of this empirical design is that it enables us to compare the differences in between our control and
treatment group before and after the Ro-Ro policy was implemented. We conduct our analysis at the
household level for agricultural household income, and at the municipality-level for children’s
education.
2.1. Agricultural Household Income
To analyze the impact of Ro-Ro ports on agricultural household income, we develop a DID model
that closely resembles the model of Bruhn and Love (2011). This model takes advantage of the cross-
time variation in Ro-Ro port operation. As previously mentioned, the nautical highways started
operating at different time periods beginning in 2003 until 2009. Hence, for every time period of our
panel data, we identify agricultural households that are near the newly-operational Ro-Ro ports at
construct a model that would be able to capture the variations in their income. We estimate our model
as:
𝑦𝑖𝑐𝑡 = 𝛼 + 𝛿(𝑑. 𝑦𝑒𝑎𝑟 ∗ 𝑅𝑜 − 𝑅𝑜𝑡) + 𝜋(𝑍𝑖𝑐𝑡) + 𝛾𝑐 + 𝛾𝑡 + 휀𝑖𝑐𝑡
where 𝑖 denotes households in municipality 𝑐 at time 𝑡. In the above equation, 𝑦 is our outcome
variable which represents agricultural household income; 𝑍 is a matrix of individual household
characteristics affecting income; 𝛾𝑐 and 𝛾𝑡 control for municipality and time fixed-effects and 휀𝑖𝑐𝑡 is
the idiosyncratic error. In our model, the variable 𝑑. 𝑦𝑒𝑎𝑟 is an indicator variable that accounts for
time periods included in our study. Likewise, 𝑅𝑜 − 𝑅𝑜𝑡 is an indicator variable that serves as our
treatment indicator; this is coded 1 if the agricultural household is near a Ro-Ro port and 0 if it is near
a non-Ro-Ro port. Since the operation of Ro-Ro ports started at different time periods, the interaction
𝑑. 𝑦𝑒𝑎𝑟 ∗ 𝑅𝑜 − 𝑅𝑜𝑡 captures the impact on income of being close to a Ro-Ro port for each of the year
included in our panel. Following this, our coefficient of interest is 𝛿, which captures the impact of
being close to a Ro-Ro port over time. Due the archipelagic structure of the Philippines, the effect of
distance from the Ro-Ro port is expected to vary if the agricultural household is on the same island as
the Ro-Ro port or not. To accommodate for this differential effect, we separately estimate our model
for agricultural households that are on the same island as the Ro-Ro port and agricultural households
on nearby islands.
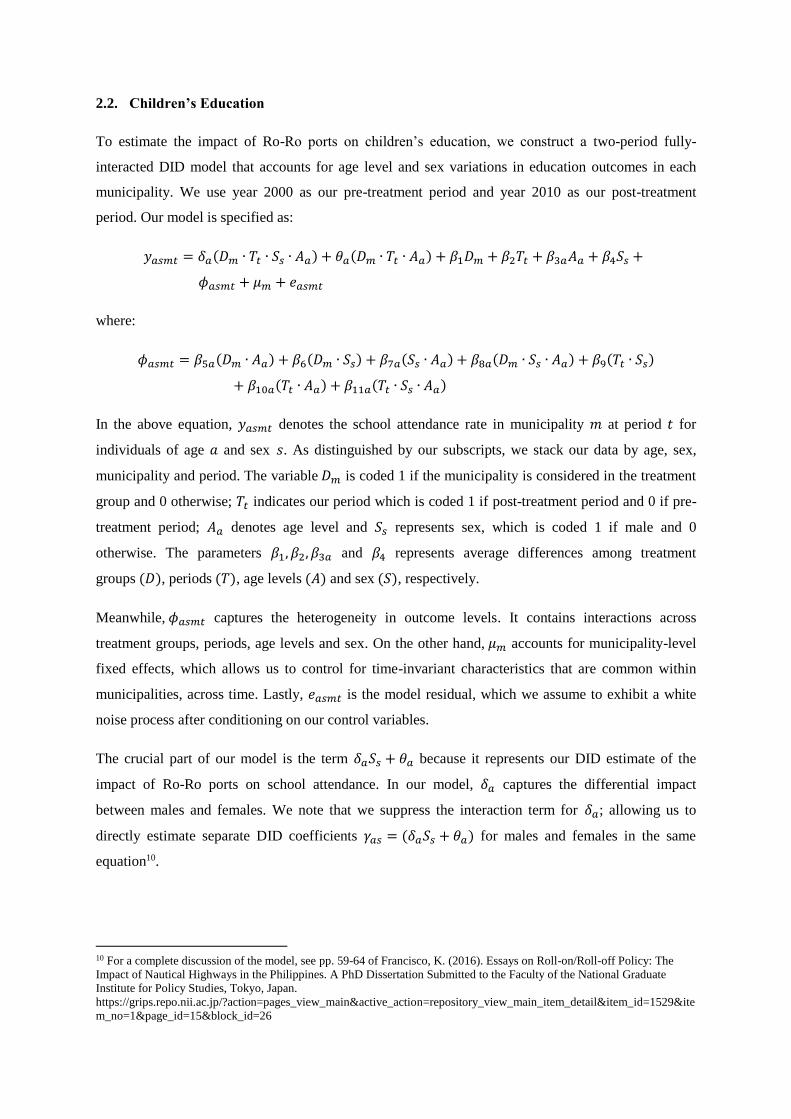
2.2. Children’s Education
To estimate the impact of Ro-Ro ports on children’s education, we construct a two-period fully-
interacted DID model that accounts for age level and sex variations in education outcomes in each
municipality. We use year 2000 as our pre-treatment period and year 2010 as our post-treatment
period. Our model is specified as:
𝑦𝑎𝑠𝑚𝑡 = 𝛿𝑎(𝐷𝑚 ∙ 𝑇𝑡 ∙ 𝑆𝑠 ∙ 𝐴𝑎) + 𝜃𝑎(𝐷𝑚 ∙ 𝑇𝑡 ∙ 𝐴𝑎) + 𝛽1𝐷𝑚 + 𝛽2𝑇𝑡 + 𝛽3𝑎𝐴𝑎 + 𝛽4𝑆𝑠 +
𝜙𝑎𝑠𝑚𝑡 + 𝜇𝑚 + 𝑒𝑎𝑠𝑚𝑡
where:
𝜙𝑎𝑠𝑚𝑡 = 𝛽5𝑎(𝐷𝑚 ∙ 𝐴𝑎) + 𝛽6(𝐷𝑚 ∙ 𝑆𝑠) + 𝛽7𝑎(𝑆𝑠 ∙ 𝐴𝑎) + 𝛽8𝑎(𝐷𝑚 ∙ 𝑆𝑠 ∙ 𝐴𝑎) + 𝛽9(𝑇𝑡 ∙ 𝑆𝑠)
+ 𝛽10𝑎(𝑇𝑡 ∙ 𝐴𝑎) + 𝛽11𝑎(𝑇𝑡 ∙ 𝑆𝑠 ∙ 𝐴𝑎)
In the above equation, 𝑦𝑎𝑠𝑚𝑡 denotes the school attendance rate in municipality 𝑚 at period 𝑡 for
individuals of age 𝑎 and sex 𝑠. As distinguished by our subscripts, we stack our data by age, sex,
municipality and period. The variable 𝐷𝑚 is coded 1 if the municipality is considered in the treatment
group and 0 otherwise; 𝑇𝑡 indicates our period which is coded 1 if post-treatment period and 0 if pre-
treatment period; 𝐴𝑎 denotes age level and 𝑆𝑠 represents sex, which is coded 1 if male and 0
otherwise. The parameters 𝛽1, 𝛽2, 𝛽3𝑎 and 𝛽4 represents average differences among treatment
groups (𝐷), periods (𝑇), age levels (𝐴) and sex (𝑆), respectively.
Meanwhile, 𝜙𝑎𝑠𝑚𝑡 captures the heterogeneity in outcome levels. It contains interactions across
treatment groups, periods, age levels and sex. On the other hand, 𝜇𝑚 accounts for municipality-level
fixed effects, which allows us to control for time-invariant characteristics that are common within
municipalities, across time. Lastly, 𝑒𝑎𝑠𝑚𝑡 is the model residual, which we assume to exhibit a white
noise process after conditioning on our control variables.
The crucial part of our model is the term 𝛿𝑎𝑆𝑠 + 𝜃𝑎 because it represents our DID estimate of the
impact of Ro-Ro ports on school attendance. In our model, 𝛿𝑎 captures the differential impact
between males and females. We note that we suppress the interaction term for 𝛿𝑎; allowing us to
directly estimate separate DID coefficients 𝛾𝑎𝑠 = (𝛿𝑎𝑆𝑠 + 𝜃𝑎) for males and females in the same
equation10.
10 For a complete discussion of the model, see pp. 59-64 of Francisco, K. (2016). Essays on Roll-on/Roll-off Policy: The
Impact of Nautical Highways in the Philippines. A PhD Dissertation Submitted to the Faculty of the National Graduate
Institute for Policy Studies, Tokyo, Japan.
https://grips.repo.nii.ac.jp/?action=pages_view_main&active_action=repository_view_main_item_detail&item_id=1529&ite
m_no=1&page_id=15&block_id=26
2.3. Treatment Identification
The treatment assignment for each of our DID models follows the same distance-based principle.
Since the analysis for agricultural household income is performed at the household-level and the
analysis for children’s education is performed at the municipality-level, we locate each agricultural
household and municipality based on their geographic locations. We similarly locate the geographic
locations of our Ro-Ro and non Ro-Ro ports. Using these information, we calculate the geographic
distances of each agricultural household and municipality relative to a Ro-Ro and non Ro-Ro port by
employing the straight line distance formula specified as: 𝑑 = √(𝑥2 − 𝑥1)2 + (𝑦2 − 𝑦1)2.
After computing for relative distances of all our agricultural households and municipalities from the
nearest Ro-Ro port and nearest non Ro-Ro ports, we compare the two values and keep the smallest
one. If the distance from the nearest Ro-Ro port < distance from the nearest non Ro-Ro port, then we
assign the agricultural household or municipality to the treatment group. Conversely, if the distance
from the nearest Ro-Ro port > distance from the nearest non Ro-Ro port, then we assign the
agricultural household or municipality to the control group.
3. Data
We primarily utilize nationally-representative surveys sourced from the Philippine Statistics Authority
(PSA) to analyze our two topics. For the analysis on agricultural household income, we use the data
from the Family Income and Expenditure Survey (FIES), which contains information about family-
level income as well as characteristics of each household and household head. Since the Ro-Ro port
operation started from 2003 until 2009, we use survey data for years 2003, 2006 and 2009. We deflate
all income variables using region and year-specific consumer price index for all commodities, also
sourced from the PSA.
Meanwhile, we use the Census of Population and Housing (CPH) survey for the analysis on children’s
education. The purpose of the CPH survey is to provide an inventory of size and population of the
Philippines. It has information on demographic, social, economic and cultural characteristics of the
population. We construct a municipality-level pseudo panel for years 2000 and 2010 using the CPH
data, where we calculate the proportion of school attendance of 5 to 21 years old in each municipality.
Our list of non-Ro-Ro and Ro-Ro ports are based on the Philippine Ports Inventory published by the
PSA and the Ro-Ro handbook requested from the Philippine Ports Authority (PPA). These
publications provide us the location of the ports based on administrative division. Additionally, we
use the Philippine Standard Geographic Code (PSGC), which gives us the codes for the corresponding
administrative division. Furthermore, we exploit the Data Kit of Official Philippine Statistics
Mean Std. Dev. Min Max
Total Family Income 6.1938 0.5751 4.1111 9.9106
Total Income from Agri 5.9069 0.5913 3.5220 9.4046
Total Income from Non-Agri 4.5075 0.9867 0.4334 8.9871
Conrol variables:
Household labor force 3.8464 1.2486 0 10
Years of education of household head 6.2306 3.3089 0 15
Sex of household head 0.9229 0.2668 0 1
Age of household head 47 13 17 98
Household electricity 0.5454 0.4980 0 1
Household with car 0.0242 0.1536 0 1
Household with motor 0.0507 0.2194 0 1
Treatment Control Treatment Control
Mean 0.6559 0.6731 0.7075 0.7035
Std. error (0.2520) (0.2450) (0.2734) (0.2732)
N 15470 36829 15470 36829
Pre-treatment (2000) Post-treatment (2010)
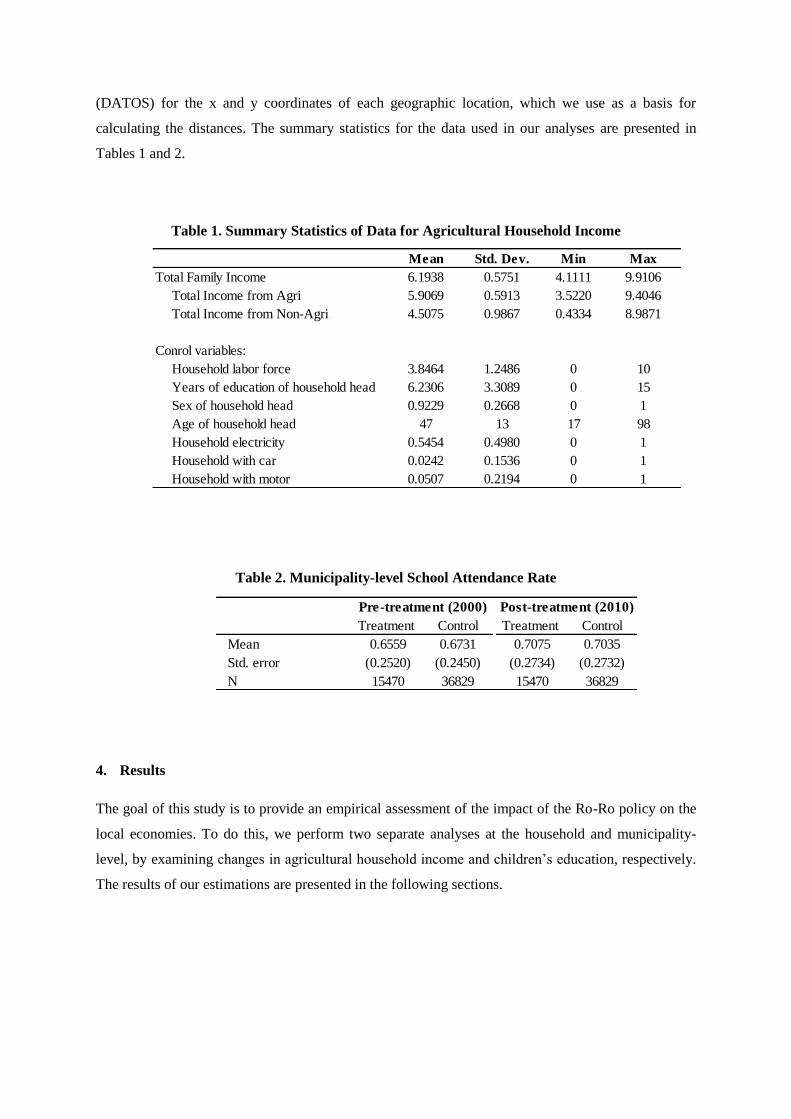
(DATOS) for the x and y coordinates of each geographic location, which we use as a basis for
calculating the distances. The summary statistics for the data used in our analyses are presented in
Tables 1 and 2.
Table 1. Summary Statistics of Data for Agricultural Household Income
Table 2. Municipality-level School Attendance Rate
4. Results
The goal of this study is to provide an empirical assessment of the impact of the Ro-Ro policy on the
local economies. To do this, we perform two separate analyses at the household and municipality-
level, by examining changes in agricultural household income and children’s education, respectively.
The results of our estimations are presented in the following sections.

4.1. Agricultural Household Income
Our analysis on agricultural household income is important because these households comprise the
poorest segment of the Philippine population. Agricultural households usually live in rural areas,
where poverty is considerably higher (39.4 percent) than the national average (26.5 percent)11. The
causes of rural poverty are mainly attributed to the decline in productivity in agriculture, lack of
access to finance and lack of non-farm income-generating options12. In this section we explore how a
more efficient transport system affects the income of agricultural households.
The results of our estimation are shown in Table 3. In the first column, we notice that our estimates
seem to suggest that agricultural households living near the Ro-Ro ports gained higher income in
2006 and 2009. As we can see from the table, the increase in income is higher in 2009 than in 2006.
This observation may be explained by the increase in Ro-Ro connections towards 2009, where the
full-scale operation of the Ro-Ro system may have had a bigger impact. Nevertheless, we observe the
short-run effect of the Ro-Ro policy on agricultural household income.
In the next two columns, we disaggregate total family income into: (a) total income from agriculture
and (b) total income from non-agriculture-related sources to understand which of these sources caused
the increase. Based on our estimates, we observe that both incomes from agriculture and non-
agriculture sources were stimulated by the Ro-Ro port operation. However, we notice that the increase
in income from non-agriculture sources appear to be higher. Our findings are consistent with that of
Escobal (2001) and Malmberg et al (1997) which reveal that the access of rural households to
transport infrastructure contributes to the profitability of both farm and non-farm sectors, thereby
providing opportunities to the local population. What is interesting with our results is that it suggests
that the operation of Ro-Ro ports allowed for non-agriculture-related opportunities for agricultural
households. A study (Fan and Rao, 2002) explains the importance of non-farm opportunities as it
helped the poor survived during the post-green revolution in many Asian countries. As mentioned
earlier, one of the causes of rural poverty is the lack of non-farm opportunities. Thus, having
additional income-generating opportunities will allow agricultural households to devote their time on
more productive activities or diversify their sources of income.
11 World Bank. 2014. Country Partnership Strategy for the Republic of the Philippines, FY 2015–2018. Washington, D.C. 12 See International Fund for Agricultural Development. Investing in Rural People in the Philippines. Accessed from
https://www.ifad.org/documents/10180/3407a4bc-4505-4c7a-bcc4-edb5f0bc3819 on 28 February 3017.
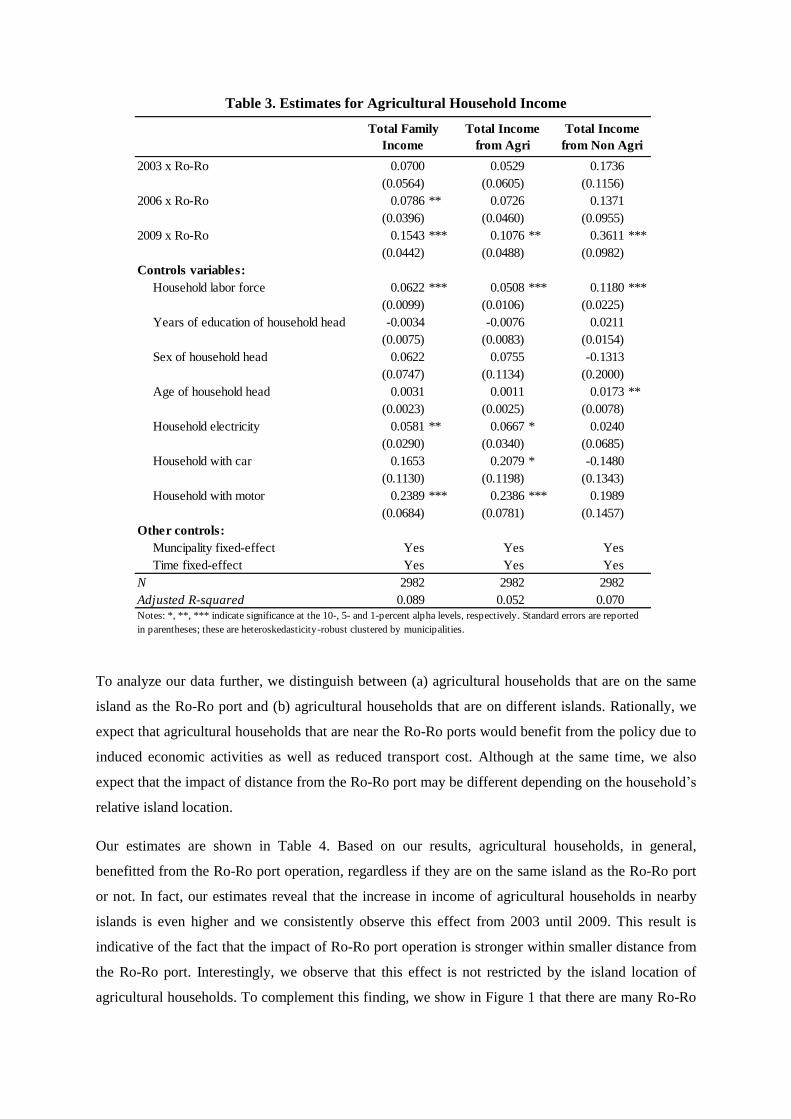
Table 3. Estimates for Agricultural Household Income
To analyze our data further, we distinguish between (a) agricultural households that are on the same
island as the Ro-Ro port and (b) agricultural households that are on different islands. Rationally, we
expect that agricultural households that are near the Ro-Ro ports would benefit from the policy due to
induced economic activities as well as reduced transport cost. Although at the same time, we also
expect that the impact of distance from the Ro-Ro port may be different depending on the household’s
relative island location.
Our estimates are shown in Table 4. Based on our results, agricultural households, in general,
benefitted from the Ro-Ro port operation, regardless if they are on the same island as the Ro-Ro port
or not. In fact, our estimates reveal that the increase in income of agricultural households in nearby
islands is even higher and we consistently observe this effect from 2003 until 2009. This result is
indicative of the fact that the impact of Ro-Ro port operation is stronger within smaller distance from
the Ro-Ro port. Interestingly, we observe that this effect is not restricted by the island location of
agricultural households. To complement this finding, we show in Figure 1 that there are many Ro-Ro
2003 x Ro-Ro 0.0700 0.0529 0.1736
(0.0564) (0.0605) (0.1156)
2006 x Ro-Ro 0.0786 ** 0.0726 0.1371
(0.0396) (0.0460) (0.0955)
2009 x Ro-Ro 0.1543 *** 0.1076 ** 0.3611 ***
(0.0442) (0.0488) (0.0982)
Controls variables:
Household labor force 0.0622 *** 0.0508 *** 0.1180 ***
(0.0099) (0.0106) (0.0225)
Years of education of household head -0.0034 -0.0076 0.0211
(0.0075) (0.0083) (0.0154)
Sex of household head 0.0622 0.0755 -0.1313
(0.0747) (0.1134) (0.2000)
Age of household head 0.0031 0.0011 0.0173 **
(0.0023) (0.0025) (0.0078)
Household electricity 0.0581 ** 0.0667 * 0.0240
(0.0290) (0.0340) (0.0685)
Household with car 0.1653 0.2079 * -0.1480
(0.1130) (0.1198) (0.1343)
Household with motor 0.2389 *** 0.2386 *** 0.1989
(0.0684) (0.0781) (0.1457)
Other controls:
Muncipality fixed-effect Yes Yes Yes
Time fixed-effect Yes Yes Yes
N 2982 2982 2982
Adjusted R-squared 0.089 0.052 0.070
Total Family
Income
Total Income
from Agri
Total Income
from Non Agri
Notes: *, **, *** indicate significance at the 10-, 5- and 1-percent alpha levels, respectively. Standard errors are reported
in parentheses; these are heteroskedasticity-robust clustered by municipalities.
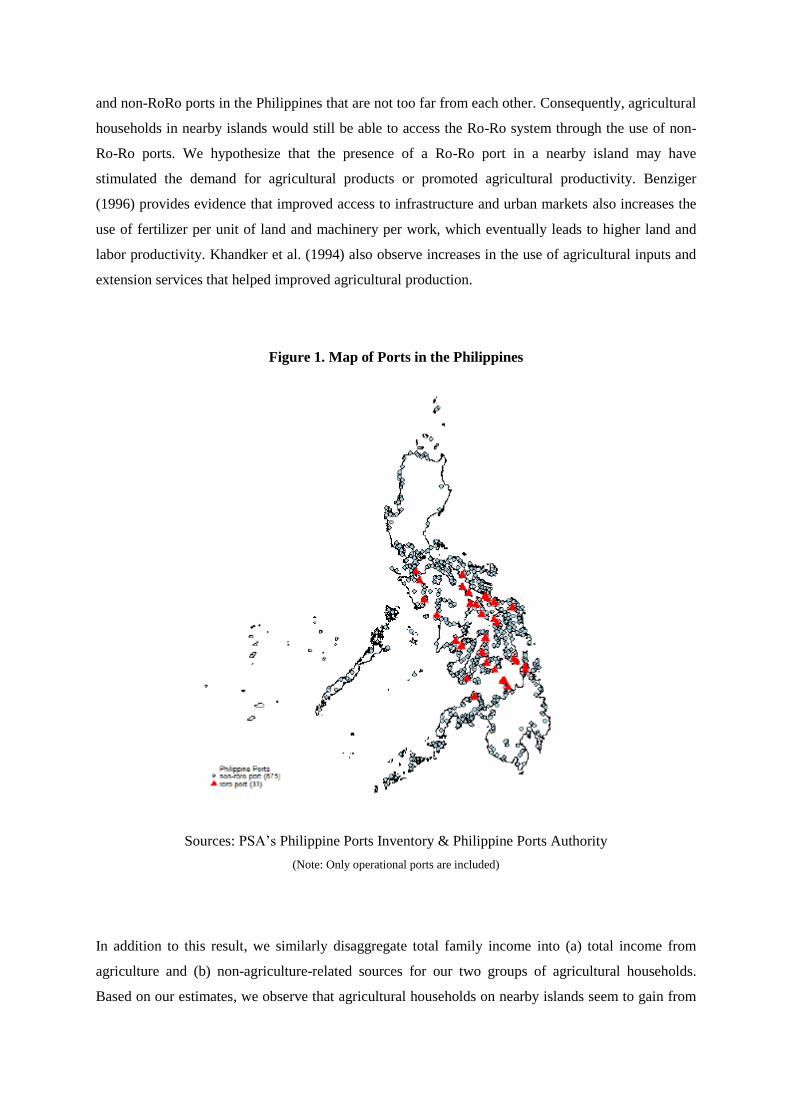
and non-RoRo ports in the Philippines that are not too far from each other. Consequently, agricultural
households in nearby islands would still be able to access the Ro-Ro system through the use of non-
Ro-Ro ports. We hypothesize that the presence of a Ro-Ro port in a nearby island may have
stimulated the demand for agricultural products or promoted agricultural productivity. Benziger
(1996) provides evidence that improved access to infrastructure and urban markets also increases the
use of fertilizer per unit of land and machinery per work, which eventually leads to higher land and
labor productivity. Khandker et al. (1994) also observe increases in the use of agricultural inputs and
extension services that helped improved agricultural production.
Figure 1. Map of Ports in the Philippines
Sources: PSA’s Philippine Ports Inventory & Philippine Ports Authority
(Note: Only operational ports are included)
In addition to this result, we similarly disaggregate total family income into (a) total income from
agriculture and (b) non-agriculture-related sources for our two groups of agricultural households.
Based on our estimates, we observe that agricultural households on nearby islands seem to gain from
2003 x Ro-Ro 0.0344 0.4483 *** 0.0169 0.3989 *** 0.1638 0.4796
(0.0626) (0.1078) (0.0680) (0.1289) (0.1279) (0.4202)
2006 x Ro-Ro 0.0637 0.2937 *** 0.0590 0.3236 ** 0.1333 0.1831
(0.0411) (0.0869) (0.0476) (0.1581) (0.1023) (0.4520)
2009 x Ro-Ro 0.1490 *** 0.3579 ** 0.1019 ** 0.3320 0.3466 *** 0.5497
(0.0451) (0.1764) (0.0505) (0.2204) (0.1048) (0.4855)
Controls variables:
Household labor force 0.0604 *** 0.0592 *** 0.0491 *** 0.0484 ** 0.1123 *** 0.1297 ***
(0.0116) (0.0191) (0.0126) (0.0192) (0.0277) (0.0384)
Years of education of household head -0.0050 -0.0042 -0.0112 -0.0047 0.0247 0.0136
(0.0084) (0.0158) (0.0097) (0.0173) (0.0181) (0.0273)
Sex of household head 0.0516 0.1823 0.1117 0.0898 -0.2263 0.0515
(0.0939) (0.1139) (0.1267) (0.2037) (0.1675) (0.5063)
Age of household head 0.0035 0.0036 -0.0003 *** 0.0052 0.0237 0.0037
(0.0024) (0.0056) (0.0030) (0.0045) (0.0072) (0.0211)
Household electricity 0.0589 * 0.0375 0.0643 0.0555 0.0520 -0.0819
(0.0326) (0.0647) (0.0393) (0.0689) (0.0827) (0.1272)
Household with car 0.3329 ** 0.0270 0.3304 0.1063 0.2215 -0.4233 ***
(0.1626) (0.1259) (0.2145) (0.1199) (0.2498) (0.0855)
Household with motor 0.1930 *** 0.3577 * 0.1947 *** 0.3324 0.1792 0.3087
(0.0615) (0.1862) (0.0677) (0.2190) (0.1523) (0.3425)
Other controls:
Muncipality fixed-effect Yes Yes Yes Yes Yes Yes
Time fixed-effect Yes Yes Yes Yes Yes Yes
N 2208 774 2208 774 2208 774
Adjusted R-squared 0.094 0.102 0.050 0.066 0.080 0.056Notes: *, **, *** indicate significance at the 10-, 5- and 1-percent alpha levels, respectively. Standard errors are reported in parentheses; these are
heteroskedasticity-robust clustered by municipalities.
Total Family Income Total Income from AgriTotal Income from Non
Agri
Same islandNot same
islandSame island
Not same
islandSame island
Not same
island
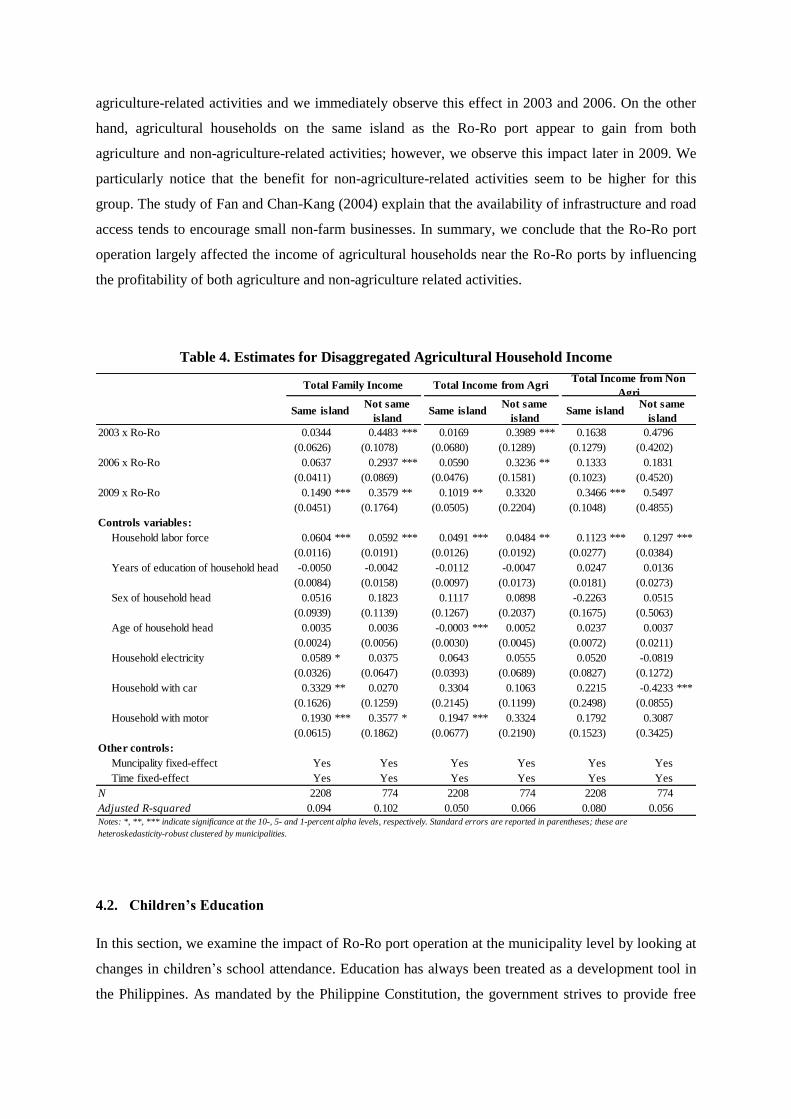
agriculture-related activities and we immediately observe this effect in 2003 and 2006. On the other
hand, agricultural households on the same island as the Ro-Ro port appear to gain from both
agriculture and non-agriculture-related activities; however, we observe this impact later in 2009. We
particularly notice that the benefit for non-agriculture-related activities seem to be higher for this
group. The study of Fan and Chan-Kang (2004) explain that the availability of infrastructure and road
access tends to encourage small non-farm businesses. In summary, we conclude that the Ro-Ro port
operation largely affected the income of agricultural households near the Ro-Ro ports by influencing
the profitability of both agriculture and non-agriculture related activities.
Table 4. Estimates for Disaggregated Agricultural Household Income
4.2. Children’s Education
In this section, we examine the impact of Ro-Ro port operation at the municipality level by looking at
changes in children’s school attendance. Education has always been treated as a development tool in
the Philippines. As mandated by the Philippine Constitution, the government strives to provide free

basic education so that its population will be able to find suitable employment and contribute to
economic growth. The tangency between Ro-Ro ports and children’s education therefore, is important
because most of the Ro-Ro ports are located in the Visayas as well as Mindanao areas (see Appendix
1), where poverty and underdevelopment issues are widespread.
The results are shown in Table 4. Our estimates reveal that there were significant increases in school
attendance of both males and females in municipalities near the Ro-Ro ports. We consistently observe
this increase for males from age 6 to 20; while for females from age 5 to 7 and age 13 to 21. Our
finding on increased school attendance of males is encouraging because it tells us that males are
attending school instead of working to help their families. This problem is highly persistent in
impoverished areas such as rural communities and urban slums where school-age males would usually
quit schooling to help their parents earn money. On the contrary, work opportunities for school-age
females are highly scarce. Several studies (Johanson, 1999, Orbeta, 2003) note that the school
attendance and educational attainment of females in the Philippines are historically higher than that of
males because of the lack of work opportunities for them. As we can observe from our results, school
attendance increased for females of age 5 and 21. This is because they are enrolled in school earlier
and usually proceed to higher levels of education. Our finding is reflective of the fact that education is
perceived to have higher returns for females in the Philippines (Sakellariou, 2004; Quisumbing et. al.,
2004).
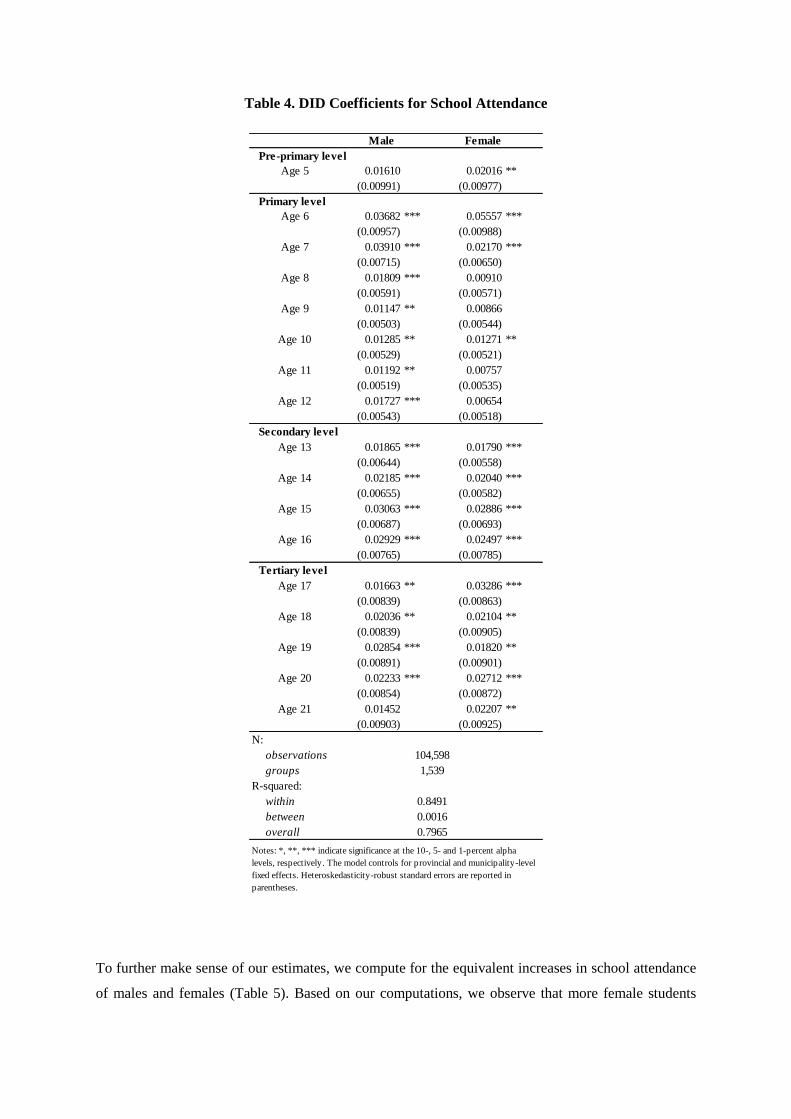
Table 4. DID Coefficients for School Attendance
To further make sense of our estimates, we compute for the equivalent increases in school attendance
of males and females (Table 5). Based on our computations, we observe that more female students
Pre-primary level
Age 5 0.01610 0.02016 **
(0.00991) (0.00977)
Primary level
Age 6 0.03682 *** 0.05557 ***
(0.00957) (0.00988)
Age 7 0.03910 *** 0.02170 ***
(0.00715) (0.00650)
Age 8 0.01809 *** 0.00910
(0.00591) (0.00571)
Age 9 0.01147 ** 0.00866
(0.00503) (0.00544)
Age 10 0.01285 ** 0.01271 **
(0.00529) (0.00521)
Age 11 0.01192 ** 0.00757
(0.00519) (0.00535)
Age 12 0.01727 *** 0.00654
(0.00543) (0.00518)
Secondary level
Age 13 0.01865 *** 0.01790 ***
(0.00644) (0.00558)
Age 14 0.02185 *** 0.02040 ***
(0.00655) (0.00582)
Age 15 0.03063 *** 0.02886 ***
(0.00687) (0.00693)
Age 16 0.02929 *** 0.02497 ***
(0.00765) (0.00785)
Tertiary level
Age 17 0.01663 ** 0.03286 ***
(0.00839) (0.00863)
Age 18 0.02036 ** 0.02104 **
(0.00839) (0.00905)
Age 19 0.02854 *** 0.01820 **
(0.00891) (0.00901)
Age 20 0.02233 *** 0.02712 ***
(0.00854) (0.00872)
Age 21 0.01452 0.02207 **
(0.00903) (0.00925)
N:
observations
groups
R-squared:
within
between
overall
Male Female
104,598
Notes: *, **, *** indicate significance at the 10-, 5- and 1-percent alpha
levels, respectively. The model controls for provincial and municipality-level
fixed effects. Heteroskedasticity-robust standard errors are reported in
parentheses.
1,539
0.8491
0.0016
0.7965

(about 4,548) are enrolled at the pre-primary level in municipalities near the Ro-Ro ports. We
highlight that we observe a higher number of males attending primary and secondary level (about
35,395 and 23, 162, respectively). Evidently, females still dominate the tertiary level with a 22,741
increase in school attendance. Overall, we attribute about 83, 2017 and 74, 637 increases in school
attendance of males and females, respectively, to the Ro-Ro port operation. Our finding is similar
with Levy (1996) who finds increases in enrollment rate of children in rural areas, as one of the effect
of road improvements in Morocco.
What our results show is that the Ro-Ro policy was able to generate a relatively long-term impact on
local economies. It particularly exhibits that the opportunities gained by households from the Ro-Ro
port operation were reallocated to their children in the form of human capital investment. Education is
known to increase the quality of the work force. Hence, a better educated future work force will
benefit local economies in the long-run.
Table 5. Equivalent Increases in School Attendance
Male Female Male Female Male Female Total
5 243,731 225,557 0.01610 0.02016 3,923 4,548 8,471
3,923 4,548 8,471
6 241,516 226,035 0.03682 0.05557 8,892 12,560 21,452
7 239,119 222,901 0.03910 0.02170 9,350 4,836 14,187
8 224,904 212,718 0.01809 0.00910 4,067 1,936 6,003
9 251,031 233,958 0.01147 0.00866 2,880 2,026 4,905
10 251,208 230,433 0.01285 0.01271 3,227 2,928 6,155
11 230,498 219,521 0.01192 0.00757 2,747 1,662 4,409
12 245,050 227,684 0.01727 0.00654 4,231 1,488 5,720
35,395 27,436 62,831
13 227,768 217,218 0.01865 0.01790 4,248 3,888 8,136
14 237,953 222,833 0.02185 0.02040 5,200 4,545 9,745
15 231,182 216,106 0.03063 0.02886 7,080 6,238 13,318
16 226,494 209,953 0.02929 0.02497 6,635 5,242 11,877
23,163 19,913 43,076
17 221,126 204,314 0.01663 0.03286 3,678 6,713 10,391
18 212,907 197,510 0.02036 0.02104 4,334 4,156 8,490
19 205,122 190,479 0.02854 0.01820 5,854 3,466 9,320
20 191,839 177,356 0.02233 0.02712 4,285 4,809 9,094
21 177,994 162,945 0.01452 0.02207 2,585 3,597 6,181
20,736 22,741 43,477
83,217 74,637 157,855
Age
Total Population
(in school)Beta estimates
Equivalent number of
individuals
Subtotals
Pre-primary level*
Primary level
Seondary level
Tertiary level
Note: * Not compulsory prior to 2012
Subtotals
Subtotals
Subtotals
Total significant increase

On a final note, it is possible that the increase in children’s school attendance in municipalities near
the Ro-Ro ports may have been driven by income factors. Several studies reveal that income is the
main consideration for children’s education in the Philippines because higher family income equate to
higher capacity of sending children to school (Albert et al., 2012; Maligalig et al., 2010; Orbeta,
2003). A related result from the 2008 Functional Literacy, Education and Mass Media Survey
(FLEMMS) likewise shows that the high cost of education (24%) and employment/looking for work
(22%) are the two of the most-cited reasons for not attending school among 6 to 24 years old.
Accordingly, we verify for household income changes in municipalities near the Ro-Ro ports by
employing a DID estimation on the log of tax revenue per capita sourced from the Statement of
Income and Expenditure (SIE) of the Department of Finance (DOF). Based on Table 6, there was an
increase in household income by about 7 percent in municipalities near the Ro-Ro ports. This finding
indicates the increase in financial capacity of households to send children to school; thus providing
support to our previous results on increased school attendance.
Table 6. Estimate for log of Tax Revenue per capita
5. Conclusion
In this study we have demonstrated that improving the transport system within a country provides
short-run and long-run effects. With our results we have shown that the government’s effort in
improving the mobility of goods and services as well as the population within the economy, have
resulted to welfare-improving opportunities especially to households living near the Ro-Ro ports. In
Treatment -0.1992341 ***
(0.0603927)
Year 0.2880480 ***
(0.0199620)
DID estimator 0.0692498 **
(0.0346459)
N:
observations
groups
R-squared:
within
between
overall
0.2015
0.0041
Notes: *, **, *** indicate significance at the 10-, 5- and 1-
percent alpha levels, respectively. Heteroskedasticity-robust
standard errors, clustered by province and municipality, are
reported in parentheses.
0.0195
1,435
2,870
the short-run, we immediately noticed the increase in income of agricultural households. Using our
estimates, we have exhibited how the Ro-Ro port operation stimulated both agriculture and non-
agriculture related activities. We highlight that non-agriculture opportunities flourished on the island
where the Ro-Ro port is located. Meanwhile, agricultural productivity on nearby islands was also
enhanced. On another note, we saw that the benefits gained by households from Ro-Ro port operation
were transferred to children in the form of human capital investment. We expect this to have long-
term effects on local economies as it enhances the capacity of their future work force. In addition, our
finding on increased school attendance of males is motivating because this group has the highest
record of school drop-out. Our result therefore, indicates that children are kept in school and not
forced to work to help their families. In general, our study highlights the central role the transport
system in an archipelagic country like the Philippines. It strengthens the argument that rural growth
can be enhanced by providing urban-rural linkages through an efficient and affordable transport
network. We note however, that while we found some positive effects of the Ro-Ro port operation,
the impact of the Ro-Ro policy on all sectors may not necessarily be uniformly positive. Hence, for
future research, we suggest looking into several other sectors to completely unveil the economic
impacts of the Ro-Ro policy.
References
Albert, J.R., Quimba, F.M., Ramos, A.P. and Almeda, J. (2012). Profile of Out of School Children in
the Philippines. PIDS Discussion Paper 2012-01. Makati City: Philippine Institute for Development
Studies.
Aschauer, D. (1989). Is Public Expenditure Productive?. Journal of Monetary Economics, 23(2), 177–
200.
Ashenfelter, O. and Card, D. (1985). Using the Longitudinal Structure of Earnings to Estimate the
Effect of Training Programs. The Review of Economics and Statistics, 67(4), 648-660.
Asian Development Bank. (2012). Philippines Transport Sector Assessment, Strategy and Road Map.
Mandaluyong, Philippines
Baltagi, B.H., Pinnoi, N. (1995), Public Capital Stock and State Productivity Growth: Further
Evidence from an Error Components Model. Empirical Economics, 20, 351-359.
Behrman, J. and Wolfe, B. (1987). How does mother’s schooling affect family health, nutrition,
medical care usage and household sanitation?. Journal of Econometrics, 36, 185–204.
Bezinger V. 1996. Urban Access and Rural Productivity Growth in Post-Mao China. Economic
Development and Cultural Change, 44, 539-70.
Brenneman, A., Kerf, M. (2002), Infrastructure and Poverty Linkages: A Literature Review. The
World Bank, Mimeo.
Bruhn, M. and Love, I. (2011). Gender Differences in the Impact of Banking Services: Evidence from
Mexico. Small Business Economics, 37(4), 493-512.
Calderon, C. and Serven, L. (2003). The Output Cost of Latin America’s Infrastructure Gap. In
Easterly, W., Serven, L. (ed.), The Limits of Stabilization: Infrastructure, Public Deficits and Growth
in Latin America. Stanford University Press.
Canning, D. (1999), Infrastructure's Contribution to Aggregate Output, World Bank Policy Research
Working Papers 2246. Washington, DC: The World Bank.

Demetriades, P. and Mamuneas, T. (2000). Intertemporal Output and Employment Effects of Public
Infrastructure Capital: Evidence from 12 OECD Economies. The Economic Journal, 110, 687-712.
Easterly, W. and Rebelo, S. (1993). Fiscal Policy and Economic Growth: An Empirical Investigation.
Journal of Monetary Economics, 32, 417–458.
Escobal, J. 2001. The Determinants of NonFarm Income Diversification in Rural Peru. World
Development, 29(3), 497-508.
Estache, A. (2003), On Latin America’s Infrastructure Privatization and Its Distributional Effects.
Paper presented at the Distributional Consequences of Privatization Conference, February 24-25,
London: Center for Global Development.
Fan, S. and Chan-Kang, C. (2004). Road Development, Economic Growth and Poverty Reduction in
China. Development Strategy and Governance Division Discussion Paper 12, Washington DC :
International Food Policy Research Institute.
Fan S. and N. Rao. 2002. Public Investment and Poverty Reduction: A Synthesis of Issues, Methods
and Major Findings. Mimeo. Washington DC : International Food Policy Research Institute.
Fernald, J. (1999). Roads to Prosperity? Assessing the Link Between Public Capital and Productivity.
American Economic Review, 89(3), 619-638.
Ferreira, P. and Araujo, C. (2011). Growth and Fiscal Effects of Infrastructure Investment in Brazil,
Fundação Getulio Vargas.
Galiani, S., Gertler, P., Schargrodsky, E., Sturzenegger, F. (2002), The Benefits and Costs of
Privatization in Argentina: A Microeconomic Analysis”, Forthcoming in Chong, A. and F. Lopez-de-
Silanes (eds.), The Benefits and Costs of Privatizations.
Gannon, C., Liu Z. (1997), Poverty and transport, Washington, DC: The World Bank.
Holtz-Eakin D. (1994). Public Sector Capital and the Productivity Puzzle. Review of Economics and
Statistics, 76, 12-21.
Jacoby, Hanan G. (2000), Access to Markets and the Benefits of Rural Roads. The Economic Journal.
110, 713-737.
Jalan, J., Ravallion, M. (2002), Household Income Dynamics in Rural China, Working Papers UNU-
WIDER Research Paper , Helsinki, Finland: United Nations University World Institute for
Development Economics Research
Johanson, R. (1999). Higher Education in the Philippines. Technical Background Paper 3. ADB-WB
Philippine Education for the 21st Century. The 1998 Philippines Education Sector Study. Manila,
Philippines.
Khandker, S., V. Lavy, and D. Filmer. 1994. Schooling and Cognitive Achievements of Children in
Morocco. World Bank Discussion Paper 264. Washington, DC: The World Bank.
Lambino, J. (2010). The Economic Role of Metro Manila in the Philippines: A Study of Uneven
Regional Development under Globalization. The Kyoto Review, 79(2), 67-106.
Lavy, V., Strauss, J., Thomas, D., and Vreyer, P. (1996), Quality of Health Care, Survival and Health
Outcomes in Ghana. Journal of Health Economics, 15, 333-57.
Lee, K., Pesaran M.H. and Smith R. (1997), Growth and Convergence in a Multicountry Empirical
Stochastic Solow Model. Journal of Applied Econometrics, 12, 357-392.
Levy, H. (1996). Kingdom of Morocco: Impact Evaluation Report, Socioeconomic Influence of
Rural Roads. Operation Valuation Department, World Bank: Washington, DC.
Maligalig, D., Caoli-Rodriguez, R.B., Martinez, A. and Cuevas, S. (2010). Education Outcomes in the
Philippines. ADB Economics Working Paper Series 199. Asian Development Bank: Manila,
Philippines.
Malmberg C., Ryan, A. and L. Pouliquen. 1997. Rural Infrastructure Services for Development and
Poverty Reduction. Washington, DC: The World Bank.
Orbeta, A. (2003). Education, Labor Market and Development: A Review of the Trends and Issues in
the Philippines for the Past 25 Years. PIDS Discussion Paper, 2002-19. Makati City, Philippines:
Philippine Institute for Development Studies.
Quisumbing, A., Estudillo, J. and Otsuka, K. (2004). Land and Schooling: Transferring Wealth across
Generations. Baltimore and London: Johns Hopkins University Press.

Sakellariou, C. (2004). The Use of Quantile Regressions in Estimating Gender Wage Differentials: A
Case Study of the Philippines. Applied Economics, 36(9), 1001-100.
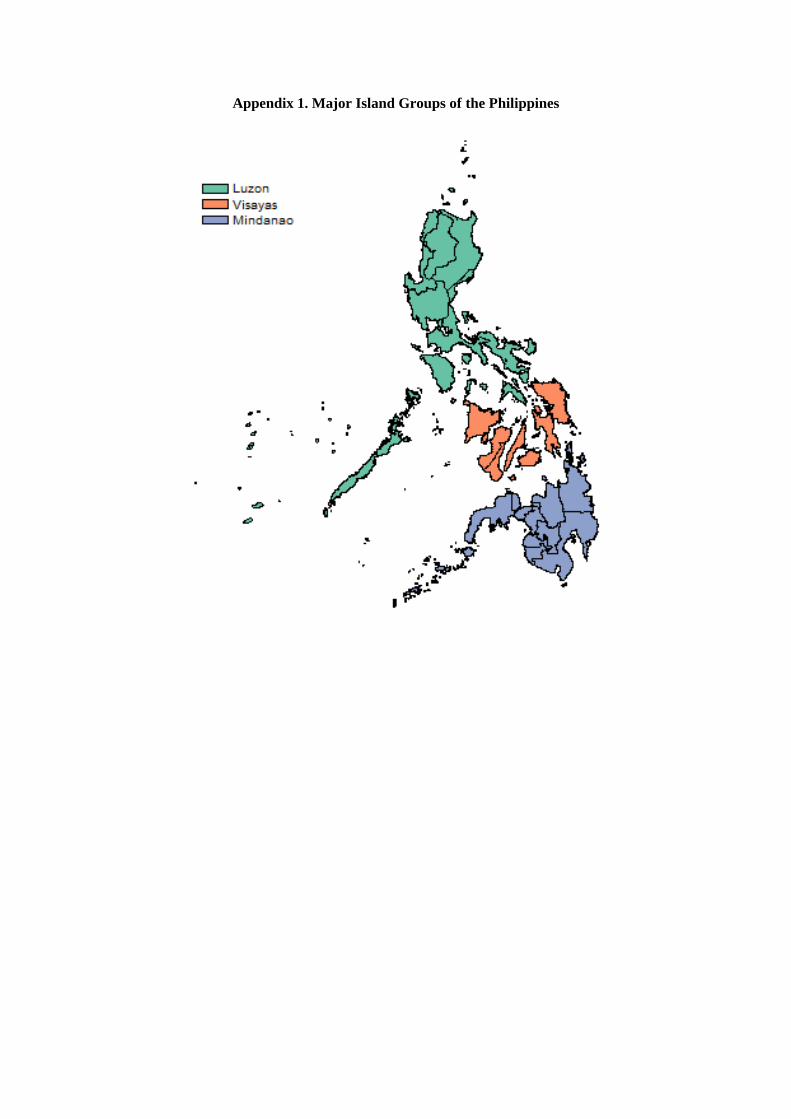
Appendix 1. Major Island Groups of the Philippines
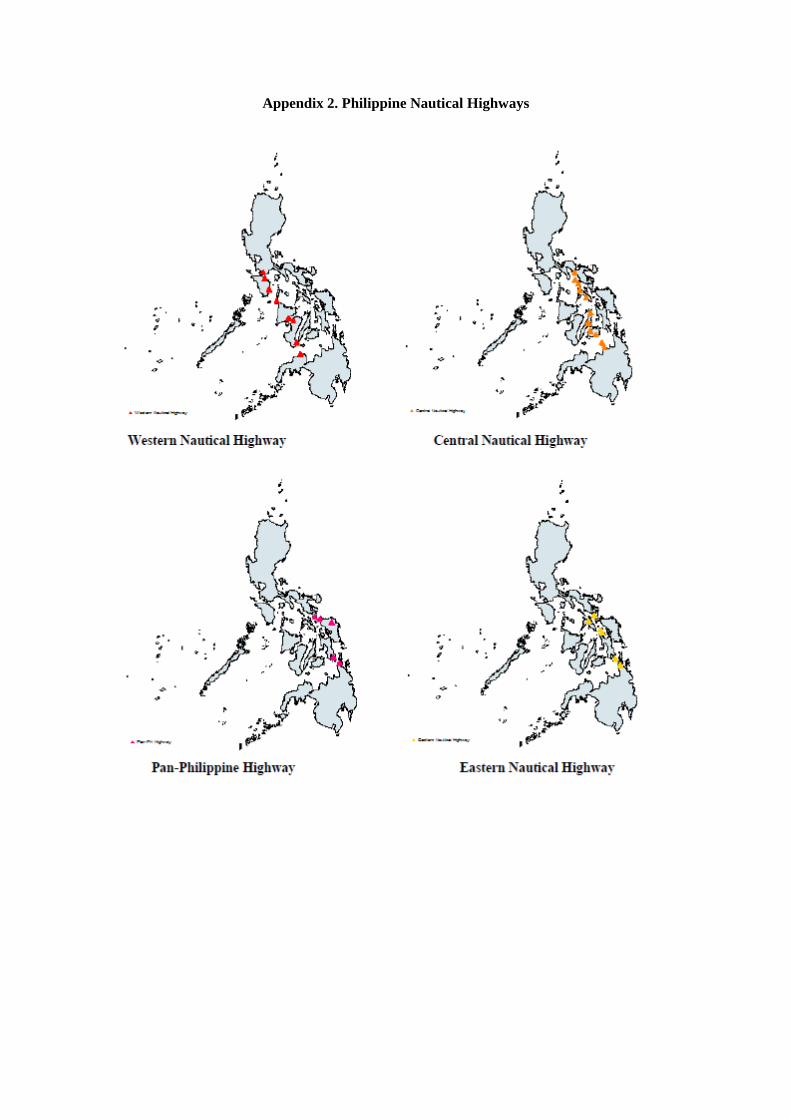
Appendix 2. Philippine Nautical Highways