understanding the uk freight transport system · road hauliers provide road transport services from...
TRANSCRIPT

Understanding the UK Freight Transport System
Future of Mobility: Evidence Review Foresight, Government Office for Science

Understanding the UK Freight Transport System
MDS Transmodal
February 2019
This report has an information cut-off date June 2018.
This review has been commissioned as part of the UK government’s Foresight Future of Mobility project. The views
expressed are those of the author and do not represent those of any government or organisation.
This document is not a statement of government policy.

Understanding the UK Freight Transport System
1
Table of Contents GLOSSARY OF TERMS ...................................................................................................... 3
1 INTRODUCTION ........................................................................................................... 6
1.1 Study objectives ...................................................................................................... 6
1.3 The political economy of freight transport ................................................................ 6
1.4 UK freight transport policy ....................................................................................... 8
1.5 Scope and methodology ......................................................................................... 8
1.6 Structure of report ................................................................................................. 10
2 FREIGHT TRANSPORT & STAKEHOLDERS ............................................................ 11
2.1 Introduction ........................................................................................................... 11
2.2 Definition of freight transport ................................................................................. 11
2.3 Measuring freight transport ................................................................................... 12
2.4 Key freight transport stakeholders ......................................................................... 13
2.5 Modes of freight transport & modal economics ..................................................... 15
2.6 Overall freight transport volumes .......................................................................... 16
2.7 Summary .............................................................................................................. 20
3 FREIGHT TRANSPORT DEMAND .............................................................................. 21
3.1 Introduction ........................................................................................................... 21
3.2 Road freight: traffic volumes & goods transported ................................................. 21
3.3 Rail freight: volume & goods transported .............................................................. 23
3.4 Port freight: volume & goods transported .............................................................. 27
3.5 Air freight: volume & goods transported ................................................................ 31
3.6 Waterborne freight: volume & goods transported .................................................. 32
3.7 Pipeline: volume & goods transported ................................................................... 33
3.8 Active modes in freight: cycling & walking ............................................................. 34
4 FREIGHT TRANSPORT SERVICES ........................................................................... 35
4.1 Introduction ........................................................................................................... 35
4.2 Road haulage services and 3PLs .......................................................................... 35
4.3 Rail freight services ............................................................................................... 40
4.4 Container shipping services .................................................................................. 44

Understanding the UK Freight Transport System
2
4.5 RoRo shipping services ........................................................................................ 46
4.6 Bulk shipping ........................................................................................................ 48
5 THE STRATEGIC FREIGHT INFRASTRUCTURE NETWORK ................................... 49
5.1 Introduction ........................................................................................................... 49
5.2 The strategic road network .................................................................................... 49
5.3 Distribution centres & other storage ...................................................................... 50
5.4 Rail freight network ............................................................................................... 54
5.5 Port infrastructure network .................................................................................... 60
5.6 Airports ................................................................................................................. 63
5.7 Waterborne freight network ................................................................................... 63
5.8 Pipeline network ................................................................................................... 65
5.9 Planned investment in freight transport infrastructure ........................................... 65
6 THE FUTURE OF FREIGHT ........................................................................................ 68
6.1 Introduction ........................................................................................................... 68
6.2 The impact of regulation........................................................................................ 69
6.3 The impact of alternative fuel technologies ........................................................... 70
6.4 The impact of e-commerce ................................................................................... 71
6.5 The impact of local manufacturing ........................................................................ 71
6.6 The impact of autonomy and automation .............................................................. 72
6.7 The impact of the sharing economy ...................................................................... 72
6.8 The impact of infrastructure pricing ....................................................................... 73
7. REFERENCES ............................................................................................................... 74
Understanding the UK Freight Transport System
3
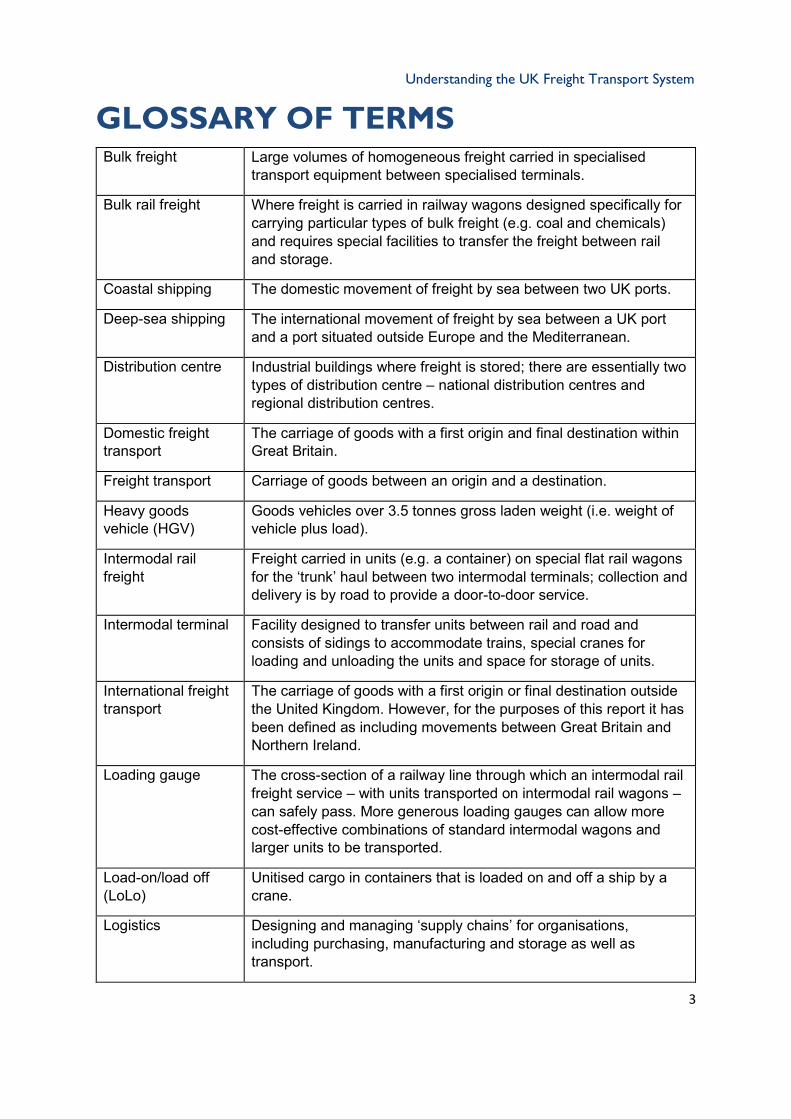
GLOSSARY OF TERMS Bulk freight Large volumes of homogeneous freight carried in specialised
transport equipment between specialised terminals.
Bulk rail freight Where freight is carried in railway wagons designed specifically for carrying particular types of bulk freight (e.g. coal and chemicals) and requires special facilities to transfer the freight between rail and storage.
Coastal shipping The domestic movement of freight by sea between two UK ports.
Deep-sea shipping The international movement of freight by sea between a UK port and a port situated outside Europe and the Mediterranean.
Distribution centre Industrial buildings where freight is stored; there are essentially two types of distribution centre – national distribution centres and regional distribution centres.
Domestic freight transport
The carriage of goods with a first origin and final destination within Great Britain.
Freight transport Carriage of goods between an origin and a destination.
Heavy goods vehicle (HGV)
Goods vehicles over 3.5 tonnes gross laden weight (i.e. weight of vehicle plus load).
Intermodal rail freight
Freight carried in units (e.g. a container) on special flat rail wagons for the ‘trunk’ haul between two intermodal terminals; collection and delivery is by road to provide a door-to-door service.
Intermodal terminal Facility designed to transfer units between rail and road and consists of sidings to accommodate trains, special cranes for loading and unloading the units and space for storage of units.
International freight transport
The carriage of goods with a first origin or final destination outside the United Kingdom. However, for the purposes of this report it has been defined as including movements between Great Britain and Northern Ireland.
Loading gauge The cross-section of a railway line through which an intermodal rail freight service – with units transported on intermodal rail wagons – can safely pass. More generous loading gauges can allow more cost-effective combinations of standard intermodal wagons and larger units to be transported.
Load-on/load off (LoLo)
Unitised cargo in containers that is loaded on and off a ship by a crane.
Logistics Designing and managing ‘supply chains’ for organisations, including purchasing, manufacturing and storage as well as transport.

Understanding the UK Freight Transport System
4
Logistics providers Organisations that undertake the movement and handling of goods on behalf of their customers; there are two main types of logistics providers – road hauliers and 3PLs (third party logistics providers).
National distribution centre (NDC)
Inventory holding points for imported and nationally sourced goods before re-distribution to other stages in the supply chain; serve the whole of the UK from one location.
Network Rail Organisation responsible for the maintenance and renewal of the GB rail network.
Non-bulk freight Freight carried in standard ‘box’ units, mainly road trailers and containers.
Non-bulk rail freight Freight carried in units (usually a container) on an intermodal rail freight service or in railway ‘box cars’ or ‘vans’ between specialist terminal facilities.
Rail-connected distribution park
Large distribution site, with an intermodal terminal serving on-site distribution centres and the wider region; also called a Strategic Rail Freight Interchange.
Regional distribution centre (RDC)
Re-distribution of inward supplies of goods to other stages in the supply chain, normally a retail outlet; they have a regional hinterland and are normally associated with retailers. Their primary role is to consolidate and re-distribute goods in short periods of time rather than to hold goods for long periods.
Road hauliers Provide road transport services from one location to another at the direction of their customers.
Roll-on/roll-off (RoRo)
Unitised cargo in trailers which is rolled on and off a ship without the use of a crane.
Short-sea shipping The international movement of freight by sea between a UK port and a port situated in geographical Europe.
Strategic Rail Freight Interchange (Strategic RFI)
Large distribution sites (over 60 hectares), with an intermodal terminal serving on-site distribution centres and the wider region; also called rail-connected distribution parks.
Third party logistics company (3PL)
Companies that sell comprehensive packages of supply chain management services in addition to road transport operations.
Tonne-kilometres (tkm)
Tonnes lifted x length of haul.
Tonnes lifted Weight of freight
Tonnes moved The sum of tonnes moved and the distance it is moved; usually expressed in tonne kilometres.

Understanding the UK Freight Transport System
5
Vehicle-kilometres (vkm)
Tonne-kilometres divided by average load per vehicle.
West Coast Main Line (WCML)
Key route for GB rail freight services; the line links London with the West Midlands, North West England and the Central Belt of Scotland (Glasgow).

Understanding the UK Freight Transport System
6
1 INTRODUCTION 1.1 Study objectives
The objective of this study is to provide an evidence-based review of the current ‘landscape’ of the ‘freight transport system’ in the UK, while also providing some observations on how the future freight transport system might develop over the next 10 years. The Government Office for Science (GO-Science) has also commissioned a number of parallel pieces of work which seek to provide more detailed views on the future of freight transport up to 2040.
The ‘freight transport system’ in the UK has been defined for the purposes of this study as the network of users of freight transport (principally shippers and receivers of cargo), freight transport and logistics service providers and the infrastructure which these services use.
1.2 Foresight Future of Mobility Project
This research was commissioned by GO-Science, which has the remit of ensuring that government policies and decisions are informed by the best scientific evidence and strategic long-term thinking. This piece of work forms part of the GO-Science Foresight Future of Mobility project, which is considering what benefits and opportunities the transport system of the future could provide and what the implications are for Government and society.
1.3 The political economy of freight transport
Freight transport is needed because goods available at one geographical location are required at another location for processing, sorting or consumption. Freight transport is therefore an example of what economists call a derived demand as the transport is not required in itself, but only as a means to satisfy another demand.
As a derived demand, the demand for freight transport does not come directly from consumer needs or wants but from private sector companies such as retailers, manufacturers and processors. However such organisations are ultimately responding to consumer demand for goods and dealing with return flows such as unwanted or faulty goods and waste materials such as packaging for recycling or disposal; the level of demand for goods will be influenced by various factors, including the performance of the wider economy and changes in tastes and fashions over time. Freight transport and logistics services are delivered almost exclusively by private sector companies which invest heavily in fixed infrastructure, such as port facilities, rail terminals, distribution centres, and mobile equipment such as trucks, vans, forklift trucks, ships and railway locomotives and wagons.
The private sector needs, however, to use publicly owned road and rail infrastructure and is subject to the taxation and regulatory regimes that the public sector puts in place. Changes in taxation and regulation may lead to more efficient outcomes for the wider economy and society as a whole, but will also affect the value of private sector investments that have been predicated on the existing fiscal and regulatory position. It follows that Government needs to understand the current landscape for freight transport as future interventions are likely to require a combination of public investment in road and rail network infrastructure, changes in the regulatory framework and the taxation regime and the application of appropriate planning policies. These changes should be designed, wherever possible, to increase the efficiency of the freight and logistics sector by reducing its costs; this is particularly important as freight

Understanding the UK Freight Transport System
7
transport should be seen as a cost of production and as having an impact on the productivity of firms and the UK economy as a whole.
Freight transport movements also have impacts on the environment and on the quality of life and health of citizens and so an appropriate balance needs to be found in the future between, on the one hand, economic objectives and, on the other hand, quality of life and environmental objectives.
As the freight transport industry is highly competitive – facilitated by relative ease of entry into the market – any interventions by the public sector will lead to a response from the private sector operators and any resulting changes in costs will be passed on, in the medium to long term, to the industry’s customers and, ultimately, to the wider economy.
Technological changes and innovation in freight transport have facilitated the development of mass and then lean production techniques, which have led to transformational changes in the UK economy since the 18th century (CILT, 2015):
• Canals allowed raw materials and manufactured products to be distributed nationwide and to and from ports at a reasonable cost in the 18th and early 19th centuries, while the railways provided high-capacity freight transport with faster transit times from the latter half of the 19th century;
• The development and mass production of vehicles using the internal combustion engine in the early 20th century and the development of the motorway network after the Second World War allowed road freight to increase its market share on longer-distance hauls at the expense of the railways, without radically transforming the structure of the UK economy;
• Containerisation of a wide range of cargoes since the 1960s, allied to the process of globalisation and investment in very large container ships, has made it easier for goods to be manufactured anywhere in the world and then distributed cost-effectively to the UK;
• Greater use of integrated information and communications technology (ICT) in supply chains since the 1980s has allowed companies to reduce their inventory and operate increasingly lean manufacturing processes, which has led to lower production costs and greater productivity for the UK economy.
As the history of transport since the industrial revolution in the 18th century has shown, technological change in the freight transport sector has had a transformational effect on the economy and on society. This is likely to continue up to 2040 as the freight industry adapts to changing consumer demands, stronger environmental regulation and the challenges of an increasingly integrated global economy.
This provides the context for this study, which has an objective of ensuring that Government has a clear view of the freight transport landscape in the UK. This is important because the public sector can have such a significant impact on the sector, which is in turn a key facilitator for the wider economy.

Understanding the UK Freight Transport System
8
1.4 UK freight transport policy
Government transport policy in relation to freight transport is designed to be relatively light touch and is set out at a UK level in The Logistics Growth Review (Department for Transport, 2011 and 2014). The main aim of the original document, which was produced in 2011 in collaboration with the freight and logistics industry, was to identify the barriers to economic growth within the industry and present a series of measures to address the barriers that were identified.
The document outlined five core areas where the Government can assist and facilitate growth and competitiveness in the logistics industry, namely:
• Giving industry greater confidence to invest in the short term by removing planning barriers to sustainable logistics development, with a particular focus on strategic rail freight interchanges (SRFIs1) that can facilitate modal shift from road to rail over the longer distances;
• Improving the longer-term capacity, performance and resilience of our congested road and rail networks and improving connectivity to ports;
• Promoting the image of the sector at a local level;
• Reducing unnecessary regulation;
• Attracting and retaining high-calibre recruits.
The 2014 update presented the measures the Government had taken in relation to these five core areas. These included producing a National Networks National Policy Statement to endorse policy on SRFIs, increasing investment to upgrade the strategic road network and providing funding to improve training and skills in the logistics sector.
1.5 Scope and methodology
The scope of this research project is on the UK freight transport system as defined above, but given the open nature of the UK’s economy, it also considers transport links to the European continental mainland, Ireland and the rest of the world. It encompasses all modes of freight transport, but focuses on road and rail, shipping, inland waterways and aviation.
As it is only possible to understand the existing landscape through an appreciation of historic trends, we have presented as much data as possible from 2002 to the most recent year for which published data is available. The time horizon for the Foresight Future of Mobility project is 2040, but our observations on future trends are limited to the next ten years.
1 Strategic Rail Freight Interchanges are large distribution sites (over 60 hectares), with an intermodal terminal serving on-site distribution centres and the wider region; they are also called rail-connected distribution parks.

Understanding the UK Freight Transport System
9
The methodology adopted to complete this study has involved:
• Desk research to analyse existing public policy and research;
• Data analysis to develop a statistical ‘picture’ of the current position based on official data and outputs from the GB Freight Model, which forms the freight module of the DfT’s current National Transport Model and other databases developed by MDS Transmodal;
• Providing observations on how the freight transport system might develop up to about 2028.
As this report demonstrates, there is a significant amount of data available in the public domain, much of which is collected by the public sector in order to inform the development of policy. Data are collected to fulfil different needs. Hence the datasets report on different aspects of the transport system, using different methods. Consequently there can be differences in the picture shown by the data. For example there is sometimes inconsistency between the HGV distance in the Continuing Survey of Road Goods Traffic and the Road and the National Road Traffic Survey. The reasons for this difference are given on the DfT methodology page (2016). Policy makers and users of this (and any) data need to comprehend any uncertainties in the picture being presented, or there are risks of misunderstanding.
As the freight transport sector is essentially operated by the private sector, this official data is aggregated and anonymised to avoid raising issues of commercial confidentiality and generally seeks to record movements of freight by individual mode. This makes it difficult to follow the movements of different commodities through the transport chain and examine the (often international) supply chains of individual companies or industries from a statistical point of view. Advances in ICT can allow individual consignments to be tracked automatically from production to consumption, improving company’s situational awareness. However, whilst government and local authorities could benefit from this information, in terms of planning, it is likely challenging to obtain and use, given its commercial nature.
Where possible the report includes references to data sources and research produced by others; where references are not provided, the views expressed are those of the authors.

Understanding the UK Freight Transport System
10
1.6 Structure of report
Section 2 Freight transport & stakeholders provides definitions of freight transport and how it is measured. It then considers the key stakeholders in freight transport that have a particular interest in how it develops up to 2040. It then describes the main modes of freight transport and provides a short introduction to freight transport economics.
Section 3 Freight transport demand provides data and analysis of the demand for freight transport by mode of freight transport, with the main focus on road, rail, port-based and air freight.
Section 4 Freight transport services provides information on the service providers that operate in the freight transport industry by mode of transport.
Section 5 The strategic freight transport infrastructure network seeks to describe the infrastructure that the services use – both publicly owned and privately owned infrastructure.
Section 6 The Future of Freight provides some observations on the potential impact of, inter alia, changes in regulation, technology, changing trade relationships, and alternative fuels on the future UK freight system.

Understanding the UK Freight Transport System
11
2 FREIGHT TRANSPORT & STAKEHOLDERS 2.1 Introduction
This section provides definitions of freight transport and how it is measured, as well as the wider concepts of logistics and supply chains. It then considers the key stakeholders in freight transport that have a particular interest in how it develops in the future. It concludes by describing the main modes of freight transport and provides a short introduction to freight transport economics.
2.2 Definition of freight transport
Freight transport is the carriage of goods between an origin and a destination for commercial reasons because goods available at one geographical location are required at another location for processing, sorting or consumption. This definition excludes the majority of light goods vehicle (or ‘white van’) traffic, which is for the provision of services or for personal use rather than for the transport of goods (Braithwaite, 2017).
Logistics is a broader concept that involves designing and managing supply chains for individual organisations. It seeks to efficiently manage the purchasing, manufacturing and storage functions and the transport as an integrated system. Minimising stockholding (inventory) and the associated costs is a key principle of logistics. The supply chain of an individual organisation is the sequence of processes involved in the production and distribution of a commodity. The freight transport industry is therefore involved in both transport and logistics – particularly as many transport service providers also provide ‘added value’ services such as packaging, labelling and sorting of goods – and is essential for the distribution of goods within the supply chain of an individual organisation.
This report mainly discusses freight transport rather than logistics, but attention is also paid to distribution centres because of their importance as nodes in the wider freight network, in adding value to the goods stored and in creating employment.
Freight transport can generally be categorised by its:
• Origin or destination, with a particularly important distinction made between domestic transport (i.e. within the UK) and international freight between the UK and other countries, whether within the existing customs union that includes the rest of the European Union or with non-EU countries;
• Mode of appearance (principally bulk or non-bulk for land-based transport);
• Mode of transport (road, rail, air, etc.).
Domestic freight transport is defined as the carriage of goods with both the first origin and final destination within the United Kingdom, while international freight transport is the carriage of goods with either an origin or destination outside the United Kingdom. As Great Britain is an island, all international freight has to be handled through a port, airport or

Understanding the UK Freight Transport System
12
through the Channel Tunnel, while for Northern Ireland international freight transport can also involve movements across the land border with the Republic of Ireland.
Bulk freight transport is where large volumes of a homogeneous cargo are carried in specialised transport equipment between specialised terminals. Examples include the transport of aggregates from a quarry to a rail-served terminal and the transport of petroleum products by sea in oil tankers from an oil refinery based on an estuary to a coastal tank farm.
Non-bulk freight transport is made up of two main categories of cargo:
• Unitload transport: where cargoes are carried in standard ‘box’ units, mainly road trailers and containers. Examples are where a truck makes a delivery of food and beverages from a distribution centre to a supermarket or where a container containing consumer goods from China is transported on a rail service from a container port to an intermodal rail freight terminal, where it is then loaded onto the back of a truck for delivery to a distribution centre.
• Semi-bulk transport: where high-volume industrial products are ‘packaged’ to ease handling without being in pure bulk form or being transported in a unit. Examples include steel coils, paper rolls or packaged timber.
2.3 Measuring freight transport
Freight transport is usually measured in terms of freight tonnes lifted or freight tonnes moved. Freight tonnes moved can be expressed in tonne-kilometres (tkm) or, for road freight, vehicle-kilometres (vkm). Tonne-kilometres is generally regarded as the most relevant measure for defining modal share and a combination of tonne-kilometres and tonnes lifted allows the average length of haul to be derived.
tonne kilometres (tkm) = tonnes lifted x length of haul in kilometres
vehicle kilometres (vkm) = tonne kilometres / average load in tonnes
tonne kilometres / tonnes lifted = average length of haul in kilometres

Understanding the UK Freight Transport System
13
2.4 Key freight transport stakeholders
Freight transport movements are a source of environmental emissions, and they contribute to congestion and generate noise. These issues cause concern for a wide range of stakeholders and can justify intervention by the public sector to protect the wider public interest. At the same time the functioning of the UK economy is facilitated by the availability of efficient freight transport services, ensuring the availability of goods, supporting manufacturing activity and supporting employment.
The different expectations of the various stakeholders in relation to freight transport can be described through stakeholder analysis, which categorises the different groups of people and organisations with an interest in the subject and highlights their different expectations.
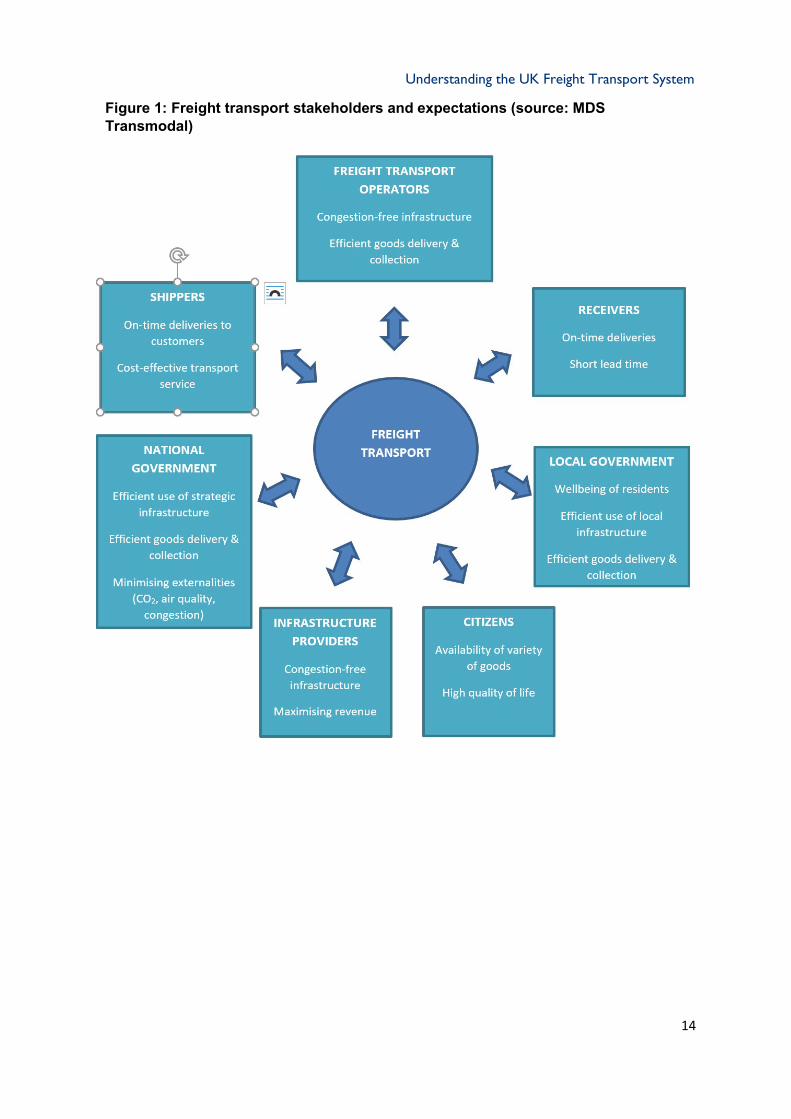
Figure 1 shows the key stakeholder groups that are affected by freight transport, with their main expectations. In general terms, citizens are seeking a high quality of life, while transport operators and their customers (shippers and receivers of goods) have a strong interest in achieving low-cost on-time delivery and collection of goods to improve their competitiveness.
These different expectations can result in conflicts that need to be resolved through trade-offs between the private needs of the freight industry and its customers and public needs (such as improved air quality, lower levels of congestion, etc.) through intervention in the market by the public sector. In economic terms, where the costs of private activities are not fully reflected in the user costs of the freight industry and their customers, there is market failure; the public sector therefore has a role in seeking to balance the needs of the private operators with the wider needs of society.
Understanding the UK Freight Transport System
14
Figure 1: Freight transport stakeholders and expectations (source: MDS Transmodal)

Understanding the UK Freight Transport System
15
2.5 Modes of freight transport & modal economics
Freight transport is often defined in terms of the mode of freight transport because this determines the relative economics of the freight transport movement and its environmental impacts.
Road freight transport is the dominant mode because of a number of factors:
• The mode’s inherent flexibility and cost-effectiveness, particularly over shorter distances and for smaller consignments.
• The ease of entry into the road haulage sector due to lower start-up costs and a lower level of institutional and regulatory complexity compared to, for example, the railway industry.
• The extent of the high-capacity strategic highways network that was developed after the Second World War, notwithstanding the current congestion and bottlenecks in some locations, particularly at peak times.
• The fact that most distribution centre sites are no longer directly connected to other modal networks.
The vast majority of road freight lifted and moved is carried in heavy goods vehicles (HGVs), which are defined as vehicles over 3.5 tonnes gross laden weight (i.e. the weight of the vehicle plus its load). The average length of haul for an HGV is about 100km (Department for Transport, 2018c). Although there are a variety of types and sizes of HGV, the main type of HGV used for long-distance road haulage is the combination of a tractor and 13.6-metre trailer unit. There has been an increase in light goods vehicles (LGVs or so-called ‘white vans’) traffic. The majority of LGV movements on the road network are not associated with e-commerce deliveries (Braithwaite, 2017). They are mainly used for food distribution, construction and business services (such as plumbers, electricians, fitters, etc.). Therefore, while the growth in LGV traffic on the roads is often assumed to be related to the growth in e-commerce, this is a contributory factor, it is also likely related to the growth in service-related activity. However there remains considerable uncertainty in exactly what LGVs are used for.
Rail freight transport can be cost-effective, even over short distances (i.e. less than 100km), for full trainload consignments moving between two rail-connected sites (such as shipments of coal from ports to inland power stations). It can also provide economic and flexible transport chains for higher-value goods when transported in containers within intermodal transport chains. However, rail freight tends to be competitive with road over longer distances and the average length of haul is about 150km (Office of Rail & Road, 2018d). Other benefits of rail freight include:
• The ability to receive large volumes of cargo in ‘one move’;
• The ability to deliver/receive cargo at specific times and in a timely manner which avoids road congestion; rail operates to working timetables with recent performance for the sector indicating that around 94% of freight trains arrive ‘on-time’;
• Lower greenhouse gas and other emissions per unit moved so that, where organisations are required to report them, the use of rail can either off-set emissions

Understanding the UK Freight Transport System
16
elsewhere or contribute to a reduction of overall emissions, as well as help in meeting corporate social responsibility objectives; and
• Greater levels of security – the railway operates in a closed/secured environment so that, for example, spent nuclear fuel is transported by rail freight despite road haulage potentially being able to offer a more cost effective solution.
Maritime freight transport via seaports is essential to trade with the European continental mainland, Ireland and the rest of the world. A wide variety of modes are used to transport goods by sea, from container ships and roll-on/roll-off ferries carrying high-value consumer goods to bulk carriers transporting petroleum products, crude oil, liquid natural gas, grain, biomass, bulk steel and a wide variety of other goods.
Waterborne freight transport includes the transport of domestic freight within the UK on inland waterways, along the coasts and between Great Britain and Northern Ireland and ‘one-port traffic’ between a single UK port and an offshore installation. While large volumes of bulk goods and some containers are transported coastwise between UK ports and along major inland waterways such as the Manchester Ship Canal, a few other wide inland navigations and on the major river estuaries, there is no cargo transported by barge on narrow-gauge canals.
Pipelines provide a specialist mode of transport for the cost-effective transport of large volumes of bulk liquids and gases between ports and manufacturing sites, refineries and power stations.
Air freight is a specialist mode of freight transport, mainly for the inter-continental transport of relatively low volumes of very high-value or urgent goods and documents.
2.6 Overall freight transport volumes
Figure 2 shows how GB domestic freight transport by mode in terms of tonnes of freight lifted has fluctuated during the period 2001–15, with road freight responsible for transporting between 87% and 90% of total freight by volume over the period.

Understanding the UK Freight Transport System
17
Figure 2: Domestic freight transport lifted by mode in Great Britain 2001–15 (million tonnes)
Source: Department for Transport Statistics Great Britain
In addition, road and rail freight data analysed by the authors suggests that total freight lifted in the UK by road (including overseas hauliers) and rail in 2016 amounted to 2.1 billion tonnes of goods (Table 1). Of the total goods lifted, 83.6% had an origin in England, 2.6% had an origin in Northern Ireland, 4.8% had an origin i77n Wales and 9.0% had an origin in Scotland.
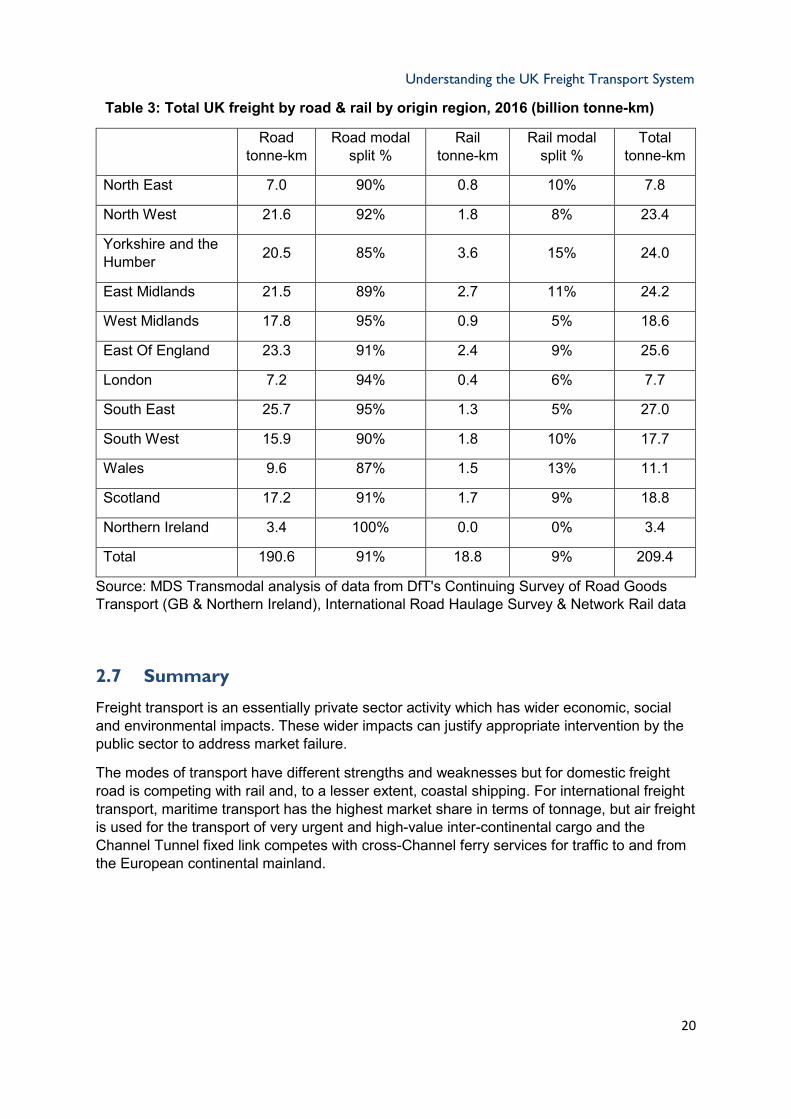
Inland freight moved in the UK by road and rail in 2016 amounted to an estimated 209 billion tonne-kilometres, with each tonne being moved on average 100km (Table 2). The rail modal share in terms of freight moved was an estimated 9% in 2016 (Table 3), with the highest share for rail being 15% in Yorkshire and the Humber where there are significant bulk rail movements to and from the port of Immingham.
0
500
1,000
1,500
2,000
2001 2002 2003 2004 2005 2006 2007 2008 2009 2010 2011 2012 2013 2014 2015
Mill
ion
tonn
es
Water
Rail
Road

Understanding the UK Freight Transport System
18
Table 1: Total estimated UK freight lifted in tonnes by origin-destination region, 2016 (million tonnes)
Origin tonnes Destination tonnes
North East 81 78
North West 220 228
Yorkshire and the Humber 216 205
East Midlands 230 213
West Midlands 188 199
East Of England 252 242
London 132 151
South East 258 270
South West 171 163
Wales 100 94
Scotland 188 191
Northern Ireland 53 54
Total 2,088 2,088
Source: MDS Transmodal analysis of data from DfT's Continuing Survey of Road Goods Transport (GB & Northern Ireland), International Road Haulage Survey & Network Rail data

Understanding the UK Freight Transport System
19
Table 2: Total estimated UK freight moved in tonne km by origin-destination region, 2016
ORIGIN DESTINATION
Origin billion tonne-km
Av. distance moved (km)
Destination billion tonne-km
Av. distance moved (km)
North East 7.8 97 7.3 94
North West 23.4 107 24.6 108
Yorkshire and the Humber 24.0 111 21.1 103
East Midlands 24.2 105 21.9 103
West Midlands 18.6 99 20.2 102
East of England 25.6 102 24.5 101
London 7.7 58 10.6 70
South East 27.0 104 29.5 109
South West 17.7 104 16.7 102
Wales 11.1 112 9.8 103
Scotland 18.8 100 19.7 103
Northern Ireland 3.4 63 3.4 63
Total 209.4 100 209.4 100
Source: MDS Transmodal analysis of data from DfT's Continuing Survey of Road Goods Transport (GB & Northern Ireland), International Road Haulage Survey & Network Rail data
Understanding the UK Freight Transport System
20
Table 3: Total UK freight by road & rail by origin region, 2016 (billion tonne-km)
Road tonne-km
Road modal split %
Rail tonne-km
Rail modal split %
Total tonne-km
North East 7.0 90% 0.8 10% 7.8
North West 21.6 92% 1.8 8% 23.4
Yorkshire and the Humber 20.5 85% 3.6 15% 24.0
East Midlands 21.5 89% 2.7 11% 24.2
West Midlands 17.8 95% 0.9 5% 18.6
East Of England 23.3 91% 2.4 9% 25.6
London 7.2 94% 0.4 6% 7.7
South East 25.7 95% 1.3 5% 27.0
South West 15.9 90% 1.8 10% 17.7
Wales 9.6 87% 1.5 13% 11.1
Scotland 17.2 91% 1.7 9% 18.8
Northern Ireland 3.4 100% 0.0 0% 3.4
Total 190.6 91% 18.8 9% 209.4
Source: MDS Transmodal analysis of data from DfT's Continuing Survey of Road Goods Transport (GB & Northern Ireland), International Road Haulage Survey & Network Rail data
2.7 Summary
Freight transport is an essentially private sector activity which has wider economic, social and environmental impacts. These wider impacts can justify appropriate intervention by the public sector to address market failure.
The modes of transport have different strengths and weaknesses but for domestic freight road is competing with rail and, to a lesser extent, coastal shipping. For international freight transport, maritime transport has the highest market share in terms of tonnage, but air freight is used for the transport of very urgent and high-value inter-continental cargo and the Channel Tunnel fixed link competes with cross-Channel ferry services for traffic to and from the European continental mainland.

Understanding the UK Freight Transport System
21
3 FREIGHT TRANSPORT DEMAND 3.1 Introduction
This section provides data and analysis of the demand for freight transport by mode of freight transport, with the main focus on road, rail, ports and air freight. Where a consistent time series is available it sets out the data from 2001 to 2016 (or the 2016–17 financial year) to show historic tends.
3.2 Road freight: traffic volumes & goods transported
Traffic volum es
Total HGV and LGV freight traffic is recorded by the DfT’s National Traffic Survey, which is based on continuous traffic counts. This data suggests that HGV traffic has been gradually increasing since 2012 and in 2016 reached 27.1 billion vehicle kilometres. However, it has still not reached its pre-recession peak of 29.3 billion vehicle kilometres achieved in 2007.
Figure 3: Road traffic (billion vehicle-km) by vehicle type, 2004–16
Source: Department for Transport, 2018, TRA0201
By comparison, LGV traffic has increased steadily from 60 billion vehicle-kilometres in 2004 to 79 billion vehicle kilometres in 2016, an increase of 31%. Although less is known about LGV movements, much of this increase is likely to be related to the growth in in the service economy and, probably to a more limited extent, growth in e-commerce (Braithwaite, 2017).
Com m odities transported
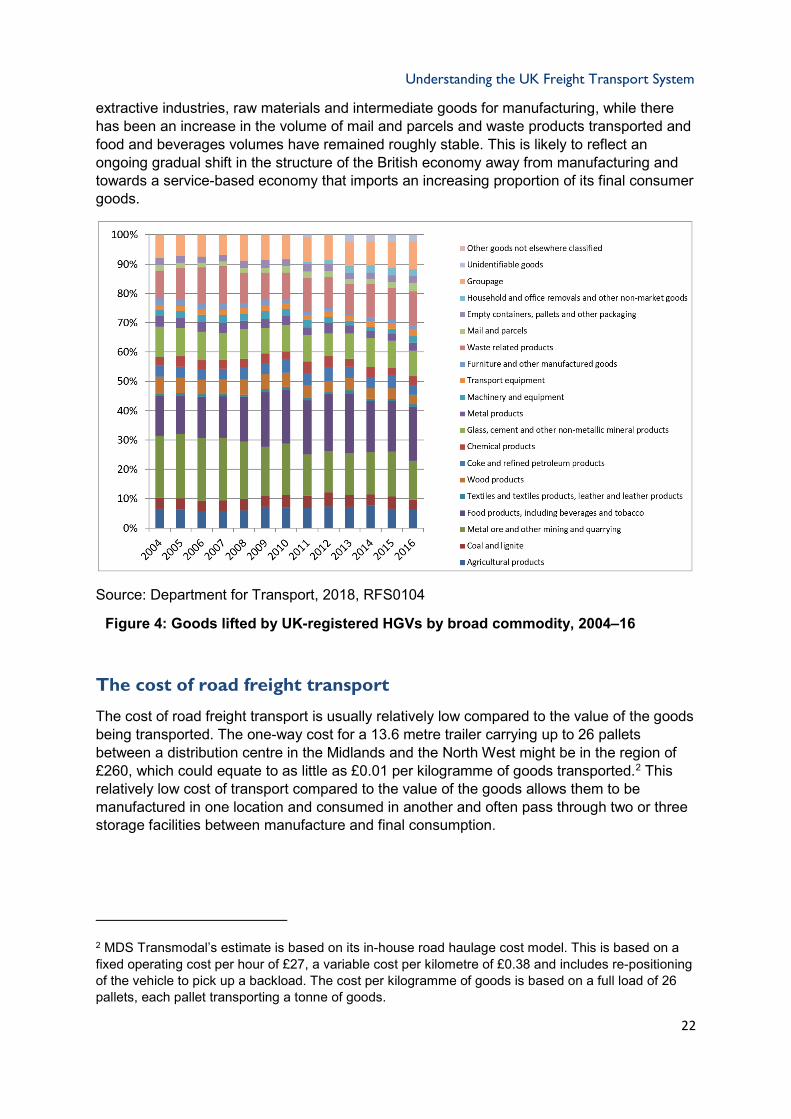
Figure 4 provides analysis of freight tonnes lifted by broad commodity by UK-registered HGVs over the period 2004–16 and as recorded in the DfT’s Continuing Survey of Road Goods Transport (Department for Transport, 2018, RFS0104). While the trends in different broad commodity groups can be difficult to establish from this data source, there appears to be a gradual reduction in the proportion of goods transported that relate to agriculture,
0
10
20
30
40
50
60
70
80
90
Billi
on v
ehic
le-k
m
Heavy Goods Vehicles
Light Commercial Vehicles
Understanding the UK Freight Transport System
22
extractive industries, raw materials and intermediate goods for manufacturing, while there has been an increase in the volume of mail and parcels and waste products transported and food and beverages volumes have remained roughly stable. This is likely to reflect an ongoing gradual shift in the structure of the British economy away from manufacturing and towards a service-based economy that imports an increasing proportion of its final consumer goods.
Source: Department for Transport, 2018, RFS0104
Figure 4: Goods lifted by UK-registered HGVs by broad commodity, 2004–16
The cost of road freight transport
The cost of road freight transport is usually relatively low compared to the value of the goods being transported. The one-way cost for a 13.6 metre trailer carrying up to 26 pallets between a distribution centre in the Midlands and the North West might be in the region of £260, which could equate to as little as £0.01 per kilogramme of goods transported.2 This relatively low cost of transport compared to the value of the goods allows them to be manufactured in one location and consumed in another and often pass through two or three storage facilities between manufacture and final consumption.
2 MDS Transmodal’s estimate is based on its in-house road haulage cost model. This is based on a fixed operating cost per hour of £27, a variable cost per kilometre of £0.38 and includes re-positioning of the vehicle to pick up a backload. The cost per kilogramme of goods is based on a full load of 26 pallets, each pallet transporting a tonne of goods.

Understanding the UK Freight Transport System
23
Load factors an empty running
Table 4 shows the road haulage sector’s performance in terms of empty running and load factors since 2006.
Table 4: Empty running and load factors in the road haulage sector, 2006–16
Year Empty running Load factor*
2006 26.8% 0.56
2007 27.4% 0.57
2008 28.9% 0.58
2009 28.3% 0.57
2010 28.7% 0.59
2011 30.2% 0.62
2012 28.5% 0.63
2013 28.6% 0.63
2014 28.8% 0.62
2015 28.6% 0.64
2016 30.2% 0.68 Source: Department for Transport, 2018, RFS0125
*The volume of goods moved as a proportion of the total volume of goods that could have been carried.
According to DfT statistics, empty running in the road haulage sector has fluctuated around a mean of 28.5% over the past decade (Department for Transport, 2018, RFS0125). The inherent nature of some road haulage operations is that vehicles are unable to collect a backload and have to return empty after making a delivery; examples would include HGVs delivering fuel to a filling station or aggregates to a construction site. Given that empty running has remained fairly stable over the past decade, this suggests that operators are generally able to secure return loads (thereby running loaded in both directions) where this is possible. Based on official DfT statistics there also appears to have been a gradual improvement in load factor over the past decade as road hauliers seek to increase their efficiency and remain competitive (Department for Transport, 2018, RFS0125).
3.3 Rail freight: volume & goods transported
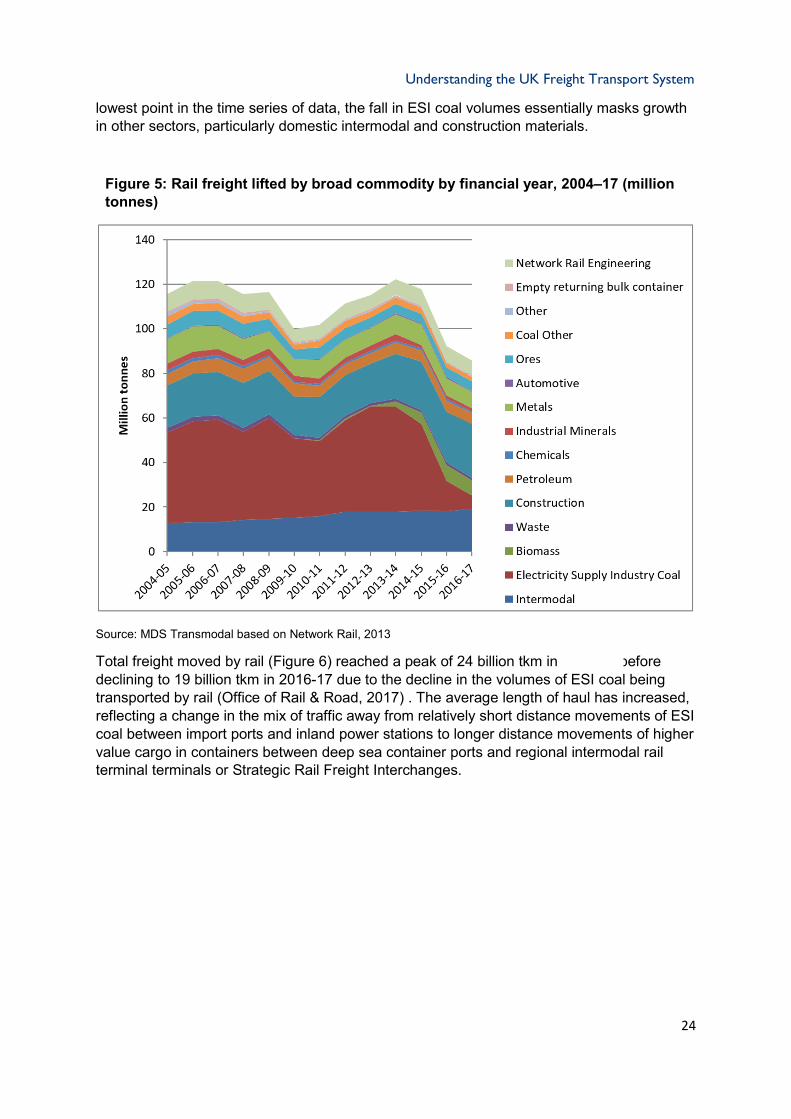
Total freight lifted by rail reached a post-crisis peak of 122 million tonnes in 2013–14, before declining by 30% to 86 million tonnes in 2016–17 (Figure 5). The significant fall in rail freight tonnage since 2013–14 was due to a dramatic reduction in coal volumes, principally coal supplied to the Electricity Supply Industry (ESI), which fell from a high of 47 million tonnes in 2013–14 to 6 million tonnes in 2016–17. This is explained by European emissions legislation and Government policy to phase out electricity generated from coal, which resulted in many coal-fired power stations closing over that period and a consequent reduction in the use of steam coal for electricity generation. While total rail freight volumes in 2016–17 were at their
Understanding the UK Freight Transport System
24
lowest point in the time series of data, the fall in ESI coal volumes essentially masks growth in other sectors, particularly domestic intermodal and construction materials.
Figure 5: Rail freight lifted by broad commodity by financial year, 2004–17 (million tonnes)
Source: MDS Transmodal based on Network Rail, 2013
Total freight moved by rail (Figure 6) reached a peak of 24 billion tkm in 2013-14 before declining to 19 billion tkm in 2016-17 due to the decline in the volumes of ESI coal being transported by rail (Office of Rail & Road, 2017) . The average length of haul has increased, reflecting a change in the mix of traffic away from relatively short distance movements of ESI coal between import ports and inland power stations to longer distance movements of higher value cargo in containers between deep sea container ports and regional intermodal rail terminal terminals or Strategic Rail Freight Interchanges.

Understanding the UK Freight Transport System
25
Figure 6: Rail freight moved by broad commodity, 2001–17 by financial year (billion net tonne-km)
Source: Office of Rail & Road, 2018c
By excluding coal from the data (Figures 7 and 8) the underlying trends within the rail freight sector become more apparent. Since the end of the financial recession in 2009, the fall in coal volumes has masked overall growth in the sector, principally driven by increasing volumes of domestic intermodal and construction materials.
0
5
10
15
20
25
30
Billi
on n
et to
nne-
km
Infrastructure
Other
DomesticintermodalInternational
Oil andpetroleumConstruction
Metals
Coal

Understanding the UK Freight Transport System
26
Figure 7: Total rail freight lifted 2004–5 to 2016–17 excluding coal (million tonnes)
Source: Department for Transport, 2018, RAI0402
Figure 8: Rail freight moved by broad commodity (excluding coal) 2001–17 by financial year (billion net tonne-km)
Source: Department for Transport, 2018, RAI0401
0
10
20
30
40
50
60
70
80
Mill
ion
tonn
es
0
2
4
6
8
10
12
14
16
18
20
Billi
on n
et to
nne-
km
Infrastructure
Other
Domesticintermodal
International
Oil andpetroleum
Construction
Metals

Understanding the UK Freight Transport System
27
3.4 Port freight: volume & goods transported
Total freight handled at ports (Figure 9) has gradually declined from a peak of 570 million tonnes in 2005 to 473 million in 2016 (Department for Transport, 2017a), a decline of 17% over 11 years. This decline is related essentially to the reduction in the volumes of crude oil and gas from the North Sea fields that is then exported either as crude or as refined petroleum products and the reduction in imports of steam coal as feedstock for inland power stations; between 2001 and 2016 total bulk traffic volumes have declined by 27% from 389 million tonnes to 284 million tonnes. Steam coal is being replaced as a feedstock for electricity generation to some extent by increased imports of liquefied natural gas (LNG) via Milford Haven in West Wales and a terminal on the Isle of Grain in the Thames Estuary and by biomass imported via ports such as Liverpool and Immingham, but also by a switch to renewables such as wind power that generate little tonnage through ports.
Figure 9: UK major port traffic by commodity group 2001–16 (thousand tonnes)
Source: Department for Transport, 2018, PORT0201
Other non-unitised traffics, such as forest products and steel, have generally fluctuated in line with the relative health of the construction industry. Most non-unitised traffic, with the exception of steam coal, forest products and steel, has little impact on strategic inland networks because it is either transported inland by pipeline or is only transported relatively short distances by either road or rail.
0
100,000
200,000
300,000
400,000
500,000
600,000
Thou
sand
tonn
es
All othergeneral cargotraffic
Allcontainer andro-ro
All dry bulktraffic
All liquidbulk traffic

Understanding the UK Freight Transport System
28
Table 5 shows the liquid bulk, dry bulk and general cargo commodity groupings divided into their individual commodities for the period 2006–16 (Department for Transport, 2017a). This shows that crude oil traffic declined by 39% over the period 2006–16, while liquefied gas traffic increased by 41% over the same period. Coal volumes handled by ports declined by 79% over the 10-year period.

Understanding the UK Freight Transport System
29
Table 5: UK major port liquid bulk, dry bulk and general cargo traffic, in thousand tonnes, 2006–16 (source DfT Port Freight Statistics, 2017)
Liquid bulk 2006 2007 2008 2009 2010 2011 2012 2013 2014 2015 2016
Liquefied gas 9,471 7,902 7,444 13,051 21,240 24,088 15,869 12,437 12,795 15,218 13,401
Crude oil 142,200 140,132 132,146 122,924 118,189 113,045 105,028 93,042 89,461 90,718 87,090
Oil products 85,120 85,960 86,814 79,094 79,415 81,414 78,794 81,868 74,455 77,953 78,450
Other liquid bulk 13,598 14,599 12,770 12,475 12,765 12,011 11,167 9,633 11,086 10,461 12,053
sub-total 250,388 248,592 239,174 227,544 231,609 230,558 210,858 196,980 187,797 194,351 190,994
Dry bulk
Ores 18,301 19,144 18,091 14,822 18,235 16,702 16,320 20,754 20,783 17,720 15,714
Coal 57,282 47,427 50,515 39,612 29,852 36,910 47,040 52,186 44,658 25,342 12,011
Agricultural products 13,095 12,746 13,978 13,966 15,024 13,448 13,540 13,099 14,127 13,242 14,007
Other dry bulk 44,403 46,067 42,272 30,643 34,296 36,349 33,981 35,378 42,417 47,761 50,885
sub-total 133,080 125,383 124,856 99,045 97,407 103,408 110,881 121,417 121,985 104,064 92,617
General Cargo
Forestry products 8,894 8,987 6,525 5,243 5,588 5,713 4,679 7,022 5,704 5,861 5,310
Iron and steel products 10,637 12,236 10,317 6,182 6,128 6,936 7,789 8,991 9,975 8,848 6,965
Other General cargo 7,141 6,215 6,243 5,451 5,068 5,368 5,846 5,387 5,526 5,615 5,112
sub-total 26,672 27,438 23,085 16,876 16,784 18,017 18,313 21,400 21,204 20,325 17,387

Understanding the UK Freight Transport System
30
The main growth sectors for international freight have related to unitised traffic, both short-sea traffic between Great Britain and the Continental mainland and Ireland and deep-sea container traffic between the UK and non-European locations, as shown in Figure 10 (Department for Transport, 2017a; Getlink, 2018). Unitised traffic overall grew from 12.0 million units in 2001 to 14.8 million units in 2007 before falling back to 12.4 million units in 2009 and then reached a new record high of 15.5 million units in 2016. A ‘unit’ in this context is, in general terms, the equivalent of a 13.6 metre-long semi-trailer which is transported by sea as either:
• an accompanied truck, which is transported on a ferry or on the Getlink Shuttle as an HGV accompanied by a driver;
• an unaccompanied trailer, which is transported on a ferry without a tractor unit and driver; or
• a container that is transported on a container ship or on a ferry.
Figure 10: UK ports unitised freight traffic by type of unit in both directions, 2001–16 (thousand units)
Source: DfT Port Freight Statistics and Getlink
Freight growth is due to a complex set of factors such as trade relations, international supply chains, UK’s propensity to import, liberalisation and population growth. This growth has had the following impacts on freight transport:
-
2,000
4,000
6,000
8,000
10,000
12,000
14,000
16,000
18,000
2001
2002
2003
2004
2005
2006
2007
2008
2009
2010
2011
2012
2013
2014
2015
2016
Thou
sand
uni
ts
Getlink Shuttle: accompaniedtrucks
Rail wagons, shipborne port-to-port trailers & barges
Unaccompanied trailers
Road goods vehicles
LOLO containers

Understanding the UK Freight Transport System
31
• The development of new deep-sea container port capacity at Felixstowe, London Gateway, Liverpool and Southampton over the last decade;
• Overall growth in intermodal rail freight services to link deep-sea container ports such as Felixstowe and Southampton to inland terminals in the Midlands, the North of England, Scotland and Wales (AECOM, 2016);
• Growth in traffic through Dover and on the Getlink freight shuttle services (Freightlink, 2016).
3.5 Air freight: volume & goods transported
Air freight is a highly specialised sector of the freight industry, which handles relatively low volumes of high value freight; in 2016 total air freight volume passing through UK airports was less than 2.4 million tonnes as shown in Figure 11 (Civil Aviation Authority Airport Statistics, 2017), while the total volumes of traffic handled through UK seaports was 473 million tonnes in the same year (Figure 11).
Figure 11 shows how the air freight sector was affected by the economic downturn, with a significant decline in traffic in 2008–9 and then a gradual increase up to 2016 to exceed the pre-crisis peak level. Most air freight handled at UK airports is carried in specialised containers in the belly holds of international passenger jets, principally wide-bodied aircraft operating on inter-continental routes. For this reason, Heathrow is by far the most important UK airport for freight in terms of tonnage handled, with a market share that has increased from 55% in 2001 to 64% in 2016. East Midlands and Stansted have specialised in handling dedicated air freighters operated by the main international express couriers (e.g. TNT, UPS), transporting less than container-load consignments on 24–48 hour lead times, generally feeding European hubs (such as Brussels and Leipzig) for services to the Far East. While air freight forms a very small percentage of the overall freight market when measured as tonnes-lifted, it forms a much larger proportion when measured by the value of the cargo lifted.

Understanding the UK Freight Transport System
32
Figure 11: Air freight by airport group, 2001–16 (thousand tonnes)
Source: Civil Aviation Authority Airport Statistics, 2017
Operations at airports that handle large volumes of freight, such as Heathrow, require support from specialised distribution facilities located close to the airports where air freight logistics operators receive and despatch air freight and provide storage. As the volumes of freight are quite low, only road freight transport is used for collection and delivery.
3.6 Waterborne freight: volume & goods transported
Freight moved by waterborne freight consists of:
• Coastwise traffic: freight moved around the coast of the UK;
• One-port traffic: freight moved between a UK port and offshore installations, such as offshore wind farms and oil and gas installations;
• Inland waters traffic: freight traffic carried by both barges and seagoing vessels along inland waters, both non-seagoing traffic and seagoing traffic which crosses into inland waters from the sea (Department for Transport, 2017b).
96% of waterborne freight relates to movements by seagoing ships, either coastwise or one-port movements or to and from inland waters by seagoing vessels. The only movements on inland waterways are on the main river estuaries such as the Thames, Humber and Forth and on the Manchester Ship Canal, while the use of broad-gauge canals and other rivers for freight is limited due to the lack of economies of scale that are available and the limited
0
500
1,000
1,500
2,000
2,500
Thou
sand
tonn
es
Northern Ireland
Scotland
Other North of England
Wales
Other Midlands
Other London & Southof EnglandManchester
East Midlands
Stansted
Heathrow
Gatwick

Understanding the UK Freight Transport System
33
connectivity provided by the network. There are no freight movements on narrow-gauge canals (Department for Transport, 2017c).
Total freight moved by waterborne freight has roughly halved since 2005 (Figure 12), particularly due to a fall in one-port traffic between UK ports and offshore oil and gas installations as activity in the North Sea has declined.
Figure 12: Waterborne freight moved by type 2001–16 (billion tonne-km)
Source: DfT Domestic Waterborne Freight Statistics
Seventy-six percent of goods transported on inland waters are bulk commodities such as aggregates and petroleum products, but there are unitload services that operate on sections of rivers that are classified as inland waters and there is also a container service that operates to a facility on the Manchester Ship Canal.
3.7 Pipeline: volume & goods transported
Pipelines provide a specialist mode of transport for the cost-effective transport of large volumes of bulk liquids and gases between ports and manufacturing sites, refineries and power stations. They have very high initial investment costs and so are only developed between locations where there are expected to be very high levels of demand over a long period; however, the operating costs are low.
0.00
10.0
20.0
30.0
40.0
50.0
60.0
70.0
80.0
2001
2002
2003
2004
2005
2006
2007
2008
2009
2010
2011
2012
2013
2014
2015
2016
Billi
on to
nne-
km
Inland waters
One port traffic of UK ports
Coastwise between UK ports

Understanding the UK Freight Transport System
34
Figure 13: Freight moved by pipeline in the UK 2001–15
Source: European Commission, 2017
Note: data for 2013–15 is estimated using European Commission data
Figure 13 shows the trend for freight moved by pipeline during the period 2001–15, including freight transported from the North Sea oil and gas fields. There has been a general downward trend due to the reduction in the output of oil and gas from the North Sea.
3.8 Active modes in freight: cycling & walking
There are no official statistics available on trends in the use of the active modes of transport, for freight namely cycling and walking. There has been longstanding use of these modes of transport by Royal Mail for the delivery of letters and packets in towns and cities. Looking forward it is likely that courier companies will make increasing use of cycling and walking to make final deliveries and collections of parcels in urban areas due to increasing road congestion and the need to operate within pedestrianised zones.
Deliveries of parcels by bicycle are therefore already possible in a number of urban areas for the delivery of lightweight and smaller parcels, particularly as separate infrastructure is developed for cyclists. With the increased importance of e-commerce, which involves the delivery of smaller parcels rather than larger consignments to retail outlets, the international parcels delivery companies that work for e-commerce retailers are more prepared to hand over parcels for ‘last mile’ deliveries to local courier companies for deliveries into the centre of urban areas. Bicycles can be used for a wide variety of deliveries and collections, with Hereford Pedicabs & Cargo delivering parcels and also collecting retail waste material (Hereford Pedicabs, 2016); while Zedify has tricycles that can transport up to 250kg (Zedify, 2018).
As urban centres have become pedestrianised with time windows that only allow road freight vehicles access at the beginning and the end of the day, final deliveries and collections are also carried out on foot by delivery staff.
0.0
2.0
4.0
6.0
8.0
10.0
12.0
14.0
2001 2002 2003 2004 2005 2006 2007 2008 2009 2010 2011 2012 2013 2014 2015
Billi
on to
nne-
km

Understanding the UK Freight Transport System
35
4 FREIGHT TRANSPORT SERVICES
4.1 Introduction
This section sets out the service providers that operate in the freight transport industry by mode of transport. While road and rail freight and bulk freight services can only be described in generic terms, data on unitload shipping services has been provided based on proprietary databases.
4.2 Road haulage services and 3PLs
Types of road freight enterprise
There were about 51,000 road freight enterprises, employing 284,000 people, operating in the UK in 2016. These road haulage enterprises operated a total of 499,400 HGVs (Department for Transport, 2018c).
Some 45% of road freight lifted is transported by vehicles operated by the owners of the goods. Operator licence restrictions prevent these ‘own account’ operators from conveying goods for other organisations, thereby limiting opportunities for backloads. 55% of freight lifted is contracted out to specialist road hauliers and third party logistics operators (public or third party haulage) on a ‘hire and reward’ basis. Reasons for shippers adopting an outsourcing strategy for their road haulage requirements include:
• Economies of scale: Larger third party operators can operate more efficiently due to, among other factors, managing large distribution centres shared between multiple shippers, more efficient HGV deployment (including greater opportunities to obtain return loads, to operate trucks full in both directions), shared back office costs and the use of sophisticated IT inventory systems;
• Quality: they are perceived as offering a higher quality of service than in-house transport operations as a result of competition to win and retain business;
• Innovation: they can introduce new ideas and working practices, overcoming in-house management inertia, and remove restrictive working practices.
While many smaller operators may struggle to generate the economies of scale enjoyed by the larger players, they can focus on offering services in specialist sectors such as bulk chemicals and temperature-controlled foods, and they can potentially develop closer relationships with customers and offer higher quality and more flexible services. The degree and level of outsourcing to logistics companies can vary, but typically it involves outsourcing day-to-day operations (distribution centres, inventory management and transport operations), while shippers maintain overall control of the supply chain (the structure of the supply chain, the number and location of distribution centres and modal choice), controlling inventory levels and purchasing policies.
Third party providers of road freight transport services can also be divided into two main types of organisation: road hauliers and third party logistics operators (3PLs).

Understanding the UK Freight Transport System
36
Road hauliers generally provide road transport services from one location to another at the direction of their customers. They are normally small to medium-sized concerns operating up to 1,000 vehicles and drivers, and range from publicly quoted companies through to family-owned businesses and owner drivers. Their key commercial operating strategy is to secure long-term contracted work directly from shippers and receivers, along with sub-contracted work for larger logistics providers and spot hire loads (occasional loads for shippers with irregular shipments), thereby ensuring that HGVs are nearly always ‘busy’. This can include offering ‘groupage’ services, where part vehicle loads from a number of shippers are combined to form a full vehicle load. Many hauliers provide some multi-user warehousing. Secure long-term revenue flows can then be used to invest in new HGV equipment.
More recently, many road hauliers have combined some of their operations to establish pallet load networks such as Palletline and Pallex to target shippers seeking to move less than full-load consignments on a next day basis. This is where hauliers belonging to the network will transport full loads from each of their home areas (comprising pallets from multiple customers) into a central hub which is normally located in the Midlands. The pallets are then cross-docked onto other vehicles for onward delivery (usually by another haulier in the network from the destination region). For example, pallets from Cardiff to Newcastle will initially move to the Midlands hub on an HGV from South Wales, before being re-loaded onto an HGV originating from (and returning to) the North East. By sharing loads in this manner, operators are able to fill vehicles in both directions, and can offer low-cost express ‘next day’ deliveries on a nationwide basis.
Third party logistics providers (3PLs) have usually grown out of road haulage businesses and are large publicly quoted companies that sell major shippers and receivers comprehensive packages of supply chain management services integrated with road transport operations. These services include non-transport activities (called ‘added value’ activities) including the provision and operation of distribution centres together with other services such as packaging, labelling and bar-coding and there is a strong focus on the application of ICT to the management of the supply chains and the transport movements within them. Their key commercial strategy is to secure long-term contracts with customers; again this allows investments in new HGVs and other equipment, secured against a long-term revenue flow.
More recently, so called 4PLs (or Lead Logistics Provider) have emerged. This is where the one company, contracted to the shipper, is then tasked with managing, coordinating and integrating the services of multiple 3PLs and road hauliers in order to deliver total supply chain benefit to the client.
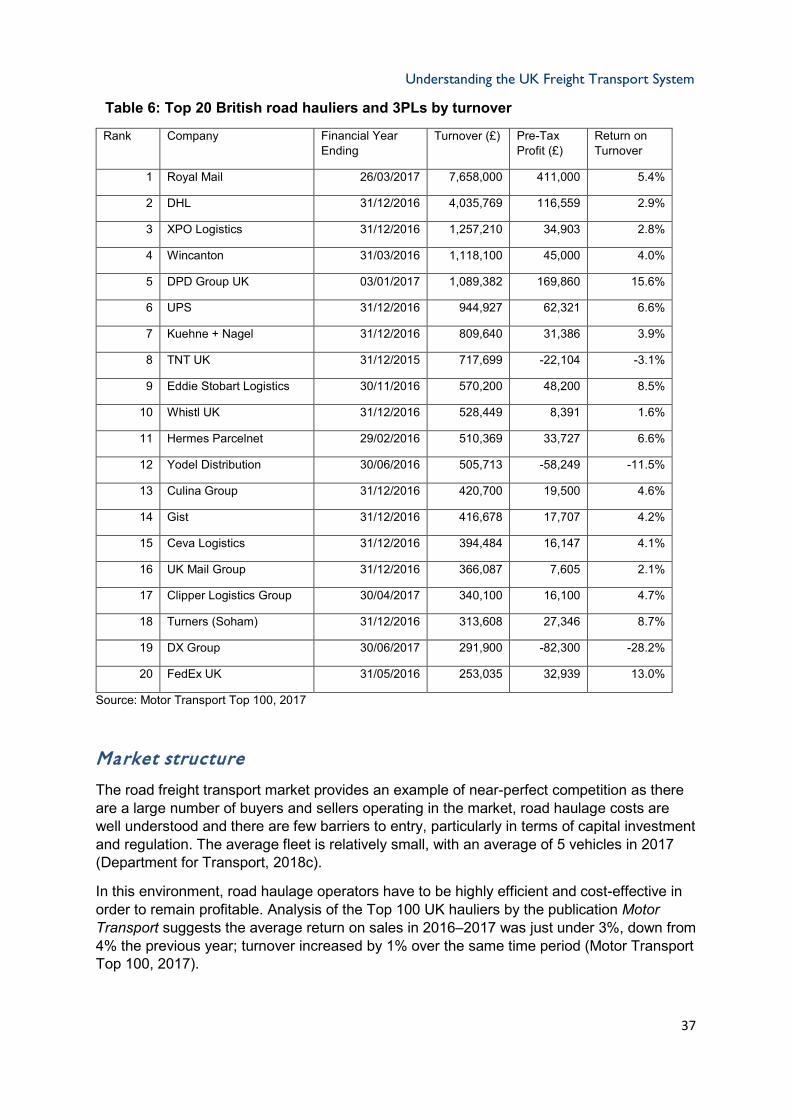
Table 6 shows the top 20 British road hauliers/3PLs as defined by turnover in 2016–17.
Understanding the UK Freight Transport System
37
Table 6: Top 20 British road hauliers and 3PLs by turnover
Rank Company Financial Year Ending
Turnover (£) Pre-Tax Profit (£)
Return on Turnover
1 Royal Mail 26/03/2017 7,658,000 411,000 5.4%
2 DHL 31/12/2016 4,035,769 116,559 2.9%
3 XPO Logistics 31/12/2016 1,257,210 34,903 2.8%
4 Wincanton 31/03/2016 1,118,100 45,000 4.0%
5 DPD Group UK 03/01/2017 1,089,382 169,860 15.6%
6 UPS 31/12/2016 944,927 62,321 6.6%
7 Kuehne + Nagel 31/12/2016 809,640 31,386 3.9%
8 TNT UK 31/12/2015 717,699 -22,104 -3.1%
9 Eddie Stobart Logistics 30/11/2016 570,200 48,200 8.5%
10 Whistl UK 31/12/2016 528,449 8,391 1.6%
11 Hermes Parcelnet 29/02/2016 510,369 33,727 6.6%
12 Yodel Distribution 30/06/2016 505,713 -58,249 -11.5%
13 Culina Group 31/12/2016 420,700 19,500 4.6%
14 Gist 31/12/2016 416,678 17,707 4.2%
15 Ceva Logistics 31/12/2016 394,484 16,147 4.1%
16 UK Mail Group 31/12/2016 366,087 7,605 2.1%
17 Clipper Logistics Group 30/04/2017 340,100 16,100 4.7%
18 Turners (Soham) 31/12/2016 313,608 27,346 8.7%
19 DX Group 30/06/2017 291,900 -82,300 -28.2%
20 FedEx UK 31/05/2016 253,035 32,939 13.0%
Source: Motor Transport Top 100, 2017
Market structure
The road freight transport market provides an example of near-perfect competition as there are a large number of buyers and sellers operating in the market, road haulage costs are well understood and there are few barriers to entry, particularly in terms of capital investment and regulation. The average fleet is relatively small, with an average of 5 vehicles in 2017 (Department for Transport, 2018c).
In this environment, road haulage operators have to be highly efficient and cost-effective in order to remain profitable. Analysis of the Top 100 UK hauliers by the publication Motor Transport suggests the average return on sales in 2016–2017 was just under 3%, down from 4% the previous year; turnover increased by 1% over the same time period (Motor Transport Top 100, 2017).

Understanding the UK Freight Transport System
38
Types of heavy goods vehicle
The vast majority of road freight lifted and moved is carried in heavy goods vehicles (HGVs), which are defined by the Department of Transport as vehicles over 3.5 tonnes gross laden weight (i.e. weight of vehicle plus its load).
Table 7 shows the numbers of HGVs by taxation group and axle configuration operating in Great Britain in 2016.
Table 7: Number of registered HGVs in Great Britain by type and axle configuration, 2016 (thousand vehicles)
Year HGV Trailer HGV Total
Rigid Vehicles
2 Axle 191.9 3.0 195.1
3 Axle 42.7 6.4 49.2
4 Axle 34.3 1.4 35.8
All Rigid 268.8 10.8 280.1
Articulated Vehicles
2 Axle Tractor & 2 axle trailer 7.1 0.0 7.1
2 Axle Tractor & 3 axle trailer 11.4 0.0 11.4
2 Axle Tractor & 4 or more axle trailer 2.8 0.0 2.8
All 2 Axle Tractor 21.4 0.0 21.4
3 Axle Tractor & 2 axle trailer 0.7 0.0 0.7
3 Axle Tractor & 3 axle trailer 101.3 0.0 101.3
3 Axle Tractor & 4 or more axle trailer 1.3 0.0 1.4
All 3 Axle Tractor 103.3 0.0 103.4
All Articulated Vehicles 124.6 0.0 124.7
All Goods Vehicles 393.5 10.8 404.8
Source: DfT Vehicle Licensing Statistics
The main type of HGV used for long-distance road haulage is the combination of a tractor and 13.6-metre trailer unit. However, smaller rigid HGVs represent 69% of the national fleet and are generally used for more local deliveries and collections.
‘Light goods vehicles’ or ‘LGVs’ (defined as a commercial vehicle with a maximum gross laden weight of 3.5 tonnes or less) are also an integral part of many logistics supply chains. This is particularly the case in the e-commerce and urban delivery markets, where LGVs are the obvious vehicle of choice given physical access limitations. They can also be driven using a standard ‘car’ driving licence, meaning a wider labour pool is available when compared with HGV-qualified drivers. The latest vehicle registration statistics from the DfT

Understanding the UK Freight Transport System
39
indicate that there are currently 3.8 million LGVs licensed in Great Britain compared with just under 0.5 million HGVs (DfT, 2018a).
There has been significant growth in the numbers of LGVs operating on British roads. The DfT’s figures indicate that LGVs are the fastest-growing segment of the road user market, with 70% growth over the past 20 years when measured in distance moved compared with 12% growth for cars and 5.5% growth for HGVs. This suggests that LGV traffic is growing, but not necessarily at the expense of HGV traffic. This LGV growth appears to have more or less mirrored recent trends in the retail sector, whereby e-commerce has shown significant growth rates and gained market share from traditional ‘bricks and mortar’ retailing. This appears to suggest the two trends are directly linked, given that online deliveries to homes or places of employment are predominantly undertaken by LGVs.
However, research by Professor Alan Braithwaite for the RAC Foundation (2017) suggests that the use of LGVs is diverse and extends beyond what is typically regarded as freight transport (i.e. the carriage of goods from one location to another). His research concluded that:
• The national LGV fleet is growing at around 5% annually; however, this is not at the expense of smaller HGVs, which also continue to grow, albeit at slower rates;
• E-commerce continues to grow between 10 and 12% each year, while e-commerce parcel volumes are growing at around 9% annually (the difference is accounted for by so called ‘click and collect’ orders);
• LGVs in use by parcel and grocery e-commerce operators comprise around 4% of the national LGV fleet and around 10% of LGV traffic, i.e. only one in 10 LGVs on the road is associated with e-commerce deliveries; and
• The implication to be drawn from this analysis is that, while LGVs are an important part of many supply chains, the majority of LGV movements on the road network are associated with economic activities other than, in particular, e-commerce. These include food distribution, construction and business services (such as plumbers, electricians, fitters, etc.).
Further research undertaken by Professor Braithwaite in the London Borough of Barking and Dagenham found that 37% of LGVs were unmarked, meaning it was difficult to determine their use based on the business type. Around 32% of LGVs were identified as undertaking ‘servicing’ activities rather than carrying freight, while it was also recognised that LGVs in this sector will convey parts and materials associated with that service. Likewise, LGV movements associated with food service (2%) and construction (8%) are also likely to be conveying materials. The research also suggested that 3% of vans in the Borough were being used directly for freight and another 3–4% were conveying parcels (though this share would rise if unmarked vans were to be correctly attributed).
Therefore, while the growth in LGV traffic on the roads is often assumed to be related to the growth in e-commerce, it is also likely to be related to the growth in service-related activity. However, both pieces of research also conclude that the use of LGVs in general, and in the freight/logistics sectors specifically, is poorly understood and that further work is required.

Understanding the UK Freight Transport System
40
4.3 Rail freight services
Market structure
The rail freight sector in Great Britain is effectively the only fully privatised part of the railway industry3, in that private sector freight operating companies (FOCs) compete for business in an open competitive market and, essentially, at their own commercial risk. Rail freight services are therefore a response to demand, rather than operating regardless of the number of passengers carried. Intermodal rail freight services, particularly those serving the deep-sea container ports, tend to operate as daily scheduled trains in much the same manner as passenger trains (services will always operate in their timetabled paths regardless of loadings). Likewise, conventional (bulk) rail freight trains have reserved paths in the working timetable, even if services may only actually operate when there is sufficient customer demand. For example, a bulk aggregates train may have a timetabled path on Mondays, Wednesdays and Fridays each week, but the train may only operate on Monday and Friday when demand is low.
There are currently five competing FOCs, namely:
• DB Cargo – a subsidiary of Deutsche Bahn (German railways);
• Freightliner – a subsidiary of Genesee and Wyoming (a US railroad holding company that has interests in rail freight operators in North America, Europe and Australia);
• GB Rail Freight – owned by Swedish private equity group EQT Partners;
• Direct Rail Services (DRS) – owned by the Nuclear Decommissioning Authority; while the ‘shareholder’ is a public sector body, the company is registered as a ‘Private Limited Company’. Aside from its in-house spent nuclear fuel operations, it operates in the same manner as the other privately owned FOCs by competing for traffics on commercial terms; and
• Colas Rail – a subsidiary of French industrial conglomerate Bouygues.
In simple terms, the five FOCs compete for traffic with each other, as well as with road haulage and coastal shipping in some market sectors. The rail infrastructure providers (principally Network Rail – see following section) supply freight paths to the FOCs on non-discriminatory terms but on the basis of the operators having ‘grandfather rights’, in return for payment of track access charges. The Office of Rail and Road, the independent regulator, provides impartial oversight in terms of charges and network access, thereby ensuring open competition.
Types of ra il freight service
Rail freight services can be categorised by mode of appearance – which refers to the way cargoes are presented for handling at rail terminals – into bulk and non-bulk rail freight.
Bulk rail freight is where a large volume of a relatively low value, heavy or voluminous and homogeneous commodity such as coal, aggregates or biomass is transported in specialist
3 Although, note the caveat around Direct Rail Services

Understanding the UK Freight Transport System
41
railway wagons, normally between privately owned railway sidings (e.g. between a quarry and aggregates terminal located near a major urban area or between a port-located biomass terminal and a power station). Commercially and contractually, many bulk rail movements are undertaken on what is known as a ‘hook and haul’ basis. This is where the shipper will own/lease the actual wagons, with a contracted FOC (generally following a tender) hauling them between cargo origins and destinations at the direction of the shipper. Contracts between FOCs and shippers can be 3–5 years in length. Bulk rail freight therefore relies on significant long-term investments from the private sector in the loading/discharge equipment at private sidings, traction and specialist wagons. These wagons are often leased on long-term deals from specialist leasing companies. The inherent nature of bulk rail freight is that wagons have to be re-positioned empty back to the cargo origin once delivery has been undertaken and this means that the shipper has to pay for a round trip.
In many bulk markets, rail effectively has a monopoly, particularly where planning conditions have been placed on some facilities (such as some quarries) requiring the operators to use rail rather than road for freight movements. More generally, road haulage may not be able to provide a cost-effective solution for the movement of bulk products because of the volume of product that needs to be transported, and the shipper/receiver will have invested in private rail sidings with the loading/discharge equipment at both cargo origin and destination.
The bulk rail freight market is relatively mature, with existing rail freight operators seeking to secure contracts from each other rather than developing major new markets. The principle exception to this is biomass for electricity generation, a relatively new commodity which the rail freight sector has used its inherent advantages to exploit. However, since 2013 there has been a dramatic decline in the volume of coal transport which has led to over-capacity in the market.
Many large-scale infrastructure construction projects are supported by bulk rail freight services. Heathrow T5 and the Olympic Park, for example, both relied heavily on rail freight for the import of aggregates, steel and other materials. Hinckley C power station, currently under construction, is receiving materials in bulk by rail. Large-scale projects such as the Heathrow third runway and HS2 projects would provide new opportunities for rail in the bulk market.
Non-bulk rail freight is where freight is mainly carried in some form of unit load. It includes intermodal rail freight, where cargo in some type of container unit is conveyed on flat-deck platform wagons between specialist intermodal terminals. It is termed ‘intermodal’ in that the container unit is designed to be moved by rail and other modes of transport, such as HGVs, ships or barges as well as by road, with transfer between modes taking place at an intermodal terminal. More unusually in Great Britain, non-bulk rail freight also includes palletised cargo conveyed in railway ‘box wagons’ or ‘vans’ between directly rail-linked warehousing so that the goods can be discharged directly from the box wagons into storage.
Interm odal ra il freight services
Commercially, there are two types of intermodal rail freight service, namely:
• Liner or scheduled services: This is where a FOC will operate a regular scheduled service (normally Monday to Friday) between two terminals, with shippers subsequently purchasing slots (capacity) on the train service. The train will operate to a fixed timetable regardless of whether it attracts any traffic. The commercial risk therefore rests with the FOC or in some cases with a shipping line, port or road haulier, who will require a minimum load factor in order to cover costs and render the service profitable; hence the

Understanding the UK Freight Transport System
42
commercial strategy of the risk-taker is to sell capacity for the highest value possible, taking into account competing services and modes. Liner services are therefore attractive to shippers moving less than trainload quantities on a daily basis as a trainload is constructed from multiple shippers.
• Contract (dedicated) trains: This is similar to ‘hook and haul’ bulk trains in that one train will be dedicated to a particular shipper or other commercial risk-taker such as a road haulier between two terminals, generally on a daily basis. A contracted FOC will haul intermodal wagons between cargo origins and destinations at the direction of the shipper. The commercial risk therefore lies with the shipper, in that the FOC will charge a fixed rate per trip regardless of how much traffic is conveyed. Contract trains are therefore only attractive to those shippers able to convey trainload volumes between terminals on a daily basis.
Intermodal rail freight services are usually carrying higher-value consumer (palletised) cargo and more lightweight general freight, rather than large volumes of a single commodity, and are more likely to be competing with long-distance road. The market for the inland distribution of deep-sea containers from ports such as Felixstowe and Southampton is well established and has been expanding. Most intermodal services are operated as liner/scheduled services, while a number of the largest deep-sea container lines have sufficient volumes moving on a daily basis to justify contracting dedicated trains.
Rail has a presence in only a few sectors of the domestic general freight market, principally between major national distribution centres in the Midlands and Scotland. Most of these are operated on a contract basis, either directly by large supermarket chains or by a handful of Scottish logistics operators with sufficient Anglo-Scottish traffic to fill a daily train. The domestic intermodal rail freight sector is generally therefore under-developed and there is substantial scope for growth in services at the expense of road haulage for domestic movements of high-value commodities on trunk routes where there are large volumes of regular flows.

Understanding the UK Freight Transport System
43
Shippers or their logistics providers may decide to use rail where the freight flow is large enough to justify a regular trainload and where the mode can meet the required service levels (e.g. transit time, frequency). If the freight flow is suitable for rail freight and an adequate level of service can be provided by rail, then the key decision-making factor is then cost. Rail is likely to have to be cheaper than road where the shipper is accepting service levels that are lower than could be provided by road.
CASE STUDY: FREIGHTLINER
Freightliner is the leading intermodal rail freight service provider in Great Britain, focusing on the transport of deep-sea containers between three deep-sea container ports (Felixstowe, Southampton and London Gateway) and 12 terminals in all the major British conurbations. It markets itself as providing 100 services each day and handles about 770,000 containers per annum.
The company’s operations started in the 1960s as part of British Rail but became a private company in 1995 just after privatisation of the rail freight industry in 1993–94. As a result of the privatisation process Freightliner inherited a network of intermodal terminals and it now serves its own terminals in Liverpool, Manchester, Leeds, Doncaster, Coatbridge, Birmingham, Bristol and Cardiff, as well as a number of third party terminals, including rail-connected distribution parks such as DIRFT at Daventry in the Midlands and 3MG at Ditton near Liverpool.
Freightliner has its own fleet of 250 trucks so it can offer a quay-to-door service for its customers, i.e. from the quay at the port to the regional intermodal by rail and then final delivery by truck to a distribution centre or manufacturing facility in the relevant region.
In 1999 the company established its Heavy Haul division and started to secure bulk rail freight contracts in competition with the incumbent bulk operator (English Welsh and Scottish Railway, now acquired by Deutsche Bahn) and has secured contracts in the bulk rail freight market. It has subsequently established rail freight operating subsidiaries in Poland and Australia. In 2013 the company purchased European Rail Shuttle (from global shipping line Maersk) which mainly operates rail freight services to and from the Port of Rotterdam.
Freightliner is owned by Gennesee and Wyoming, which is a US railroad holding company. The holding company has also purchased Pentalver, one of the largest container road hauliers in the UK.

Understanding the UK Freight Transport System
44
4.4 Container shipping services
Container shipping services provide cost-effective transport between the UK and the rest of the world and can be categorised as follows:
• Coastal services between two or more UK ports;
• Short-sea services between the UK and the rest of North West Europe, Ireland, Scandinavia, the Baltic, the Atlantic coast of Europe and the Mediterranean basin; and
• Deep-sea services between the UK and the rest of the world.
At the end of 2017 there were a total of 131 short-sea and deep-sea services linking UK ports with the rest of the world, provided by a total of 572 different vessels making calls at UK ports (MDS Transmodal, 2017). Figure 14 shows how the total annual capacity deployed by the shipping lines of 26.4 million TEU (20-foot equivalent units) is divided between the different routes by world region; the main routes are short-sea services, linking the UK to the rest of Europe (5.5 MTEU) and deep-sea services through the Suez Canal to the Gulf, Indian Subcontinent and the Far East (a total of 12.5 MTEU) and transatlantic to North America (3.3 MTEU).
Figure 14: Annual deployed short-sea and deep-sea container service capacity calling at UK ports by world region, 2017( million TEU)
Source: MDS Transmodal Container ship Databank
The vast majority of the individual services are short-sea, providing links between the UK and European markets and between North West European deep-sea container port hubs such as Rotterdam and Antwerp and UK regional ports. As shown in Figure 15, some 56% of the services that call at UK ports are short-sea rather than deep-sea services. The average size of the ships deployed on short-sea routes is 1,400 TEU, while the average size of ships on services to and from the Gulf and the Far East is 14,500 TEU.

Understanding the UK Freight Transport System
45
Figure 15: Number of short-sea and deep-sea container services calling at UK ports by world region, 2017
Source: MDS Transmodal Container ship Databank
On the deep-sea routes there are two key trends that are having a significant impact on the global container shipping market following the 2008–9 global economic crisis and as a result of the end of shipping line cartels in 2008:
• Ship sizes have increased as the major shipping lines have sought to secure economies of scale and reduce unit costs per container transported once their privilege to operate cartels was ended by the EU;
• Shipping lines have sought to consolidate both through mergers and acquisitions and also by forming three global alliances – called the 2M Alliance, THE Alliance and the Ocean Alliance – in order to have greater control over capacity on the major trade lanes such as between Europe and the Far East.
This has an impact on UK container ports in that they are faced with fewer customers and also have to cater for larger ships, which leads to a need to invest in enhanced facilities such as deeper dredged channels and quays; the larger ships also lead to a greater number of containers being loaded and unloaded at any one time, which places greater pressure on cranes, storage yards and on inland logistics.
There are almost no ‘pure’ coastal container services that only transport containers between two UK ports, but there are some 17 services that provide direct links between two UK ports while also serving ports in NW Europe or the Republic of Ireland. These services are included within the short-sea Europe and Mediterranean services in the analysis in Figures 14 and 15 above.

Understanding the UK Freight Transport System
46
4.5 RoRo shipping services
RoRo services, which are unitised cargo in trailers that are rolled on and off a ship without the use of a crane, provide frequent maritime transport links between Great Britain and the European continental mainland and Ireland. The overall market is usually split between:
• The GB–Continent market, which is then split further into the Dover Straits (between Dover and the Region Hauts-de-France4), the North Sea corridor (between GB ports in the Thames to Forth range to the Near Continent, Scandinavia and the Baltic) and the Western Channel (between GB ports in the Newhaven to Plymouth range to France and Spain).
• The GB–Ireland market, which is then split further between the Northern Corridor (GB ports to Northern Ireland), the Central Corridor (Lancashire and North Wales ports to Dublin) and the Southern Corridor (South West Wales ports to southern Ireland).
At the end of 2017 there were a total of 56 RoRo services carrying freight at GB ports, provided by a total of 112 different vessels (MDS Transmodal, 2017).
Figure 16 shows how the total capacity deployed by the ferry operators in the GB–Continent market in late 2017 of 130 million lane metres is divided between the different corridors; the dominant corridor is the Dover Straits with 65 million lane metres of capacity provided by the high-frequency ‘turn-up and go’ ferry services that operate on this corridor for driver accompanied trucks. However, for slower-moving unitload traffic, the North Sea corridor both on the southern North Sea (to and from the Thames and Harwich Haven) and the Northern North Sea (to and from the Humber, Tees, Tyne and Forth) provide a combined deployed capacity of 55 million lane metres.
Figure 16: Annual deployed capacity in the GB–Continent market in million lane metres, 2017
Source: MDS Transmodal Ferry Databank
4 Formed from a merger of the former regions of Nord Pas de Calais and Picardie, with the new region coming into existence on 1 January 2016.
0.0 10.0 20.0 30.0 40.0 50.0 60.0 70.0
Dover Straits
Northern North Sea
Southern North Sea
Western Channel
Million lane metres

Understanding the UK Freight Transport System
47
Figure 17 shows how the total capacity deployed by the ferry operators in the GB–Ireland market of 58 million lane metres is divided between the different corridors; the two most important corridors are the Northern and Central Corridors which link Great Britain with the major Irish population centres of Belfast and Dublin respectively.
Figure 17: Annual deployed capacity in the GB–Ireland market in million lane metres, 2016
Source: MDS Transmodal Ferry Databank
Commercially, most RoRo services on GB–Continent and GB–Ireland routes are operated on a scheduled/liner basis. Services therefore operate to scheduled timetables, with the shipping lines selling capacity (deck space) to road hauliers and logistics operators in an open competitive market. Road hauliers therefore have a choice of routes and shipping lines and the commercial risk rests with the shipping line, with sales revenue needing to cover operating costs in order to generate a financial return. The key players in the RoRo market are:
• Dover Straits – P&O Ferries, DFDS and Eurotunnel;
• Western Channel – Brittany Ferries and LD Transmanche;
• North Sea – Stena Line, P&O Ferries, Cobelfret and DFDS; and
• Irish Sea – Stena Line, Irish Ferries, Sea Truck and P&O Ferries.
In most cases, space is sold to hauliers and logistics operators on a third party basis, so that the shipping line has no financial interest in the hauliers. However, Cobelfret, P&O and DFDS also own subsidiaries that are pan-European logistics companies.
0.0 5.0 10.0 15.0 20.0 25.0 30.0
Central
Northern
Southern
Million lane metres

Understanding the UK Freight Transport System
48
Small island communities located off the mainland of Great Britain rely on lifeline services to receive supplies and to facilitate trade with the mainland and the rest of the world. The relevant island groups are:
• The Western Isles of Scotland, served by services operated by Caledonian Macbrayne that operate between the mainland and 23 island communities, as well as providing some inter-island services;
• The Northern Isles of Scotland (Shetland and Orkney), served by Northlink Ferries which provides links to and from the mainland (both Aberdeen and Scrabster) and between the two island groups;
• The Channel Islands, which has freight services to and from Portsmouth operated by Condor Ferries;
• The Isle of Man, which has a freight service mainly to and from Heysham operated by the isle of Man Steam Packet Company;
• The Isle of Wight, which has freight services provided by Red Funnel (to and from Southampton) and Wightlink (to and from Portsmouth and Lymington).
4.6 Bulk shipping
Bulk shipping provides port-to-port shipping services transporting unpackaged dry bulk cargoes (such as coal, iron, ore, cement and grains) and liquid bulk cargo (such as crude oil, chemicals, liquid natural gas and refined petroleum products). The ships are usually specialised and so transport large volumes of a homogeneous cargo between specialised port handling and storage facilities.
In 2016 some 47,000 ship arrivals at UK ports were either by liquid bulk tankers or dry cargo vessels out of a total of 138,000 arrivals, so that bulk shipping accounted for about one third of all ship calls (Department for Transport, 2017a).
Typical flows in the UK might be the transport of refined petroleum products by a petroleum products tanker from a coastal oil refinery to a coastal tank farm (a storage facility for bulk liquid products) or the shipping of cement in a bulk carrier from a port close to a cement production facility to a port for storage and then use in development projects in the surrounding region.
These bulk shipping services are usually provided by the shipping company to a shipper on a single contract (or voyage charter) rather than on a regular scheduled basis, with the contract stipulating the movement of the cargo between two ports for a given contract value.

Understanding the UK Freight Transport System
49
5 THE STRATEGIC FREIGHT INFRASTRUCTURE NETWORK
5.1 Introduction This section describes the infrastructure that freight transport services use, whether it is publicly or privately owned.
The road and rail networks are predominantly publicly owned and managed and freight transport operators generally share use of the infrastructure with passengers. The most important types of privately owned infrastructure in relation to freight transport are distribution centres, ports and airports. Distribution centres are commercial developments and, although some smaller ports are owned by local authorities and there are a number of ‘trust ports’ such as Dover, Port of Tyne and Milford Haven (which are required to re-invest any financial surpluses), the major UK ports are privately owned following a programme of privatisation in the 1980s and 1990s.
5.2 The strategic road network
The highway network in Great Britain is mainly owned and operated by an arm of the state, with Highways England, Transport Scotland and the Welsh Government owning and operating the strategic highway network in each country and local authorities owning and operating other roads.
The highways network is principally funded from general taxation rather than from vehicle excise duty or fuel excise duty. The exceptions to this are the direct charges levied to use a number of major estuary crossings such as the Dartford Crossings and the M6 Toll and which are funded either by borrowing or a PFI scheme. There are some private highways in and around ports, airports and logistics parks; these were originally funded and are maintained by the facilities owner, even if the general public can in some circumstances drive on them. Highways England, as a DfT-owned company, is subject to economic monitoring by the Office of Rail and Road (ORR).
The Strategic Road Network in England (defined as that owned and managed by Highways England) consists of about 3,000 km of motorways and 4,100 km of trunk A roads. While it represents only 2% of the total road network, it accommodates 66% of HGV tonne-km (Department for Transport, 2015) because a high proportion of freight traffic is strategic in nature and is moving over long distances.
Figure 18 shows the estimated flows of HGVs on the GB road network (MDS Transmodal, 2017), highlighting how the major flows are concentrated on the motorway and trunk road network.

Understanding the UK Freight Transport System
50
Figure 18: Annual HGV flows on the GB road network, 2016
Source: MDS Transmodal GB Freight Model
5.3 Distribution centres & other storage
Within the general cargo and consumer goods sectors, the ‘hub’ of most logistics operations is the distribution centre and these have tended to be located on greenfield sites close to, or with easy access to, the strategic road network to increase the efficiency of road-based distribution operations and avoid conflicts with local residents. There are basically two types of distribution centre (DC):
• National distribution centres (NDCs): these act as inventory holding points for imported and nationally sourced goods, before re-distribution to subsequent stages in the supply chain. Average dwell time varies considerably but may average 4–6 weeks. They are termed ‘national’ because they serve the whole of Great Britain (and often Ireland) from the one site and are normally associated with manufacturers, with suppliers
Understanding the UK Freight Transport System
51
to retailers such as importers of electrical goods, beers/wines/spirits or clothing and major retailers. NDCs have traditionally been located in the Midlands, as they are centrally located to serve domestic suppliers, ports and regional distribution centres, thereby minimising overall road transport costs. Outbound flows were typically to regional distribution centres or retail outlets, although direct deliveries to homes are becoming increasingly important due to the increasing levels of e-commerce.
• Regional distribution centres (RDCs): these receive goods from NDCs or direct from suppliers, before re-distributing the goods to retail outlets and, increasingly, direct to homes. They have a regional hinterland and are normally associated with retailers which receive inbound goods from suppliers and their own NDCs before consolidation into loads for individual retail outlets throughout the region. Dwell times are much shorter; perishable and time-sensitive goods will be redistributed within 24 hours without passing through pallet racking systems and with a simple transfer between vehicles (a process called ‘cross docking’).
Goods with short lead times and time-sensitive cargoes would generally pass direct to an RDC from a domestic supplier or port. Some DCs act as both national and regional distribution centres, depending on the precise distribution requirements of the business.
Distribution centres for the large retailers therefore form part of complex international supply chains and a typical distribution centre can be expected to receive goods from domestic, EU and deep-sea sources. Goods with short lead times (essentially domestic and EU sourced goods) and those which are time-sensitive usually pass through distribution centres fairly quickly. Cargo with a longer lead time, principally that from deep-sea sources, tends to be stored for longer periods ahead of demand.
In addition to the traditional storage and re-distribution functions at pallet level quantities, distribution centres are increasingly the location of other ‘added value’ operations. With respect to e-commerce, they are often the location of product ‘fulfilment’; this is where an individual order will be received, ‘picked’ from storage, prepared and appropriately packed and then dispatched to the customer’s delivery address. Associated returns processing and other back office functions may also be co-located at the same distribution centre.
UK distribution centres are still fairly labour intensive, despite some automation driven by e-commerce and fulfilment. Employment densities are in the range 70–95 square metres per FTE (full-time equivalent), with NDCs generally recording higher levels of employment per square metre (Homes and Communities Agency, 2015).
Figure 20 shows the location of ‘large’ distribution centres in England, defined as more than 8,000 square metres of storage space. The map shows that there is a concentration of distribution centres (mainly NDCs) in the so-called logistics ‘Golden Triangle’ (bounded by the M42, M1 and M6), but there are also significant concentrations located within or close to the major British conurbations.

Understanding the UK Freight Transport System
52
Figure 20: The location of distribution space over 8,000 square metres in England and Wales in 2017
Source: MDS Transmodal, based on Valuation Office Agency data
The concentrations of distribution centres in different regions reflects their competitiveness in terms of total transport costs for inbound and outbound cargo, land values and the cost of labour. The Midlands and parts of the North of England tend to be the most favoured areas for NDCs because these areas minimise the overall costs when goods have to be received from both overseas and around Britain and then distributed to all other British regions. This is shown in Table 8, which compares the proportion of distribution centre space (medium and large-scale distribution centres over 5,000m2) in England and Wales by region compared to the proportion of the population (MDS Transmodal, 2017). Whereas London – with 15% of the total population of England and Wales and only 6% of the warehousing space – is relatively under-represented, the East Midlands – with only 8% of the population but 17% of the warehousing space – has a relative specialisation in providing distribution space.

Understanding the UK Freight Transport System
53
Table 8: Comparison of warehousing space with population for English regions & Wales in 2016–17
Region Proportion of warehousing space
(more than 5,000m2) in 2017
Proportion of population in mid-2016
East of England 10% 11%
East Midlands 17% 8%
London 6% 15%
North East 3% 5%
North West 15% 12%
South East 10% 15%
South West 6% 9%
Wales 3% 5%
West Midlands 16% 10%
Yorkshire and the Humber 12% 9%
Total 63.8 million m2 58.4 million
Source: MDS Transmodal Distribution Centre Database & Office for National Statistics
The provision of warehousing is a purely commercial function undertaken by commercial property developers, often in association with pension/investment funds, although some commercial property developers such as Goodman and Pro Logis are also investment funds in their own right. Developers identify and acquire sites, design and build the distribution centre units, which are then let to long-term occupiers. The consequent annual rental payments represent the developer’s investment return, or alternatively the completed and occupied unit may then be sold to a pension/investment fund (sale proceeds minus development costs representing the developer’s return). Warehousing is therefore the key fixed infrastructure required by (and used by) the general cargo/consumer freight sector, even if it is delivered and funded by long-term private sector investment. The warehouses are therefore commercial investments intended to make a financial return for the investor. As with all commercial investments, the decision on whether to proceed will take into account the capital costs alongside future revenue streams, the likely payback time and overall financial return.
However, delivery of distribution space is ultimately reliant on the planning system; land needs to be allocated through local plans and consents granted at commercially attractive locations. These are generally close to strategic transport routes, to the markets to be served and to a labour supply. Conflicts often emerge, with many sites that could be competitive geographically being located in the greenbelt or in competition with proposed residential developments.
The key to achieving sustainable distribution for medium- to long-distance flows is the development of Strategic Rail Freight Interchanges (SRFIs) and port-centric distribution. SRFIs are large developments of modern large-scale distribution centres co-located on the

Understanding the UK Freight Transport System
54
same site as an intermodal terminal. This renders rail freight services to and from the SRFIs more cost-effective because the origin and/or destination of the door-to-door freight transport movement (a distribution centre) is next to the rail terminal so that no road delivery or collection is required between the rail freight terminal and the distribution centre. This is considered further in section 5.4.
Port-centric distribution provides similar advantages to SRFIs, but the distribution centres are located in or close to a port estate or a wharf on a major inland waterway such as the Manchester Ship Canal. This renders maritime or waterborne freight services to and from the port or wharf more cost-effective because the port or wharf is the origin and/or destination of the door-to-door freight transport movement with no need for an inland movement by road.
5.4 Rail freight network
The GB ra il network
The vast majority of Britain’s rail network is owned and operated by Network Rail. Network Rail is an arm’s length public sector body of the Department for Transport. However, it is subject to independent economic and safety regulation by the Office of Rail and Road (ORR). Its revenue comes from three main sources, namely track access charges paid by the passenger and freight operators for using the network, a direct grant from the DfT and property/rental income. Section 5.6 describes how it is funded with respect to day-day operations and investments in enhancements. The two principal track networks not owned by Network Rail are HS1 and the Channel Tunnel, which are both operated under private sector concessions.
Data on the length of the rail network in Great Britain in 2016–17 shows that the total network available for freight movements is some 15,800 km, of which 1,300km is only available for freight (Office of Rail & Road, 2018a). Since 2004–5 the total length of the network has remained essentially stable (Figure 21).

Understanding the UK Freight Transport System
55
Figure 21: Rail infrastructure length 2001–2 to 2016–17
Source: Office of Rail and Road, 2018
Some 92% of the network is shared by freight and passenger trains and where there is congestion on the network this can lead to a lack of capacity for new rail freight services; FOCs are unable to acquire new paths (over and above existing utilised paths) as the network is effectively ‘full’. As rail freight services are provided in response to demand, rather than being timetabled in advance of demand, the timetabling of additional passenger services could therefore lead to a lack of capacity for additional freight services on the network. Proposals for additional train services should consider both existing passenger and freight services, and their growth potential. For many routes, or times, there may not be additional spare capacity, so decisionmakers will have to balance competing priorities.
Just over 10 years ago, the Government and Network Rail announced their intention to develop a Strategic Freight Network (SFN) on the railways (Department for Transport, 2007). The SFN was intended to be a core network of trunk freight routes capable of accommodating more and longer freight trains, and being able to handle wagons with a greater loading gauge, integrated with and complementing the existing mixed traffic network. The Government recognised that investment will be required to deliver the SFN, and subsequent funding settlements for Network Rail have included targeted investment in this network.
Figure 22 shows the estimated flows of rail freight services on the GB rail network in terms of average weekday trains in 2016–17, highlighting how the major flows are concentrated on the major north–south link of the West Coast Main Line, between the two major deep-sea container ports of Felixstowe and Southampton and to/from the port of Immingham.
0
2,000
4,000
6,000
8,000
10,000
12,000
14,000
16,000
2001
-02
2002
-03
2003
-04
2004
-05
2005
-06
2006
-07
2007
-08
2008
-09
2009
-10
2010
-11
2011
-12
2012
-13
2013
-14
2014
-15
2015
-16
2016
-17
Kilo
met
res
Open for Passenger & FreightTraffic
Open for Freight Traffic Only

Understanding the UK Freight Transport System
56
Figure 22: Average daily freight trains on the GB rail network 2016–17
Source: MDS Transmodal GB Freight Model
Rail freight term ina ls
Rail freight terminals are needed to allow the transfer of cargo between rail and, in particular, road transport. As for rail freight services there are two types of rail freight terminal, namely:
• bulk terminals; and
• intermodal rail freight terminals and SRFIs.
Bulk rail terminals are normally located on private sidings that are either owned or leased on a long-term basis, by the shippers and receivers of the cargo. The terminals are needed for the transfer of bulk commodities to and from rail where rail is most likely to be the most cost-effective mode of transport for long-distance transport (e.g. for the transport of stone

Understanding the UK Freight Transport System
57
between quarries and major cities for construction projects or for the transport of iron ore from a port to a steelworks). The loading and discharge equipment will have been funded by the cargo shipper and/or receiver. Such facilities therefore rely on significant long-term investments from the private sector in the loading/discharge equipment at the private sidings.
Intermodal rail freight terminals are designed to transfer units between rail and road, and they generally consist of sidings to accommodate trains, special cranes for loading and unloading the units and space for storage. There are existing terminals at the main deep sea container ports as well as some short-sea container ports (principally investments by the ports themselves) and in the British regions with major population centres (i.e. Greater Manchester, West Yorkshire, Liverpool, the West Midlands, Bristol, London, South Yorkshire and the Central Belt of Scotland). Most of these terminals, which were originally developed by British Rail in the 1960s and 1970s, have no distribution centres located on the same site.
Rail freight can offer very competitive transport solutions, when compared with road transport, even over short distances of 100km or less. However, two conditions are required to render such flows competitive:
• The ability to move the product directly between two rail-served facilities i.e. without the requirement to use road transport for part of the end-end journey; and
• The ability to move large quantities in one move on a frequent and regular basis to provide the sufficient volume of traffic to fill a full-length train and provide efficient use of assets.
This explains why for bulk products, shippers and receivers have invested in bulk rail terminals at both cargo origin and destination. Examples include the former merry-go-round coal trains which operated over short distances between collieries (and latterly ports) and coal-fired power stations, and aggregates trains moving product from rail-served quarries to rail-served urban distribution depots; these flows can provide sufficient volumes of traffic for economic trains to operate on a frequent and regular basis.
Where one end of the supply chain is not rail-served, there is a consequent need to use road transport to complete the trip (i.e. to move the cargo from shipper to a rail-head or from a rail terminal to the final customer) and this introduces additional costs compared with one where both ends are rail-served (handling costs and road haulage). Under this operating scenario, the break-even distance (with road transport) increases to around 250km. Where neither end of the transport chain is rail-served and road transport is required at both ends, this distance rises to around 400km. This explains why intermodal container trains from Southampton or Felixstowe will serve destinations from the Midlands northwards (final trip to the end-user generally being by road), with inland destinations in the South East being served by road transport.
In the intermodal sector, therefore, the key factor in attracting traffic away from road transport, particularly over distances less than 250km, is the development of large scale distribution centre capacity at sites with intermodal rail terminals. This is necessary as intermodal services higher value cargo that passes through large scale distribution centres. In planning terms, these are called Strategic Rail Freight Interchanges (SRFIs). When large distribution centres are located on rail-served sites, rail is able to offer significant cost advantages over road transport and the concentration of large scale distribution centres on a single site also generates the requisite volumes of cargo to fill a full-length train.

Understanding the UK Freight Transport System
58
SRFIs are large developments (over 60 hectares) of modern large-scale distribution centres co-located on the same site as an intermodal terminal, serving the on-site distribution centres and the wider region. They need to be located on main lines with a loading gauge that can accommodate cost-effective intermodal trains and located close to the strategic highway network and close to major urban conurbations; the latter provides both consumers for the cargo passing through them and a local source of labour. Suitable sites for SRFIs are very limited and are often located in the greenbelt. Their development also relies on train paths being available on the network and terminals being available at SRFIs; however, freight services struggle to secure capacity on the network in some locations in competition with passenger services and the planning system has also found it difficult to provide SRFI capacity in key locations such as the South East. Given the above, the Government has attempted to promote their development by classifying them as Nationally Significant Infrastructure Projects (NSIP) and including them in the National Planning Statement for National Networks policy statement.
Figure 23 shows the location of existing Strategic Rail Freight Interchanges (SRFIs) in Great Britain. Note that ‘Future SRFIs’ are those which have been granted consent and are currently under development. Consent for SRFIs at Radlett (Hertfordshire) and Howbury Park (Dartford) have previously been granted, albeit work has yet to commence on construction; in the case of Howbury Park, the consent time limit has passed and a fresh application is being progressed (Greater London Authority, 2016).

Understanding the UK Freight Transport System
59
Figure 23: Location of Strategic Rail Freight Interchanges in GB
Source: MDS Transmodal
As for stand-alone distribution centres, SRFIs are funded by commercial property developers on a commercial basis and are essential to securing a shift of traffic from road to rail over medium- to long-distances. The relatively large distribution sites required by SRFIs generate a critical mass of rail freight traffic for the economic operation of rail freight services and also reduce operational costs for the operators of distribution centres. They are therefore key fixed infrastructure assets that are delivered and funded) by long-term private sector investment that is intended to provide a financial return for the investor.
However, delivery is ultimately reliant on the planning system; land needs to be allocated through local plans and consents need to be granted at the commercially attractive locations. These are generally close to strategic transport routes, markets to be served and a labour supply. Conflicts therefore often emerge, with many geographically competitive sites being

Understanding the UK Freight Transport System
60
located in the greenbelt or competing with proposed residential developments. It is noteworthy that proposed SRFIs in London and the South East have experienced protracted consideration by the planning system. Both Radlett and Howbury Park were examined at public inquiries before consent was granted (twice in the case of Radlett, along with a judicial review), while a further scheme near Slough was twice rejected following a planning inquiry. Despite the Government’s attempt to promote such schemes, the fact that the most optimal sites are located in the greenbelt or on similarly designated land means they are often open to challenge (particularly by local authorities) and detailed examination through the planning system. Schemes in the Midlands and North of England have generally experienced a smoother passage through the planning system.
5.5 Port infrastructure network
Ports in the UK fall into one of three categories, namely:
• Privately owned ports – usually by large publicly quoted companies, investment funds or multi-national port owning organisations;
• Trust ports – owned by an independent statutory body; and
• Municipal ports – owned by a local authority.
Most of the largest ports (in terms of traffic handled) are privately owned by Associated British Ports, Forth Ports, Peel Ports, PD Ports, Hutchison and DP World, while smaller ports tend to be Trust or Municipal. The notable exceptions are the larger ports of Dover, the Port of Tyne, London and Milford Haven (all trust ports) and Portsmouth (a municipally owned port).
Table 9 shows the traffic volumes for the top 10 UK ports in 2016. Many of these ports are multi-purpose ports handling a broad range of both unitised and bulk cargoes, such as Grimsby and Immingham, London, Southampton, Liverpool, Forth, Tees and Hartlepool and Belfast, but a few are focused principally on unitised cargoes (Felixstowe and Dover).
Table 9: Top 10 UK ports by traffic volume, 2016
Rank Port name Traffic volume in tonnes (million)
1 Grimsby & Immingham 54.4
2 London 50.4
3 Southampton 36.0
4 Milford Haven 34.8
5 Liverpool 31.9
6 Felixstowe 28.2
7 Forth 27.4
8 Dover 27.3
9 Tees & Hartlepool 26.9
10 Belfast 17.6
Source: DfT Port Freight Statistics

Understanding the UK Freight Transport System
61
Irrespective of ownership, ports generally have two key functions, namely:
• Commercial – generating revenue from berthing vessels, handling cargo and renting land/facilities; and
• Conservancy – the safe movement of shipping within their respective ports.
There are a number of examples, however, where the (trust) port authority only has a conservancy role, with the cargo-handling facilities contained within them being owned by private companies. These ports, all of which have trust port status, include Harwich Haven Port Authority (providing conservancy for the estuary upon which the ports of Felixstowe, Harwich and Ipswich are located) and the Port of London. All ports, regardless of ownership, are operated on purely commercial terms without any Government or state support. Revenue must cover costs and investment in infrastructure (see below) has to be funded on commercial terms. In that respect, ports operate in an open market, competing with each other for traffics, and are able to charge whatever the market will bear.
There are broadly three types of port infrastructure, namely:
• Liquid or dry bulk – jetties or quays and associated discharge/loading equipment, often associated with a nearby production facility such as an oil refinery or steelworks.
• Unit load/unitised traffic – roll-on/roll-off (RoRo) ferry berths and lift-on/lift-off (LoLo) quays plus associated craneage; and
• Semi-bulk /general cargo quays plus associated loading/discharge equipment e.g. for the specialised handling of steel and forest products
Table 10 provides analysis of the GB port infrastructure network in terms of some of the key parameters that determine capacity and capability (MDS Transmodal, 2017). In total there are an estimated 16 km of container terminal quay for the handling of container ships and some 209 km of quay for handling bulk and general cargo traffic. At the same time there are an estimated 730 hectares of space at ports for the handling and storage of RoRo/ferry traffic and 470 hectares of land for the handling and storage of trade vehicles. As well as the three main types of port infrastructure shown above, specialist facilities for trade vehicles are also shown as they require large amounts of land for vehicle storage.

Understanding the UK Freight Transport System
62
Table 10: GB port infrastructure by type and region in 2015
Region LoLo facilities RoRo/ferry facilities Trade vehicle facilities Bulk/general cargo facilities
No. of facilities
Total quay length (km)
No. of facilities
Terminal space (hectares)
No. of facilities
Terminal space (hectares)
No. of facilities
Total quay length (km)
East Midlands
1 0.2 - - - - 3 1.2
East of England
7 4.0 4 59.9 2 139.2 24 10.6
London 9 1.5 4 75.0 1 150.0 87 18.9
North East
4 1.5 3 40.6 2 48.9 27 13.8
North West
2 1.1 9 49.3 2 7.7 44 30.6
Scotland 6 1.8 17 54.9 1 0.2 70 40.4
South East
2 1.9 12 107.6 2 83.0 60 20.3
South West
1 0.9 1 27.5 2 146.7 21 16.2
Wales 4 1.0 9 42.0 1 0.3 37 29.0
Yorks & Humber
4 1.9 6 123.1 3 43.9 36 27.6
Grand Total
40 15.8 67 579.9 16 473 619.9 208.5
Source: MDS Transmodal GB Port Infrastructure Database
In some cases, the port’s commercial role might only extend to being effectively ‘landlords’; land is leased to third party private operators on commercial terms, who subsequently invest in berthing, loading/discharge and other handling infrastructure such as rail terminals or distribution centres. In other cases, the ports will invest in, own and physically operate the infrastructure, charging shipping lines fees to generate revenues and a financial return. In addition to the actual berths and direct loading/discharge equipment, ports also invest in other ‘added value’ infrastructure. This can include landside storage and handling infrastructure such as warehousing, silos and rail freight terminals. As an example, the rail terminals at the Port of Felixstowe were provided by the port, and London Gateway has an associated distribution centre development within the port estate.
Overall, and on a similar basis to distribution centres and SRFIs, ports are key fixed infrastructure assets that are delivered through long-term private sector investment. As with all commercial investments, the decision on whether to proceed will take into account the capital costs alongside future revenue streams, the likely payback time and overall financial return. Securing traffic on long-term contracts is therefore important as they will effectively

Understanding the UK Freight Transport System
63
help to secure funding for investment. With the exception of Peel Ports and Forth Ports, the other large private port groups are ultimately owned by overseas interests. However, given the longstanding Government policy of encouraging inward investment from overseas, overall this should not affect (and indeed could benefit) future investment in UK port infrastructure. Again, delivery is ultimately reliant on the planning system; land needs to be allocated through local plans and consents need to be granted.
5.6 Airports
As explained in section 3.5, UK airports handled some 2.4 million tonnes of high-value freight in 2016 and the market is dominated by London Heathrow with some 64% market share (Civil Aviation Authority Airport Statistics, 2017). The most important airports for handling freight – London Heathrow, East Midlands, London Stansted, London Gatwick and Manchester – are either privately owned or operated on a commercial basis.
Unlike ports, much of the infrastructure at airports is designed to meet passenger demand; however, specialist air cargo distribution centres are required by air freight forwarders for the sorting and consolidation of air freight into air container loads and these may be located in the vicinity of the airports rather than actually within the airport itself. Otherwise, airport infrastructure is developed on a commercial basis, with delivery reliant on the planning system when additional land is required.
5.7 Waterborne freight network
The UK has an indented coastline, with deep-water access to its major estuarial ports and wharves on the Forth, Tees, Tyne, Humber, Harwich Haven and Thames on the east coast, the Solent on the south coast and on the Severn estuary, Milford Haven, Mersey and Clyde on the west coast. Many of these seaports are privately owned since a round of privatisations in the 1980s and 1990s.
Short-sea and coastal shipping movements along these major estuaries are recorded as inland waterway movements for statistical purposes and there are also numerous (mainly privately owned) wharves on major rivers, such as the rivers Humber, Hull and Trent. Significant movements of freight on man-made canals are limited to traffic to and from wharves on the Manchester Ship Canal.
There are a large number of wharves on the Thames which need to be safeguarded through the planning system against, in particular, residential development so they are available in the future for the loading and unloading of cargo. The number of safeguarded wharves is shown in Figure 24.

Understanding the UK Freight Transport System
64
Figure 24: Safeguarded wharves on the River Thames (source: Port of London Authority)

Understanding the UK Freight Transport System
65
The Canal and River Trust has been responsible for the development of freight activity on most rivers and canals in England and Wales since 2012, while the British Waterways Board (operating as Scottish Canals) continues as a public body with the role of supporting the development of freight on canals and rivers in Scotland.
5.8 Pipeline network
The overall length of the pipeline network has remained largely unchanged since 2007 at about 4,400km, reflecting the relatively mature nature of this mode of transport.
5.9 Planned investment in freight transport infrastructure
Highways network
The first Road Investment Strategy (RIS1) provided a long-term programme of investment for the SRN in England, with a plan between 2015 and 2020. The headline figure for investment was £15.2 billion for over 100 projects during a six year period. While there has been investment in constructing some new roads, the main focus has been on upgrading the existing network. This includes the developing network of ‘smart motorways’, which secures more capacity at peak times by allowing use of the hard shoulder and variable speed limits to improve traffic flow.
The Government is now working with Highways England and other stakeholders to develop RIS2, with research being carried out on six strategic studies and updating route strategies for the whole network. The six strategic studies address the following sections of the SRN:
• Northern Trans-Pennine: the A66 and A69 corridors
• Trans-Pennine tunnel: the potential enhanced link between Manchester and Sheffield
• Manchester north-west quadrant: the M60 from junctions 8 to 18
• A1 in the east of England from the M25 to Peterborough
• The Oxford to Cambridge expressway
• M25 south-west quadrant
In 2015 the Government announced that tax receipts from vehicle excise duty will be hypothecated for investment in the highways network from 2020–21 rather than being available for other uses. As the highway network is funded from taxation, investment in highway infrastructure is decided on the costs of the scheme measured against the wider economic and societal benefits that will be generated by that scheme – unlike investments in port, distribution centre and SRFI infrastructure, which are based on commercial decisions. The DfT’s WebTAG (Transport Appraisal Guidance) provides a structured appraisal system that allows the benefits to cost ratio (BCR) of publicly funded schemes to be estimated. A positive BCR is normally required for a scheme to proceed, and where multiple schemes are ‘competing’ for limited funding, the schemes with the higher BCRs normally secure the funding. The appraisal of such schemes in relation to freight transport should take account of

Understanding the UK Freight Transport System
66
both changes in user costs (i.e. the change in operating costs, including the cost of time, for the freight transport industry) and non-user costs (such as changes in levels of congestion, the level of environmental emissions and the cost of accidents) and should be carried out in a consistent way across all relevant modes of transport.
Rail network
As a monopoly infrastructure provider, Network Rail is subject to economic regulation by the Office of Rail and Road (ORR). The ORR determines what Network Rail is permitted to spend on day-to-day operations, asset maintenance/renewals and enhancements, and operational performance indicators are also defined. The ORR’s process of determining Network Rail’s spending, funding and performance is known as a Periodic Review. The subsequent settlement lasts for five years and is known as a Control Period. The current Control Period, CP5, runs from April 2014 to March 2019.
To inform each Periodic Review, the Government is required by legislation to publish a High Level Output Specification (HLOS). This sets out at a strategic level what the Government wants the railway to achieve and deliver during the following Control Period. Alongside the HLOS, the Secretary of State is also required to publish a Statement of Funds Available (SoFA), which sets out the amount of direct funding Network Rail can expect to receive from Government.
The HLOS and SoFA which informed the CP5 Periodic Review were both published in July 2012; they set out a series of capacity and capability enhancements which were expected to cost around £13 billion, out of a total Network Rail spend for CP5 of £38 billion (the balance covering asset maintenance/renewals, day-to-day operations, overheads and interest charges). Enhancements commenced in CP5 included some electrification schemes, such as in the North West, on the Great Western Main Line (GWML) from West London to South Wales, and on the Midland Main Line (MML).
While these are essentially passenger schemes, freight benefits were also expected to be generated in the form of loading gauge enhancement and greater opportunities for using electric traction.
The HLOS and SoFA also made available a ‘ring fenced allocation’ of £253 million over CP5 to fund investments in the SFN identified by the rail freight industry (a stakeholder panel including Network Rail and the freight operators). These funds have predominantly been spent on a series of loading gauge enhancements between the main deep-sea container ports located in the South of England and the Midlands and North of England and some capacity enhancements specifically for freight. These include:
• East Coast Main Line gauge clearance – from London to Scotland;
• Doncaster to Water Orton (Birmingham) gauge clearance;
• Southampton – diversionary route gauge clearance;
• Ipswich Yard train lengthening; and
• Peak Forest to London train lengthening.

Understanding the UK Freight Transport System
67
Due to a variety of factors, the final capital costs for some upgrade schemes went significantly beyond that estimated when CP5 was determined by the ORR.
A review was carried out of Network Rail’s enhancements programme (and the costs) in 2015 (the Hendy Review). With respect to freight, the review noted that the loading gauge enhancement schemes to Felixstowe (via Ely, Peterborough and Leicester to Nuneaton), the south coast (Southampton) and the North of England/Scotland have been completed. However, the report also stated that while a number of important capacity upgrades planned for the network are still planned to go ahead, their funding and completion dates are pushed back into the following CP6 (2019–2024). This includes the capacity upgrades on the Felixstowe to Nuneaton route and on the Midland Main Line (MML). However, it does note that extra capacity on the Felixstowe branch line should be delivered by 2019, along with loading gauge enhancements on the GWML, to the Yorkshire intermodal terminals and Immingham port.
The HLOS which is informing the CP6 (April 2019 to March 2024) Periodic Review was published in July 2017 and the SoFA informing the CP6 Periodic Review was subsequently published in October 2017. Unlike the 2012 HLOS, the current document is only concerned with operations, maintenance and renewals on the existing railway for CP6, in the context of rising passenger demand and the need to deliver greater levels of performance. It does not commit to enhancements, noting that these are expected to be dealt with separately. The SoFA subsequently confirmed this position in October 2017, stating that the level of expenditure is focused on and provides for the operations, maintenance and renewal of the existing railway over CP6. A maximum direct grant of just under £35 billion to Network Rail over CP6 is stated. This includes ‘some provision for the funding of enhancements’, assumed to be in part those aforementioned schemes which have been pushed back into CP6. However, the ‘Secretary of State expects decisions regarding specific enhancements to be dealt with separately’.
It is therefore likely that some SFN funding will be available for freight enhancements in CP6. However, as yet the value of this funding is not known and the ORR’s final determination is scheduled for October 2018. Exactly which options will be chosen is an open question.
In addition to installing grade separation at key flat junctions, the gradual introduction of the European Rail Train Management System (ERTMS) could help to generate additional capacity for the long term. ERTMS is a set of common standards and operating practices that is due to be adopted by modern signalling systems across the EU. This could allow trains to run closer together, when compared with existing fixed-block lineside signals, thereby increasing capacity, and could also help to reduce average end-to-end journey times.

Understanding the UK Freight Transport System
68
6 THE FUTURE OF FREIGHT 6.1 Introduction As explained in section 1 of this report, the main focus of this study is to review the current ‘landscape’ of the freight transport system in the UK rather than to provide detailed observations on the future of freight. GO-Science has commissioned a number of additional pieces of work which seek to provide more detailed insights into the future of freight transport up to 2040.
Having said that, the review of the existing landscape in sections 1–5 highlights some of the key challenges for the UK freight transport system in the future:
• How can the freight transport system become even more cost-effective and help to increase the productivity and competitiveness of the UK economy?
• How can the freight transport system reduce its negative externalities, particularly in terms of its impact on local air quality and on greenhouse emissions?
• How can the use of network infrastructure by freight be made more efficient given the levels of congestion on road and rail networks and on links to and from ports?
• How will the freight transport system need to adapt to the changing trading relationship with the EU?
• How can the land use planning system cater for the future needs of the freight transport system, allowing the development of infrastructure that supports the economic needs of the UK while also reducing negative externalities?
• How can the freight transport system best adapt to rapid changes in consumer demand, in digital and manufacturing practices and transport technology, while providing a reasonably stable investment environment for the private sector?
This section includes some observations on how some of these challenges could be met over the next 10 years (i.e. up to about 2028), with a focus on:
• The impact of regulation, particularly in relation to environmental emissions;
• The impact of alternative fuel technologies;
• The impact of e-commerce;
• The impact of local manufacturing;
• The impact of autonomy and automation;
• The impact of the sharing economy;
• The impact infrastructure pricing and land use planning.

Understanding the UK Freight Transport System
69
While a number of other issues could have been considered in this section, we believe the points listed above are some of the key areas that will have a particular impact on the UK freight transport system over the next 10 years.
6.2 The impact of regulation
The major focus of regulation is on reducing the emissions of environmental pollutants from HGVs at a local level, and this has been driven by EU emissions standards legislation. The HGV fleet is gradually becoming cleaner as road hauliers increasingly purchase new HGVs which have to conform to Euro 6 standards since the standard was introduced in January 2015. These vehicles meet stricter emissions standards under both laboratory and real-world conditions and remove almost all emissions of particulate matter and reduce nitrogen oxide emissions from HGVs by up to 95%.
However, with the increasing political attention being paid to the impact that poor air quality has on human health at a local level, there is likely to be a much greater focus on regulating access to urban areas by the most polluting freight vehicles. This is likely to be through the introduction of Clean Air Zones in a number of urban areas and will have the effect, at least in the next few years, of encouraging the development of RDCs and depots on the edge of major conurbations so they are within the range of electric vehicles using the existing battery technology.
Greater use of ultra-low emission vehicles for freight movements will also have the advantage of helping to reduce greenhouse gas emissions from road freight transport and therefore contribute to reducing the risks from global warming. This will only be the case, however, if the electricity that the UK generates is from low carbon sources. The trends in electricity generation are positive with generation from renewables reaching a new quarter 3 record high of 30.0% in 2017, while low carbon sources (i.e. renewables plus nuclear) reached a new record of 54.4% during the same period (Office of National Statistics, 2018).
Greater regulation of freight vehicles to improve air quality in local areas will be most likely to have an impact on urban logistics – for the so-called ‘last mile’ delivery of goods into urban areas, as well as the reverse logistics involved in removing waste material such as packaging. This is because most of the Clean Air Zones (CAZs) that will be designated by local authorities will be located in urban areas where there are concentrations of economic activity and traffic. The precise measures that will be introduced for CAZs will vary between urban areas, but they may include high access charges for – or even bans on the use of – more polluting HGVs and LGVs. This would incentivise the introduction of a range of other means to make collections and deliveries in urban areas more sustainable, such as:
• Use of electric vehicles (EVs) for deliveries and collections from urban distribution centres (UDCs), which are large-scale consolidation centres that receive goods and then consolidate them into full loads for last-mile deliveries by EVs. These UDCs would be located on the edge of large conurbations and should, ideally, be located on rail- or water-connected distribution parks so that inbound flows over medium to long distances can be achieved using more sustainable modes of transport;
• Development of smaller-scale road-only consolidation centres on the edge of smaller urban areas to allow the transfer of goods from larger freight vehicles into smaller electric vehicles for final delivery within CAZs.

Understanding the UK Freight Transport System
70
• Increased use of cycle logistics and walking for last-mile logistics of goods such as parcels in city centres that are also CAZs.
Given that rail freight services are mainly provided by diesel-powered locomotives, looking forward the industry faces the issue of how to decrease emissions cost effectively. Current DfT ambition is to phase out diesel only traction by 2040 (DfT, 2018b). There are various possible routes for the railway industry to achieve this ranging from electric locomotives and extensive network electrification, and/or battery power for ‘last mile’ operations on non-electrified lines and terminals, to alternative fuels such as hydrogen.
Greater attention will also be paid to emissions from shipping. While the Sulphur Emissions Control Area (SECA), implemented by the International Maritime Organisation and the EU since 2015, has restricted the use of heavy fuel oil as a bunker fuel in much of North West Europe, ships are still permitted to use diesel to provide electricity while in port. It is likely that major ports, with concentrations of ships sitting alongside berths for lengthy periods, will be under increasing pressure to provide shore-based electrical power supplies for shipping over the next 10 years.
6.3 The impact of alternative fuel technologies
Given the ambition to limit the sale of new diesel and petrol cars and LGVs from 2040, it seems increasingly likely that there will gradually be a greater take-up of electric LGVs at a national level for relatively short-distance flows, but unless there is a step-change in battery technology, or advances in other alternative fuel solutions such as hydrogen fuel-cells, this is most likely to be for deliveries from distribution centres located close to the major conurbations rather than to towns and cities in more peripheral locations. This potentially also implies a greater demand for distribution buildings on the edge of major conurbations (particularly London), from where electric vehicles can then undertake deliveries to homes, offices and retail outlets. This has implications for planning policy, given the additional pressures this places on land located in the metropolitan greenbelt.
Existing battery technology tends to encourage the use of electric ‘white vans’, which lack the economies of scale provided by an HGV; however, manufacturers are focused on developing the battery technology and there is already, for example, a Mercedes electric HGV on the market (Electrek, 2018) and Tesla has launched its Semi HGV (Tesla, 2017), which is being marketed as having a range of 500 km.
Furthermore, existing battery technology is significantly heavier when compared with a tank of diesel fuel. This eats into the gross laden weight, thereby reducing a vehicle’s payload capacity. In order to encourage greater use of electric HGVs, the gross weight regulations may need to be amended to allow for heavier electric HGVs that are able to carry the same payload capacity when compared with a diesel vehicle. For longer-distance flows between urban areas, other technological solutions may be required to allow the greater electrification of road haulage. These could include the development of trolley-bus infrastructure for freight, and Siemens has carried out a trial of this technology in Germany along a short section of the highways network (Siemens, 2015). Another potential solution is the ‘electric road’ concept where electric vehicles receive electric current from the highway using wireless induction charging technology (Autocar, 2017).

Understanding the UK Freight Transport System
71
6.4 The impact of e-commerce
One of the key trends affecting the freight and logistics market is the increase in e-commerce sales at the expense of ‘bricks and mortar’ retail activity and the desire for next-day or even same-day delivery. This trend is set to continue over the next 10 years and is likely to have three broad impacts:
• The substitution of journeys in cars or by public transport to and from retail outlets with ‘white vans’ carrying out deliveries where people live or work;
• Changes in distribution activity and distribution patterns as the unit of freight becomes a parcel rather than (say) a pallet. The parcels operators have their final sorting offices/depots located close to individual major population centres and this implies greater use of double-deck HGVs (providing greater volumetric capacity) for trunking from NDCs located in the Midlands;
• Distribution centres increasingly become ‘fulfilment’ centres, re-distributing goods at the individual consignment level. As many older distribution centre buildings are unable to accommodate the automated picking/packaging equipment associated with this process, this implies a continuing need to build large modern distribution centre units, designed around automated handling and at commercially attractive locations, which in many cases will replace the older life-expired capacity. If these are on rail- and/or water-connected distribution parks, then there is an opportunity to increase the use of more sustainable modes for medium to long-distance distances.
Information and communications technology (ICT) is already used extensively by the logistics industry to manage bookings and reservations of capacity, to manage operations (including managing fleets), for tracking and tracing of consignments, for financial management and for cost-effective routing. The further development of the use of ‘big data’, the digitisation of transport and trade documentation and data sharing between collaborators in supply chains is likely to help reduce costs and increase efficiency over the next 10 years.
6.5 The impact of local manufacturing
The combination of reducing trade barriers due to the process of globalisation and the availability of relatively cheap inter-continental freight transport by container ship allowed multinational companies to manufacture in relatively low cost locations such as China and Vietnam and then distribute the goods to consumer markets such as the UK. However, in a practice called ‘onshoring’ or ‘reshoring’, some businesses have started to transfer business operations that were moved overseas back to the country from which it was originally relocated. There is some evidence for this practice in the UK as manufacturing costs start to increase in China (Financial Times, 2013), but it is often anecdotal and may not have been sustained, particularly as container shipping is highly cost-effective for inter-continental transport. If it was to become a significant trend in the UK, perhaps incentivised by any increase in protectionism around the world, it could lead to shortening of supply chains and more focus on the import of raw materials rather than final products via ports and the co-location of final assembly of products at NDCs.

Understanding the UK Freight Transport System
72
3D printing is now readily available for the manufacture of a variety of goods, such as parts for manufacturing processes, at a local level and therefore allows the co-location of manufacturing and consumption. It seems unlikely, however, that 3D printing will replace factories to any great extent over the next 10 years due to the lack of manufacturing economies of scale and the fact that the existing 3D printers are designed to work with only a single raw material (e.g. plastic) rather than a combination (e.g. plastic and metal).
6.6 The impact of autonomy and automation
The main technological change in the road haulage industry up to 2030 at a national level may be the introduction of ‘platoons’ of HGVs that travel together on the strategic highways network and provide fuel efficiencies to road hauliers due to the reduction of drag. These would not be genuinely autonomous vehicles because they would still require a driver to be located in each cab for the departure and the final approach to the destination. Without significant technological improvements it seems likely that these platoons would be restricted to use on motorways and dual carriageways so that there are opportunities for overtaking and to ensure safety.
Many distribution centre functions have been automated over the past 15–20 years, a trend that is likely to continue; in part this is linked to the growth of e-commerce as automation is ideally suited to picking and packaging goods at the individual consignment level rather than full pallet loads. Further automation of warehousing is likely to have a significant impact on the levels of employment that will be available in DCs and sorting centres over the next 10 years. This will be driven by further e-commerce growth and, as technology develops, will enable distribution centre operators to reduce their operating costs. However, many older distribution centre buildings are unable to accommodate the automated picking/packaging equipment associated with fulfilment, implying a continuing need to build large modern distribution centre units (designed around automated handling) at commercially attractive locations.
6.7 The impact of the sharing economy
Sharing of capacity is already commonplace in freight transport and logistics as freight transport providers are constantly seeking to secure economies of scale and minimise their costs in a highly competitive market. For example, road haulage companies collaborate to provide pallet load networks (where they transport individual pallets for individual customers and then combine them with those of other customers to fill their vehicles) or shared warehousing facilities for their customers. Container shipping, ferry and intermodal rail freight services all need to secure a critical mass of cargo from different customers in order to be competitive.
There may, however, be some scope for ‘disruptive’ technology which will facilitate the sharing of the capacity provided by freight transport operators – which would therefore facilitate collaboration between shippers/receivers and freight transport providers. However, collaboration is often difficult to achieve in practice because the cost of road haulage is so much lower than the value of the goods being transported; this means that the priorities for shippers and receivers are related to receiving the goods quickly and on time rather than seeking to reduce costs by sharing capacity. However, ICT could help to automate the process of negotiating the balance of costs and benefits from collaboration which can be a major barrier to the take-up of this practice.

Understanding the UK Freight Transport System
73
6.8 The impact of infrastructure pricing
Capacity on the road network, particularly during the peak periods, is a scarce resource and, at the same time, road freight may not be paying for the full costs it imposes on society which include not only the impact on congestion but also the cost of environmental emissions and accidents.
The Chartered Institute of Logistics and Transport (CILT, 2015) and other organisations including the European Commission have advocated the introduction of a system of infrastructure charging for both freight and passengers. This could involve re-distributing the existing taxation levied on the different modes of transport and applying additional charges where these can be justified on the basis of net externalities – using a distance-based system which could take account of the time of day, the specific section of the network and the type of vehicle as well as the distance travelled. In the road sector, this would be facilitated by the use of fairly mature technology such as GPS and on-board units in the cabs of HGVs and LGVs.
This approach, which should be adopted on a consistent basis across all modes that use publicly owned infrastructure, would have the effect of ensuring that economic resources are allocated efficiently across the different modes while also taking into account the externalities that are generated by all modes of freight transport. It would also have the effect of providing revenue streams for Government that can be applied to the maintenance and enhancement of infrastructure for freight transport.
Such an approach to infrastructure charging would help to ensure that the private sector invests in key freight infrastructure, such as distribution parks and Strategic Rail Freight Interchanges, in competitive locations. However, this will only be possible if the land use planning system is able to bring forward large sites in competitive locations, and this may require a more strategic approach to the selection and promotion of nationally significant sites by Government.

Understanding the UK Freight Transport System
74
7. REFERENCES
AECOM. (2016). Future Potential for Modal Shift in the UK Rail Freight Market. Available at: https://www.arup.com/-/media/arup/files/publications/f/future_potential_for_modal_shift_in_the_uk_rail_freight_market.pdf
Autocar. (2017). The road the charges your electric car. Published on 20 July 2017. Available at: https://www.autocar.co.uk/car-news/new-cars/road-charges-your-electric-car
Braithwaite, A., LCP Consulting (2017). The Implications of Internet Shopping Growth on the Van Fleet and Traffic Activity. Available at: https://www.racfoundation.org/wp-content/uploads/2017/11/The_Implications_of_Internet_Shopping_Growth_on_the_Van_Fleet_and_Traffic_Activity_Braithwaite_May_17.pdf
CILT. (2015). UK Freight Planning to 2035. Available at: https://ciltuk.org.uk/Policy-and-Guidance/Vision-2035
Civil Aviation Authority. (2017). Civil Aviation Authority Airport Statistics. (2017). Available at: https://www.caa.co.uk/data-and-analysis/uk-aviation-market/airports/datasets/uk-airport-data/
Department for Transport. (2007). Delivering a Sustainable Railway. London. Available at: https://webarchive.nationalarchives.gov.uk/20100513020716/http:/www.dft.gov.uk/about/strategy/whitepapers/whitepapercm7176/whitepapersustainablerailway1
Department for Transport. (2011 and 2014). The Logistics Growth Review. London. Available at: https://www.gov.uk/government/publications/logistics-growth-review
Department for Transport. (2015). Road Investment Strategy for the 2015/16 – 2019/20. London. Available at: https://www.gov.uk/government/publications/road-investment-strategy-for-the-2015-to-2020-road-period
Department for Transport (2016). Discrepancies between Road Freight and Road Traffic HGV traffic estimates. Available at: https://assets.publishing.service.gov.uk/government/uploads/system/uploads/attachment_data/file/527810/hgv-traffic-estimates-report.pdf
Department for Transport. (2017). Port Freight Statistics. Available at: https://www.gov.uk/government/collections/maritime-and-shipping-statistics
Department for Transport. (2017). Transport Statistics Great Britain: 2017 Notes and Definitions: Freight. London. Available at: https://www.gov.uk/government/uploads/system/uploads/attachment_data/file/661907/freight-notes.pdf
Department for Transport. (2017c). Domestic Waterborne Freight Statistics. Available at: https://www.gov.uk/government/statistics/domestic-waterborne-freight-2017
Department for Transport. (2018a). Vehicle Licensing Statistics. London. Available at: https://www.gov.uk/government/statistics/vehicle-licensing-statistics-2017

Understanding the UK Freight Transport System
75
Department for Transport. (2018b). Let’s raise our ambitions for a cleaner, greener railway, speech given by Jo Johnson MP published 12 February 2018. Available at: https://www.gov.uk/government/speeches/lets-raise-our-ambitions-for-a-cleaner-greener-railway
Department for Transport. (2018c). Domestic Road Freight Statistics, United Kingdom 2017. London. Available at: https://www.gov.uk/government/statistics/road-freight-statistics-2017
Department for Transport. (2018, TRA0201). Table TRA0201, Road traffic (vehicle kilometres) by vehicle type in Great Britain, annual from 1949. Available at: https://assets.publishing.service.gov.uk/government/uploads/system/uploads/attachment_data/file/722087/tra0201.ods
Department for Transport. (2018, RFS0104). Table RFS0104, Goods lifted by commodity: annual 2004 - 2017. Available at: https://assets.publishing.service.gov.uk/government/uploads/system/uploads/attachment_data/file/728840/rfs0104.ods
Department for Transport. (2018, RAI0401). Table RAI0401, National Railways freight moved by commodity: annual from 1999/00. Available at: https://www.gov.uk/government/statistical-data-sets/rai04-rail-freight
Department for Transport. (2018, RAI0402). Table RAI0402, National Railways freight lifted by commodity: annual from 1999/00. Available at: https://assets.publishing.service.gov.uk/government/uploads/system/uploads/attachment_data/file/762194/rai0402.ods
Department for Transport. (2018, RFS0125). Table RFS0125, Percentage empty running and loading factor by type and weight of vehicle: annual 2000 – 2017. Available at: https://assets.publishing.service.gov.uk/government/uploads/system/uploads/attachment_data/file/728852/rfs0125.ods
Department for Transport. (2018, PORT0201). Table PORT0201, UK major port freight traffic, cargo types by year (direction filter) from 2000. Available at: https://assets.publishing.service.gov.uk/government/uploads/system/uploads/attachment_data/file/739796/port0201.ods
Electrek. (2018). Mercedes-Benz delivers first 10 eActros all-electric heavy-duty trucks. Published 17 September 2018. Available at: https://electrek.co/2018/09/17/mercedes-benz-eactros-all-electric-heavy-duty-trucks-deliveries/
European Commission. (2017). Oil pipeline transport within the national territory by type of transport operations and products (Mio Tkm). Available at: https://ec.europa.eu/eurostat/web/transport/data/database
Financial Times. (2013). One in six UK manufacturers reverse offshoring in growing trend. Published 24 November 2013.
Freight Transport Association. (2017). Logistics Report 2017. Tunbridge Wells.
Freightlink. (2016). DFDS Seaways Sees Profits Rise From Freight Traffic. Available at:
https://www.freightlink.co.uk/knowledge/articles/dfds-seaways-sees-profits-rise-freight-traffic
Understanding the UK Freight Transport System
76
Getlink. (2018). Traffic figures. Available at: https://www.getlinkgroup.com/uk/group/operations/traffic-figures/
Greater London Authority. (2016). Howbury Park, Salde Green in the London Borough of Bexley. Planning application no. 15/02673/OUTEA. Available at: https://www.london.gov.uk/sites/default/files/PAWS/media_id_286149/howbury_park_report.pdf
Hereford Pedicabs. (2016). Hereford Pedicabs & Cargo. Available at: http://www.herefordpedicabs.com/#intro
Homes and Communities Agency. (2015). Employment Density Guide, 3rd edition. Available at: https://assets.publishing.service.gov.uk/government/uploads/system/uploads/attachment_data/file/484133/employment_density_guide_3rd_edition.pdf
MDS Transmodal. (2017). Containership & Ferry Databanks. Chester.
MDS Transmodal. (2017). GB Port Infrastructure Database.
MDS Transmodal. (2017). Great Britain Freight Model.
MDS Transmodal. (2017). Warehouse Database.
Motor Transport Top 100. (2017). Big wheels keep on turning. Available at: https://motortransport.co.uk/wp-content/uploads/2017/11/MT-top-100-2017-271117-final.pdf
Network Rail. (2013). Long Term Planning Process: Freight Market Study. Available at:
https://cdn.networkrail.co.uk/wp-content/uploads/2016/11/Freight-Market-Study.pdf
Office of National Statistics. (2018). Energy Trends: Electricity.
Office of Rail & Road. (2017). Freight Rail Usage. Available at: http://orr.gov.uk/statistics
Office of Rail & Road. (2018a). Infrastructure on the railways – Table 2.52. Available at: http://dataportal.orr.gov.uk/displayreport/report/html/c35e0c28-324f-4168-81b9-be197963f251
Office of Rail & Road. (2018b). Passenger and Freight Rail Performance 2017-18 Q4 Statistical Release. Available at: http://orr.gov.uk/__data/assets/pdf_file/0003/27759/passenger-freight-performance-2017-18-q4.pdf
Office of Rail & Road. (2018c). Freight moved – Table 13.4. Available at: http://dataportal.orr.gov.uk/displayreport/report/html/a201ed45-23cf-4785-8d71-881f93592314
Office of Rail & Road. (2018d). Freight Rail Usage: 2017-18 Q4 Statistical Release. Available at: http://orr.gov.uk/__data/assets/pdf_file/0010/27919/freight-rail-usage-2017-18-quarter-4.pdf
Siemens. (2015). eHighway – Solutions for electrified road freight transport. Available at: https://www.siemens.com/press/en/feature/2015/mobility/2015-06-ehighway.php#event-toc-3
Tesla. (2017). Tesla Semi. Available at: https://www.tesla.com/en_GB/semi

Understanding the UK Freight Transport System
77
Zedify. (2018). Our Trikes: Urban Delivery Heroes. Available at: https://www.zedify.co.uk/our-trikes

© Crown copyright 2019
This publication is licensed under the terms of the Open Government Licence v3.0 except where otherwise stated. To view this licence, visit nationalarchives.gov.uk/doc/open-government-licence/version/3
Where we have identified any third party copyright information you will need to obtain permission from the copyright holders concerned.
This publication is available from www.gov.uk/go-science
Contacts us if you have any enquiries about this publication, including requests for alternative formats, at:
Government Office for Science 10 Victoria Street London SW1H 0NN Tel: 020 7215 5000 Email: [email protected]