the indian hotels - smifs.com the company has built a vibrant porolio catering to ... ministry of...
TRANSCRIPT

&
The Indian Hotels C o m p a n y L i m i t e d
Initiating Coverage Report
20 March 2018
Research Analyst:
Sarthak Mukherjee
Over 100 years in owning, operating & managing hotels

&
The Indian Hotels Company Ltd
Contents
3
3-6
7-9
10-15
16
17
18-19
20
20
21
22
Page No.
IHCL at an Inflec�on Point
Investment Ra�onale
Indian Hospitality Industry
Company Overview
Financing Strategy to Support Growth
Strength backed by Customer Needs
Asset Management & Focus Areas
Aspira�on 2022
23
Upcoming Development
Recent Awards
Leadership
Outlook & Valua�on
25-27
28-29
Financial Details
Disclaimer & Disclosure
Key Risks 24
&
CMP ( As on 19th March, 2018) INR129.45
INR169.00 Target Price
Upside(%) 30%
Recommenda�on Strong BUY
BSE Code
NSE Code
Reuters Ticker
Bloomberg Ticker
500850
INDHOTEL
IHTL.NS
IH IN
IHCL at an Inflec�on Point for Transforma�onal Growth
Shareholding Pa�ern (%)
Promoters
Ins�tu�ons
Non-ins�tu�ons
Dec-17
39.09
40.27
20.64
Sep-17
38.65
40.79
20.56
Jun-17
38.65
40.85
20.50
Stock Scan
Market cap (INR Cr.) 15,478.20
Outstanding Shares (Cr.) 118.93
Face Value (INR) 1.00
Dividend Yield(%) 0.25
P/E(x) 139.52
P/B(x) 3.95
Debt/Equity (c) 1.34
Avg. Daily Vola�lity (%) 2.07
52 Week High/ Low (INR) 160.95/101.54
3
Stewart & Macker�ch Research ini�ates coverage on The Indian Hotels Company Ltd (IHCL) with a Strong BUY ra�ng. The Indian Hotels Company Ltd is one of the Asia's largest hotel chain groups. Over the years, with the changing dynamics of the industry, the company has geared itself to broad-base its business model in order to take advantage of the growth prospects within various class of travel and tourism industry. It operates under the brand of ‘Taj’ & ‘Vivanta’ - catering to the luxury segment and ‘Ginger’ (budget category).
The Indian Hotels Company Limited and its subsidiaries, bring together a group of brands and businesses that offer an unrivalled fusion of warm Indian hospitality and world-class service. IHCL operates 144 hotels globally across 4 con�nents, 11 countries and 72 loca�ons. Incorporated by the founder of the Tata Group, JamshedJi Tata, the Company opened its first hotel - The ‘Taj Mahal Palace’, in Bombay in 1903.
Valua�on: Several macro and micro factors compel us to believe a good visibility of growth in the hospitality sector. On this backdrop, Indian Hotels is likely to reward investors. We value The Indian Hotels Company Ltd on the basis of Sum of the Parts (SOTP) - using DCF for the Parent and Rela�ve Valua�on for the subsidiaries to arrive at a Target Price of INR169.
Sector : Hospitality
Investment Ra�onale
Undisputed Leadership: Over the past couple of years, a couple of interna�onal hotel brands have entered the Indian hospitality industry, yet Indian Hotels s�ll remains the undisputed leader in terms of room inventory and geographical presence. Over the years, the company has built a vibrant por�olio catering to different hotel categories including premium hotels, mid-market hotels and budget hotels. Ra�onale Contd...
Source: NSE
Stock Vs Ni�y (Rela�ve returns)
The Indian Hotels Company Ltd
20
60
100
140
180
14-Mar-17 14-Jun-17 14-Sep-17 14-Dec-17IHCL Ni�y 50
Avg. Daily Volume (NSE) 1Yr. 853440
Source: Company Data, SMIFS Research
Financial Performance at a glance (Standalone)Par�culars (INR Cr.) FY2016A FY2017A FY2018E FY2019E FY2020E
Net Sales 2268 2391 2642 2933 3285
EBITDA 529 574 654 774 897
EBITDA Margin (%) 23.3% 24.0% 24.8% 26.4% 27.3%
Net Profit 84 142 199 284 366
Net Profit Margin (%) 3.7% 5.9% 7.5% 9.7% 11.1%
EPS (INR) 0.85 1.43 1.68 2.39 3.08
BVPS 24.01 26.44 35.86 37.83 40.49
P / E (x) 152.18 90.22 77.23 54.20 42.10
P / BV (x) 5.39 4.90 3.61 3.42 3.20
ROE (%) 3.54 5.43 4.67 6.31 7.60
ROCE (%) 8.81 9.18 8.96 9.56 11.03
EV / EBITDA (x) 27.16 24.87 24.80 21.17 18.08
&
4
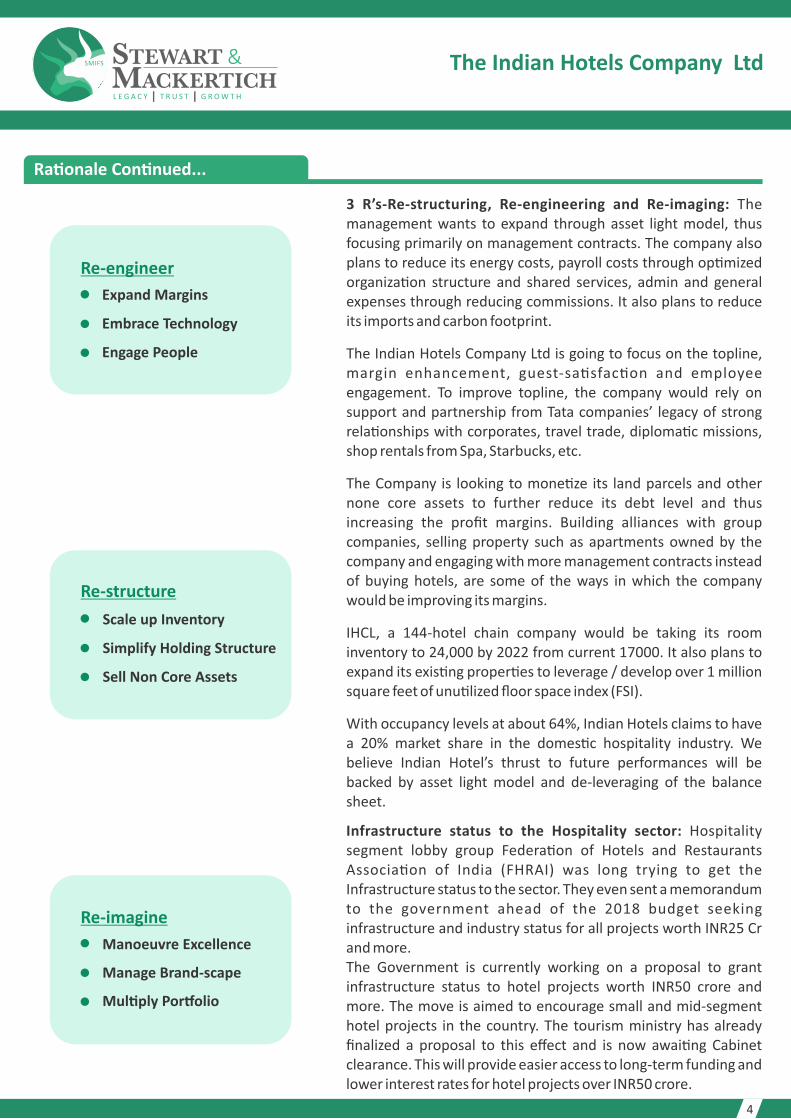
3 R’s-Re-structuring, Re-engineering and Re-imaging: The management wants to expand through asset light model, thus focusing primarily on management contracts. The company also plans to reduce its energy costs, payroll costs through op�mized organiza�on structure and shared services, admin and general expenses through reducing commissions. It also plans to reduce its imports and carbon footprint.
The Indian Hotels Company Ltd is going to focus on the topline, margin enhancement, guest-sa�sfac�on and employee engagement. To improve topline, the company would rely on support and partnership from Tata companies’ legacy of strong rela�onships with corporates, travel trade, diploma�c missions, shop rentals from Spa, Starbucks, etc.
The Company is looking to mone�ze its land parcels and other none core assets to further reduce its debt level and thus increasing the profit margins. Building alliances with group companies, selling property such as apartments owned by the company and engaging with more management contracts instead of buying hotels, are some of the ways in which the company would be improving its margins.
IHCL, a 144-hotel chain company would be taking its room inventory to 24,000 by 2022 from current 17000. It also plans to expand its exis�ng proper�es to leverage / develop over 1 million square feet of unu�lized floor space index (FSI).
With occupancy levels at about 64%, Indian Hotels claims to have a 20% market share in the domes�c hospitality industry. We believe Indian Hotel’s thrust to future performances will be backed by asset light model and de-leveraging of the balance sheet.
Infrastructure status to the Hospitality sector: Hospitality segment lobby group Federa�on of Hotels and Restaurants Associa�on of India (FHRAI) was long trying to get the Infrastructure status to the sector. They even sent a memorandum to the government ahead of the 2018 budget seeking infrastructure and industry status for all projects worth INR25 Cr and more. The Government is currently working on a proposal to grant infrastructure status to hotel projects worth INR50 crore and more. The move is aimed to encourage small and mid-segment hotel projects in the country. The tourism ministry has already finalized a proposal to this effect and is now awai�ng Cabinet clearance. This will provide easier access to long-term funding and lower interest rates for hotel projects over INR50 crore.
Expand Margins
Embrace Technology
Engage People
Re-engineer
Re-structure
Scale up Inventory
Simplify Holding Structure
Sell Non Core Assets
Manoeuvre Excellence
Manage Brand-scape
Mul�ply Por�olio
Re-imagine
Ra�onale Con�nued...
The Indian Hotels Company Ltd

&
5
Beginning of an up-cycle: The five-year period marked by oversupply in the Indian hospitality sector is coming to an end and the market is witnessing an up-cycle with expecta�ons of a robust revival in demand. The revenue per available rooms is expected to witness impressive improvements over the next two years on the back of the rising demand.
Presence in premium and mid-market a boon: Historically, an increase in demand is followed by increase in supply by the industry players but se�ng up premium and mid category hotels require considerable �me (funding, permissions, land acquisi�on etc.). The Company has dominant presence in premium and mid-market hotel categories (where se�ng up supply takes �me). This will be a boon for the company.
Significant tariff growth a�er 9 years: In 2018 a�er a gap of nine years, branded hotels are seeing a double digit growth in tariffs. Hotels have been able to nego�ate and take the tariff growth significantly up in the contracts with corporate clients through which half of the revenue is generated for most of the branded hotels. According to Hospitality consul�ng firm ‘Hotelivate’ expects tariffs to go up by double digits across most markets this year. Being a leader in the Indian hospitality space, IHCL is likely to make the most out of this development. It needs to be looked at how the management reaps benefit out of this as the fes�val and tourist season is far away.
Avia�on Industry’s PLF at a life�me high: There is a posi�ve correla�on between the airline passenger growth and hotel occupancy. Indian avia�on sector is in an up cycle and opera�ng at life�me high PLFs (passenger load factor). The occupancy levels are rising on a year on year basis. The Indian avia�on sector is in an up cycle, the sector is opera�ng at life�me high passenger load factors coupled with a passenger growth rate which is increasing at the rate of over 17-18% over the past 18 months. This bodes well for the hospitality sector.
Introducing Tech pla�orms and 24-hour command centre: The Indian Hotels Company (IHCL) has moved into the digital game in hospitality and a concerted effort over the past year has led to a 27% boost in its online revenue, 30% increase in room bookings, as well as addi�onal dining reserva�ons of around 25,000 tables over the past few months. Localized content like French, German, UK English, Spanish, simplified Chinese, etc. to drive direct booking from source markets. With the rise in usage of data and increase in no. of people going online, this strategic move is likely to yield posi�ve results for the company.
Preferred Choice for Heads of States,
Celebri�es and Dignitaries
68.9
63.7
72
77.3 75.1 74.673.3
7982.8
84.3
50
60
70
80
90
2008 2009 2010 2011 2012 2013 2014 2015 2016 2017
Pax Load Factor
Passenger (Pax) Load Factor
The Indian Hotels Company Ltd
In the year 2017, a total of 16.97 lakh foreign
tourists arrived on e-Tourist Visa as compared
to 10.80 lakh in 2016, registering a growth
of 57.2%
Foreign Exchange Earnings(FEE) during 2017
were US$ 27.693 billion with a growth of 20.8%
over 2016. Whereas, the FEEs during 2016 were US$
22.923 billion with a growth of 8.8% over 2015

&
6
IHCL looks to enter into branded homes business: Following the likes of Four Seasons, Ritz Carlton and Grand Hya� who lend their brands and provide hospitality services to luxury residen�al apartments, IHCL is also evalua�ng strategies to foray into the residen�al space. It would be a strategic move to expand its brand and improve on the cash flows. Besides, developing branded residen�al projects over land parcels it owns could also help unlock the value of the land assets at different strategic loca�ons.As per the management, the company has a land bank of 759 acres, out of which IHCL is planning to mone�ze around 6%, i.e. 44 acres.
Demand-Supply Mismatch: Robust growth in the sector is awai�ng since there is a demand - supply mismatch in terms of required room inventory. According to Ministry of Tourism, India is short of around 2 lakh tourist hotel rooms and India is projected to be the fastest growing na�on in the wellness tourism sector. Tourist arrivals have been seeing a robust growth due to introduc�on of e-visas.
The drive to promote India as a tourist des�na�on and increase in global growth has also lead to larger travel to India by global tourists.
Turnaround inevitable: Stock valua�on lies in the ability of a company to generate posi�ve free cash flows on a consistent basis. The company has lagged on this parameter, besides some other factors, which has led the company to underperform the benchmarks and some peers for several years. Nevertheless, the �de is expected to turn favorable for the company led by sector trends which are turning posi�ve across several parameters and the company’s ini�a�ves in recent years which is likely help generate posi�ve free cash flows on a sustainable and incremental basis, an a�rac�on for long term investors.
The consolidated Net Debt is at INR1967 cr at the end of 9 months FY18 from INR3151 cr at the beginning of FY18. Similarly Net Debt to Equity is down at 0.47 compared to 1.25 at the beginning of FY18 according to latest filings by the company and is projected to come down further in FY19. The company’s recently closed rights issue has been used partly to bring down debts.
Strong Sales Offices Network and Healthy Geo Sources backed by strong
Leadership
The Indian Hotels Company Ltd
Net Debt (INR-Cr)
4216
3151
1967
2016 2017 2018(YTD)
Net Debt
Supply Growth +3.2%
Demand Growth +5.6%
Demand > Supply

&
7
The Indian hospitality industry has been instrumental in contribu�ng to the na�on’s economic growth. This trend is expected to con�nue especially with the introduc�on of e-visa for foreign tourists and with the domes�c economy improving, there are clear signs of increased domes�c travel. Tourism in India has significant poten�al considering the rich cultural and historical heritage, variety in ecology, terrains and places of natural beauty spread across the country. The growth rate in room demand (5.7%) has been consistently outpacing the supply (3%) growth in India in H1 (2017-18) as compared to the same period last year. All key markets have shown good growth in room demand with no key markets lagging as compared to last year.
Indian Hospitality Industry
The Indian tourism and hospitality sector is a key driver to the service sector in India. It is also a large employment generator besides being the third largest foreign exchange earner. India's Foreign Exchange Earnings (FEE) during 2017 were US$ 27.693 billion with a growth of 20.8% over 2016. Whereas, the FEEs during 2016 were US$ 22.923 billion with a growth of 8.8% over 2015.
Domes�c Tourist Visits (DTVs) to the States/Union Territories went up by 15.5% y-o-y to 1.65 billion during 2016 with the top 10 States/UTs contribu�ng about 84.2% to the total number of DTVs, as per Ministry of Tourism. This trend is expected to con�nue with increasing disposable income. Similarly with increasing number of working women, double income households are on the rise.
Foreign Tourist Arrival (FTAs) in the year 2017 were 101.77 lakh with a growth of 15.6% over 2016, compared to FTAs of 88.04 lakh with a growth of 9.7% is 2016 over 2015 as per Ministry of Tourism. As per the ministry of Tourism, Foreign tourist arrivals in India have shown growth in each quarter for past 6 years.
One in every Eleven people worldwide is
employed by Tourism & Hospitality sector
Contribu�on to GDP(%)
9
9.5
10
10.5
2005 2006 2007 2008 2009 2010 2011 2012 2013 2014 2015 2016
Contribu�on to GDP
Domes�c Air Passenger Traffic has doubled over the past five years
20%
23%
17%
-5%
0%
5%
10%
15%
20%
25%
2015 2016 2017
Growth
-2%
4.4%
9.8%
0
200
400
600
800
1000
1200
1400
2012 2013 2014
Passengers (lakhs)
25%
16% 15% 15%17%
20%
12%
16% 17%21%
17%18% 19%
0%
5%
10%
15%
20%
25%
30%
0
40
80
120
160
Passenger (lakhs) Growth
Domes�c Air passenger growth 2017 (YoY)
FTA (Jan'17-Jan'18)
0%
5%
10%
15%
20%
25%
0
2
4
6
8
10
12
14
FTA (lakhs) YoY growth (%)
Source : Company data, SMIFS Research, DGCA, Ministry of Tourism
The Indian Hotels Company Ltd

&
8
India is expected to move into the top five business travel market by 2030, as business travel spending in the country will see a robust growth in the near future. Hotel chains will likely increase their expansion and investment plans in India. The tourism and hospitality sector is among the top 10 sectors in India to a�ract the highest Foreign Direct Investment.
India is a large market for travel and tourism. It offers a diverse por�olio of niche tourism products - cruises, adventure, medical, wellness, sports, MICE, eco-tourism, film, rural and religious tourism. India has been recognized as a des�na�on for spiritual tourism for domes�c and interna�onal tourists. Total contribu�on of travel and tourism sector to India’s GDP is expected to increase to US$ 275.2 billion in 2025. India ranked third among 184 countries in terms of travel & tourism’s total contribu�on to GDP in 2016. The Government of India has planned to take the FTA figure to 20 million by 2020 and double the foreign exchange earnings as well.
The launch of several marke�ng ini�a�ves by the Government of India like “A�thi Devo Bhava” and “Incredible India” has paced up the growth of the sector. Incredible India 2.0 campaign was launched in September 2017. The Indian government has also released medical visa to encourage medical tourism in the country. India has been making serious efforts to boost investments in the sector. The hotel and tourism sector, 100 per cent FDI is allowed through the automa�c route. A five-year tax holiday has been offered for 2, 3 and 4 star category hotels located around UNESCO World Heritage sites (except Delhi and Mumbai).
India has moved up 13 posi�ons from 65 to 52 in the Tourism & Travel Compe��ve Index according to reports. The ease of doing business in India according to World Bank has moved from 130 in 2017 to 100 in 2018 Levels, the recent upgrade of India’s Sovereign ra�ng by Moody’s is likely to a�ract more business travel to the country, benefi�ng Indian Hotels. Foreign tourist arrivals in the 1st half of FY2018 increased by 16% compared to the FY2017.
Branded room supply in major ci�es of India like Mumbai, Delhi and Bangalore is much lesser than in other Asian ci�es like Hong Kong, Shanghai and Tokyo. We believe the huge gap is likely to be filled going forward, raising occupancy and room rates of leading branded hotels, including Indian Hotels Ltd.
India is projected to be the fastest growing na�on in the well-ness tourism sector in the next five years, clocking over 20% gains annually through 2017, according to some studies.
0
2
4
6
8
10
12
14
Jan Feb Mar Apr May Jun July Aug Sep Oct Nov Dec
2015 (in lakhs) 2016 (in lakhs) 2017 (in lakhs)
Foreign Tourist Arrival
Foreign Exchange Earnings (INR Cr.)
0%
5%
10%
15%
20%
25%
30%
0
5,000
10,000
15,000
20,000
25,000
FEE (INR Crores) YoY growth (%)
Source : Company data, SMIFS Research, DGCA, Ministry of Tourism
The Indian Hotels Company Ltd
FTAs in the year 2017 were 101.77 lakh with a growth of 15.6% over 2016,
compared to FTAs of 88.04 lakh with a growth of 9.7% is 2016
over 2015

According to latest presenta�on by the Indian Hotels, the Indian hospitality industry is experiencing increase in occupancies leading to upward pressure on RevPARs (revenue per available room). The growth in demand is outpacing supply for the past three years.
The occupancy levels across the hotels in the country has stabilized between 65% to 68%. The sector is expec�ng a revival in the room rates that have largely been subdued for past few years. As per the industry experts, occupancy levels are expected to shoot up to 70% in the near future.
Branded hotels in the sector are seeing a double digit growth in tariffs in 4QFY18. Hotels have been able to nego�ate a significant tariff increase in the contracts with corporate clients through which, half of the revenue is generated for most of the branded hotels. This will benefit the industry immensely if the global and domes�c economy performs well.
&
9
Hotels in India
Occupancy 64% (+2.3%)
Avg. Room Rate ₹5,520 (+1.7%)
RevPAR ₹3, 516 (+4.1%)
Growing Markets
Ahmedabad, Jaipur,Chandigarh, Pune,
Hyderabad, Bengaluru, Mumbai, New Delhi,
Chennai, Goa, Kolkata
The Indian Hotels Company Ltd

&
10
Company Overview
Crea�ng value by opera�ng Best-in-class por�olio of hospitality brands in India & select overseas des�na�ons
Owned Hotels Managed Hotels Leased / Licensed Hotels
By Business Por�olio
Subsidiary Companies
Associate Companies
By Legal En�ty
Joint Ventures
IHCL
0
5000
10000
15000
20000
Room Inventory
Room Inventory
62 6676 82 88
99 103 107 112 118 125 131 138 137 139 144
40
60
80
100
120
140
160
No. of Hotels
Number of Hotels
Owned Leased Owned Leased Owned Leased
No. of Hotels 60 23 9 7 31 7
Inventory of Rooms 8,165 2,545 1,474 1,160 3,043 461
Revenue(INR / Cr) 3,637 828 1,535 541 156 16
EBITDA (INR/ CR) 784 215 106 85 17 6
Domes�c Interna�onal Ginger
Indian Hotels Company Ltd
Par�culars
* Figures are in line by line addition of all the properties under IHCL, Subsidiaries and JVs. Inventory as on September 30,2017
Source : Company data
The Indian Hotels Company Ltd

&
11
Major Subsidiaries, JV & Associates
The Indian Hotels Company Ltd
The Indian Hotels Company Ltd
Joint Ventures
Taj SATS Air Catering Ltd (51.0%)
Taj GVK Hotels & Resorts Ltd (25.52%)
Taj Madras Flight Kitchen Pvt Ltd (50.0%)
Taj Kerala Hotels & Resorts Ltd (28.30%)
Taj Karnataka Hotels & Resorts Ltd (44.27%)
Taj Safaris Ltd (28.96%)
Kaveri Retreat & Resorts Ltd (50%)
IHMS (SA) Pty Ltd (50%)
TAL Hotels & Resorts Ltd (27.49%)
Subsidiaries
Piem Hotels Ltd (51.57%)
TIFCO Holdings Ltd (100%)
Benares Hotels Ltd (51.68%)
United Hotels Ltd (55.0%)
Roots Corpora�on Ltd (63.25%)
Skydeck Proper�es Pvt Ltd (100%)
IHOCO BV (100%)
United Overseas Holdings, Inc (100%)
St James Court Hotel Ltd (72.25%)
Associates
Oriental Hotels Ltd (35.67%)
Lanka Island Resorts Ltd (24.66% ) TAL Lanka Hotel PLC (24.62%)
Source : Company data

&
12
IHCL - A $ 1.2 Billion Revenue Group
The Indian Hotels Company Ltd is one of the Asia's largest hotel chain groups. Over the years, with the changing dynamics of the industry, the company has geared itself to broad-base its business model in order to take advantage of the growth prospects within various class of the travel and tourism industry. It operates under the brand of Taj & Vivanta - catering to the luxury segment, Vivanta-catering to the upscale segment and Ginger-catering to the budget category.
TAJ: Spanning world-renowned landmarks, modern business hotels, idyllic beach resorts, authen�c palaces and rus�c safari lodges, each Taj hotel reinterprets the tradi�on of hospitality in a refreshingly modern way to create unique experiences and lifelong memories.
VIVANTA: Work hard and play hard. Relax and energize. Ideate and confer. Evolve and transform. Revel in a spirit that presents the normal with an unexpected twist. Stylish and sophis�cated, Vivanta by Taj delivers experiences with imagina�on, energy and efficiency.
THE GATEWAY: The Gateway Hotels and Resorts are designed for the modern traveler. Which is why they have a 24X7 a�tude across services like dining and fitness. So, when one feels like a quick bite at 1 A.M or a heart pumping jog at 4 A.M, they are ready to serve you.
GINGER: IHCL’s revolu�onary concept in hospitality for the budget segment in India is also its largest. Ginger Hotels are designed and operated with the ethos of providing reliable, safe and clean rooms that provide guests with a res�ul sleep experience coupled with a refreshing and reviving start to each day.
The Indian Hotels Company Limited (IHCL) and its subsidiaries, bring together a group of brands and businesses that offer an unrivalled fusion of warm Indian hospitality and world-class service. IHCL operates 144 hotels globally across 4 con�nents, 11 countries and 72 loca�ons.
Revenue Breakup
46%
38%
1%4%
7%4%
Room Income Food, Restaurant & Banquet
Shop rentals Membership fees
Management and opera�ng fees Other Opera�ng Income
Food and beverages consumed Employee benefit expenses
Power & Fuel Cost Other Opera�ng & Servicing Cost
Selling and Administra�on Expenses Miscellaneous Expenses
12%
10%
34%19%
25%
1%
Cost Break Up
2374 24452722
30213383
2016 2017 2018E 2019E 2020E
TOTAL REVENUE
Revenue from Opera�ons (INR Cr.)(Standalone)
Source : Company data, SMIFS Research
The Indian Hotels Company Ltd

&
13
The Indian Hotels Company Limited-A Brand
Taj Innercircle Re-launch: A loyalty programme applicable across all brands globally with addi�onal features and enhancements. It is characterized with easy redemp�on process with facili�es such as accommoda�on, restaurants, spas and no expiry of points for ac�ve members.
Enrolment
120%
Ac�ve Members
50%
Revenue from Loyalty Program
100%
Source : Company data
The Indian Hotels Company Ltd

&
14
Taj-ness - Guest Experience
Taj Culture and Tajness to be the bedrock of all experiences
Efficiency and consistency in delivering Product and Service Standards
Recogni�on and Personaliza�on
Pioneering Food and Beverage Experience
New Products and Cuisines
Leveraging Iconic restaurants and celebrity chefs Collabora�ons with Renowned Chefs
Authen�c Regional Cuisine crea�ng a sense of place
Taj Signature offerings
Bespoke Weddings’ Experience
Preferred Choice for Conferences and Events
Source : Company data
The Indian Hotels Company Ltd

9000 12000 15000 17000
35000
72000
121000
159000
2008 2012 2017 2021
Taj Others
&
15
Inventory Trend
IHCL—Por�olio
Room Supply Growth in the
Industry w.r.t various segments
7000 1700033000 46000
1500030000
53000
70000
22000
36000
49000
59000
2008 2012 2017 2021
Luxury Upperscale Upscale - Upper midscale Midscale - Economy
Increasing trend of Inventory to
con�nue with increased focus on management
contracts
Holding Company Group Company
Management Contract
25%
50%
25%
Inventory by Contract Inventory by Brand
38%
26%
14%
22%
Taj/Luxury Vivanta
Gateway Ginger
Source : Company data
The Indian Hotels Company Ltd

&
16
Financing Strategy to Support Growth while Improving Balance Sheet
Reduc�on in debt has been primarily on account of repayment of borrowings from the proceeds of Rights Issue by the management.
IHCL has allo�ed approx, 20 crore shares i.e., 1999.84lakh shares in October 2017.
Aggregate Rights Issue Proceeds of INR1,499.88 crore was raised.
Promoters Shareholding has increased from 38.65% to 39.09%, post conclusion of the Rights Issue.
Out of the Total Proceeds, INR1,273 crore was proposed to be used for repayment.
The cost of debt has reduced as some of the loans have been re-financed by raising debt at a lower cost.
Credit ra�ng on the borrowings : “AA+” by CARE & “AA” by ICRA.
Net Debt (INR-Cr)
4216
3151
1967
2016 2017 2018(YTD)
Net Debt
6.47
4.74
2.97
1.27 0.970.47
2016 2017 2018(YTD)
Net Debt:EBITDA Net Debt : Equity
Debt Ra�os
Brand Ginger-the budget segment where cash requirement is high, requires support from IHCL and from poten�al partners.
Piem, Oriental Hotels & other associates to operate on a self reliant manner.
Special acquisi�ons needs to be looked into separately and strategically.
IHCL standalone cash flows to be used for renova�on.
Standalone Balance Sheet is likely to sweat to fund expansion within IHCL and partly for Ginger.
Growth envisaged via combina�on of Equity Raising, Divestment, Partnerships and SPV/REITs.
Cash Flow from Opera�ons (INR Cr.)
469.35 457.15 429.40 528.86
706.39
FY2016A FY2017A FY2018E FY2019E FY2020E
Total Opera�ng Cashflow
Source : Company data, SMIFS Research
The Indian Hotels Company Ltd

&
17
Strength Backed by Customer Needs
Business segment
Loca�on
Efficiency Safety Hygiene
Personaliza�on
� Strong network across different price points
Ability to leverage Palace & Leisure por�olio
Leisure segment
Overall well being
Relax Fun & Family �me
� Key loca�ons & pioneering new des�na�ons
both local and global markets
Largest domes�c leisure operator
Jiva Spa
Palaces
Authen�city
Experience of a life �me
� Restora�ve ethics & ability to run living
palaces, heritage proper�es, curated
experience and connectedness with
owners
Source : Company data
The Indian Hotels Company Ltd

&
18
Asset Management & Focus Areas
Capital Alloca�on
� Maintain market leadership with quality products
Priori�ze investment in product renova�on for areas and ci�es with maximum returns
Contract Management
� Regular review and analysis of contracts to extend tenure of good performing hotels
Exit hotels with sustained losses and low poten�al
Build Synergies
� Op�mize overheads across mul�ple en��es
Capitalize on enterprise scale for achieving lower costs on products and services
Unlock Capital
� 3/4th of the current inventory is under freehold/ leasehold, evalua�ng & unlocking of capital through sale and lease back models or through special purpose vehicles
Source : Company data
The Indian Hotels Company Ltd

&
19
Domes�c Focus Interna�onal Focus
Taj
City Hotels: All key ci�es in the top 15 states by GDP
Resorts: Established des�na�ons with good access
Palaces: Authen�c Palaces with easy access
Safaris: Loca�ons near key na�onal wild life parks
Taj
Target the growing, high spending outbound tourists familiar with our brand
Currently MENA and South East Asia get the highest outbound traffic from India, making them a natural choice for our expansion overseas
Customer Crossover
Vivanta
City Hotels :Top 40ci�es (basis of popula�on, connec�vity, commercial importance) Resorts: Key resort des�na�ons as part of a circuit
Taj
The large Indian Diaspora in various markets such as Singapore,
Thailand, Malaysia, MENA region, South Asia, con�nue to be ambassadors for
the brand Taj
Ci�es with large Indian Diaspora
Ginger
City Hotels: Top 80 ci�es (basis popula�on, connec�vity, commercial
importance)
Taj
Certain markets like Myanmar, Africa etc. are poised to
grow and are a poten�al opportunity before they get saturated
Growth Markets
Source : Company data
The Indian Hotels Company Ltd

&
20
Aspira�on 2022
Aspira�on 2022: Indian Hotels Company has charted a strategy to improve its EBITDA margin to 25% by 2022. The company plans to mone�se its non-core assets. It aims to go in the direc�on of asset-light model and hold less ownership (60% of its assets will not be owned by the company by 2022), reducing its dependence on the luxury segment and moving the hotels por�olio of some of the group companies to the holding company.
Upcoming Development-Next 12 months
The Indian Hotels Company Ltd
Hotel
Udaipur - Management Contract :125 rooms
Rishikesh - Management Contract : 79 rooms
Shimla - Management Contract : 95 rooms
Tirupa� - Management Contract : 102 rooms
Taj Mansingh Bid
Source : Company data
Ginger
Patna– Roots Corpora�on : 70 rooms
Aurangabad - Roots Corpora�on: 64 rooms
Surat - Management Contract : 94 rooms
Taj Lands End & Sea Rock Hotel
IHCL to connect Taj Land’s
End and Sea Rock Hotel with a
Bridge reducing overhead costs and
increase revenue through F&B
Iconic Five Star Property
Strategic Loca�on
294 rooms
Iconic and
ProfitableHospitalityCompany
Re-structureScale, Simplify,
Sell
Re-engineerMargins, Technology,
People
Re-imagineService, Brandscape,
Por�olio
Culture Strong Brand Equity High Customer Engagement
Pan-India Footprint Market Leaders in Leisure & Palaces Segment
TRUST, AWARENESS, JOYINTEGRITY, EXCELLENCE, UNITY, RESPONSIBILITY, PIONEERING
VALU
ES
ENABLE
RS
INIT
IATI
VES
ASPIR
ATIO
N 2
022
Source : Company data

&
21
Recent Awards
Business Today Award for Best Companies to Work For in India -2017
Six Time Winner India's top 50
People Capital Index
Business Traveller UK Awards
GALLUP GREAT WORKPLACE AWARD
DUN & BRADSTREET CORPORATE AWARDS
ALL INDIA INVESTOR RELATIONS AWARD
CONDÉ NAST TRAVELER US READERS' CHOICE AWARDS
Best Business Hotel Chain in India: Taj Hotels Palaces Resorts Safaris
50 Best Hotels in the World include : Rambagh Palace, Jaipur
Umaid Bhawan Palace, Jodhpur
Taj Diploma�c Enclave, New Delhi
Source : Company data
The Indian Hotels Company Ltd

&
22
Leadership
Name Designa�on Details
N. Chandrasekaran Chairman
PUNEET CHHATWAL MD & CEO
PRABHAT VERMA Sr. V.P -Opera�ons
CHINMAI SHARMA Chief Revenue Officer
GIRIDHAR SANJEEVI CFO
Natarajan Chandrasekaran is the chairman of Tata Sons. Chandrasekaran took over as the
CEO of Tata Consultancy Services on November 6, 2009 prior to which he was COO and
execu�ve director of TCS.
On the 6th of November,2017, Mr. Puneet Chhatwal joined IHCL as the Managing
Director and Chief Execu�ve Officer. He is a global professional with over three decades of
leadership experience at highly-acclaimed hotel groups in Europe and North
America.Prior to this, Mr. Chhatwal was the Chief Execu�ve Officer and Member of the
Execu�ve Board of Steigenberger Hotels AG – Deutsche Hospitality. He was also the Chief
Development Officer of The Rezidor Hotel Group – Carlson Hotels Worldwide. Mr.
Chhatwal is a graduate of both Delhi University and Ins�tute of Hotel Management,
Delhi. He has completed an MBA in Hospitality from ESSEC, Paris and an Advanced
Management Program from INSEAD.
Mr. Prabhat Verma, a hotel management graduate from IHMCTAN, Kolkata joined Taj
group in the year 1990 as a Management Trainee and has held key posi�ons like General
Manager of Taj Malabar, Cochin, and Taj Coromandel, Chennai. He was re-located as
Hotel Manager to Crowne Plaza, St. James Court and 51 Buckingham Gate, the London
proper�es of the Taj. He subsequently took over as General Manager - Crowne Plaza, St.
James and 51 Buckingham gate, London. Mr. Verma has won numerous industry
accolades including Young General Manager of the Year 2005, 5 Star Deluxe category by
FHRAI and the 'Interna�onal Coopera�on between the UK and India Award' (2012) by
Asian Voice.
As the Chief Revenue Officer for the Taj Group, Chinmai's responsibili�es include Brand
Management, Digital Pla�orms, Loyalty programs, Public Rela�ons, Customer Analy�cs,
Global Sales and Revenue Management. Chinmai is a seasoned industry professional
with nearly two decades of progressive hospitality experience in the fields of Strategic
Marke�ng, Revenue Management and Electronic Distribu�on. Chinmai was named as
one of the 'Top 20 Extraordinary minds within Sales, Marke�ng and Technology' by
Hospitality Sales & Marke�ng Associa�on Interna�onal (HSMAI), Europe in 2015. Before
joining Taj, Chinmai was with Starwood Capital Group, based in Paris as the Global head of
Revenue, Distribu�on and eCommerce for Louvre Hotels Group's en�re por�olio of six
hotel brands with 1,100 plus hotels spread across 45 countries
Giri is a Chartered Accountant (An All India Ranker) and an MBA from IIM Ahmedabad
(class of 1987) .Giri joined The Indian Hotels Company Limited from Merck & Co, the
American Pharma company, where he was the CFO for South Asia and the Business
Head for Pakistan, Bangladesh, Srilanka and Nepal. Giri started his career in ITC Ltd,
where he did a variety of roles across businesses in India and the Middle East.
Subsequently, Giri was with IL&FS as an Investment Banker and head of M&A. In
addi�on, he was also the Head of the opera�ons at Eastern India.
Source : Company data
The Indian Hotels Company Ltd

&
23
Outlook And Valua�on
Several macro and micro factors compel us to believe a good visibility of growth in the hospitality sector backed by booming tourism and increase in tariffs a�er a gap of 9 years accompanied by demand growth greater than supply growth. Moreover, the newly charted strategy will help The Indian Hotels Company Ltd in its profitability alongside increasing occupancy levels and average room rates.
On this backdrop, Indian Hotels Company Ltd being the largest player in the Indian hospitality sector, is perfectly poised to reap benefits from the macroeconomic factors. The pullbacks in the sector caused by GST and De-mone�za�on fading away will boost the sector further.
We, value The Indian Hotels Company Ltd on the basis of Sum of the Parts (SOTP) - using DCF for the Parent and Rela�ve Valua�on for the subsidiaries to arrive at a Target Price of INR169.
Free Cash Flow (INR Cr.)
979.59 1,063.13
522.95
930.90 993.61
569.39 673.38
362.85
673.13 760.83
FY 2016 FY 2017 FY 2018E FY 2019E FY 2020E
FCFF FCFE
The Indian Hotels Company Ltd
9504
9360
9562
9308
10213
8800
9000
9200
9400
9600
9800
10000
10200
10400
2013 2014 2015 2016 2017
Average room rent
Source : Company data, SMIFS Research
ARR has by 10% in 2017
63%
64% 64%
65%
66%
62%
62%
63%
63%
64%
64%
65%
65%
66%
66%
67%
2013 2014 2015 2016 2017
Occupancy (%)
Occupancy has by 200 bps since 2015

&
24
Entry of global hospitality players: Many global players are entering the hospitality industry in India. They are being backed by private equity players. This may put pressure on the market share of the Indian Hotels Company Ltd. Their main focus lies in asset light model.
Exchange Rate Risk: The Company has mul�-country opera�ons and is prone to the currency fluctua�ons. This is likely to impact the revenue from foreign markets.
Success of subsidiaries: The Indian Hotels Company’s success primarily depends on the performance of its subsidiaries as the subsidiaries are in losses.
Taj Mansingh Bid: The New Delhi Municipal Council (NDMC) has decided to e-auc�on the Taj Mansingh Hotel. Indian Hotels, had been granted the license for the Taj Mansingh in 1976 for 33 years. The license had expired in 2011, but the company was given many extensions. Although Indian Hotels is also bidding to retain the property, but the Company may lose the property due to s�ff compe��on from other players. The 294-room property accounts for less than 2% of Indian Hotel's total revenues . The auc�on has been ge�ng postponed due to several issues related to the bidding terms.
Economic Ac�vity: The hospitality industry is dependent both on the domes�c and foreign economic ac�vity. IHCL bears a risk of economic downturn. In case of recession the industry will experience lower occupancy levels along with downward pressure on the tariffs leading to a significantly lower RevPAR impac�ng profitability adversely.
Geo-poli�cal Tensions: In case of any geo-poli�cal tension cropping up in any of the loca�ons of IHCL’s existence, it will badly impact the business.
Key Risks
Entry of global hospitality players may put pressure on
the market share of the Indian Hotels Company Ltd
Economic downturn may hamper the
hospitality business
The Indian Hotels Company Ltd

&
25
Financial Details
The Indian Hotels Company Ltd
Income Statement (Standalone)
FY2016A FY2017A FY2018E FY2019E FY2020E
2,268 2,391 2,642 2,933 3,285
106 54 79 88 99
2,374 2,445 2,722 3,021 3,383
210 220 238 266 301
180 167 206 223 243
615 633 691 756 835
346 370 396 428 474
488 464 520 558 617
7 16 16 16 17
1,846 1,871 2,067 2,247 2,487
529 574 654 774 897
23.3% 24.0% 24.8% 26.4% 27.3%
126 151 168 186 213
403 423 486 587 684
243 198 180 150 121
160 225 307 437 563
-7 34 0 0 0
153 259 307 437 563
69 117 107 153 197
84 142 199 284 366
Par�culars (INR Cr.)
[+] Service Income
[+] Other Income
Total Revenues
Food and beverages consumed
Employee benefit expenses
Power & Fuel Cost
Other Opera�ng & Servicing Cost
Selling and Administra�on Expenses
Miscellaneous Expenses
Total Expenses
Opera�ng Profit/EBITDA
Opera�ng margin(%)
[ - ] Deprecia�on
EBIT
[-] Interest
PBT before excep�onal item
Excep�onal Items
PBT
[-] Income Tax Expense
PAT (before share of associates & JVs)
Revenues
Opera�ng Expenses
Source: Company Data, SMIFS Research

&
26
Balance Sheet (Standalone)
The Indian Hotels Company Ltd
Source: Company Data, SMIFS Research
Parameters (INR Cr.)
2016
2017
2018E
2019E
2020E
Assets
Property, plant and equipment
2,101
2,149
2,249
2,421
2,642
Capital work-in-progress
55
108
130
130
78
Intangible assets
41
38
32
27
19
Intangible assets under development
0
0
0
0
0
Investments
1,819
2,875
3,200
3,400
3,400
Loans
1,057
38
500
500
500
Other financial assets
56
59
62
59
60
Advance income tax (net)
48
65
49
54
56
Other non-current assets
250
256
291
323
361
Inventories
45
48
48
46
41
S.T Investments
136
53
207
132
131
Trade receivables
162
214
227
262
285
Cash and cash equivalents
21
14
488
64
56
Other balances with banks
8
8
8
8
8
Loans
1
1
1
1
1
Other financial assets
123
120
132
125
126
Other current assets
42
49
53
59
66
TOTAL
5967
6094
7676
7610
7830
Equity and liabili�es
Equity share capital
99
99
119
119
119
Other equity
2277
2517
4146
4380
4696
Equity a�ributable to owners
2376
2616
4265
4499
4815 Liabili�es
Borrowings
1569
1495
1317
1051
878 Other financial liabili�es
298
253
283
278
272
Provisions
49
49
42
46
46
Deferred tax liabili�es (net)
229
288
243
254
262
S.T Borrowings
7
7
9
12
15
Trade payables
173
177
187
202
223
Other financial liabili�es
921
883
1036
947
955
Provisions
78
86
75
80
88
Other current liabili�es 267 239 218 241 278 TOTAL LIABILITIES 3592 3478 3411 3111 3015 TOTAL Equity and liabili�es 5967 6094 7676 7610 7830

&
27
Source: Company Data, SMIFS Research
FY2016A FY2017A FY2018E FY2019E FY2020E
95.5% 97.8% 97.1% 97.1% 97.1%
4.5% 2.2% 2.9% 2.9% 2.9%
23.3% 24.0% 24.8% 26.4% 27.3%
3.5% 5.8% 7.3% 9.4% 10.8%
12.0% 5.4% 10.5% 11.0% 12.0%
11.2% 3.0% 11.3% 11.0% 12.0%
12.8% 8.7% 13.9% 18.3% 15.9%
202.7% 68.7% 40.4% 42.5% 28.7%
81.4% 78.2% 78.2% 76.6% 75.7%
21.5% 19.4% 19.7% 19.0% 18.8%
37.3% 36.4% 76.2% 47.0% 45.8%
35.8% 35.3% 44.3% 42.7% 42.2%
3.7% 5.7% 5.8% 6.5% 7.9%
2.1% 3.5% 4.1% 5.1% 6.5%
66.4% 57.4% 31.1% 23.6% 18.5%
Par�culars
Service
Other Income
EBITDA Margin
PAT Margin
Service
Revenue
EBITDA
PAT
Cost of services and sales
Selling, general and administra�ve
Current Ra�o
Quick Ra�o
ROAE
Post Tax ROACE
Debt/ Equity
Growth Rates: Y-o-Y
As a % of Sales
Liquidity Ra�o
Return Ra�o
Leverage Ra�o
Revenue Mix
Profit Margins
Key Ra�os (Standalone)
Cash Flow Statement (Standalone)
FY2016A FY2017A FY2018E FY2019E FY2020E
469 457 429 529 706
311 -97 -992 -480 -55
-1043 -367 1036 -473 -660
-262 -7 474 -424 -8
283 21 14 488 64
21 14 488 64 56
Par�culars (INR Cr.)
Total Opera�ng Cashflow
Total Inves�ng Cashflow
Total Financing Cashflow
Net change in Cash Flow
Cash Flow at the beginning of the year
Cash Flow at the end of the year
The Indian Hotels Company Ltd

Members: NSE | BSE | MCX | NCDEX | NSDL | CDSL | Repository (For Disclosures and Disclaimers please follow the page below)
Bloomberg Ticker for Stewart & Macker�ch Research: SMIF<Enter>
Website: www.smifs.com | Email: [email protected]
MUMBAI Mr. Vaibhav Wadke
Office No. 5G, New Marine Lines, Court Chamber, Mumbai - 400 020,
Maharashtra, India Phone: +91 -9967642795
BHUBANESHWAR
Mr. Jeetendra Nath Sahoo
Plot No. 15 -B, Bapuji Nagar, Unit-I, Ashok Nagar,
Bhubaneswar - 751009, Odissa, India. Phone: +91 9668257514
BANGALORE Mr. S. Srikanth
No.153, 2nd Floor, Sheela Arcade, 7th Block Koramangala, (Opp.—Sai Baba Mandir)
Bangalore - 560095, India. Phone: +91 9845020017
KANPUR
Mr. Amit Kumar Gupta
Office No.212 - 213, 2nd Floor, KAN Chamber, Adjacent to UP Stock Exchange, 14/113, Civil Lines, Kanpur - 208001, U�ar Pradesh, India.
Phone: +91 9151104767
REGISTERED OFFICE Mr. Sandipan Cha�erjee
Vaibhav, 4 Lee Road,
Kolkata 700020, India. Phone: +91 33 30515400 / 40115400
Fax No: +91 9748899161
Mr. Ashiwini Kumar Tripathi Director [email protected]
+91 33 30515415 / 40115415 Mobile: +91 9831155058
Mr. Shivaji Roy Sr. VP - Retail Sales [email protected] +91 33 30515400/40115400 Mobile: +91 9830173200
Mr. Jaydeep Pa�anayak Plot No. 15-B, Bapuji Nagar, Unit-I, Ashok Nagar, Bhubaneswar - 751009, Odissa, India. jaydeep.pa�[email protected] Phone: +91 9583099025
NEW DELHI Mr. Rajesh Kumar Jha
6th Floor, 654, Aggarwal Metro Heights, Netaji Subhash Place, Pitampura,
New Delhi – 110034, India. Phone: +91 9999243622
PATNA Mr. Ram Singh
606/A, Ashiana Plaza, Budha Marg, Patna – 800001, Bihar, India.
Phone: +91 9570507409
LUCKNOW Mr. Ashish Verma
6 Park Road, UGF 4, Hazratganj, Lucknow - 226001, U�ar Pradesh, India.
Phone: +91 9559378972
PATHANKOT
Ms. Anuradha Marwaha SCO G -
Pathankot - 145001, Punjab, India. Phone: 0186 - 2222201/ 2222205
CHENNAI
Mr. K.K.Raja Gopalan New No.4/2, Bajaj Apartments,
Seethamal Colony, 1st Cross Corner, Alwarpet,
Chennai – 600018, India. Phone: +91 9383931590
NOIDA
Mr. Prakash Srivastava
1st, Floor, Wave Silver Tower, Sector -18, Noida - 201301, U�ar Pradesh, India.
Phone: +91 9910497783
Research & Development Strategies
Mr. Ajay Srivastava Associate VP - Research [email protected] +91 33 30515400 Mr. Kapil Joshi
Research Analyst Infrastructure/Power [email protected] +91 33 40115468
Mr. Sarthak Mukherjee Research Analyst Avia�on/Hospitality/Logis�cs [email protected] +91 33 40115474
Mr. Saurabh Ginodia Associate VP - Research & Strategies
[email protected] +91 33 30515407
Ms. Mononita Mitra
Research Analyst Agro/Chemicals [email protected] +91 33 40115468 Mr. Anupam Goswami Research Analyst Building Products/Capital Goods/
Construc�on Equipment [email protected] +91 33 40115474
Ms. Sutapa Biswas Sr. Research Analyst Economy [email protected] +91 9836020612 Mr. Debjit Maji
Research Analyst Auto & Auto Ancillary/Telecom [email protected] +91 33 40115474
Mr. Rahul Agarwal
Research Associate BFSI [email protected] +91 33 40115400
Mr. Abhishek Roy Research Analyst
FMCG/Retail/Consumer Durables [email protected] +91 33 40115468 Mr. Anmol Das
Research Analyst Metals and Mining [email protected] +91 33 40115474 Mr. Vivek Sethia
Research Analyst [email protected] +91 33 40115400
Mr. Pra�m Roy
Research Analyst Oil & Gas/Tex�les pra�[email protected] +91 33 40115400 Mr. Anik Mitra Research Analyst IT/ Pharmaceu�cals
[email protected] +91 33 40115400
Mr. Dipanjan Basuthakur Sr. Research Analyst [email protected] +91 33 30515486
Sales Leadership Team
Contact Details
Mr. Monal Desai Sr. VP - Ins�tu�onal Sales [email protected] +91 2242005555 Mobile: +91 9821137303
Mr. Taj Mohammad 6th Floor, 654, Aggarwal Metro Heights, Netaji Subhash Place, Pitampura, New Delhi – 110034, India. [email protected] Phone: +91 9818754786
Mr. Vishal Prabhakar Sr. VP - PMS & PCG [email protected] +91 33 30515400 / 40115400 Mobile: +91 9831554477
Mr. Sohil I Khan Office No. 5G, New Marine Lines, Court Chamber, Mumbai - 400 020, Maharashtra, India Phone: +91 9930294893
Mr. Saurasanta Biswas Vaibhav, 4 Lee Road, Kolkata - 700020, India. [email protected] Phone: +91 9883604672
Mr. Deepankar Saha Research Assistant [email protected] +91 33 30515468
Ms. Debjani Sen Officer – Investor Rela�ons [email protected] +91 33 30515401
Investor Rela�ons and Data Support
Mr. Ajay Jaiswal President: Strategies and Head Research
[email protected] +91 33 30515408 / 40115408 Mobile: +91 9836966900
Mr. Rajesh Basu Majumdar Head Equi�es - Ins�tu�onal
[email protected] +91 33 30515400 / 40115400 Mobile: +91 9830267133
Mr. Rahul Kayan Director [email protected]
+91 33 30515419 / 40115419
Mr. Jaydeb Dey
Technical Analyst Equi�es [email protected] +91 33 30515433
Mr. Sam Nair
AVP - Commodi�es [email protected] +91 81138 52263
Commodity Research Technical Research
Research Team
Stock Recommenda�on Expected absolute returns (%) over 12 months
Strong Buy >20%
Buy between 12% and 20%
Accumulate between 6% and 12%
Hold between 0% and 6%
Sell 0 to <-10%
Neutral No Ra�ng
Mr. Nadim Heyat VP - Distribu�on [email protected] +91 33 30515400 / 40115400 Mobile: 9831253842/9674965154
28
&
29
&