the influence of accounting standards on valuation models ... · the influence of accounting...
TRANSCRIPT

The Influence of Accounting Standards on Valuation
Models: An Application to the Fama-French Model
ABSTRACT
In this paper we analyze the effect of cross-country differences in accounting
standards on the performance of valuation models from a theoretical and empirical point
of view. We show how the lack of uniform accounting standards in the world generates
misleading international comparisons of firm level data. A unified framework of
accounting reporting would facilitate these comparisons and improve the efficiency of
the global financial market. As an empirical application, we analyze how differences in
accounting standards affect the performance of the Fama-French (1993) three-factor
valuation model. We show that the F-F model is not only country-specific (Griffin,
2002) but also accounting-specific. In other words, the model works if the data are
homogeneous in terms of accounting standards. This result has a very important
empirical corollary in that the three factor model accounts extremely well for the cross-
country returns of firms following IASB standards.
Keywords: Accounting systems, international valuation and comparisons, IASB
accounting system, Fama-French three factor model.
JEL Classification: M41, G12.
1
1. INTRODUCTION
Given the continuous trend toward increased integration of capital markets,
valuation models that can be applied at the international or global level are becoming
more and more important. The correct allocation of international investment hinges
directly on correct cross-country comparisons of returns of financial assets.
However, so far the performance of valuation models at the international level
has not been stellar. In particular, models that work quite well at the domestic level –the
CAPM, or multifactor extensions such as the three-factor model of Fama and French (F-
F, 1993)- have failed to provide a good explanation of the cross-country structure of
returns. In this paper we look at the latter model as one of the main examples of this
failure of international valuation models. There is quite strong evidence that the F-F
model can be applied domestically for widely different countries: apart from the original
paper that looked at the cross-section of returns of US firms, other authors have applied
the model to Japan (Chan et al., 1991), countries in the Euro Area (Moerman, 2005), the
Pacific Basin countries (Chui and Wei, 1998), Australia (Faff, 2004; Gaunt, 2004),
China (Cao et al., 2005) and wider sets of countries (Fama and French, 1998).
However, when it is applied at a cross-country level, the model loses explanatory power
and it does not seem able to explain the international cross-section of expected returns.
For example, the comprehensive analyses in Griffin (2002) or Moerman (2005)
convincingly suggest that the F-F model has validity only at the domestic level.
The failure of these international valuation models may be due to several
reasons. We focus the analysis in this paper on reasons related to the way the accounting
measures used in valuation –normally some measure of earnings- are calculated. There
are appreciable differences in accounting standards across the world. These differences
affect the way accounting measures of earnings behave over time, and how they may be
related to risk factors or to firm characteristics. If these measurement-induced
differences in behavior are not taken into account when comparing, for example,
earnings of firms quoting in different capital markets, the comparisons could be quite
misleading, if not outright incorrect.1
As a consequence, differences in accounting standards could prevent analysts
from meaningful cross-country analyses and valuation exercises. Taking the F-F model
as an example, again, it is reasonable that a world version of the model would perform
worse than a country-specific version just because of the heterogeneity in accounting
measures introduced by the different accounting standards. It has to be remembered that
F-F justify their risk factors (book-to-market and size) on the basis of the relationship of
these factors to companies’ earnings, which are, after all, an accounting measure.
Differences in accounting practices may lead to distorted international comparisons,
especially if the countries to which the firms belong have quite differing ways of
computing or reporting earnings over time.
In this paper we briefly show how the different degree of conservatism of two
accounting systems distorts raw cross-country comparisons of accounting measures, and
we suggest that international valuation models should be applied considering the
1 Just to offer an example, Telefonica, one of the biggest companies in Spain, posted in 2001 a profit of
2160 million euros, computed using the Spanish accounting standards. The same figure became a loss of
7180 million euros when the US GAAP were used instead.

2
financial accounting dimension explicitly. In the limit, of course, the implication is that
domestic versions of the valuation models are based on the most homogeneous
accounting data, and it is no surprise that these domestic versions perform quite well.
We provide empirical evidence with regards to the importance of homogeneity
of accounting measures by examining the performance of different versions of the F-F
three-factor model. We show –in line with previous literature- how domestic versions
clearly outperform the global version of the model, as should be the case given the high
homogeneity of domestic data, but also that an international version of the model based
on countries that share the accounting system –and therefore use similar accounting
standards- improves on the simple global version that pools together firms in different
accounting systems. More relevant evidence comes from the application of the F-F
model to companies that use the IASB system. These companies come from different
countries but are by definition subject to the same reporting standards. We show how
the F-F model applied to these companies, whose data are homogeneous in the
accounting sense, does an excellent job explaining the cross-section of expected returns
of the IASB companies. In fact, the performance in terms of goodness-of-fit of the
IASB-version of the F-F model is comparable, if not better, than the performance of
single-country domestic versions. We believe this to be quite strong evidence in favor
of the use of homogeneous accounting measures, and therefore of explicitly including
the accounting-standards dimension, when carrying out international valuation
exercises.
The rest of the paper proceeds as follows. Section 2 comments on the differences
on accounting measures induced by different accounting standards across countries: the
section contains a brief review of the literature that has looked at the cross-country
behavior of accounting measures and its relationship to the accounting environment and
regulation. The section also contains a simple model that shows how these differences
in accounting practices may affect valuation. Sections 3 and 4 carry out a
comprehensive test of the three-factor model of Fama and French (1993) and show how
homogeneity of accounting measures improves quite significantly the performance of
international versions of the model. In particular, we show how the model performs
extremely well for a group of companies that share the same accounting standards –the
IASB system– despite these companies coming from different countries. Section 5
concludes.
2. THE COMPARISON OF ACCOUNTING MEASURES ACROSS COUNTRIES
We present in this section a brief review of recent literature on cross-country
comparisons of accounting measures, and a very simple theoretical argument for the
impact of accounting standards on international valuation.
2.1. A LOOK AT SOME RECENT LITERATURE
The behavior of accounting measures across countries may differ significantly
because of differing accounting standards or other institutional features such as
commercial regulations, litigation risk, the structure of providers of capital funds,
investor protection or the tax system. These differences should be taken into account

3
when comparing earnings of firms that quote in different capital markets. Otherwise,
comparative valuation across countries could be highly misleading.
Among these factors that generate heterogeneity of accounting measures,
differences in accounting systems should be given special attention. The literature has
found that countries that follow the same accounting system, for example, common-law
or code-law countries, also share a similar accounting and legal environment. This
generates that accounting variables, such as earnings, behave quite similarly across
countries that share the same accounting system. Alternatively, the cross-section
behavior of accounting measures may be substantially distorted when information from
countries with different accounting systems is pooled.
For example, Ball et al. (2000) find that earnings of firms in common-law
countries (US, UK, Australia and Canada) are much more asymmetric than earnings in
code-law countries. Similarly, Giner and Rees (2001), Raonic et al. (2004), García Lara
and Mora (2004), García Lara et al. (2005) and Bushman and Piotroski (2005) show
that the demand for timely information in the financial statements is different in code-
law and common-law countries, given that the structure of providers of capital funds
differs significantly between the two accounting systems.
Furthermore, Ball et al. (2000) find that smoothing of earnings is more intense in
code-law based countries because banks tend to hold large direct or indirect ownership
blocks and therefore dominate voting rights. Since bank leverage regulations penalize
volatility in bank net income, these banks have incentives to reduce this volatility and
pressure firms to generate smooth earnings. In this line, Bao and Bao (2004), Gassen et
al. (2005) and García Lara et al. (2006) also find evidence consistent with the existence
of smoothing of earnings in Germany.
Differences in tax systems are other factors that could affect cross-country
similarities in the behavior of earnings. Harris et al. (1994), Kasanen et al. (1996), Lamb
et al. (1998) and Seckler (1998) point out that earnings reported by code-law based
firms are quite influenced by taxation: a more intense link between earnings and the tax
system creates incentives for earnings manipulation, which tends to result in delayed
taxation.
Even within the same accounting system, there may be appreciable differences
in the behavior of accounting measures across countries. For example, Beaver and Ryan
(2005) and Pope and Walker (2003) find that conservatism in the balance sheet
significantly affects the timeliness of earnings to news. If an asset is not recognized,
then the news affecting this asset will not be captured in earnings. If revaluation of
assets is not generally allowed, good news will not be captured in earnings. Significant
differences in conservatism in balance sheet around the world exist. For example,
revaluation of assets is allowed in the UK, Ireland and the Netherlands but not in the
US. In code-law based countries, revaluation is allowed but taxed in France, and
therefore not used at all; revaluation is also allowed in Italy and Spain but only under
very stringent regulations that limit the usefulness of its practice; revaluation in
Germany is forbidden. The regulation of capitalization of internally generated intangible
assets also varies significantly from country to country.
4
Not only accounting standards can be different between countries in the same
accounting system, but also regulations could differ. This could also have a significant
impact in earnings. For example, the German Stock Law allows managers to retain a
maximum of 50% of the reported earnings, leaving the rest to the shareholders’
discretion.2 In this situation managers have incentives to reduce earnings and thus
increase the capacity to finance their investment strategies using internal funds.3 Pope
and Walker (1999) provide another example, and show that managers of UK firms use
extraordinary items to recognize bad news, thus affecting the quality of ordinary
measures of earnings: unless earnings data are calculated after extraordinary items, the
measures could be quite distorted and prevent the analyst from meaningful comparisons
with firms from other countries.
The above discussion should suffice to demonstrate the importance of
comparability of accounting measures when any type of valuation analysis needs to be
carried out at a cross-country level. In this paper we focus our attention on the effects of
comparability of data from countries with different accounting standards. This is in line
with the discussion in the last paragraphs, which showed that, even within the same
accounting system, differences in institutional features could lead to significant
differences in the behavior of accounting measures, and thus make international
comparisons more involved.
For the sake of illustration, we show in the next subsection a simple model that
shows how different accounting standards, or differences in factors that affect the way
earnings are accounted for, may have an influence on the validity of cross-country
valuation models. This allows us to point out some limitations of these models and
suggest that international valuation models should be applied at the accounting-
standards level.
2.2. THE INFLUENCE OF ACCOUNTING STANDARDS IN VALUATION
Differences in accounting standards could result in misleading cross-country
comparisons of accounting measures, and therefore lead to errors in valuation. This
could partly explain the poor performance of valuation models such as the Fama-French
(FF) three-factor model when applied in international settings: if the data used come
from firms in countries that follow different accounting standards, the heterogeneity of
accounting measures would impede meaningful comparisons and therefore distort the
results.
A simple model of dividends may be useful to clarify this relationship between
the accounting system and expected stock returns.4 Consider a firm that finances its
investments with retained earnings. Dividends in period t (D(t)) are equal to equity
income (EI(t)5) plus depreciation (DP(t)) minus investment outlays (I(t)),
2 In Chile profitable firms must distribute at least 30% of their net income in the form of dividends.
3 This is related to the pecking order theory developed by Myers (1984) and Myers and Majluf (1984).
The theory argues that managers prefer internal to external funds to finance their investments. Ehrhardt
and Schmidt (2003) analyze the behavior of German managers and show that these managers behave
according to the pecking order theory. 4 Fama and French (1995) used this simple model to establish the relation between book-to-market-equity
and expected stock return, and between book-to-market-equity and earnings on book equity. 5 EI(t) is earning after depreciation, interest, taxes and preferred dividends but before extraordinary items.

5
( ) ( ) ( ) ( )D t EI t DP t I t= + −
Suppose that at time t, expected depreciation and investment for any future period t+i
are proportional to expected equity income
( ) ( ) ( ) ( ) ( )1 2( ) 1t t t
E D t i E EI t i DP t i I t i E EI t i a a+ = + + + − + = + + −
where a1 and a2 are the constant proportionality factors. Assuming a constant discount
rate r for expected dividends, the market value of equity at time t should be:
( ) ( )( )
( )1 2
1
11
t
ii
E EI t iME t a a
r
∞
=
+= + −
+∑
Now we introduce the differences that may be due to accounting standards. Let
“A” be a firm in a market where the accounting standards are aggressive or,
alternatively, where the earning is the firm’s economic rent of year t. Let “B” be the
same firm quoting in a capital market where the accounting standards are more
conservative. We assume that period 1 is the first period in the life of both firms. The
estimated flows of earnings would correspond to:
1 2 3 …. ∞
A K K K …. K
B 1K δ− 2 1K δ δ− + 3 2K δ δ− + …. 1K δ δ∞ ∞−− +
where K is firm A’s economic rent (aggressive accounting system). δi is therefore the
sum of deferred income and anticipated expenses by the conservative accounting
system at time i.6 This term could be understood as the global impact of a conservative
accounting environment (accounting standards, commercial regulation, litigation
risk…). We assume, for simplicity, that 1 2 3 ....δ δ δ δ∞= = = = . Straightforward
application of the above formula would yield different market values for A and B:7
( )0 1 2 1 2
1
( ) (1 ) (1 )1
ii
K KME A a a a a
rr
∞
=
= + − = + −+
∑
( ) ( )
( )
10 1 2 1 2
2
10 1 2
( ) (1 ) (1 )11
( ) (1 )1
ii
KKME B a a a a
rr
ME A a ar
δ
δ
∞
=
−= + − + + − =
++
= − + −+
∑
6 These results would be the same if we split δi, the global effect of a conservative accounting system,
into the part of anticipated expenses (ρi) and the part of deferred income (δi), as we do in the next
subsection. 7 Derivation of all the formulas in this subsection is quite straightforward.

6
In other words, the market value of B would depend on δ1 and, consequently,
two identical firms in countries with different accounting standards would be priced
differently. This goes against the efficiency of a global capital market which should
price equally two identical firms. We assume, therefore, that rational investors do take
into account these differences in accounting standards for the valuation of firms, and
adjust the market value of B by estimating 1δ̂ , so that:
( ) ( )1 1
0 1 2 1 2 0
2
ˆ( ) (1 ) (1 ) ( )
11i
i
KKME B a a a a ME A
rr
δ δ∞
=
+ −= + − + + − =
++∑
On the other hand, the accounting system indeed will affect the market-to-book
ratio of a firm, given that book values in empirical analyses cannot be explicitly taken to
be adjusted the way market values are.
Letting C0 be the initial and unique contribution of shareholders, we can
compute the current book values of A and B as:
( ) ( ) ( )( ) ( ) ( ) ( ) ( )( )
( ) ( )( ) ( ) ( )
0 0
1 1
0 0 2 1 0 2 1
1 1
t t
t A A A A A A
i i
t t
A A
i i
BE A C EI i D i C EI i EI i DP i I i
C I i DP i C K a a C tK a a
= =
= =
= + − = + − − + =
= + − = + − = + −
∑ ∑
∑ ∑
( ) ( ) ( )( ) ( ) ( )( )
( ) ( ) ( ) ( ) ( )
( )[ ] ( ) ( )
0 0
1 1
0 2 1 0 2 1 1
1
0 2 1 1 1 2 1
1
t t
t B B B B
i i
t
B
i
t
BE B C EI i D i C I i DP i
C EI i a a C a a K t K
C a a tK BE A a a
δ
δ δ
= =
=
= + − = + − =
= + − = + − − + − =
= + − − = − −
∑ ∑
∑
We see that BEt(A) will usually be higher than BEt(B) since dividends will
generally be lower than equity income:
2 1( )I DP EI D
a aEI EI EI EI
− = − = −
If dividends were bigger than equity income, then BEt(B)> BEt(A): the conservative
accounting system forces the retaining of funds, thus limiting the capacity to pay higher
dividends.
We suppose now, for simplicity, that the annualized mean return is l in both
contexts:
( )
( )
0
0
( ) ( ) 1
( ) ( ) 1
t
t
t
t
ME A ME A l
ME B ME B l
= +
= +
Consequently, the market-to-book ratio (MBt) for firm B is:
7
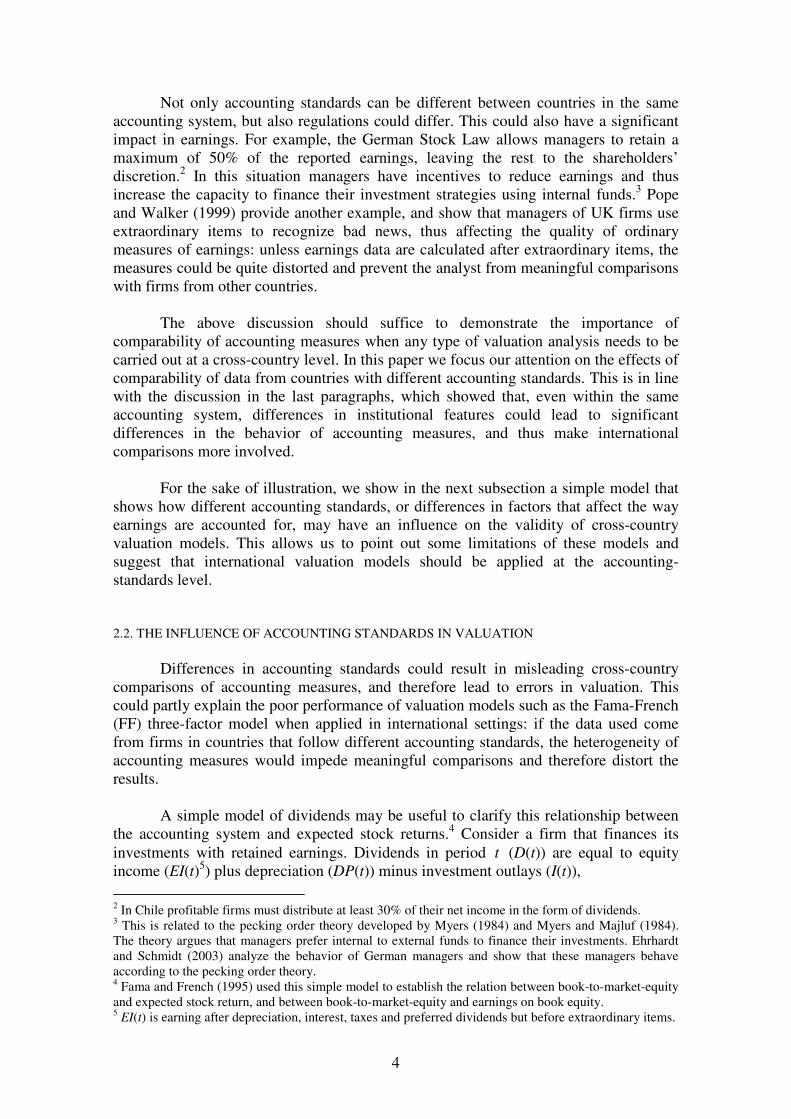
ψ−==
1
)(
)(
)()(
AMB
BBE
BMEBMB t
t
tt
Where )(
)( 121
ABE
aa
t
−=
δψ . Note that MBt(B) differs in general from MBt(A). In fact, it will
usually be larger than that of A. The two ratios would only be equal:
a) If 1 0δ = , that is, in the case of both companies being in the same accounting
system
b) If 2 1a a= , that is, when pay-out is equal to equity income of the company.8
It is clear, then, that MTB ratios for identical firms across accounting systems will
usually not be the same: the MTB ratio of the company in the more conservative system
will usually be larger.
The differences induced by the accounting standards could be adjusted in order to
obtain cross-country comparable market-to-book ratios. In our example, we would need
to find an estimate of ( )1 2 1a aδ+ − in order to adjust the book value of B. This type of
adjustment requires thorough knowledge of the operations and procedures of firm B,
and it is likely to be much more difficult to implement than the adjustment of market
values –which is, at the end, done by the market’s assessment of the values of the two
companies.
The above result has important implications:
1) International investors or global analysts should consider the differences in
accounting standards when carrying out cross-country valuation or should at
least acknowledge the need for adjustments in the accounting measures used in
the analysis.
2) International standards setters should take into account that higher differences
in accounting standards lead to larger differences in MTB and other accounting-
based ratios.
Additionally, a related implication is that firms with the same MTB ratio belonging to
countries with different accounting standards should probably not be directly compared,
and therefore, international valuation models or models that try to explain cross-country
returns should not mix heterogeneous –i.e. coming from different standards- accounting
information. This has a direct application when using valuation models, such as the F-F
three-factor model.
2.3. ACCOUNTING FOR INFLATION
Given the structure of the above analysis, it seems more realistic to allow for
differing values of δi, and, in particular, to explore the possible effect of inflation. We
now introduce inflation and analyze separately anticipated expenses and deferred
incomes of a conservative accounting system. Just as before, let “A” be a firm that
8 We are working with firms that finance their investments with retained earnings as we defined in 2.2, so
a2≠a1.
8
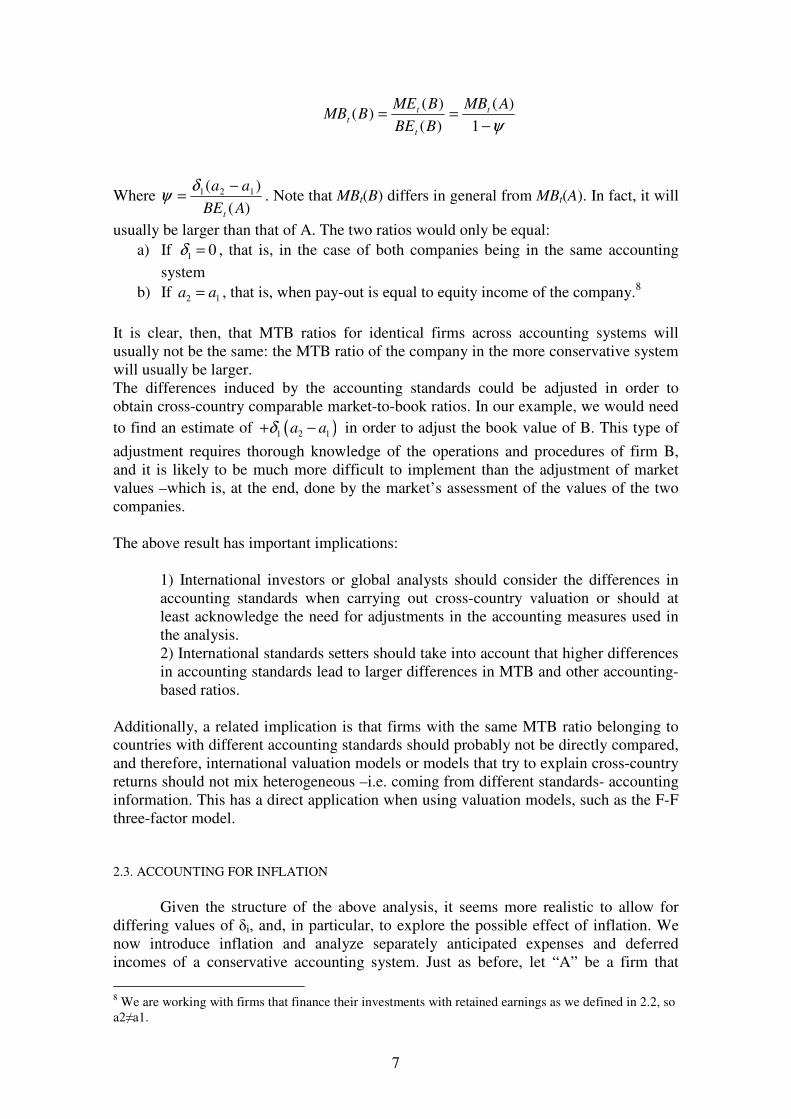
quotes in a market where the accounting standards are aggressive and let “B” be an
identical firm quoting in a capital market where the accounting standards are more
conservative. The estimated future flows of earnings are:
1 2 3 ….
A K (1 )K g+ 2(1 )K g+ ....
B 1 1K δ ρ− − [ ]( )1 1 1 11K gδ ρ δ ρ− − + + + [ ]( ) [ ]( )2
1 1 1 11 1K g gδ ρ δ ρ− − + + + + ….
Where K is the economic rent of firm A, δi is the amount of deferred income and ρi is
the level of anticipated expenses by the conservative accounting system at time i. These
last two terms can be understood as the global impact of a conservative environment. K,
δ1 and ρ1 grow at rate g, the (constant) inflation rate. In a global market the market
values of A and B again will be the same, so an adjustment for δ1 and ρ1 will be needed:
( )
( )
1
0 1 2
1
1( ) (1 )
1
i
ii
K gME A a a
r
−∞
=
+= + −
+∑
( )( )
( )
( )( )
( )
( )( )
( )
1
1 1 1 1
1
0 1 2 0221 11 1
2 2
ˆ ˆ 1
1( ) (1 ) ( )
ˆ ˆ 11
1 1
i
ii
ii
i ii i
K g
rME B a a ME A
gg
r r
δ ρ δ ρ
δ ρδ ρ
−∞
=
−−∞ ∞
= =
+ + − − + + = + − = + ++ + + − + +
∑
∑ ∑
However, just as before, the differences in MTB ratios will be affected, and most
likely amplified, by inflation. Let C0 be the initial and unique contribution of
shareholders (see Appendix for derivation):
( ) ( ) ( )( ) ( )( )1
0 0 2 1
1 1
1t t
i
t A A
i i
BE A C EI i D i C K a a g−
= =
= + − = + − +∑ ∑
( ) ( ) ( )( ) ( ) ( )( ) ( )1
0 1 1 2 1
1
1t
t
t B B t
i
BE B C EI i D i BE A a a gδ ρ−
=
= + − = − + − + ∑
Again one can see that BEt(A) will usually be higher than BEt(B) –dividends being
lower than equity income. Assuming, as before, that the annualized mean return of both
identical firms is l, the relationship between the market-to-book ratio in A and B will
be:
'1
)(
)(
)()(
ψ−==
AMB
BBE
BMEBMB t
t
tt , where
( )( ) ( )[ ])(
1'
1
1211
ABE
gaa
t
t−+−+
=ρδ
ψ
And the conclusions from 2.2 still hold: MBt(B) is greater than MBt(A) and, in this case,
the difference induced by the accounting standard will be even larger. Consequently, the
same comment about adjustment in the MTB ratios that we did in the previous

9
subsection applies here. Now the necessary adjustment should require knowledge of
( )( ) ( )1
1 1 2 1 1t
a a gδ ρ− + + − +
.
Thus, our simple analysis has important implications for valuation models that
use accounting ratios. The conservativeness of accounting standards will normally
affect ratios based on accounting measures and, as a consequence, valuation models
should perform poorly when using unadjusted cross-country accounting measures. A
related consequence is, then, that differences in accounting standards would distort the
process of international selection of assets, possibly leading to substantial
misallocations in the absence of the necessary adjustments.
An alternative way of expressing this main conclusion is that the use of global
measures could work out well only in integrated financial markets with similar
accounting standards. If firms from markets with appreciable differences between
accounting standards are pooled in the analysis, then the performance of valuation
models could be quite poor or, even, misleading.
3. AN EMPIRICAL APPLICATION: WHY DO GLOBAL VERSIONS OF THE F-F
THREE FACTOR MODEL PERFORM POORLY?
The conclusions of the above analysis have important implications for a
particular, and popular, model of stock valuation: the Fama-French (F-F, 1993) three-
factor model. This model is an ideal setting for testing the relevance of our main
conclusion, given that the F-F risk factors are directly related to an accounting measure,
specifically earnings: F-F relate their BTM and Size risk factors to firm profits. Firms
that have high BTM ratio tend to present low earnings on assets and firms with low
BTM have persistently high earnings; controlling for BTM, small firms have lower
earnings on assets than large ones.
We have showed theoretically that accounting standards differences affect BTM
ratios, therefore if we do not take into account this for constructing BTM factor, we will
not be able to compare firms’ retuns in an efficient way.
Empirical analyses of the F-F model have shown that the model performs poorly
when applied at the global level, thus concluding that its validity is only at the country
level (Griffin, 2002). Our discussion qualifies this conclusion: it is clear that a global
version of the F-F model should perform worse than a version using more integrated
accounting data or, in the limit, a version that uses data from one single country, for
which the accounting standards are unified by definition.
The conclusion then would be that an accounting-standards-specific version of
the F-F model should be the correct way for evaluating the risk-return relationship. This
implies that data should be pooled only from firms in the same country or in countries
that used the same accounting standards. A corollary to this conclusion is that one could
pool data from firms that, despite being in different countries, were subject to the same
accounting standards, as it is the case with firms using the IASB system.
10
Note that this conclusion does not necessarily depend on the meaning of the F-F
factors. Whether the F-F factors are proxying for global risk factors (as F-F initially
postulated or the analyses in Liew and Vassalou, 1991, or Kelly, 2006, suggest) or for
firm characteristics (Daniel and Titman, 1997; Lakonishok et al., 1998; Daniel et al.,
2001) the inclusion of data for firms with different accounting standards will lead to
distorted results, given the time inconsistency of the different measures. Thus, we would
expect the performance of international versions of F-F-based valuation analyses to
improve significantly when the data are unified by accounting standards.
We attempt to carry out now an empirical test of this implication, by estimating
F-F models at the country, international, world and accounting-system levels, including
a separate analysis of the IASB firms. Firms that use the IASB system are located in
different countries but report with the same accounting standards. The performance of
the F-F factors for this subset of firms should be comparable to that of country-specific
applications if indeed the homogeneity of accounting measures is, at least partly, the
cause for the underperformance of international valuation exercises.
Our sample consists of data for firms in Australia, Canada, UK, USA, Germany,
France, Japan, Malaysia, Singapore and all firms following IASB standards over the
period 1995-2004. Thus, we cover three different accounting systems (Continental,
Common and Asian) plus the IASB firms. The data come from the Global Vantage
Compustat database. Fiscal years end in June for Australian firms, March for Japanese
firms and December for firms in the rest of the countries. The total number of firms is
313 for Australia, 337 for Canada, 526 for the UK, 1,949 for USA, 352 for Germany,
532 for France, 2,777 for Japan, 466 for Malaysia, 298 for Singapore and 810 firms
following IASB standards around the world.
We collect the following data for each firm: Market value, ordinary common
equity and return (adjusted for dividends, capital increases, splits and reverse splits).
Size, common equity and returns are measured in local currency. In the IASB sample
the size and common equity are measured in US dollars. Moreover, as it is usual, we
only consider firms with positive common equity.
The return of the MSCI index for each country has been used as a proxy for
market return and the level of the three-month interest rate of Treasury bills of each
country has been taken as a proxy for the return of the risk-free asset. For firms
following IASB standards, we have calculated a weighted average of the return of the
MSCI indices and the three-month interest rates of the countries represented. All these
calculations have been based on data from Factset-JCF database.9
We follow exactly the procedure described by F-F (1993) to construct the size
and book-to-market portfolios. In order to account for the different fiscal years of Japan
and Australia, we take, respectively, portfolios constructed at the end of September and
at the end of December. For the rest of the countries we construct portfolios at the end
of June. The portfolios are reformed after twelve months. Book-to-market at the end of
the fiscal year is, then, book common equity divided by market equity for the fiscal year
ending in calendar year t-1, and Size is the market value at the moment the portfolio is
constructed. Thus, the results correspond to the periods January 1996-December 2004
9 We have obtained similar results using an average of the mean returns of firms in the sample of each
country as a proxy of market return.

11
(Australia), October 1996-September 2004 (Japan) and July 1996-June 2004 (rest of the
countries).
3.1. FOUR VERSIONS OF THE F-F MODEL
In a global efficient capital market there should be a unique set of risk factors
that describe expected returns in all countries. However, we have shown that if capital
markets are not integrated in the “accounting sense” the performance of world versions
of valuation models could be seriously affected. In order to show evidence in this
regard, we evaluate four different versions of the F-F model: a domestic version
(Domestic Accounting System), an extension of the domestic setting that we call
International, a simple World version and a version based on countries that follow the
same accounting system (Global Accounting System).
The Domestic Accounting System version is the traditional F-F (1993) model that
uses country-specific factors for a country-by-country valuation analysis. This implies
that the data used are perfectly homogeneous in their accounting standards and therefore
the valuation model should perform well. The model is:
pt ft p pM t pSMB t pHML t pt
R r MKT SMB HML eα β β β− = + + + + [1]
Where Rpt is the return on portfolio p in month t, rft is the return on the risk-free asset in
month t and ept is the error term. MKTt is the market factor, SMBt is the difference
between the average returns on the three portfolios containing the smallest-cap stocks
(value, neutral and growth) and the returns on the three portfolios containing the largest-
cap stocks (value, neutral and growth), and HMLt is the difference between the average
returns on the two stock portfolios with a high Book-to-Market ratio (big-value and
small-value) and the average returns of the stock portfolios with a low Book-to-Market
ratio (small-growth and big-growth). The subscript p in the parameters indicates that the
effect of the factors may vary between portfolios.
We construct the International version (Griffin, 2002) by adding to the Domestic
model a set of foreign factors. We use the market value of each country in US dollars
for weighting the factors of the model:
( ) ( ) ( )1 1 1
8 8 8
1 1 1
1 1 1
pt ft p DpMKT Dt t DpSMB Dt t DpHML Dt t
FpMKT Ft Ft FpSMB Ft Ft FpHML Ft Ft pt
F F F
R r W DMKT W DSMB W DHML
W FMKT W FSMB W FHML e
α β β β
β β β
− − −
− − −= = =
− = + + + +
+ + +
∑ ∑ ∑
[2]
where WDt-1 is the fraction of the total US dollar-denominated market capitalization of
the analyzed country in the previous month and WFt-1 is the fraction of the total market
capitalization of the remaining countries. DMKTt, DSMBt and DHMLt are the domestic
factors in month t and FMKTt, FSMBt and FHMLt are the foreign factors in month t.
The World version of the model is:
12
9 9
1 1
1 1
9
1
1
pt ft p pMKT it it pSMB it it
i i
pHML it it pt
i
R r W MKT W SMB
W HML e
α β β
β
− −= =
−=
− = + +
+ +
∑ ∑
∑ [3]
where Wit-1 is the fraction of the total US dollar-denominated market capitalization of
country i in the previous month and MKTit, SMBit and HMLit are the factors of country i
in month t. Notice that this setup assumes that a single set of world factors should
explain the expected returns of companies in different countries.
Finally, the Global Accounting System is a modification of the Global model:
only firms from countries in the same accounting system are considered. We have
aggregated countries into three different accounting systems: the Common Law group
consists of Australia, Canada, UK an the USA; the Code Law group includes Germany,
France and Japan; finally, the Asian sample consists of Malaysia and Singapore.
The differentiation between common-law and code-law countries is by now
quite well accepted (Ball et al., 2000; Ball et al., 2003; García Lara and Mora, 2004).
The Asian sample is motivated by the conclusion in Ball et al. (2003) that financial
reporting in East Asian countries presents some similarities with the common-law
system, but it also exhibits distinct regional features.
The Global Accounting System model is then:
1 1
1 1
1
1
n n
pt ft p pMKT it it pSMB it it
i i
n
pHML it it pt
i
R r W MKT W SMB
W HML e
α β β
β
− −= =
−=
− = + +
+ +
∑ ∑
∑ [4]
where Wit-1 is the fraction of the total US dollar-denominated market capitalization of
country i in the previous month, and MKTit, SMBit and HMLit are the factors for country
i in month t. Subscript i indexes the n countries in each accounting system group (four
common-law countries, three code-law countries and two Asian countries).
The prediction of our discussion in Section 2 is that versions with homogeneous
accounting data will perform better than other versions: the Domestic version should be
the best performer –domestic firms are subject to the same accounting standards- and
the World version should perform worse than the Global Accounting System model.
Additionally, a World-IASB model that is applied exclusively to firms in the IASB
sample should perform similarly to Domestic models despite its international character.
4. RESULTS
Panel A of Table 1 shows some descriptive statistics of the countries considered
in this study. The monthly average number of firms varies between 179 in Singapore
and 2,429 in the USA. The average market value per firm varies between 196 million
US dollars in the Malaysian capital market and 4,201 in the US market. The country
13
with a highest BTM ratio is Japan and that with a lowest ratio is the USA. Significant
differences can be found in BTM ratios across countries, differences that could be
explained partially by the differences in accounting standards underlined in Section 2.
In this line, we could say that the country with the lowest BTM ratio (highest MTB)
would be the country with a more conservative accounting system in earnings terms,
this country would be USA and this is in line with accounting literature about
conservatism in earnings.
Panel B reports the weights of the countries in terms of market value, using
values in US dollars for the weighting. The US factors weight 63% in the construction
of world factors, which is reasonable given that the US market is by far the largest in
terms of market value. When common-law factors are constructed, this weight increases
to 84%. In code-law (continental) factors, Japan weights a 79%, so the continental
factors are quite influenced by the Japanese market. Asian factors are more balanced.10
Table 2 reports simple correlations between the factors used in this study. It is
important to note that the World, Continental, Common and Asian market factors are
significantly correlated. This is not exactly the same for the Size and BTM factors. The
World factors are highly correlated with the Common factors, given the high weight of
the US market. It is also important to observe in a country-level analysis that the World,
Continental, Common and Asian market factors are correlated with all countries
belonging to the factor. Again, this result is not obtained in the case of the Size and BTM
factors.11
Regarding Asian countries, we see that Malaysia and Singapore have high
correlations with the Asian Size and BTM factors. This result can be explained by the
similar weight of these countries in Asian factors and by the similarities of their
accounting standards. As Ball et al. (2003) point out, these countries have had strong
British influence and by 1996 most IASB standards had already been adopted in both
countries.12
However, these countries adapt the accounting standards issued by the
IASB to their specific local needs, which makes them especially interesting subjects of
separate analysis. This homogeneity in accounting standards can be an important factor
determining the high correlations between Country factors and Asian factors.
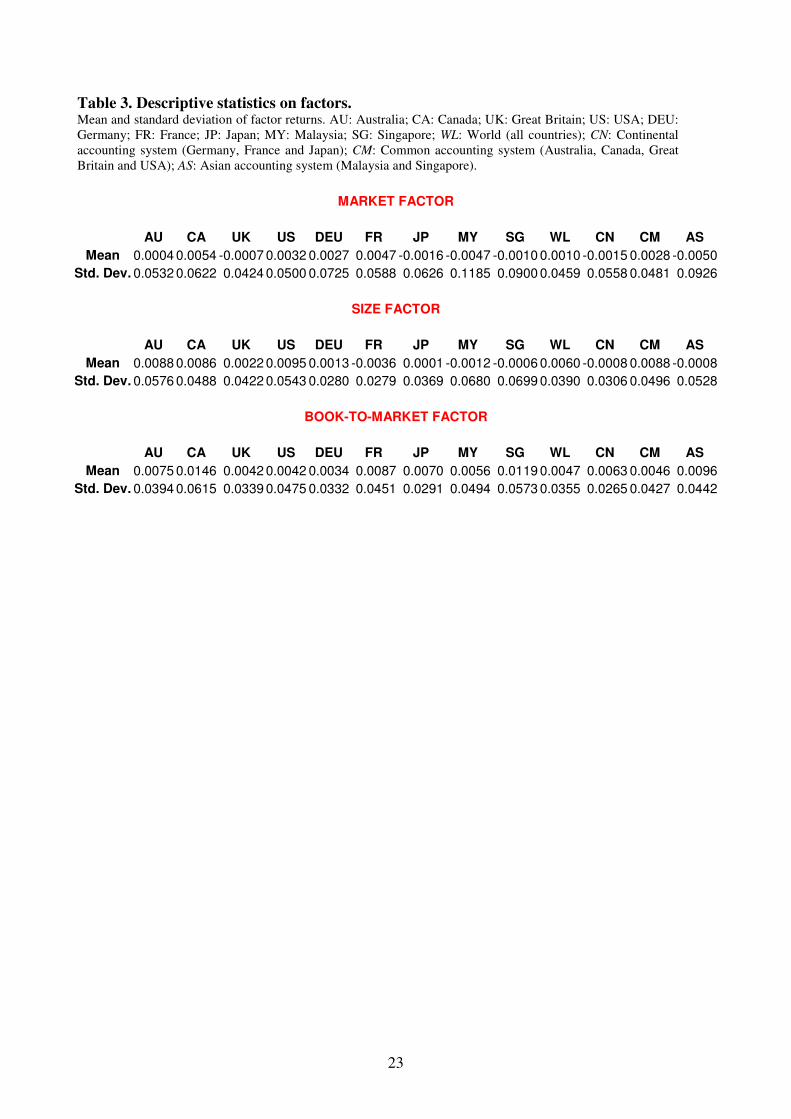
Table 3 shows descriptive statistics on the factors. Curiously, the return of BTM
factors is always positive in Country, World and accounting systems factors. The same
result is obtained by Fama-French (1998) and Griffin (2002).
10
We have also calculated equally weighted factors in order to test for robustness of the results to the
predominance of a single country. 11
Note that the German and French Size factors are not highly correlated with the Continental size factor.
A similar result holds for the Australian and the Common Size factors. In the case of BTM, we see no
correlation between the German factor and the Continental factor, and a low correlation between the
Australian and Canadian factors and the Common factor. In other words, even within the same accounting
system there may be differences in reporting practices –as we mentioned in Section 2.1- which would
affect the correlation of the country factors with the common accounting-system factor. This would
explain the differences in BTM factor and the differences of Size factors could be consequence of this
factor could not be capturing the same level of differences in Return on Assets as in USA. 12
The British influence is easy to detect in the Companies Act of 1965 for Malaysian accounting
regulation; and in the Companies Act for Singapore.

14
4.1. ACCOUNTING AND THE F-F MODEL
Griffin (2002) points out that country-specific versions of the F-F model perform
better than a world version. His world version includes data from the USA, Canada, the
UK and Japan. He mentions that these markets are likely to be integrated, but he does
not take into account the fact that Japanese accounting standards are very different from
those of the other countries in the sample. Hence, from the accounting perspective this
country is not integrated with the others. It is not surprising, then, to find a poor
performance of the world version of the model.
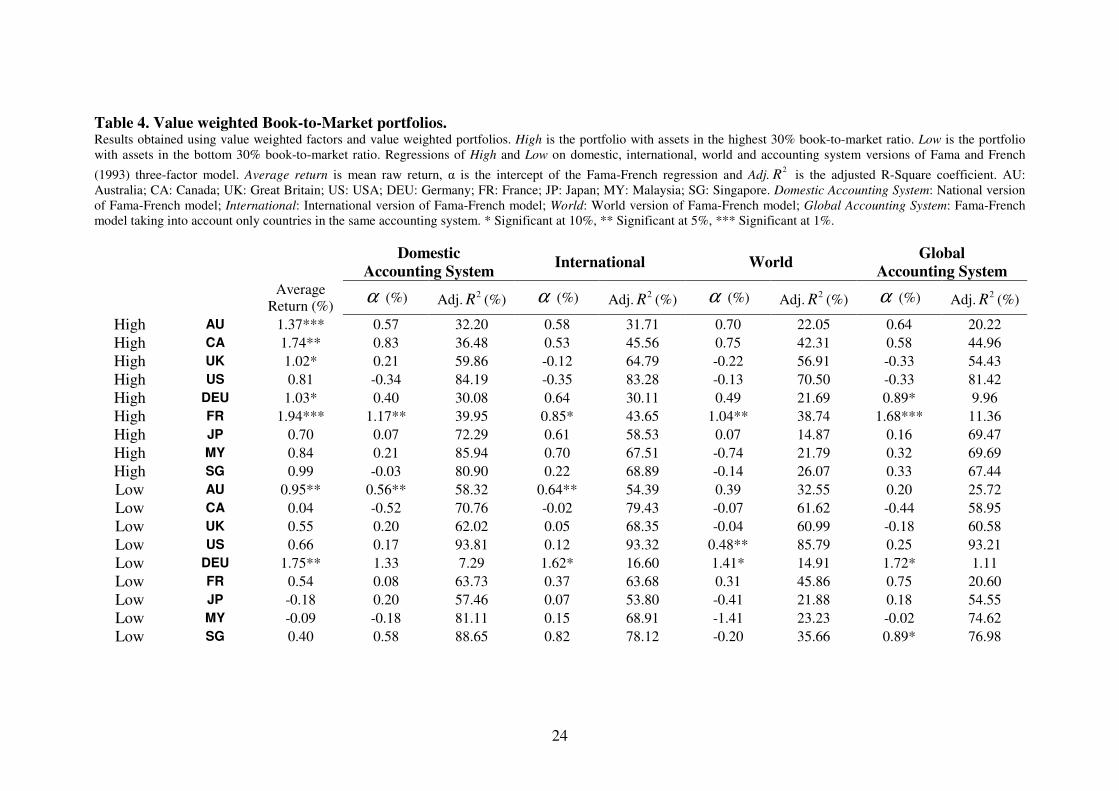
Similarly to F-F (1993) and Griffin (2002), we construct three value weighted
portfolios based on BTM ratios. The portfolio with assets in the highest 30% BTM ratio
is called High whereas the portfolio with assets in the bottom 30% is called Low. These
portfolios are recalculated monthly.
Table 4 reports the results of the pricing analysis obtained using the four
versions of the F-F model that account for the accounting homogeneity in the data.
In the case of the value-weighted factors and portfolios we see, in general, that
the International version of the model does not add value in terms of α and R² -this
version is just an extension of the Domestic setup. This result is by itself important,
since it suggests that the international factors may be redundant.
However, an important result is that a Domestic Accounting System version
performs quite well when explaining the vast majority of portfolio returns, except in the
cases of the High portfolio in France and the Low portfolio in Australia. This result is in
line with our discussion and confirms the hypotheses linking the performance of the
pricing model with the accounting homogeneity of the data. On the other hand the table
does not present evidence in favor of the Global Accounting System versus the World
version. This result could be due to the use of value-weighted portfolios: the results
could be affected by the largest firms.
Table 5 shows the results of the analysis that uses equally-weighted factors and
portfolios. Again the best version is Domestic -International does not add significant
explanatory power to Domestic. More importantly, in this case of equally-weighted
factors and portfolios, the Global Accounting System outperforms the World version. In
other words, a global version of F-F with certain accounting homogeneity is better than
a simple aggregate World version, thus suggesting that homogeneity in accounting data
is important for the validity of the model
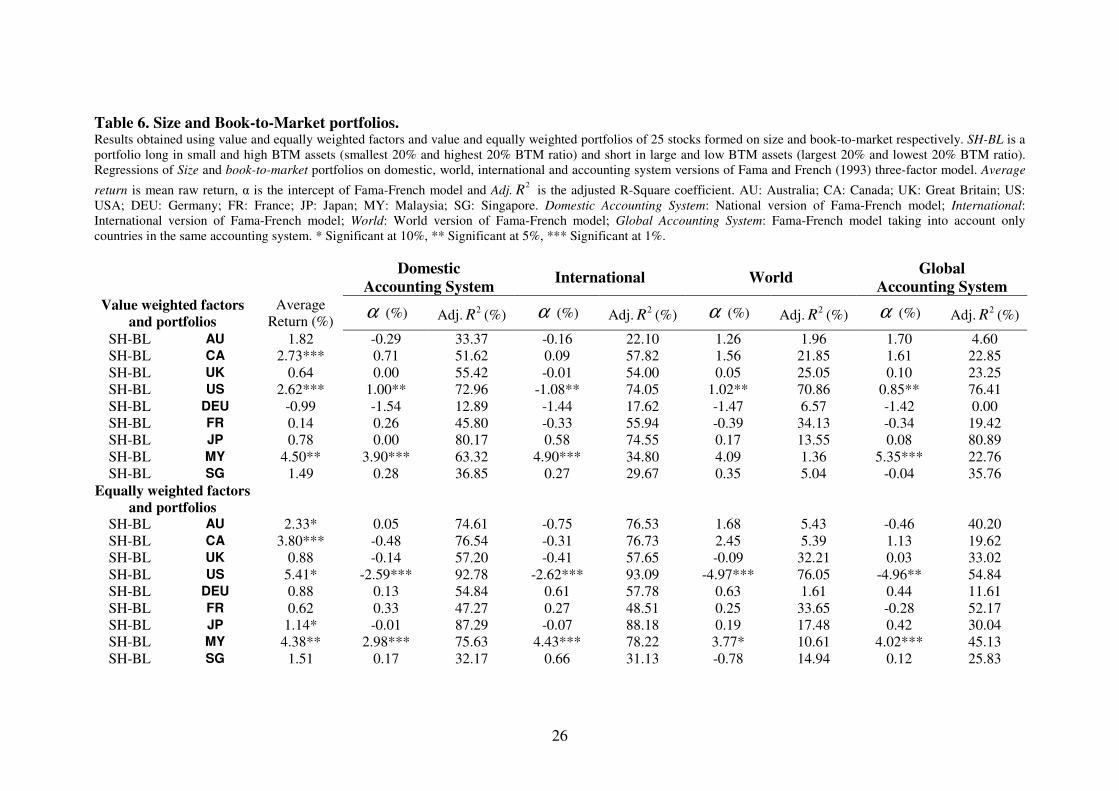
Finally, Table 6 reports the results of Size and BTM portfolios. We have
constructed 25 stock portfolios formed on size and BTM: SH-BL is a portfolio long in
the smallest 20% assets and the 20% assets with highest BTM ratio and short in the
largest 20% assets and the 20% assets with lowest BTM ratio.13
We can see that the
results of the previous tables are consistent with those of Table 6: the best pricing model
is a Domestic version. Additionally, with value-weighted portfolios we can not confirm
whether the Global Accounting System or the World version dominates, but when we
13
Results in this table for Malaysia could be influenced by the lack of stocks in the SH portfolio. This
portfolio is empty in five months of the sample period. This problem does not appear for other countries.

15
eliminate the possible size effect by creating equally-weighted portfolios it becomes
clear that Global Accounting System outperforms World.
So far the results confirm our discussion that, given the higher accounting
homogeneity, a Domestic version of a valuation model should perform the best and the
Global Accounting System version should outperform the World model. More
confirming evidence of our main point could be obtained from the analysis of data from
a group of firms from different countries that were subject to the same accounting
standards. We do this in next subsection.
4.2 Different countries with the same accounting standards: the IASB case.
The analysis of firms that follow the IASB accounting standards could give very
strong evidence in favor of accounting homogeneity as one of the main issues that
should be considered when using valuation models. If the F-F model performed well for
the IASB firms –that are subject to the same accounting system but belong to different
countries- the result would strengthen the conclusion that the accounting system
matters, and that the excellent performance of domestic versions of the model is in part
due to the relatively higher homogeneity in accounting data.
Table 7 reports the results of the pricing equations for firms following the IASB
standards. It can be seen now that the IASB Accounting System version outperforms
quite significantly the World version both in terms of α and R². In particular, the
difference between both versions of the model in terms of R² is much higher than in the
previous analyses. Furthermore, the value of R² of the IASB model is comparable –and
sometimes even higher- to those obtained from the Domestic versions of the model that
we used in the previous subsection.
We believe this last set of results to be very strong evidence in favor of
homogeneity of accounting standards as one of the main determinants of the correct
performance of international valuation models. The results also suggest that the F-F
factors may be related to risk factors that are priced in the market rather than to firm
characteristics. This last conclusion is still tentative -a formal analysis is outside of the
scope of this paper- but it suggests some potentially fruitful avenues for future research.
5. CONCLUSIONS
Accounting standards differ quite significantly across countries. These
differences, in turn, affect accounting measures of earnings or profitability and should
therefore be taken into account when considering allocation of resources at the
international level. Even within the same accounting system, there are noticeable
differences in the reporting of earnings –see our discussion in Section 2.1- which
reinforce the problem of cross-country comparisons of firm returns.
We have provided some simple intuition about the impact of accounting system
differences on the performance and validity of international valuation models. When the
reporting systems differ significantly across countries in terms of conservatism, the raw

16
comparison of accounting measures may be misleading or, at least, may reduce the
accuracy of the pricing exercises.
We focused our empirical exercise on analyzing the performance of international
versions of the Fama and French (1993) three factor model. This model is an ideal
setting for testing the relevance of the main implications of the theoretical discussion,
since the BTM factor is affected by differences in financial accounting standards. Given
the significant differences in these standards around the world, the performance of
alternative international versions of a model such as F-F should be quite informative
about the relevance of the accounting system.
Our empirical results demonstrate that the F-F model is not only country-specific
but also accounting-specific, that is, its performance depends on the accounting
homogeneity in the data. The fact that the domestic versions of the F-F model have
traditionally performed well is in line with the importance of the accounting system –
which, by definition, is uniform within a country. However, the strongest evidence
comes from the excellent performance of the F-F model for the multi-country group of
IASB firms. This result suggests that indeed accounting heterogeneity may be behind
the poor performance of international valuation models or, more positively, that
harmonization of accounting standards should improve the accuracy of valuation
models and, therefore, should contribute greatly to a more efficient allocation of
resources at the international level.
Our results open several avenues for future research. First, and mentioned
before, is the question of whether the use of correct –i.e. homogeneous in the
accounting standards- international versions of the F-F model may help study the source
of its explanatory power (risk factors versus firm characteristics). Second, our work
could be used from a more practical point of view, by looking at the implications of our
results for global asset management and estimating the necessary adjustment for
constructing portfolios in the international context. Third, changes in accounting
systems could be used as natural experiments to give improved evidence for our
conclusion. Finally, the trend towards further accounting homogeneity provides with
better testing grounds –that allow for time series analysis- for the impact of
homogeneity on international investment allocation, performance of valuation models,
etc.
17
6. REFERENCES
Ball, R., Kothari, S.P. and Robin, A. (2000) “The effect of international institutional
factors on properties of accounting earnings”, Journal of Accounting and Economics
29: 1-51.
Ball, R., Robin, A. and Wu, J.S. (2003) “Incentives versus standards: properties of
accounting in four East Asian countries”, Journal of Accounting and Economics 36:
235-270.
Bao, B., and Bao, D. (2004) “Income smoothing: Earnings quality and firm valuation”,
Journal of Business, Finance and Accounting 31 (9-10): 1525-1557.
Beaver, W.H. and Ryan, S.G. (2005) “Conditional and unconditional conservatism:
concepts and modelling”, Review of Accounting Studies 10(2-3): 269-309.
Bushman, R.M. and Piotroski, J.D. (2005) “Financial reporting incentives for
conservative accounting: The influence of legal and political institutions”, Journal of
Accounting and Economics, forthcoming.
Cao, Q, Leggio, K.B. and Schniederjans, M.J. (2005) “A comparison between Fama and
French’s model and artificial neural networks in predicting the Chinese stock
market”, Computers and Operations Research 32: 2499-2512.
Chan, L., Hamao, Y. and Lakonishok, J. (1991) “Fundamentals and stock returns in
Japan”, Journal of Finance 46: 1739–1789.
Chan, K. C., Karceski, J. and Lakonishok, J. (1998) “The risk and return from factors”,
Journal of Financial and Quantitative Analysis 33: 159–188.
Chui, A.C.W. and Wei, K.C.J. (1998) “Book-to-market, firm size, and the turn-of-the-
year effect: Evidence from Pacific-Basin emerging markets”, Pacific-Basin Finance
Journal 6: 275-293.
Daniel, K. and Titman, S. (1997) “Evidence on the characteristics of cross-sectional
variation in stock returns”, Journal of Finance 52: 1-33.
Daniel, K., Titman, S. and Wei, K.C.J. (2001) “Explaining the cross-section of stock
returns in Japan: factors or characteristics?” Journal of Finance 56: 743-766.
Ehrhardt, O. and Schmidt, M. (2003) “Managerial discretion in internal finance: a test
of pecking order and accruals management under German corporate and accounting
regulation”, Working Paper, Humboldt-University Berlin.
Faff, R. (2004) “A simple test of the Fama and French model using daily data:
Australian evidence”, Applied Financial Economics 14, 83–92.
Fama, E., and French, K. (1993) “Common Risk Factors in the Returns on Stocks and
Bonds”, Journal of Financial Economics 33: 3-56.
Fama, E. and French, K. (1995): “Size and Book-to-Market Factors in Earnings and
Returns”, The Journal of Finance 50 (1): 131-155.
Fama, E., and French, K. (1998) “Value versus Growth: The International Evidence”,
The Journal of Finance 53: 1975-1999.
García Lara, J.M., García Osma, B. and Mora, A. (2005) “The effect of earnings
management on the asymmetric timeliness of earnings”, Journal of Business,
Finance and Accounting 32(3&4): 691-726.

18
García Lara, J.M., García Osma, B. and Mora, A. (2006) “Conservative reporting and
smoothing of accounting earnings”, Working Paper, Universidad Carlos III de
Madrid.
García Lara, J.M. and Mora. A. (2004) “Balance sheet versus earnings conservatism in
Europe”, European Accounting Review 13: 261-292.
Gassen, J., Fülbier, R.U. and Sellhorn, T. (2005) “International differences in
conditional conservatism: The role of unconditional conservatism and income
smoothing”, Working Paper, Ruhr-Universität Bochum.
Gaunt, C. (2004) “Size and book to market effects and the Fama and French three factor
asset pricing model: evidence from the Australian stock market”, Accounting and
Finance 44: 27-44.
Giner, B. and Rees, W. (2001) “On the asymmetric recognition of good and bad news in
France, Germany and the United Kingdom”, Journal of Business, Finance and
Accounting 28: 1285-1331.
Griffin, J.M. (2002) “Are the Fama and French Factors Global or Country Specific?”,
The Review of Financial Studies 15: 783-803.
Harris, T.S., Lang, M. and Möller, P. (1994) “The value relevance of German
accounting measures: an empirical analysis”, Journal of Accounting Research 32:
187-209.
Kasanen, E., Kinnunen, J. and Niskanen, J. (1996) “Dividend-based earnings
management: empirical evidence from Finland”, Journal of Accounting and
Economics 22: 283-312.
Kelly, P.J. (2006) “Real and Inflationary Macroeconomic Risk in the Fama and French
Size and Book-to-Market Portfolios,” mimeo.
Lakonishok, J., Shleifer, A. and Vishny, R. (1994) “Contrarian investment,
extrapolation, and risk”, Journal of Finance 49: 1541–1578.
Lamb, M., Nobes, C.W. and Roberts, A. (1998) “International variations in the
connections between tax and financial reporting”, Accounting and Business Research
28: 173-188.
Liew, J. and Vassalou, M. (2000) “Can book-to-market, size and momentum be risk
factors that predict economic growth?” Journal of Financial Economics 57: 221–
245.
Moerman, G.A. (2005) “How domestic is the Fama-French three factor model? An
application to the Euro Area”, mimeo.
Myers, S.C. (1984) “The capital structure puzzle”, The Journal of Finance 39: 575-592.
Myers, S.C. and Majluf, N. (1984) “Corporate financing and investment decisions when
firms have information investors do not have”, Journal of Financial Economics 13:
187-221.
Pope, P.F. and Walker, M. (1999) “International differences in the timeliness,
conservatism and classification of earnings”, Journal of Accounting Research 37
(supplement): 53-87.

19
Pope, P.F. and Walker, M. (2003) “Ex-ante and ex-post accounting conservatism, asset
recognition and asymmetric earnings timeliness”, Working Paper, Lancaster
University and The University of Manchester.
Raonic, I., Mcleay, S.J. and Asimakopoulos, I. (2004) “The timeliness of income
recognition by European companies: an analysis of institutional and market
complexity”, Journal of Business Finance and Accounting 31: 115-148.
Seckler, G. (1998) “Germany”, in Alexander, A. and Archer, S. (eds.), European
Accounting Guide (3rd
ed., Harcourt Brace).

20
Appendix: Derivation of Book Value for firm B (taking into account inflation)
( ) ( ) ( )( ) ( ) ( )( )0 0
1 1
t t
t B B B B
i i
BE B C EI i D i C I i DP i= =
= + − = + − =∑ ∑
( )( ) ( ) ( ) ( )1 2
0 1 1 2 1 1 1 2 1
1 2
1 ( ) 1t t
i i
i i
C K a a g a a gδ ρ δ ρ− −
= =
= + − − − + + + − + =∑ ∑
( ) ( ) ( )( ) ( ) ( )( )1 2
1 1 2 1 1 1 2 1
1 2
1 1t t
i i
t
i i
BE A a a g a a gδ ρ δ ρ− −
= =
= − + − + + + − + =∑ ∑
( ) ( )( ) ( )( ) ( )
( )( )( ) ( )
1
1 1 2 1 1 1 2 1
2
1
1 1 2 1
2
1
11
1
ti
t
i
ti
i
BE A a a a a g
a a gg
δ ρ δ ρ
δ ρ
−
=
−
=
= − + − − + − +
+ + − + =+
∑
∑
( ) ( ) ( ) ( )( )( )( )
1
1 1 2 1 1 1 2 1
2
11 1
1
ti
t
i
BE A a a a a gg
δ ρ δ ρ−
=
= − + − + + − + − =
+ ∑
( ) ( ) ( )( )( )
( )( )
11 1 2 1
1 1 2 1
2
11
ti
t
i
g a aBE A a a g
g
δ ρδ ρ
−
=
+ −= − + − − + =
+∑
( ) ( ) ( )( )( )
( )( ) ( )1 1 2 1
1 1 2 1
1 1
1
t
t
g a a g gBE A a a
g g
δ ρδ ρ
+ − + − += − + − − =
+
( ) ( ) ( ) ( )( ) ( )1
1 1 2 1 1 1 2 1 1 1t
tBE A a a a a gδ ρ δ ρ− = − + − − + − + − =
( ) ( )( ) ( )1
1 1 2 1 1t
tBE A a a gδ ρ− = − + − +

21
Table 1. Descriptive statistics and weights. Panel A reports some characteristics of the firms in the sample. Firms: Monthly average number of firms in the
sample; Size: Mean market value per firm in million US dollars; BM: Mean Book-to-Market per firm; AU:
Australia; CA: Canada; UK: Great Britain; US: USA; DEU: Germany; FR: France; JP: Japan; MY: Malaysia;
SG: Singapore. Panel B reports weights of countries in factors construction. The weights are expressed in
percentage of market value and they are monthly averages values. WL: Weights of each country in world
factors (all countries); CN: Weights of each country in continental factors. Continental countries in the sample
are Germany, France and Japan; CM: Weights of each country in common factors. Common countries in the
sample are Australia, Canada, Great Britain and USA; AS: Weights of each country in Asian factors. Asian
countries in the sample are Malaysia and Singapore.
Panel A: Descriptive statistics
AU CA UK US DEU FR JP MY SG
Firms 227.83 279.48 435.27 1,710.62 252.62 378.05 2,429.09 311.27 178.92
Size 628.32 1,245.44 1,954.03 4,200.98 575.28 1,044.71 979.21 196.11 371.44
BM 0.89 0.91 0.84 0.66 0.88 0.99 1.27 1.11 1.26
Panel B: Weights of countries
AU CA UK US DEU FR JP MY SG
WL 1.19% 3.05% 7.45% 63.24% 1.25% 3.35% 19.47% 0.46% 0.54%
CN - - - - 5.62% 15.26% 79.12% - -
CM 1.60% 4.06% 9.97% 84.36% - - - - -
AS - - - - - - - 44.12% 55.88%

22
Table 2. Factor Correlations. Factor correlations by country and accounting system. AU: Australia; CA: Canada; UK: Great Britain;
US: USA; DEU: Germany; FR: France; JP: Japan; MY: Malaysia; SG: Singapore; WL: World (all
countries); CN: Continental accounting system (Germany, France and Japan); CM: Common accounting
system (Australia, Canada, Great Britain and USA); AS: Asian accounting system (Malaysia and
Singapore).
MARKET FACTOR
AU CA UK US DEU FR JP MY SG WL CN CM AS
AU 1.00
CA 0.69 1.00
UK 0.62 0.64 1.00
US 0.64 0.81 0.76 1.00
DEU 0.59 0.65 0.75 0.73 1.00
FR 0.60 0.69 0.80 0.72 0.90 1.00
JP 0.58 0.52 0.41 0.45 0.30 0.36 1.00
MY 0.29 0.40 0.26 0.30 0.29 0.29 0.22 1.00
SG 0.60 0.57 0.48 0.56 0.41 0.41 0.41 0.59 1.00
WL 0.73 0.84 0.81 0.95 0.75 0.77 0.67 0.34 0.59 1.00
CN 0.66 0.62 0.56 0.57 0.50 0.56 0.97 0.27 0.45 0.78 1.00
CM 0.67 0.83 0.80 1.00 0.75 0.75 0.47 0.31 0.58 0.96 0.59 1.00
AS 0.51 0.54 0.42 0.48 0.39 0.40 0.36 0.89 0.89 0.52 0.41 0.49 1.00
SIZE FACTOR
AU CA UK US DEU FR JP MY SG WL CN CM AS
AU 1.00
CA 0.24 1.00
UK 0.28 0.51 1.00
US 0.11 0.61 0.49 1.00
DEU 0.09 0.17 0.16 0.11 1.00
FR 0.21 0.51 0.36 0.32 0.23 1.00
JP -0.01 0.16 0.17 0.12 0.07 0.12 1.00
MY 0.01 0.25 0.06 0.14 0.02 0.02 0.30 1.00
SG -0.01 0.09 0.18 0.07 0.13 0.11 0.38 0.08 1.00
WL 0.15 0.66 0.57 0.97 0.14 0.39 0.31 0.20 0.16 1.00
CN 0.02 0.23 0.21 0.17 0.14 0.27 0.98 0.29 0.39 0.36 1.00
CM 0.16 0.65 0.56 1.00 0.12 0.35 0.13 0.15 0.09 0.98 0.18 1.00
AS -0.01 0.20 0.16 0.13 0.11 0.10 0.46 0.58 0.85 0.23 0.46 0.15 1.00
BOOK-TO-MARKET
AU CA UK US DEU FR JP MY SG WL CN CM AS
AU 1.00
CA 0.16 1.00
UK 0.24 0.39 1.00
US 0.26 0.31 0.40 1.00
DEU 0.03 0.23 0.05 0.08 1.00
FR 0.01 0.24 0.20 0.42 -0.16 1.00
JP 0.22 0.12 0.27 0.30 -0.03 0.33 1.00
MY -0.02 0.00 0.08 -0.11 0.12 -0.10 -0.08 1.00
SG 0.16 0.15 0.26 0.30 0.10 0.09 0.12 0.20 1.00
WL 0.29 0.34 0.48 0.97 0.09 0.48 0.47 -0.11 0.32 1.00
CN 0.20 0.18 0.29 0.40 0.00 0.56 0.96 -0.08 0.13 0.57 1.00
CM 0.29 0.38 0.48 0.99 0.09 0.43 0.31 -0.10 0.32 0.98 0.41 1.00
AS 0.10 0.14 0.25 0.20 0.15 0.04 0.07 0.65 0.87 0.22 0.07 0.22 1.00
23
Table 3. Descriptive statistics on factors. Mean and standard deviation of factor returns. AU: Australia; CA: Canada; UK: Great Britain; US: USA; DEU:
Germany; FR: France; JP: Japan; MY: Malaysia; SG: Singapore; WL: World (all countries); CN: Continental
accounting system (Germany, France and Japan); CM: Common accounting system (Australia, Canada, Great
Britain and USA); AS: Asian accounting system (Malaysia and Singapore).
MARKET FACTOR
AU CA UK US DEU FR JP MY SG WL CN CM AS
Mean 0.0004 0.0054 -0.0007 0.0032 0.0027 0.0047 -0.0016 -0.0047 -0.0010 0.0010 -0.0015 0.0028 -0.0050
Std. Dev. 0.0532 0.0622 0.0424 0.0500 0.0725 0.0588 0.0626 0.1185 0.0900 0.0459 0.0558 0.0481 0.0926
SIZE FACTOR
AU CA UK US DEU FR JP MY SG WL CN CM AS
Mean 0.0088 0.0086 0.0022 0.0095 0.0013 -0.0036 0.0001 -0.0012 -0.0006 0.0060 -0.0008 0.0088 -0.0008
Std. Dev. 0.0576 0.0488 0.0422 0.0543 0.0280 0.0279 0.0369 0.0680 0.0699 0.0390 0.0306 0.0496 0.0528
BOOK-TO-MARKET FACTOR
AU CA UK US DEU FR JP MY SG WL CN CM AS
Mean 0.0075 0.0146 0.0042 0.0042 0.0034 0.0087 0.0070 0.0056 0.0119 0.0047 0.0063 0.0046 0.0096
Std. Dev. 0.0394 0.0615 0.0339 0.0475 0.0332 0.0451 0.0291 0.0494 0.0573 0.0355 0.0265 0.0427 0.0442
24
Table 4. Value weighted Book-to-Market portfolios. Results obtained using value weighted factors and value weighted portfolios. High is the portfolio with assets in the highest 30% book-to-market ratio. Low is the portfolio
with assets in the bottom 30% book-to-market ratio. Regressions of High and Low on domestic, international, world and accounting system versions of Fama and French
(1993) three-factor model. Average return is mean raw return, α is the intercept of the Fama-French regression and Adj.2
R is the adjusted R-Square coefficient. AU:
Australia; CA: Canada; UK: Great Britain; US: USA; DEU: Germany; FR: France; JP: Japan; MY: Malaysia; SG: Singapore. Domestic Accounting System: National version
of Fama-French model; International: International version of Fama-French model; World: World version of Fama-French model; Global Accounting System: Fama-French
model taking into account only countries in the same accounting system. * Significant at 10%, ** Significant at 5%, *** Significant at 1%.
Domestic
Accounting System International World
Global
Accounting System
Average
Return (%) α (%) Adj.
2R (%) α (%) Adj.2R (%) α (%) Adj.
2R (%) α (%) Adj.2R (%)
High AU 1.37*** 0.57 32.20 0.58 31.71 0.70 22.05 0.64 20.22
High CA 1.74** 0.83 36.48 0.53 45.56 0.75 42.31 0.58 44.96
High UK 1.02* 0.21 59.86 -0.12 64.79 -0.22 56.91 -0.33 54.43
High US 0.81 -0.34 84.19 -0.35 83.28 -0.13 70.50 -0.33 81.42
High DEU 1.03* 0.40 30.08 0.64 30.11 0.49 21.69 0.89* 9.96
High FR 1.94*** 1.17** 39.95 0.85* 43.65 1.04** 38.74 1.68*** 11.36
High JP 0.70 0.07 72.29 0.61 58.53 0.07 14.87 0.16 69.47
High MY 0.84 0.21 85.94 0.70 67.51 -0.74 21.79 0.32 69.69
High SG 0.99 -0.03 80.90 0.22 68.89 -0.14 26.07 0.33 67.44
Low AU 0.95** 0.56** 58.32 0.64** 54.39 0.39 32.55 0.20 25.72
Low CA 0.04 -0.52 70.76 -0.02 79.43 -0.07 61.62 -0.44 58.95
Low UK 0.55 0.20 62.02 0.05 68.35 -0.04 60.99 -0.18 60.58
Low US 0.66 0.17 93.81 0.12 93.32 0.48** 85.79 0.25 93.21
Low DEU 1.75** 1.33 7.29 1.62* 16.60 1.41* 14.91 1.72* 1.11
Low FR 0.54 0.08 63.73 0.37 63.68 0.31 45.86 0.75 20.60
Low JP -0.18 0.20 57.46 0.07 53.80 -0.41 21.88 0.18 54.55
Low MY -0.09 -0.18 81.11 0.15 68.91 -1.41 23.23 -0.02 74.62
Low SG 0.40 0.58 88.65 0.82 78.12 -0.20 35.66 0.89* 76.98

25
Table 5. Equally weighted Book-to-Market portfolios. Results obtained using equally weighted factors and equally weighted portfolios. High is the portfolio with assets in the highest 30% book-to-market ratio. Low is the portfolio
with assets in the bottom 30% book-to-market ratio. Regressions of High and Low on domestic, international, world and accounting system versions of of Fama and French
(1993) three-factor model. Average return is mean raw return, α is the intercept of Fama-French model and Adj.2
R is the adjusted R-Square coefficient. AU: Australia; CA:
Canada; UK: Great Britain; US: USA; DEU: Germany; FR: France; JP: Japan; MY: Malaysia; SG: Singapore. Domestic Accounting System: National version of Fama-French
model; International: International version of Fama-French model; World: World version of Fama-French model; Global Accounting System: Fama-French model taking into
account only countries in the same accounting system. * Significant at 10%, ** Significant at 5%, *** Significant at 1%.
Domestic
Accounting System International World
Global
Accounting System
Average
Return (%) α (%) Adj.
2R (%) α (%) Adj.2R (%) α (%) Adj.
2R (%) α (%) Adj.2R (%)
High AU 2.24*** 0.64** 77.60 0.45 79.02 1.60** 3.08 0.34 36.95
High CA 2.58*** 0.32 77.55 0.42 78.00 1.65** 29.03 0.65 37.40
High UK 1.38*** 0.43 39.44 0.33 52.90 0.65 42.49 0.04 41.92
High US 3.10*** -0.14 94.44 0.13 94.70 -0.11 80.54 -0.80 63.35
High DEU 0.98* 0.21 74.09 0.43 76.94 0.47 24.08 0.36 39.47
High FR 1.75*** 1.22*** 47.40 1.05*** 50.79 1.47*** 25.54 1.20*** 44.23
High JP 0.58 -0.08 61.19 -0.35 62.70 -0.14 11.01 0.12 20.71
High MY 0.71 -0.09 85.38 -0.38 86.92 -1.78 41.69 -0.16 72.06
High SG 1.15 0.20 83.74 0.29 84.04 -0.93 52.69 0.37 68.44
Low AU 1.22* 0.35 85.43 0.29 85.82 1.21* 18.74 0.00 40.31
Low CA 0.59 0.18 76.85 0.20 77.44 0.31 64.14 -0.27 55.27
Low UK 0.75 0.42 66.23 0.33 73.13 0.51 62.70 -0.11 55.04
Low US 1.12 -0.17 90.05 0.05 90.11 0.92** 76.61 0.13 77.80
Low DEU 0.41 0.10 44.54 0.34 50.61 0.31 30.28 0.37 36.31
Low FR 0.84 1.27*** 76.84 1.08*** 78.45 0.89 54.34 1.45*** 66.53
Low JP -0.16 -0.14 55.12 -0.40 56.72 -0.48 12.48 -0.17 22.44
Low MY 0.22 -0.18 82.71 -0.38 84.31 -1.77 41.13 -0.04 74.77
Low SG 0.31 0.24 80.70 0.29 81.13 -0.71 51.72 0.19 64.16
26
Table 6. Size and Book-to-Market portfolios. Results obtained using value and equally weighted factors and value and equally weighted portfolios of 25 stocks formed on size and book-to-market respectively. SH-BL is a
portfolio long in small and high BTM assets (smallest 20% and highest 20% BTM ratio) and short in large and low BTM assets (largest 20% and lowest 20% BTM ratio).
Regressions of Size and book-to-market portfolios on domestic, world, international and accounting system versions of Fama and French (1993) three-factor model. Average
return is mean raw return, α is the intercept of Fama-French model and Adj.2
R is the adjusted R-Square coefficient. AU: Australia; CA: Canada; UK: Great Britain; US:
USA; DEU: Germany; FR: France; JP: Japan; MY: Malaysia; SG: Singapore. Domestic Accounting System: National version of Fama-French model; International:
International version of Fama-French model; World: World version of Fama-French model; Global Accounting System: Fama-French model taking into account only
countries in the same accounting system. * Significant at 10%, ** Significant at 5%, *** Significant at 1%.
Domestic
Accounting System International World
Global
Accounting System Value weighted factors
and portfolios
Average
Return (%) α (%) Adj.
2R (%) α (%) Adj.2R (%) α (%) Adj.
2R (%) α (%) Adj.2R (%)
SH-BL AU 1.82 -0.29 33.37 -0.16 22.10 1.26 1.96 1.70 4.60
SH-BL CA 2.73*** 0.71 51.62 0.09 57.82 1.56 21.85 1.61 22.85
SH-BL UK 0.64 0.00 55.42 -0.01 54.00 0.05 25.05 0.10 23.25
SH-BL US 2.62*** 1.00** 72.96 -1.08** 74.05 1.02** 70.86 0.85** 76.41
SH-BL DEU -0.99 -1.54 12.89 -1.44 17.62 -1.47 6.57 -1.42 0.00
SH-BL FR 0.14 0.26 45.80 -0.33 55.94 -0.39 34.13 -0.34 19.42
SH-BL JP 0.78 0.00 80.17 0.58 74.55 0.17 13.55 0.08 80.89
SH-BL MY 4.50** 3.90*** 63.32 4.90*** 34.80 4.09 1.36 5.35*** 22.76
SH-BL SG 1.49 0.28 36.85 0.27 29.67 0.35 5.04 -0.04 35.76
Equally weighted factors
and portfolios
SH-BL AU 2.33* 0.05 74.61 -0.75 76.53 1.68 5.43 -0.46 40.20
SH-BL CA 3.80*** -0.48 76.54 -0.31 76.73 2.45 5.39 1.13 19.62
SH-BL UK 0.88 -0.14 57.20 -0.41 57.65 -0.09 32.21 0.03 33.02
SH-BL US 5.41* -2.59*** 92.78 -2.62*** 93.09 -4.97*** 76.05 -4.96** 54.84
SH-BL DEU 0.88 0.13 54.84 0.61 57.78 0.63 1.61 0.44 11.61
SH-BL FR 0.62 0.33 47.27 0.27 48.51 0.25 33.65 -0.28 52.17
SH-BL JP 1.14* -0.01 87.29 -0.07 88.18 0.19 17.48 0.42 30.04
SH-BL MY 4.38** 2.98*** 75.63 4.43*** 78.22 3.77* 10.61 4.02*** 45.13
SH-BL SG 1.51 0.17 32.17 0.66 31.13 -0.78 14.94 0.12 25.83

27
Table 7. Firms following IASB standards. Results obtained for firms around the world that use IASB standards. Value weighted: Results using value
weighted factors and value weighted portfolios; Equally weighted: Results using equally weighted factors
and equally weighted portfolios; High: Portfolio with assets in the highest 30% book-to-market ratio;
Low: Portfolio with assets in the bottom 30% book-to-market ratio; SH-BL is a portfolio long in small and
high BTM assets (smallest 20% and highest 20% BTM ratio) and short in large and low BTM assets
(largest 20% and lowest 20% BTM ratio). World: World version of Fama-French model; IASB
Accounting System: Fama-French considering only firms following the IAS/IFRS standards. * Significant
at 10%, ** Significant at 5%, *** Significant at 1%.
World
IASB
Accounting System
Average
Return (%) α (%) Adj.
2R (%) α (%) Adj.2R (%)
High 1.21 0.19 31.40 0.25 79.73 Value
weighted Low 0.46 -0.22 34.23 -0.02 87.44
High 1.50** 0.57 17.67 -0.11 94.15 Equally
weighted Low 0.54 0.13 42.79 -0.24 94.18
Value
weighted SH-BL 1.36 0.57 14.28 0.20 41.83
Equally
weighted SH-BL 1.29* 0.41 17.37 0.33 66.46