the influence of flow and turbulence on flame propagation through dust-air mixtures
TRANSCRIPT

Journal of Loss Prevention in the Process Industries 13 (2000) 291–298www.elsevier.com/locate/jlp
The influence of flow and turbulence on flame propagation throughdust-air mixtures
Ulrich Krause*, Thomas KaschFederal Institute for Materials Research and Testing (BAM), Laboratory II.12, Unter den Eichen 87, Dust Fires and Explosions, D-12200
Berlin, Germany
Abstract
Dust explosions are time-dependent flame propagation processes. Their description with “lumped parameter models” like theKSt
value are of limited validity only. More evidence of the process of flame propagation may be expected from an investigation ofthe flame velocity being composed by the laminar and turbulent velocities and the flow velocity. In the present paper the influencesof the dust concentration and the flow velocity have been investigated by experiments in tube apparatus of three different diametersshowing the dominating influence of the flow velocity and the turbulent rms velocity on the flame propagation.
In addition, laminar and turbulent flame propagation has been investigated by an appropriate numerical model. Furthermore flowstructures and particle distributions have been computed in a real size grain silo to assess the effects of possible explosions.2000 Elsevier Science Ltd. All rights reserved.
Keywords:Dust-air mixtures; Flame propagation; Turbulence; Numerical modelling; Explosion venting
1. Introduction
The behaviour of flames propagating through dust–airmixtures depends on a number of successive steps of theoxidation process of the combustible fraction:
O devolatilization of the volatile fraction of the solidfuel,
O mixing of the volatiles with oxygen in the gas phase,O combustion of the volatiles,O combustion of the remaining solid fraction (mostly
char).
It is sometimes not clear, which of these steps deter-mines the rate of the combustion reaction. However, it isevident, that the combustion of solid particles is mainlyinfluenced by the conditions of the mass transfer withinthe vicinity of the reaction zone and therefore by theflow field.
On the other hand, burning velocities of fuel–air mix-tures are often used to characterise the reactivity of fuel–
* Corresponding author. Tel:+49-30-8104-3412; fax:+49-30-8104-127.
E-mail address:[email protected] (U. Krause).
0950-4230/00/$ - see front matter 2000 Elsevier Science Ltd. All rights reserved.PII: S0950-4230 (99)00062-5
air mixtures. In distinction to other explosion para-meters, e.g.KG or KSt, burning velocities show theadvantage to emphasise the influence of flow velocitieson the flame propagation process.
Burning velocities are usually defined for laminar andturbulent flame propagation, while the turbulent burningvelocity is pd, a combination of the laminar burningvelocity (LBV) and the turbulent fluctuation velocity.Therefore a proper determination of the LBV is neces-sary to find valid models for the turbulent burning velo-city.
2. Influence of the flow velocity on the flamevelocity
2.1. Laminar flame propagation
For fuel gas–air mixtures the LBV can be obtained asthe eigenvalue of the mass, species and energy balancesin the reaction zone, see Williams (1965). The systemof balance equations is, however, based on the heattransfer by conduction and on the homogeneity of thereactive system. (In a strict sense transport coefficientslike the thermal conductivity and the specific heatcapacity are defined for an isotropic structure only). This

292 U. Krause, T. Kasch / Journal of Loss Prevention in the Process Industries 13 (2000) 291–298
is not applicable for dust–air mixtures. Therefore for aheterogeneous system the LBV is not in the same waya fundamental parameter as for gas systems.
In spite of this, modelling of flame propagationthrough dust–air mixtures may be based on the LBV, ifthe LBV itself and their dependence on the flow velocity,the geometry and material properties can be determinedexperimentally. Different methods of the determinationof LBV’s for dust–air mixtures were discussed in a pre-vious paper (Krause, Kasch & Gebauer, 1996), includingresults for three different powder substances and a com-parison with literature data. It was found, that the lami-nar burning velocities of dust–air mixtures neverexceeded a value of 1 m/s. Table 1 shows laminar burn-ing velocities of dust–air mixtures published in the litera-ture.
For details of the experimental investigation of LBV’sby the tube method see Andrews and Bradley (1972).The experimental set-up used for the for the investi-gations of the present authors was described in detail inKrause et al. (1996). However, details of the determi-nation of LBV’s are not discussed in the current paper.The main point we focus on here is that the laminarburning velocities allow a ranking of the substancesaccording to their reactivity, while the flame velocitiesobserved are in the same range. Fig. 1 shows a compari-son of flame velocities and laminar burning velocitiesobtained in a vertical tube apparatus of 2 m in lengthand 100 mm in diameter (for details see Krause et al.,1996) at Reynolds numbers of approximately 2000 andfor three different dusts. The flame propagated upwardswith the flow. For lycopodium powder and for corn-starch at this value of Re, flame velocities of about 8
Table 1Laminar burning velocities of lycopodium and cornstarch
Reference Method Concentration g/m3 SL m/s
a) LycopodiumProust and Veyssie`re (1988) Square duct, 200×200 mm 35–100 0.47Glinka, Wang, Wolanski and Xie (1996) Cyl. tube,d=160 mm 35–200 0.69Glinka et al. (1996) Square duct, 80×80 mm 30–230 0.47van der Wel (1993) Burner 150–450 0.3van der Wel (1993) 20 Litres sphere 1000 0.17Kaesche-Krischer (1959) Burner 180–500 0.25Pedersen and van Wingerden (1995) Cyl. tube,d=128 mm 50–175 0.41Krause et al. (1996) Cyl. tube,d=60 mm 160–710 0.28Krause et al. (1996) Cyl. tube,d=100 mm 180–635 0.5b) CornstarchProust (1993) Square duct, 200×200 mm 50–250 0.26van der Wel (1993) Burner 400–800 0.20van der Wel (1993) 20 Litres sphere 400 0.13Mazurkiewicz and Jarosinski (1991) Square duct, 50×50 mm Not specified 0.13Mazurkiewicz and Jarosinski (1994) Burner 260–760 0.14Pedersen and van Wingerden (1995) Cyl. tube,d=128 mm 75–200 0.59Krause et al. (1996) Cyl. tube,d=60 mm 370–1200 0.22Krause et al. (1996) Cyl. tube,d=100 mm 80–430 0.40
m/s had been observed at concentrations of roughlytwice stoichiometric.
For wheat flour it was impossible to disperse a dustcloud at concentrations above stoichiometric. Thereforethe “optimum” concentration could not be reached.However, within the range of concentration obtained, thesame flame velocities of about 5 m/s were observed asfor cornstarch.
It may be summarised, that for the three substancesinvestigated the most violent flames occurred at Reyn-olds numbers between 1600 and 2300 and at concen-trations about twice stoichiometric (except for wheatflour). In addition, substances of different reactivity(measured in terms of the LBV) may undergo explosionsof comparable violence (measured in terms of the flamevelocity) at suitable flow conditions.
2.2. Turbulent flame propagation
Turbulent flame propagation was studied in a verticalcylindrical tube of 2 m in length and 300 mm in diametershown in Fig. 2. Dust was layered on a porous filter plateand elutriated in a fluidized bed at the beginning of eachexperiment. An air flow of controllable flow rate wasused to smoothly disperse a dust cloud within the tube.After dispersion the dust cloud was ignited by a high-voltage electrical spark located 0.5 m above the closedend and a few centimetres above the concentrationmeasurement probes (infrared light attenuation probes).At this diameter the critical Re number of 2300 isreached already at a flow velocity of 0.12 m/s.
Flow velocities and rms values of the turbulent fluc-tuation velocity were measured by a cluster of hot wire

293U. Krause, T. Kasch / Journal of Loss Prevention in the Process Industries 13 (2000) 291–298
Fig. 1. Flame velocitiesSfl and laminar burning velocitiesSL of three different dust–air mixtures at Re=2000 in the 100 mm tube apparatus.
Fig. 2. Experimental set-up for the investigation of flame propagationthrough dust–air mixtures in dependence on the flow velocity and thedust concentration.
anemometers in preceding experiments with a non-reacting dust-free flow, where it had to be assumed thatthe particles have low inertia and do not effect the turbu-lence field.
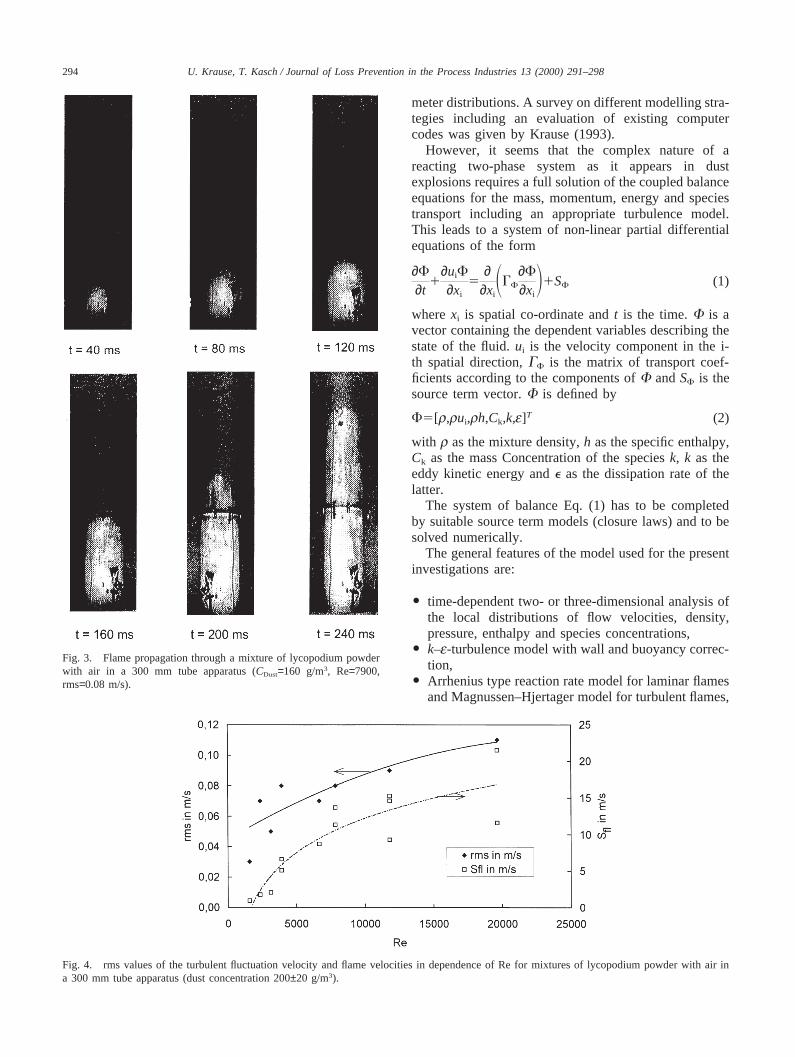
Fig. 3 shows successive frames of the flame propa-gation through a mixture of lycopodium powder with airin the 300 mm tube at a dust concentration of about 160g/m3 and Re=7900. The corresponding rms value is 0.08m/s. It is interesting to note that although the current Reis three times higher than Recrit=2300 and the rms valueof the turbulent fluctuation velocity is about 20% of theflow velocity, the flame shape is still nearly unwrinkled.
Fig. 4 depicts the dependence of the rms of the turbu-lent fluctuation velocity and of the average flame velo-city from Re. The curves given in Fig. 4 are polynomialfits to the experimental values. As visible, both the rmsvalues and the flame velocities increase with Re. Themaximum value for the flame velocity measured in the300 mm tube was 21.5 m/s at Re=20000 and a dust con-centration of approximately 200 g/m3, which was foundto be the “optimum” concentration for lycopodium pow-der.
In addition a considerable flame acceleration along thetube axis could be observed in most of the experiments.The flame velocity increased for a factor of up to 10between the ignitor and the upper end of the tube.
3. Numerical simulations
3.1. Model validation with lab-scale tests
There is general agreement that the long-term solutionfor a variety of problems in dust explosion protectionis computer modelling (see Eckhoff, 1991; Schumann,Rastogi, Fucke & Friehmelt, 1997; van Wingerden,1996). Several attempts have been made in the past tomodel dust explosions ranging from simple empiricalcorrelations, multi-zone models with integral balanceequations to three-dimensional models for the local para-
294 U. Krause, T. Kasch / Journal of Loss Prevention in the Process Industries 13 (2000) 291–298
Fig. 3. Flame propagation through a mixture of lycopodium powderwith air in a 300 mm tube apparatus (CDust=160 g/m3, Re=7900,rms=0.08 m/s).
Fig. 4. rms values of the turbulent fluctuation velocity and flame velocities in dependence of Re for mixtures of lycopodium powder with air ina 300 mm tube apparatus (dust concentration 200±20 g/m3).
meter distributions. A survey on different modelling stra-tegies including an evaluation of existing computercodes was given by Krause (1993).
However, it seems that the complex nature of areacting two-phase system as it appears in dustexplosions requires a full solution of the coupled balanceequations for the mass, momentum, energy and speciestransport including an appropriate turbulence model.This leads to a system of non-linear partial differentialequations of the form
∂F
∂t1
∂uiF
∂xi
5∂
∂xiSGF
∂F
∂xiD1SF (1)
wherexi is spatial co-ordinate andt is the time.F is avector containing the dependent variables describing thestate of the fluid.ui is the velocity component in the i-th spatial direction,GF is the matrix of transport coef-ficients according to the components ofF andSF is thesource term vector.F is defined by
F5[r,rui,rh,Ck,k,e]T (2)
with r as the mixture density,h as the specific enthalpy,Ck as the mass Concentration of the speciesk, k as theeddy kinetic energy ande as the dissipation rate of thelatter.
The system of balance Eq. (1) has to be completedby suitable source term models (closure laws) and to besolved numerically.
The general features of the model used for the presentinvestigations are:
O time-dependent two- or three-dimensional analysis ofthe local distributions of flow velocities, density,pressure, enthalpy and species concentrations,
O k–e-turbulence model with wall and buoyancy correc-tion,
O Arrhenius type reaction rate model for laminar flamesand Magnussen–Hjertager model for turbulent flames,

295U. Krause, T. Kasch / Journal of Loss Prevention in the Process Industries 13 (2000) 291–298
O multiple-step solid phase reaction models includingdevolatilization, gas-phase mixing and combustionand char combustion.
All models applied are contained in a commercialcomputer code FLUENT4, which was used for thenumerical simulations reported. The system of balanceequations is described in detail in FLUENT (1995).
The first test example was laminar flame propagationthrough a mixture of lycopodium powder with air in avertical tube of 2 m in length and 100 mm in diametercorresponding to the experiments reported in Section2.1. The computations were at first intended to provewhether the dependence of the LBV on the parametersmentioned is mirrored by the model.
The model assumptions for this case were a time-dependent two-dimensional laminar flow, particles withnegligible inertia and ignition near the closed end. It was
Fig. 5. Comparison of experimental and calculated flame velocities and LBV’s of lycopodium–air mixtures as a function of the dust concentration(Re=2000) and on Re (Cdust=200±20 g/m3).
further assumed, that during devolatilization mainly pro-pane is released at an amount equivalent to the volatilecontent of the solid and combusted in the gas-phase.
Fig. 5 shows a comparison of experimental and com-puted LBV’s in a tube apparatus with 100 mm in diam-eter and 2 m in length. It is worth noting that the depen-dence of the LBV on the dust concentration and on Refound experimentally are mirrored by the computations.Considering the complex coupling of flow and chemis-try, which leads to a strong non-linearity of the equationsystem (the source terms are functions of the dependentvariables) the coincidence of experimental and computedvalues is surprisingly good.
In general, the computed values of the LBV are some-what higher than the experimental ones due to the ideal-ised conditions in the computations.

296 U. Krause, T. Kasch / Journal of Loss Prevention in the Process Industries 13 (2000) 291–298
3.2. Cold flow simulation in technical equipment
The simulation of the time-dependent evolution ofdust explosions in complex, three-dimensional geo-metries including as many effects like turbulence andchemical reactions as possible, is just the beginning.However, it is worth noting, that already a “cold flow”simulation may provide valuable information for theestimation of possible effects of an explosion.
This can be demonstrated with the computation of theflow and turbulence fields and the particle distributionin a full-scale silo, which was used by Gerhold, Hattwigand Hieronymus (1999) for a series of dust explosionexperiments in a previous project. The silo cell had arectangular cross section and a volume of 40 m3. It wasconnected to a funnel of 5 m3 in volume. The silo wasfilled pneumatically at the top of the silo cell and emp-tied by a rotary valve at the bottom of the funnel. Twofilling systems with different capacities could be applied.
The original purpose of the experiments carried outby Gerhold et. al. (1999) was to approve, whether thenew German VDI-guideline 3673 “Dust explosion vent-ing” is applicable to rectangular silos with internalreinforcement rods (causing additional turbulence).
For the computations presented in this paper the casesdepicted in Table 2 have been selected. It was intendedto find out, whether the differences in the explosionpressures, rates of pressure rise and flame velocitiesmeasured by Gerhold et al. (1999) can be explained bythe different conditions of operation reflected by thepresent computations. Therefore an analysis of the coldflow in the silo during filling was performed. The prob-lem was treated as a three-dimensional, turbulent two-phase flow.
Fig. 6 shows computed profiles of the dust distributionin the x-direction at different heights of the silo. For thesmall conveying system (case 1) the average dust con-centration at the location of the ignition source isbetween 400 and 600 g/m3. This is in agreement withthe “optimum” range of the dust concentration, wherethe highest values of the LBV were found, as reportedin Section 2.1.
Table 2Experimental conditions and results of vented dust explosion experiments in a rectangular silo cell (Gerhold et al., 1999)
Case 1 Case 2
Volume of silo cell in m3 45 45Location of ignition source Funnel FunnelDust Cornstarch CornstarchFlow rate of conveying system in m3/h 8 45Mass load of dust in the flow in kg/m3 11.5 11.5Diameter of the filling pipe in mm 100 270Venting area in m2 1.2 1.2pred in bar 1.12 0.65dp/dtred in bar/s 20.5 9.2Max. flame velocity in m/s 15 7.0
Fig. 6. Computedx-directional profiles of the dust concentration dur-ing filling of a rectangular silo. (a) small conveying system (case 1);(b) large conveying system (case 2).
For the large conveying system (case 2) the averagedust concentration in the funnel was computed consider-ably above 1000 g/m3. This means that in this case afuel-rich mixture appeared at the ignition location. Theoccurrence of an “optimum” concentration at the ignition

297U. Krause, T. Kasch / Journal of Loss Prevention in the Process Industries 13 (2000) 291–298
location is a possible explanation for the comparativelyviolent explosion in case 1.
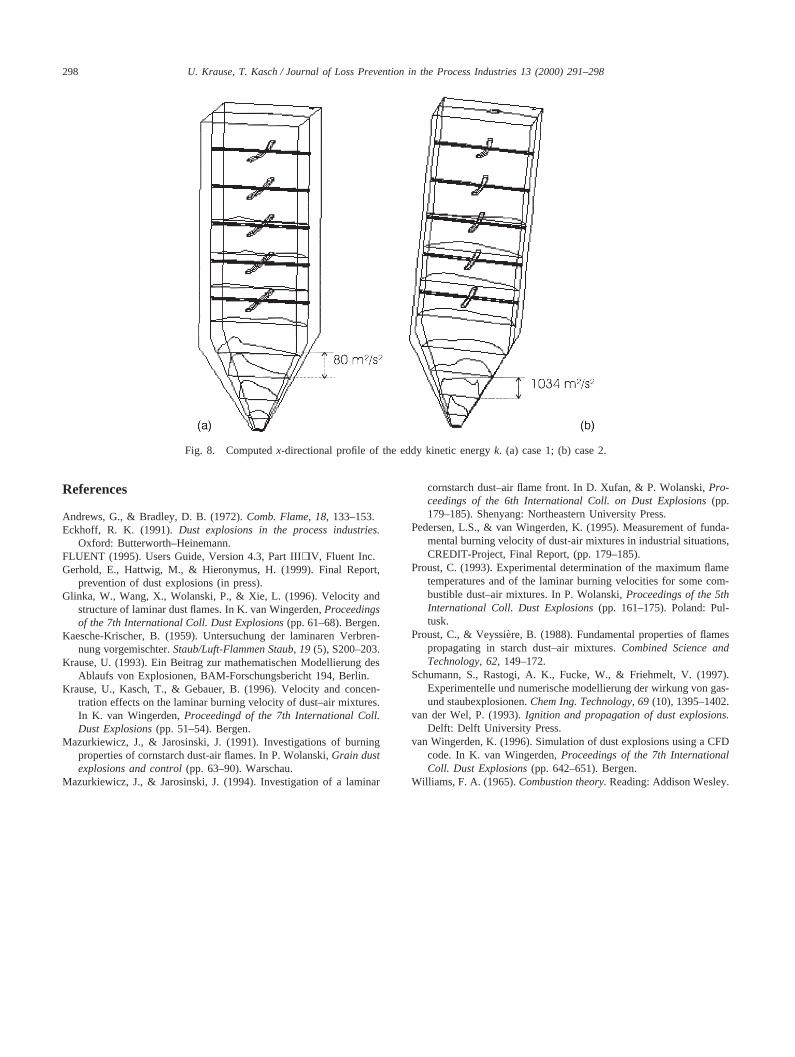
The computation of the velocity and concentrationfields delivers still more details of the filling process.Fig. 7 shows the iso-surfaces of a dust concentration of1500 g/m3 for cases 1 and 2. It can be seen that in case2 nearly the entire silo is filled with a dense cloud miti-gating explosion effects, while in case 1 only parts ofthe silo are filled with a dense dust cloud. Fig. 8 depictsthe profiles of the eddy kinetic energy for cases 1 and2 as it occurs during filling.
4. Conclusions
The investigation show that already for laminar flamesthe influence of the flow parameters dominates that ofthe material properties. For substances with different lev-els of reactivity, e.g. characterised by the LBV, similarvalues of the flame velocity were observed. Materialproperties alone are therefore not sufficient to assess thepossible effects of a dust explosion in a given geometry.Moreover, the existing flow pattern has to be taken intoaccount too. Hence, an intensive turbulent mass, energy
Fig. 7. Iso-surfaces of the dust concentration of 1.500 g/m3 during filling in a rectangular grain silo. (a) case 1; (b) case 2.
and momentum transfer leads to comparatively highreaction rates and thus violent explosions even for pro-ducts which are assessed to be of low reactivity accord-ing to conventional test methods.
However, the influence of the flow field on the reac-tion rate is superimposed by that of the dust concen-tration. For a nearly homogeneous dust–air mixture, asmay be produced in the tube apparatus, the most violentexplosions, i.e. the highest flame velocities, occurred ina range of 1.5 to 2.5 of the stoichiometric concentration.
Using numerical tools, e.g. the homogeneity of a dustcloud in real size, complex geometries may be predicted.By this way process parameters may be avoided, whichlead to dust clouds in the “optimum” range of concen-tration.
In addition, the computations emphasise that anappropriate risk assessment and evaluation of protectionmeasures requires the detailed knowledge of the flowfield within the apparatus considered. For the sake ofthis CFD. tools which include turbulence and chemicalreaction models promise to open a new door in safetyscience.
298 U. Krause, T. Kasch / Journal of Loss Prevention in the Process Industries 13 (2000) 291–298
Fig. 8. Computedx-directional profile of the eddy kinetic energyk. (a) case 1; (b) case 2.
References
Andrews, G., & Bradley, D. B. (1972).Comb. Flame, 18, 133–153.Eckhoff, R. K. (1991).Dust explosions in the process industries.
Oxford: Butterworth–Heinemann.FLUENT (1995). Users Guide, Version 4.3, Part III+IV, Fluent Inc.Gerhold, E., Hattwig, M., & Hieronymus, H. (1999). Final Report,
prevention of dust explosions (in press).Glinka, W., Wang, X., Wolanski, P., & Xie, L. (1996). Velocity and
structure of laminar dust flames. In K. van Wingerden,Proceedingsof the 7th International Coll. Dust Explosions(pp. 61–68). Bergen.
Kaesche-Krischer, B. (1959). Untersuchung der laminaren Verbren-nung vorgemischter.Staub/Luft-Flammen Staub, 19 (5), S200–203.
Krause, U. (1993). Ein Beitrag zur mathematischen Modellierung desAblaufs von Explosionen, BAM-Forschungsbericht 194, Berlin.
Krause, U., Kasch, T., & Gebauer, B. (1996). Velocity and concen-tration effects on the laminar burning velocity of dust–air mixtures.In K. van Wingerden,Proceedingd of the 7th International Coll.Dust Explosions(pp. 51–54). Bergen.
Mazurkiewicz, J., & Jarosinski, J. (1991). Investigations of burningproperties of cornstarch dust-air flames. In P. Wolanski,Grain dustexplosions and control(pp. 63–90). Warschau.
Mazurkiewicz, J., & Jarosinski, J. (1994). Investigation of a laminar
cornstarch dust–air flame front. In D. Xufan, & P. Wolanski,Pro-ceedings of the 6th International Coll. on Dust Explosions(pp.179–185). Shenyang: Northeastern University Press.
Pedersen, L.S., & van Wingerden, K. (1995). Measurement of funda-mental burning velocity of dust-air mixtures in industrial situations,CREDIT-Project, Final Report, (pp. 179–185).
Proust, C. (1993). Experimental determination of the maximum flametemperatures and of the laminar burning velocities for some com-bustible dust–air mixtures. In P. Wolanski,Proceedings of the 5thInternational Coll. Dust Explosions(pp. 161–175). Poland: Pul-tusk.
Proust, C., & Veyssie`re, B. (1988). Fundamental properties of flamespropagating in starch dust–air mixtures.Combined Science andTechnology, 62, 149–172.
Schumann, S., Rastogi, A. K., Fucke, W., & Friehmelt, V. (1997).Experimentelle und numerische modellierung der wirkung von gas-und staubexplosionen.Chem Ing. Technology, 69 (10), 1395–1402.
van der Wel, P. (1993).Ignition and propagation of dust explosions.Delft: Delft University Press.
van Wingerden, K. (1996). Simulation of dust explosions using a CFDcode. In K. van Wingerden,Proceedings of the 7th InternationalColl. Dust Explosions(pp. 642–651). Bergen.
Williams, F. A. (1965).Combustion theory.Reading: Addison Wesley.