“the information contained in this report was compiled for...
TRANSCRIPT


“The information contained in this report was compiled for the use of the Vermont Agency of
Transportation. Conclusions and recommendations contained herein are based upon the research data
obtained and the expertise of the researchers, and are not necessarily to be construed as Agency policy.
This report does not constitute a standard, specification, or regulation. The Vermont Agency of
Transportation assumes no liability for its contents or the use thereof.”
1. Report No.
2010-1
2. Government Accession No.
3. Recipient's Catalog No.
4. Title and Subtitle Pavement Life and Annualized Cost Study,
Statewide
5. Report Date April 2010
6. Performing Organization Code
7. Author(s) Jennifer Fitch, P.E.
8. Performing Organization Report No.
9. Performing Organization Name and Address Vermont Agency of Transportation Materials and Research Section
National Life Building Montpelier, VT 05633-5001
10. Work Unit No.
11. Contract or Grant No.
12. Sponsoring Agency Name and Address
Federal Highway Administration Division Office Federal Building
Montpelier, VT 05602
13. Type of Report and Period Covered
Interim14. Sponsoring Agency Code
15. Supplementary Notes
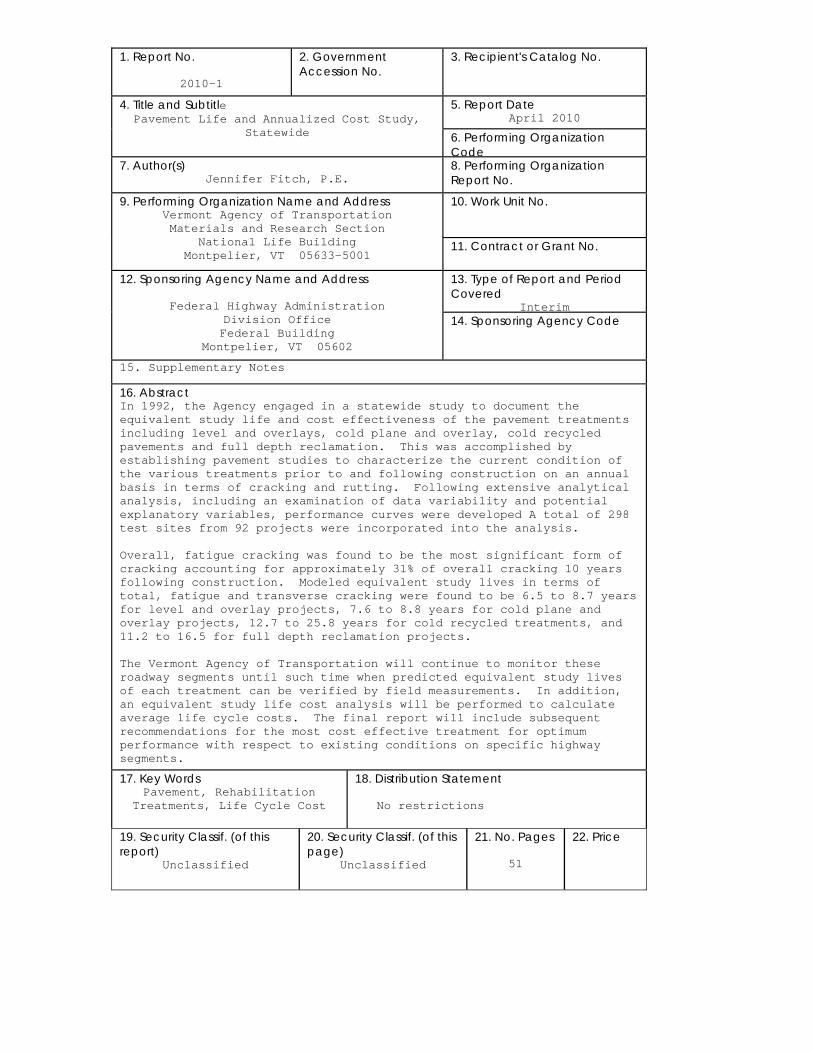
16. Abstract In 1992, the Agency engaged in a statewide study to document the equivalent study life and cost effectiveness of the pavement treatments including level and overlays, cold plane and overlay, cold recycled pavements and full depth reclamation. This was accomplished by establishing pavement studies to characterize the current condition of the various treatments prior to and following construction on an annual basis in terms of cracking and rutting. Following extensive analytical analysis, including an examination of data variability and potential explanatory variables, performance curves were developed A total of 298 test sites from 92 projects were incorporated into the analysis. Overall, fatigue cracking was found to be the most significant form of cracking accounting for approximately 31% of overall cracking 10 years following construction. Modeled equivalent study lives in terms of total, fatigue and transverse cracking were found to be 6.5 to 8.7 years for level and overlay projects, 7.6 to 8.8 years for cold plane and overlay projects, 12.7 to 25.8 years for cold recycled treatments, and 11.2 to 16.5 for full depth reclamation projects. The Vermont Agency of Transportation will continue to monitor these roadway segments until such time when predicted equivalent study lives of each treatment can be verified by field measurements. In addition, an equivalent study life cost analysis will be performed to calculate average life cycle costs. The final report will include subsequent recommendations for the most cost effective treatment for optimum performance with respect to existing conditions on specific highway segments. 17. Key Words
Pavement, Rehabilitation Treatments, Life Cycle Cost
18. Distribution Statement No restrictions
19. Security Classif. (of this report)
Unclassified
20. Security Classif. (of this page)
Unclassified
21. No. Pages 51
22. Price
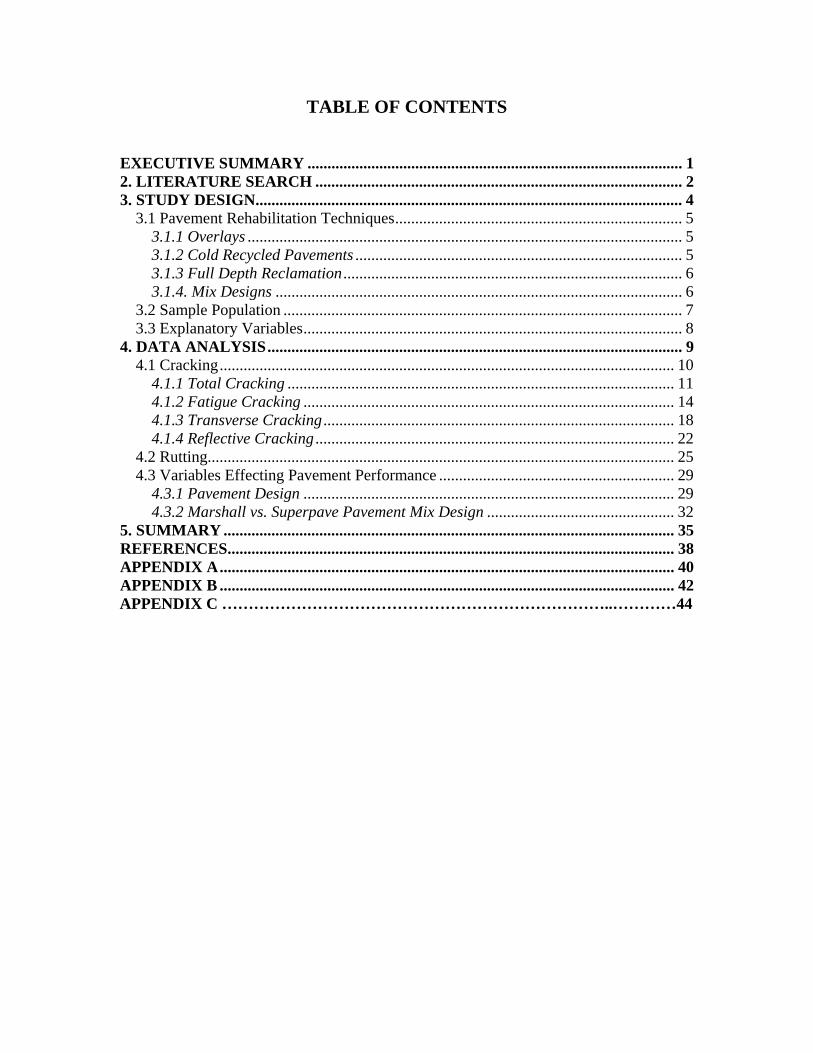
TABLE OF CONTENTS EXECUTIVE SUMMARY .............................................................................................. 1 2. LITERATURE SEARCH ............................................................................................ 2 3. STUDY DESIGN ........................................................................................................... 4
3.1 Pavement Rehabilitation Techniques ........................................................................ 5 3.1.1 Overlays ............................................................................................................. 5 3.1.2 Cold Recycled Pavements .................................................................................. 5 3.1.3 Full Depth Reclamation ..................................................................................... 6 3.1.4. Mix Designs ...................................................................................................... 6
3.2 Sample Population .................................................................................................... 7 3.3 Explanatory Variables ............................................................................................... 8
4. DATA ANALYSIS ........................................................................................................ 9 4.1 Cracking .................................................................................................................. 10
4.1.1 Total Cracking ................................................................................................. 11 4.1.2 Fatigue Cracking ............................................................................................. 14 4.1.3 Transverse Cracking ........................................................................................ 18 4.1.4 Reflective Cracking .......................................................................................... 22
4.2 Rutting..................................................................................................................... 25 4.3 Variables Effecting Pavement Performance ........................................................... 29
4.3.1 Pavement Design ............................................................................................. 29 4.3.2 Marshall vs. Superpave Pavement Mix Design ............................................... 32
5. SUMMARY ................................................................................................................. 35 REFERENCES ................................................................................................................ 38 APPENDIX A .................................................................................................................. 40 APPENDIX B .................................................................................................................. 42 APPENDIX C ………………………………………………………………..…………44
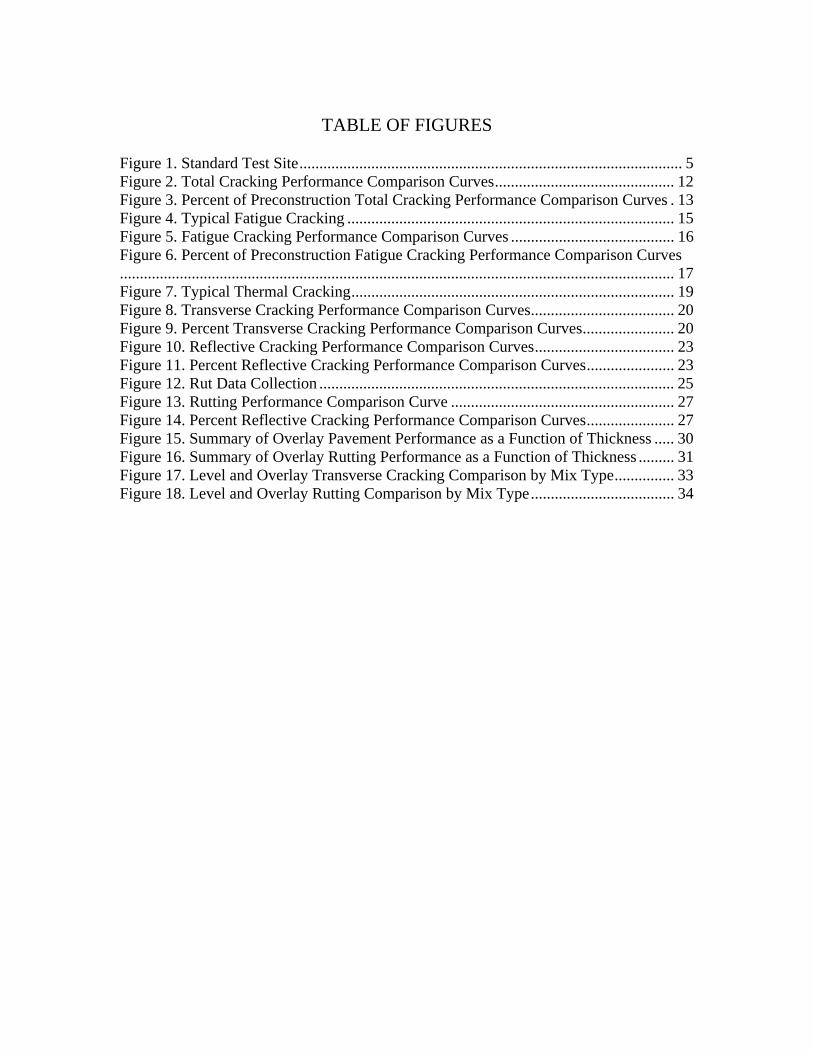
TABLE OF FIGURES
Figure 1. Standard Test Site ................................................................................................ 5 Figure 2. Total Cracking Performance Comparison Curves ............................................. 12 Figure 3. Percent of Preconstruction Total Cracking Performance Comparison Curves . 13 Figure 4. Typical Fatigue Cracking .................................................................................. 15 Figure 5. Fatigue Cracking Performance Comparison Curves ......................................... 16 Figure 6. Percent of Preconstruction Fatigue Cracking Performance Comparison Curves........................................................................................................................................... 17 Figure 7. Typical Thermal Cracking ................................................................................. 19 Figure 8. Transverse Cracking Performance Comparison Curves .................................... 20 Figure 9. Percent Transverse Cracking Performance Comparison Curves ....................... 20 Figure 10. Reflective Cracking Performance Comparison Curves ................................... 23 Figure 11. Percent Reflective Cracking Performance Comparison Curves ...................... 23 Figure 12. Rut Data Collection ......................................................................................... 25 Figure 13. Rutting Performance Comparison Curve ........................................................ 27 Figure 14. Percent Reflective Cracking Performance Comparison Curves ...................... 27 Figure 15. Summary of Overlay Pavement Performance as a Function of Thickness ..... 30 Figure 16. Summary of Overlay Rutting Performance as a Function of Thickness ......... 31 Figure 17. Level and Overlay Transverse Cracking Comparison by Mix Type ............... 33 Figure 18. Level and Overlay Rutting Comparison by Mix Type .................................... 34
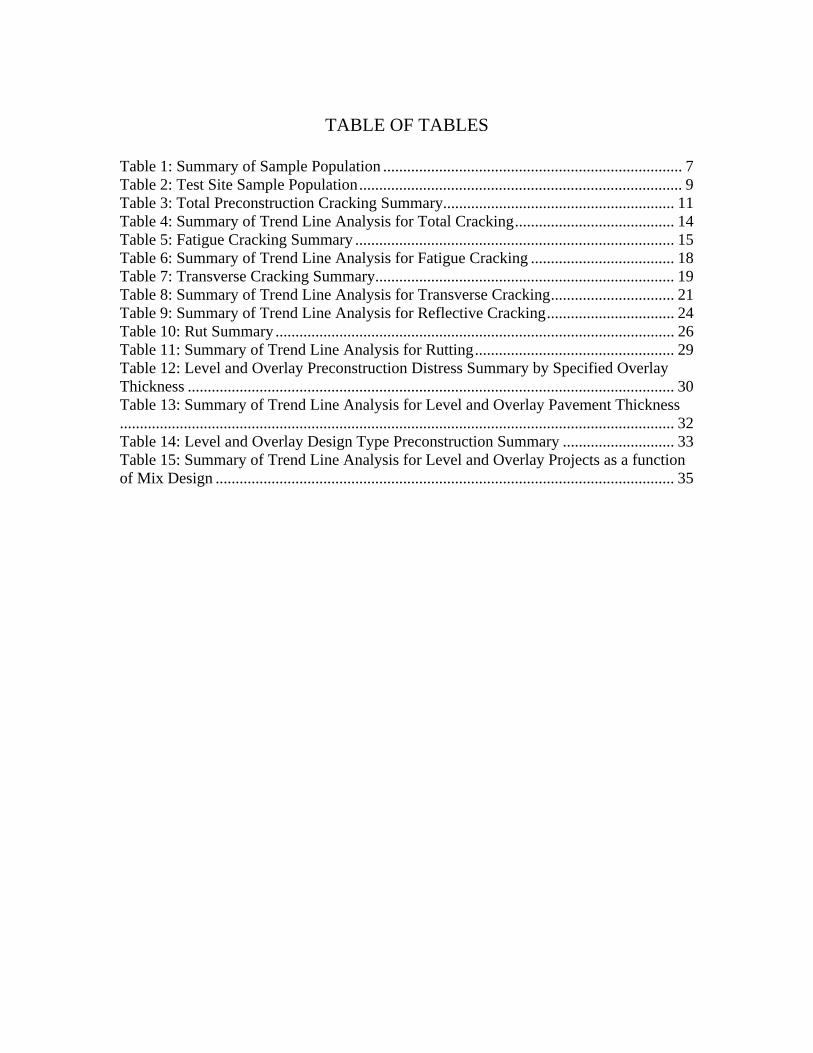
TABLE OF TABLES
Table 1: Summary of Sample Population ........................................................................... 7 Table 2: Test Site Sample Population ................................................................................. 9 Table 3: Total Preconstruction Cracking Summary.......................................................... 11 Table 4: Summary of Trend Line Analysis for Total Cracking ........................................ 14 Table 5: Fatigue Cracking Summary ................................................................................ 15 Table 6: Summary of Trend Line Analysis for Fatigue Cracking .................................... 18 Table 7: Transverse Cracking Summary ........................................................................... 19 Table 8: Summary of Trend Line Analysis for Transverse Cracking ............................... 21 Table 9: Summary of Trend Line Analysis for Reflective Cracking ................................ 24 Table 10: Rut Summary .................................................................................................... 26 Table 11: Summary of Trend Line Analysis for Rutting .................................................. 29 Table 12: Level and Overlay Preconstruction Distress Summary by Specified Overlay Thickness .......................................................................................................................... 30 Table 13: Summary of Trend Line Analysis for Level and Overlay Pavement Thickness........................................................................................................................................... 32 Table 14: Level and Overlay Design Type Preconstruction Summary ............................ 33 Table 15: Summary of Trend Line Analysis for Level and Overlay Projects as a function of Mix Design ................................................................................................................... 35
1
EXECUTIVE SUMMARY With a growing number of pavements in need of reconstruction or rehabilitation, accelerated demand for capital improvements, shortfalls in revenue, and ever increasing construction costs, State Transportation Agencies are seeking out cost effective long-lasting treatments. However, the life cycle of pavement rehabilitation techniques and associated life cycle costs, including initial capital road construction and future maintenance expenditures, vary greatly. Reported mechanisms affecting long term pavement performance include roadway type, traffic volume, climate, soil conditions, pavement design, construction techniques, and choice of materials. Since 1992, the VT AOT has recorded data for pavement performance with an objective of accurately defining results for the principal techniques for reconstruction or rehabilitation. Throughout the study, participants received training on data collection practices to ensure data quality. With these practices and available data sets, projections of pavement performance were developed. The accuracy of the projections is heavily influenced by the duration and depth of data. Despite those considerations, the variation in performance is meaningful when comparing treatments. Pavement distress characterization has two principal visual components of cracking and rutting. Level and hot mix asphalt (HMA) overlay paving projects had an average equivalent study life to range between 6.5 and 8.7 years based on fatigue cracking. HMA projects including milling, level and overlay had an equivalent study life between 7.6 to 8.8 years based on total cracking. Cold recycled treatments displayed less fatigue and transverse cracking as compared to level and overlay and cold plane and overlay projects but attained an equivalent study life of only 11.3 years based on rutting. Full pavement depth reclamation displayed the least amount of total and transverse cracking attaining an average equivalent study life of 10.7 years based on rutting. In comparing the minimum limiting equivalent study life of each treatment, we see that the factors controlling pavement life shift from cracking to rutting with more comprehensive rehabilitation techniques. That end-of -service condition of the treatments result in dissimilar costs to maintain the roadway in the future, with comprehensive treatments offering lower future rehabilitation costs through at least one successive treatment cycle. Cost data was unavailable at the time of publication, but cost data will be considered in a successive report on this project.

2
1. INTRODUCTION With a growing number of pavements in need of reconstruction or rehabilitation, accelerated demand for capital improvements, shortfalls in revenue, and ever increasing construction costs, State Transportation Agencies are seeking out cost effective long-lasting treatments. However, the life cycle of pavement rehabilitation techniques and associated life cycle costs, including initial capital road construction and future maintenance expenditures, vary greatly. Mechanisms affecting long term pavement performance include roadway type, traffic volume, climate, soil conditions, pavement design, construction techniques, and choice of materials. Currently, the Vermont Agency of Transportation maintains approximately 3200 lane miles. The ability to efficiently rehabilitate and maintain this essential portion of Vermont infrastructure in a cost-effective manner is a daunting task. Traditional rehabilitation methods include overlays, cold recycle (CR), and full depth reclamation (FDR). Typically, overlays of existing pavements are intended to increase load carrying capacity or to correct surface defects such as cracking. While effective, overlays are unable to address inadequate road base strength. CR treatments are intended to address functional deficiencies such as non-wheelpath longitudinal cracking, block cracking, poor rideability, flushing, or raveling. FDR treatments are typically used to correct structural deficiencies such as fatigue or alligator cracking within wheelpaths, rutting, and patching (1). In 1992, the Agency engaged in a statewide study to document the equivalent study life and cost effectiveness of the pavement treatments specified above (2). This was accomplished by establishing pavement studies to characterize the current condition of the various treatments prior to and following construction on an annual basis in terms of cracking and rutting. Following extensive analytical analysis, including an examination of data variability and potential explanatory variables, performance curves were developed. The final report will include subsequent recommendations for the most effective treatment for optimum performance with respect to existing conditions on specific highway segments.
2. LITERATURE SEARCH
Due to increased traffic demand resulting in accelerated pavement damage, road safety concerns, and increased pressure to upgrade state highways, numerous state and regulatory agencies are researching cost effective methods to manage roadway networks (3). Research includes, but is not limited to, publications pertaining to recommended construction techniques, the short and long term performance of alternative pavement treatments, establishing deterioration models and life cycle economic analysis. Many of these studies have expressed the importance of specifying the most appropriate treatment for the existing surface condition. As reported by the National Cooperative Highway Research Program (NCHRP), “asphalt pavements with extensive and severe cracking can be rehabilitated by a combination of patching and asphalt overlay, but at some point, other rehabilitation options which are not as sensitive to the preconstruction condition of

3
the pavement may be more cost effective.” (4) According to a recent study conducted by the Nevada Department of Transportation (NDOT) summarizing the 20 year performance of cold in-place recycle CIR and FDR treatments, conducting field surveys to identify the cause of distress is imperative for “selecting the correct strategy and implementing it at the right time.” (1) Failure to specify the most appropriate treatment may result in premature pavement distresses or spending substantially more money than required for pavement rehabilitation. Many states have conducted concurrent performance monitoring efforts to improve design and placement methodologies. The Pennsylvania Department of Transportation (PennDOT) analyzed the performance of various pavement rehabilitation treatments in conjunction with a standard pavement overlay including cold planing, leveling, application of a stress absorbing membrane interlayers (SAMIs), and cold recycling. Performance was assessed on the basis of ride quality and pavement distresses. T tests were conducted to assess whether one treatment was significantly different from another one. Results indicated that cold recycling and SAMI treatments were found to be the most cost effective and “that for a subsequent generation of rehabilitation, the benefit of these treatments continues to be evident.” (5) The Long-Term Pavement Performance program (LTPP) was established by the Federal Highway Administration in 1987 to develop key recommendations for building and maintaining a cost-effective highway system. Hundreds of test sites were created with respect to various climates, soil types, and drainage conditions and monitored for six distress types including fatigue cracking, longitudinal cracking in the wheelpath, longitudinal cracking outside the wheelpath, transverse cracking, rutting, and smoothness. As not all pavement sections were the same age, survival analysis, or a statistical method to determine the probability of exceeding a specific level of distress, was performed for each test section. Findings from this study indicate that the expected service life of flexible pavement is 22 years. Key variables affecting performance through an analysis of variance (ANOVA) were found to be subgrade type, pavement thickness, base type, and drainage conditions (6). Most, if not all, state transportation agencies in the United States utilize a Pavement Management System (PMS) which incorporate condition surveys, physical pavement features, and traffic information to reliably forecast future pavement performance and manage assets (7). These models must be calibrated, validated, and periodically updated. Road asset managers in Australia found that the outputs of their PMSs were not accurately predicting actual pavement performance, as prediction models were based on the performance of pavements overseas. Therefore, the Australian Road Research Board (ARRB) established a representative sample of monitoring sites with consideration of road type, traffic volume, climate, soil condition, and maintenance practices. With respect to predicting smoothness, only two parameters were found to be statistically significant, traffic and rainfall (8). Construction techniques also affect pavement performance and subsequent life cycle. For example, inadequate pavement compaction may result in decreased stiffness, earlier fatigue, accelerated aging, rutting, raveling, and moisture damage. Many current construction specifications place greater emphasis on the performance of the final
4
product as opposed to construction methods to address these construction issues. In Vermont for example, the Agency utilizes incentives and disincentives in the form of increased or decreased pay factors, respectively. Pay factors are evaluated in terms of air voids in the manufactured product, mat density, surface tolerance or smoothness, and longitudinal joint compaction (9). Ultimately, construction practices that result in an insufficient pavement structure will result in a shortened pavement life. The University of Waterloo utilized previous models derived from the Canadian Long-Term Pavement Performance Program to examine how the variability of overlay thickness, amount of cracking prior to construction, and accumulated equivalent single axle loads (ESALs) affect the service life of pavements. A life cycle cost analysis was performed utilizing Monte Carlo techniques, a class of computational algorithms that rely on repeated random sampling to compute their results, to evaluate differences in simulated performance of various overlay thickness. These differences were then used as a basis for establishing pay factors for Canadian pavements (10).
3. STUDY DESIGN
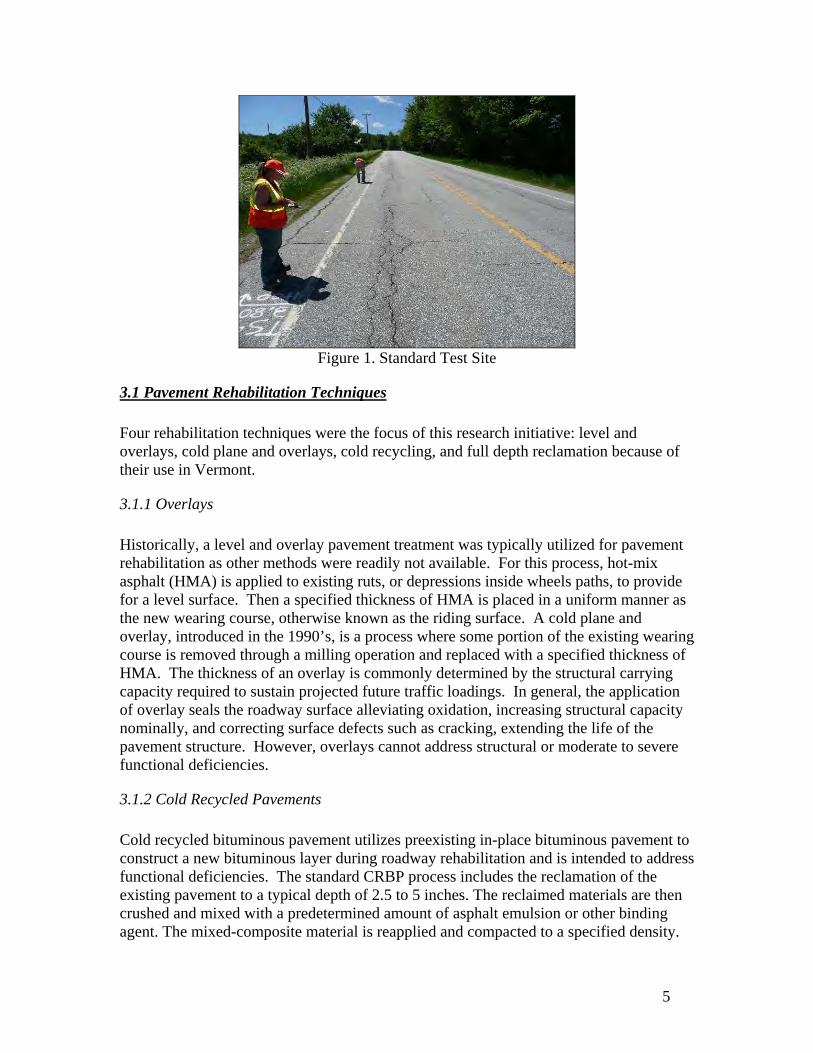
The intent of this examination was to monitor the performance of various pavement rehabilitation techniques with respect to roadway type, traffic loading, climate, soil conditions, and materials in terms of cracking and rutting. This was accomplished by identifying pavement rehabilitation techniques of interest, including level and overlays, cold plane and overlays, cold recycling, and full depth reclamation and establishing associated test sections prior to construction. Annual pavement surveys were conducted prior to and following construction in accordance with the “Distress Identification Manual for the Long-Term Pavement Performance Program” published by the Strategic Highway Research Program (11) by field personnel. Each test site was marked at intervals of ten feet from the beginning of the test section for a total length of 100’ often referenced by mile markers or other identifiable land marks as shown in Figure 1. Pavement surveys started at the beginning of a test section and the locations and length of each crack were hand drawn onto a data collection sheet. A rut gauge was utilized to measure the overall rut depth within each test section. This was done by collecting rut measurements at 50’ intervals from the beginning to end of each test section. Rut measurements were collected by extending a string across the width of the road and measuring the normal height between the string and the deepest depression within all wheel paths identified along the length of the string. All measurements were recorded onto a standard field form in 1/8” increments. All data were interpreted and entered into dedicated spreadsheets for further analysis.
5
Figure 1. Standard Test Site
3.1 Pavement Rehabilitation Techniques
Four rehabilitation techniques were the focus of this research initiative: level and overlays, cold plane and overlays, cold recycling, and full depth reclamation because of their use in Vermont.
3.1.1 Overlays
Historically, a level and overlay pavement treatment was typically utilized for pavement rehabilitation as other methods were readily not available. For this process, hot-mix asphalt (HMA) is applied to existing ruts, or depressions inside wheels paths, to provide for a level surface. Then a specified thickness of HMA is placed in a uniform manner as the new wearing course, otherwise known as the riding surface. A cold plane and overlay, introduced in the 1990’s, is a process where some portion of the existing wearing course is removed through a milling operation and replaced with a specified thickness of HMA. The thickness of an overlay is commonly determined by the structural carrying capacity required to sustain projected future traffic loadings. In general, the application of overlay seals the roadway surface alleviating oxidation, increasing structural capacity nominally, and correcting surface defects such as cracking, extending the life of the pavement structure. However, overlays cannot address structural or moderate to severe functional deficiencies.
3.1.2 Cold Recycled Pavements
Cold recycled bituminous pavement utilizes preexisting in-place bituminous pavement to construct a new bituminous layer during roadway rehabilitation and is intended to address functional deficiencies. The standard CRBP process includes the reclamation of the existing pavement to a typical depth of 2.5 to 5 inches. The reclaimed materials are then crushed and mixed with a predetermined amount of asphalt emulsion or other binding agent. The mixed-composite material is reapplied and compacted to a specified density.

6
The new pavement layer is allowed to cure prior to the application of a binder and/or wearing surface. In most cases, the reconstruction is carried out onsite continuously through the use of a recycling train.
3.1.3 Full Depth Reclamation
Full depth reclamation (FDR), produces a new base by pulverizing the existing asphalt pavement and mixing it with some underlying subbase materials and is intended to correct structural deficiencies. In accordance with the Vermont Agency of Transportation’s “2006 Standard Specifications for Construction” the standard FDR process, otherwise known as reclaimed stabilized base (RSB), consists of a series of steps that include pulverizing the existing pavement layers together with the underlying base course material to a standard depth of 6 to 12 inches (9). Water and additives are blended with the pulverized section, which is then graded and compacted to a specified density. The new pavement layer is allowed to cure prior to the application of a new wearing surface. Pulverizing and mixing operations are typically achieved through the use of a road reclaiming machine. Additional structural strength may be achieved by incorporating mechanical, chemical, or bituminous stabilizers.
3.1.4. Mix Designs
Both Marshall and Superpave bituminous pavement mixes were constructed and examined within this study. The Marshall Mix design method, originally developed in the late 1930’s, facilitated rapid testing to determine optimal binder content at a desired density with respect to a specified minimum stability and range of flows. Today, specimens continue to be evaluated through the use of a Marshall Hammer intended to produce comparable densities to those achieved in the field. Laboratory compaction effort, or the number of blows, is selected based upon anticipated traffic loading in equivalent single axle loads (ESALs). The Superpave Mix design method was implemented through the Strategic Highway Research Program (SHRP) in 1993. This mix design accounted for traffic loading and environmental conditions and contained new material selection requirements and associated laboratory testing. Unlike asphalt cement (AC), or viscosity based binders utilized in the Marshall Method, Superpave mixes specify the use of performance graded binders (PG), a classification implying that the binder should perform satisfactorily at an average 7 day high temperature and average one day low temperature. In addition, the Superpave mix design process simulates field compaction effort through the use of a gyratory compactor, a reportedly more accurate method. The gyratory compactor simulates the results of today’s heavier, higher energy compaction equipment. Current design criteria and construction requirements are identified within the “2006 Standard Specification for Construction” including gradation, production testing tolerances, and quality control requirements. Gradation limit specifications vary between the Superpave and Marshall Mix Designs. Additionally, Marshall mixes must conform to specified design criteria such as air voids, voids in the mineral aggregate (VMA),

7
stability, and flow, while Superpave mixes must adhere to two AASHTO specifications, AASTHO R 35, “Standard Practice for Superpave Volumetric Design for Hot-Mix Asphalt,” (12) and AASHTO M 323, “Standard Specification for Superpave Volumetric Mix Design” (13) which include gradation, VMA, VFA, optimum asphalt content and air voids. However, all of the minimum quality control and quality acceptance criteria are the same regardless of the mix type. This includes production of the mix at the plant including air voids, and in-place density.
3.2 Sample Population
Following implementation, 426 experimental test sites were established on 96 roadway rehabilitation projects from 1992 through 2007. Projects were selected in conjunction with the paving program, as well as the availability of the technology and resources required for collecting and maintaining the data. However, several of the projects and/or test sites were removed from the study due to the lack of a preconstruction survey or inability to properly reestablish test sites following construction. Test sites were also removed due to presence of significant alligator cracking making an accurate assessment of the total amount of cracking nearly impossible resulting in a high probability of inaccuracy. Therefore, a total of 128 test sites and 4 rehabilitation projects were removed from the sample population to ensure accuracy and precision. Table 1 provided below contains a summary of the final population analyzed within this study. A map with the locations of all project locations retained within the study is provided in Appendix A.
Table 1: Summary of Sample Population
Treatment Type: Overlay Mix
Design: Number of Projects:
Number of Test Sites:
Years Constructed
From: To:
Level and Overlay
SuperPave 11 38 1998 2007
Marshall 37 109 1992 1996
Subtotal: 48 147 (49%)
Cold Plane and Overlay
SuperPave 10 24 1998 2007
Marshall 1 9 1995 1995
Subtotal: 11 33 (11%)
Cold Recycle and Overlay
SuperPave 2 10 1997 1998
Marshall 4 27 1992 1996
Subtotal: 6 37 (13%)
Reclaimed Base and Overlay
SuperPave 6 19 1994 2006
Marshall 21 62 1992 2005
Subtotal: 27 81 (27%) Overall Total: 92 298 (100%)
In examining the proportion of the various rehabilitation techniques, it is important to note that there is a greater amount of level and overlay test sites as compared to all other treatments. The use of Marshall Overlays was fairly common practice for the Agency

8
during the early to mid 1990’s. SuperPave projects appear to be constructed more recently which correlates to the advent and implementation of this new mix design. In addition, the majority of the cold plane projects received a SuperPave overlay. Conversely, the majority of the reclaimed base and cold recycle projects received a Marshall binder and/or wearing course.
3.3 Explanatory Variables
Several variables potentially affecting pavement performance over time were examined within this study as described below: Design Specifications – Specified lift thicknesses for the various treatment types. This includes the depth of the reclamation or cold recycle, binder course, wearing course and resulting thickness of the overall treatment. Mix Design Type – The type of mix design specified for the project, Superpave or Marshall Mix Design. Wearing Course Type – A specified gradation for bituminous pavement. For this examination, Type III and Type IV bituminous wearing courses were incorporated into all of the mix designs for the entire sample population. A larger pavement type number represents a finer gradation. For example, the gradation of a Type IV wearing course is finer than a Type III. Annual Average Daily Traffic (AADT) – The average 24-hour traffic volume passing a point or segment of a highway facility over a full year. Typically, the Agency periodically monitors various roadway segments through the use of portable traffic counters with pneumatic tube sensors. Equivalent Single Axle Loads (ESALs) – The effect on pavement performance of any combination of axle loads of varying magnitude is expressed as an equivalent number of 18,000 lb. single axle loads. As a rule-of-thumb, the load equivalency of a particular load is roughly related to the load by a power of four. A 36,000 lb. single axle load will cause about 16 times the damage as an 18,000 lb. single axle load. Structure Type – Designated pavement structural classification types:
AONC – Asphalt on portland cement concrete slabs. THCK – An engineered pavement structure including interstates and newer
roadway or full reconstructions. TONS – Thin on Strong; generally better performing pavement with unknown
structure. TONW – Thin on Weak; generally poorer performing pavements with unknown
structure.
9
Soil Type – Soil classification along roadway segments in accordance with the US Department of Agriculture Web Soil Survey as follows:
Fine sandy loam Loam fine sand Gravely fine sandy loam Silt Loam Stony Loam
4. DATA ANALYSIS
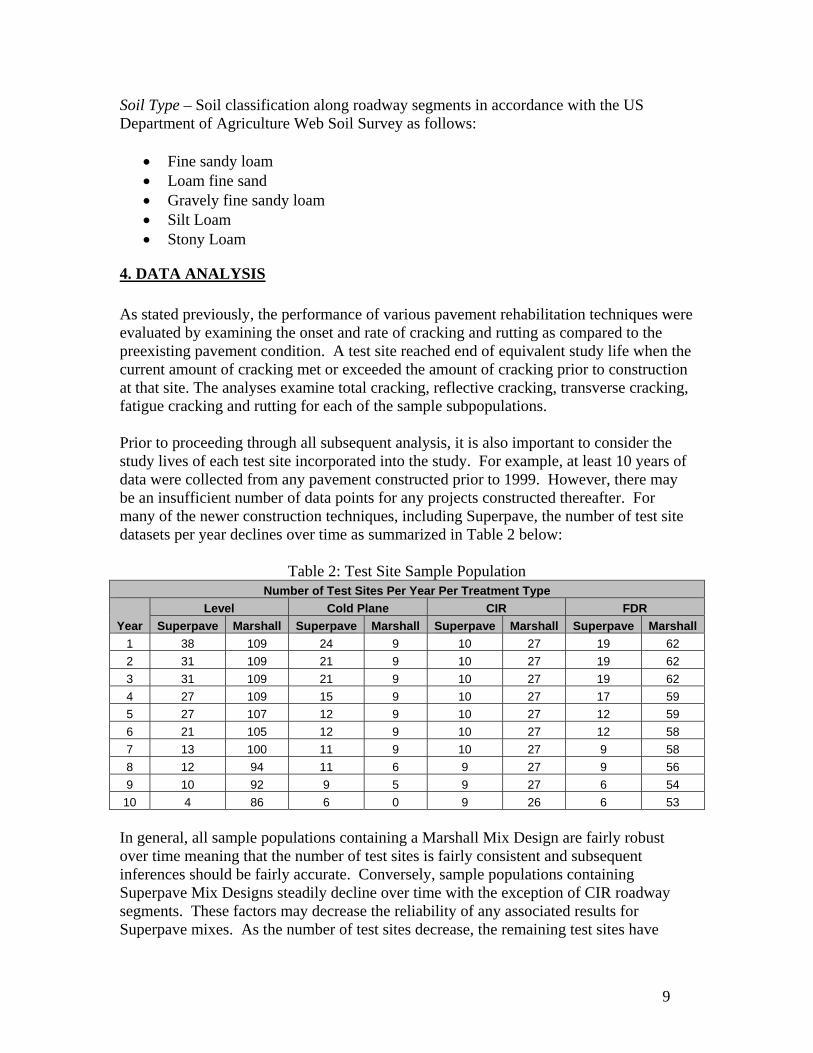
As stated previously, the performance of various pavement rehabilitation techniques were evaluated by examining the onset and rate of cracking and rutting as compared to the preexisting pavement condition. A test site reached end of equivalent study life when the current amount of cracking met or exceeded the amount of cracking prior to construction at that site. The analyses examine total cracking, reflective cracking, transverse cracking, fatigue cracking and rutting for each of the sample subpopulations. Prior to proceeding through all subsequent analysis, it is also important to consider the study lives of each test site incorporated into the study. For example, at least 10 years of data were collected from any pavement constructed prior to 1999. However, there may be an insufficient number of data points for any projects constructed thereafter. For many of the newer construction techniques, including Superpave, the number of test site datasets per year declines over time as summarized in Table 2 below:
Table 2: Test Site Sample Population Number of Test Sites Per Year Per Treatment Type
Year
Level Cold Plane CIR FDR
Superpave Marshall Superpave Marshall Superpave Marshall Superpave Marshall
1 38 109 24 9 10 27 19 62
2 31 109 21 9 10 27 19 62
3 31 109 21 9 10 27 19 62
4 27 109 15 9 10 27 17 59
5 27 107 12 9 10 27 12 59
6 21 105 12 9 10 27 12 58
7 13 100 11 9 10 27 9 58
8 12 94 11 6 9 27 9 56
9 10 92 9 5 9 27 6 54
10 4 86 6 0 9 26 6 53
In general, all sample populations containing a Marshall Mix Design are fairly robust over time meaning that the number of test sites is fairly consistent and subsequent inferences should be fairly accurate. Conversely, sample populations containing Superpave Mix Designs steadily decline over time with the exception of CIR roadway segments. These factors may decrease the reliability of any associated results for Superpave mixes. As the number of test sites decrease, the remaining test sites have
10
greater influence on findings. In addition, if these test sites are not representative of the population, conclusions will be inaccurate.
4.1 Cracking
There are several causes for cracking in flexible pavements, including inadequate structural support such as the loss of base, sub-base or sub-grade support, increased loading, inadequate design, poor construction, or poor choice of materials. For this analysis, total, longitudinal, transverse, and reflective cracking were examined. Fatigue cracks run parallel to the laydown direction within the wheelpaths and are usually a type of fatigue or load associated failure. Transverse cracks run perpendicular to the pavement’s centerline and are usually a type of critical-temperature failure or thermal fatigue that may be induced by multiple freeze-thaw cycles. Reflection cracks occur from previous cracking that may exist within the base course, sub-base or sub-grade material and continue through the wearing course. In all cases, cracks allow for moisture infiltration and can result in structural failure over time. An example of a cracking form with identification of the types of cracking described above is provided in Appendix B. Performance curves were generated for all forms of cracking as linear feet of cracking per year per 100 foot test section and as a percentage of preconstruction cracking per year. For the latter analysis, the amount of cracking per year was divided by the amount of preconstruction cracking for each test site in order to standardize the data sets as shown in Example 1. Unfortunately, data were not collected annually at some test sites. In these instances, the amount of cracking was assumed to be an even linear increment from the following and preceding years. For example, if data were not collected three years following construction, the amount of cracking two years following construction was subtracted from the amount of cracking four years following construction. The resultant was divided by two and added to the amount of cracking two years following construction as shown in Example 2. These data were entered into the appropriate cell within the spreadsheet, highlighted in blue font. Example 1 - Percentage of Preconstruction cracking per year per test site:
onconstructitopriortypecrackingofLF
onconstructifollowingNYearintypecrackingofLF
Example 2: Determination of missing crack data (assume cracking data is missing for Year 3):
2
242
YearintypecrackingofLFYearintypecrackingofLFYearintypecrackingofLF
Each data set was then examined for outliers. An outlier was defined for this study as any cracking value per test site greater than three standard deviations away from the mean for a particular pavement treatment and distress type. If an outlier was identified in any given year for a test site, then all associated cracking values were removed. For

11
example, if an outlier was identified three years following construction within a test site along a CIR roadway segment, all of the information for that test site was removed from the sample population. Once outliers were removed, an average amount of cracking in linear feet and percentage of preconstruction cracking per year was calculated. To examine various factors that may influence cracking over time, data sets with outliers previously removed were sorted into appropriate bins. For example, sample populations were sorted by pavement mix design, Superpave or Marshall, for each treatment type. Finally, averages were calculated for each binned data set and plotted to graphically display associated relationships over time. Given the significant sample population reduction over time with respect to cold plane treatments, only eight years were considered within this analysis to ensure accurate findings. All performance curves including best fit trend line equations and associated R2 values, or goodness of fit, are provided in Appendix C.
4.1.1 Total Cracking
Total cracking is simply the total amount of cracking within a test site with no regard to the type or cause of pavement distress. It is a general measure of the condition of the pavement prior to and after construction. For example, a pavement with a sufficiently greater amount of cracking prior to construction as opposed to another roadway segment can be considered to be in poorer condition comparatively. However, it is vital to determine the cause of pavement deterioration prior to selecting the most appropriate pavement rehabilitation technique. As stated previously, pavement overlays seal the roadway surface alleviating oxidation, increasing structural capacity, and correcting surface defects. The cold recycle process is intended to correct functional deficiencies such as non-wheelpath longitudinal cracking, block cracking, poor rideability, flushing or raveling. Full depth reclamation is generally used to correct structural deficiencies such as fatigue or alligator cracking within the wheelpaths, rutting, and patching (1). The following table summarizes the average amount of preconstruction cracking per treatment type. Please note that outliers have not been removed from this data set.
Table 3: Total Preconstruction Cracking Summary
Preconstruction Total Cracking Summary in LF/100 FT Test Section
Treatment # of Test
Sites Average Standard Deviation
Overall 298 441.0 316.2 Cold Plane 33 370.3 189.7 Level 147 333.0 212.8 CIR 37 731.2 446.9 FDR 81 501.2 308.9
It is interesting to note that the average amount of preconstruction cracking for CIR projects exceeds that of FDR projects by 230 LF per test site. However, these values do not discern between the type of cracking and the greater levels of cracking may be due to functional rather than structural deficiencies. In addition, the size of the sample

12
populations between the CIR and FDR projects varies greatly. Greater accuracy and precision is anticipated with larger sample populations. The average amount of cracking within the cold plane and level project is fairly equivalent with slightly more cracking per test site within the limits of the cold plane projects. Figures 2 and 3 display graphical time series plots of comparative treatment performance over time with respect to the total average amount of linear feet of cracking and cracking as a function of the amount of preconstruction cracking, respectively. Cracking located along the centerline of the pavement was not considered for this analysis as it is generally associated with poor construction techniques with reference to the pavement joint; therefore total cracking excludes centerline cracking.
Total Cracking Performance Curve Comparison
0
50
100
150
200
250
300
350
400
0 1 2 3 4 5 6 7 8 9 10 11
Years Following Construction
Cra
ckin
g (
LF
/100
FT
)
Cold Plane
Level
CIR
FDR
Figure 2. Total Cracking Performance Comparison Curves
13
Total Cracking Performance Curve Comparison
0%
20%
40%
60%
80%
100%
120%
140%
0 1 2 3 4 5 6 7 8 9 10 11
Years following Construction
Cra
cki
ng
(%
of
Pre
co
n)
Cold Plane
Level
CIR
FDR
End of Study Life
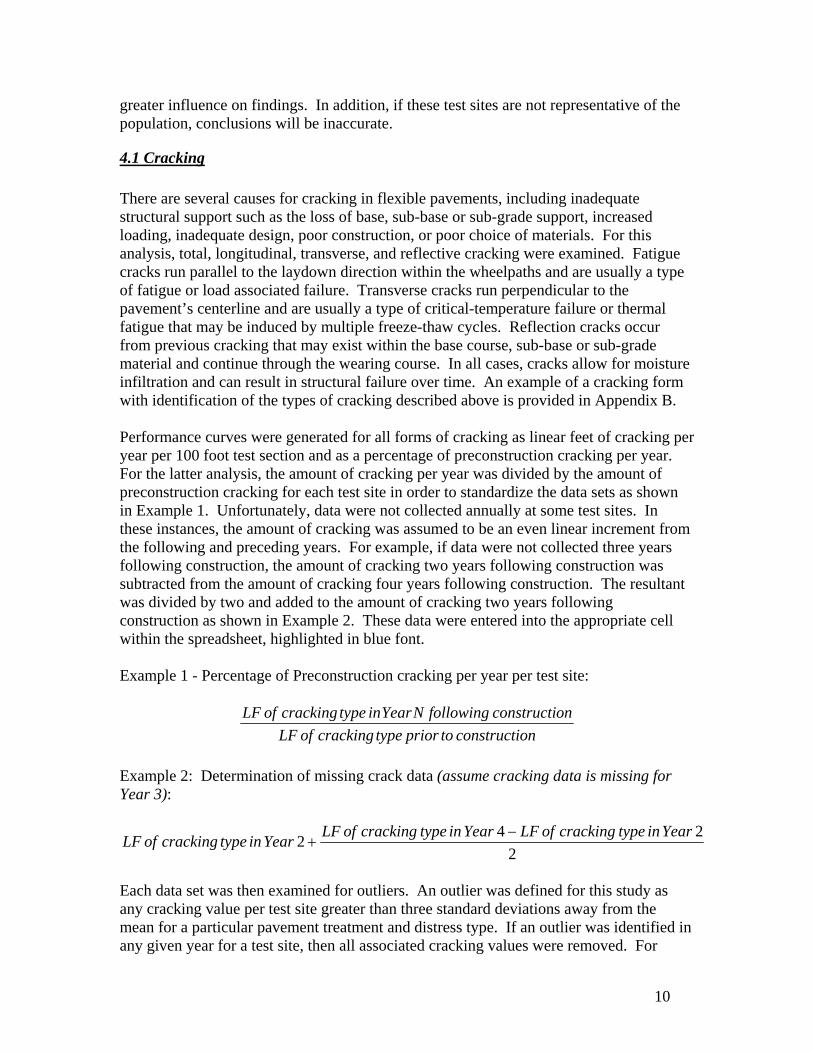
Figure 3. Percent of Preconstruction Total Cracking Performance Comparison Curves
In examining Figure 2, it appears that level, CIR, and FDR paving treatments follow a fairly linear trend with respect to cracking over time while cold plane projects display an exponential rate of deterioration. However, continued deterioration rates beyond ten years are expected to display nonlinear characteristics. In addition, FDR pavement treatments display the least amount of cracking over time as compared to all other treatments. Conversely, CIR treatments were found to exhibit the greatest amount of cracking nine to ten years following construction with an average amount of 359 linear feet per test site following ten years of performance. The causations for this are unknown but may be attributed to inadequate design or construction practices. Within documented cases, specified compaction was difficult to achieve. However, this technology was within its infancy at the time and problems encountered during construction may have been due to lack of experience. Additionally, the CIR sample population contained highly distressed pavements which may have contributed to a greater amount of cracking following project completion. Figure 3 displays other interesting trends that differ from the observations noted in the previous paragraph. In this case, the amount of cracking in a given year for a specific test site was divided by the amount of total preconstruction cracking. From this analysis, it is clear that CIR and FDR treatments outperform cold plane and level projects as would be expected. Once again, level, CIR, and FDR projects exhibit a linear rate of pavement deterioration while cold plane treatments display an exponential rate of cracking over time. As stated previously, end of equivalent study life is achieved when a treatment meets or exceeds the amount of preconstruction cracking. Level projects were found to
14
exceed the amount of preconstruction cracking between approximately 8 to 9 years following construction. In addition, given the shape of the curve, it is easy to assume a similar equivalent study life for level and overlay projects. Ten years following construction, CIR and FDR projects have yet to meet or exceed the end of equivalent study life at 51.8% and 62.4% of preconstruction cracking, respectively. Best fit trend lines of treatment performance over time were generated for both total cracking in linear feet and total cracking as a percentage of preconstruction cracking utilizing the Microsoft Excel program as shown in Table 4. It is important to note that data was plotted beginning one year following construction as pavement distress was not recorded immediately following construction. Therefore no constraints were placed on the origin of the best fit trend lines.
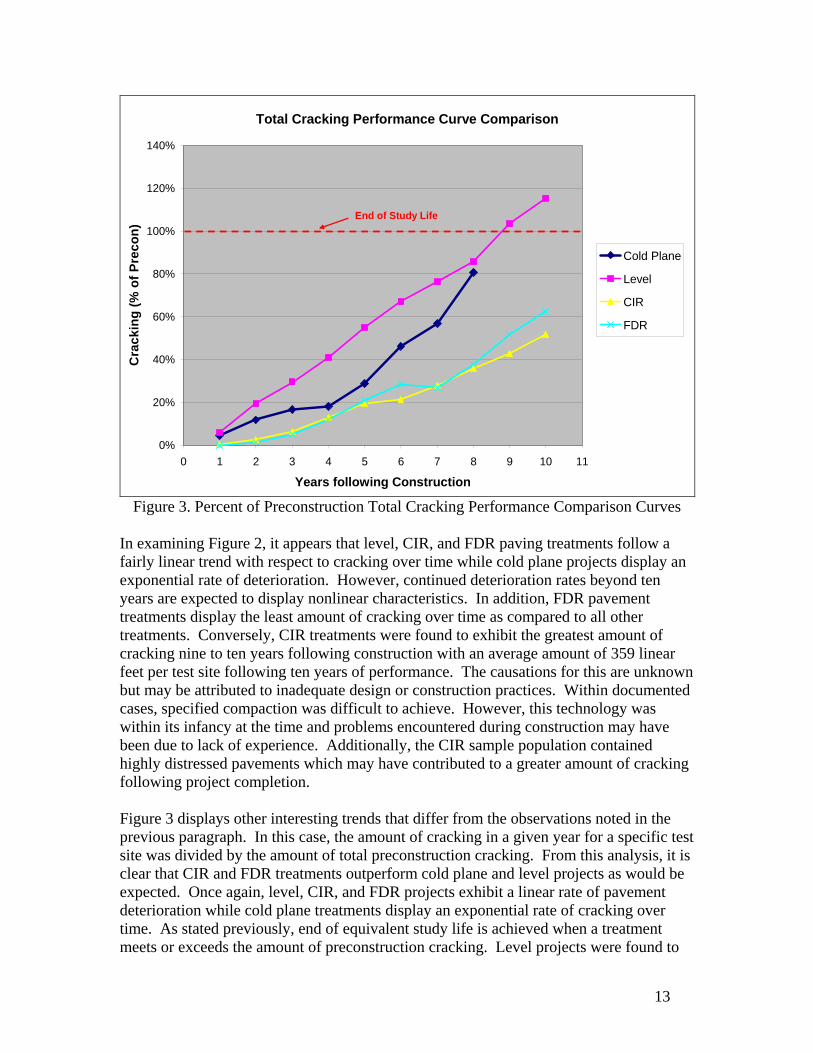
Table 4: Summary of Trend Line Analysis for Total Cracking Total Cracking Best Fit Trend Lines
Treatment: Linear FT: R2:
Predicted Cracking at 10 Yrs (FT): % of Precon: R2:
Years to Reach
Precon.
Cold Plane Y = 16.695e0.3431X 0.922 516 Y = 0.0439e0.3749X 0.961 8.3
Level Y = 32.82X - 16.123 0.998 312 Y = 0.1195X - 0.0589 0.997 8.7
CIR Y = 39.89X - 66.375 0.982 332 Y = 0.057X - 0.092 0.980 19.1
FDR Y = 30.19X - 59.246 0.987 243 Y = 0.0684X - 0.1294 0.953 16.5
Level, CIR, and FDR projects were found to display a linear trend while cold plane projects exhibited an exponential rate of deterioration for both linear feet of cracking per test site and as a percentage of preconstruction cracking. In all cases, the R2 values, or goodness of fit, demonstrate good accuracy with a minimum value of 0.922. It is important to note however, that the goodness of fit only applies to the duration of the study. Over a longer amount of time pavement performance should model as a non linear function and increase steadily. In addition to generating a best fit trend line to predict performance over time, the number of years to meet or exceed the amount of total cracking prior to construction was also calculated as shown. In accordance with the models, cold plane and level projects reach end of equivalent study life at 8.3 and 8.7 years, respectively. CIR and FDR treatments are predicted to exceed the amount of total cracking prior to construction at 19.1 and 16.5 years, respectively. Actual end of study lives for CIR and FDR are anticipated to be less than predicted values due to expected non linear increases in rates of deterioration.
4.1.2 Fatigue Cracking
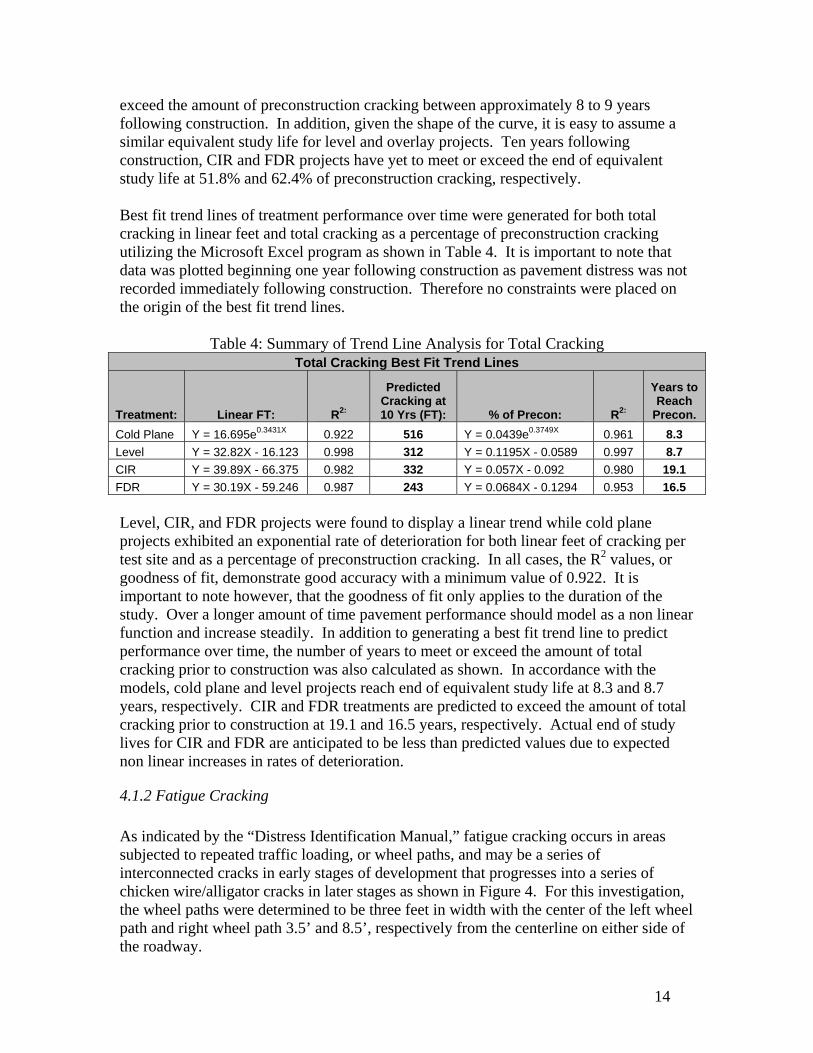
As indicated by the “Distress Identification Manual,” fatigue cracking occurs in areas subjected to repeated traffic loading, or wheel paths, and may be a series of interconnected cracks in early stages of development that progresses into a series of chicken wire/alligator cracks in later stages as shown in Figure 4. For this investigation, the wheel paths were determined to be three feet in width with the center of the left wheel path and right wheel path 3.5’ and 8.5’, respectively from the centerline on either side of the roadway.
15
Figure 4. Typical Fatigue Cracking
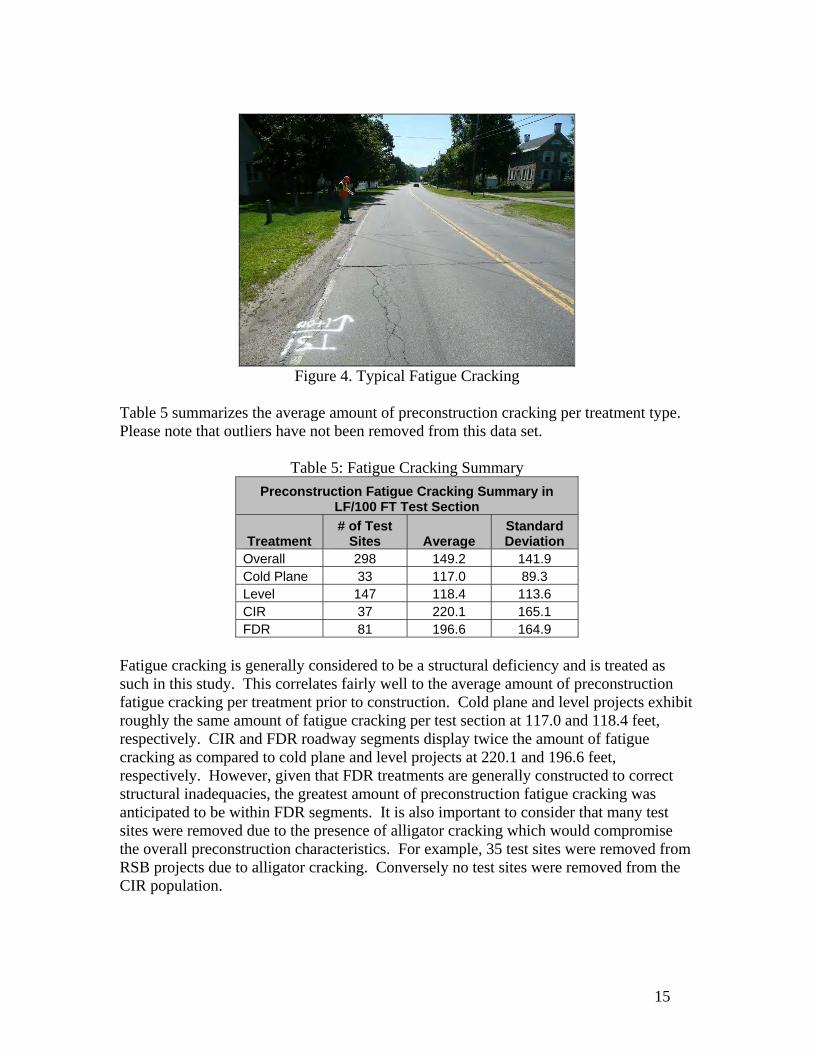
Table 5 summarizes the average amount of preconstruction cracking per treatment type. Please note that outliers have not been removed from this data set.
Table 5: Fatigue Cracking Summary
Preconstruction Fatigue Cracking Summary in LF/100 FT Test Section
Treatment # of Test
Sites Average Standard Deviation
Overall 298 149.2 141.9 Cold Plane 33 117.0 89.3 Level 147 118.4 113.6 CIR 37 220.1 165.1 FDR 81 196.6 164.9
Fatigue cracking is generally considered to be a structural deficiency and is treated as such in this study. This correlates fairly well to the average amount of preconstruction fatigue cracking per treatment prior to construction. Cold plane and level projects exhibit roughly the same amount of fatigue cracking per test section at 117.0 and 118.4 feet, respectively. CIR and FDR roadway segments display twice the amount of fatigue cracking as compared to cold plane and level projects at 220.1 and 196.6 feet, respectively. However, given that FDR treatments are generally constructed to correct structural inadequacies, the greatest amount of preconstruction fatigue cracking was anticipated to be within FDR segments. It is also important to consider that many test sites were removed due to the presence of alligator cracking which would compromise the overall preconstruction characteristics. For example, 35 test sites were removed from RSB projects due to alligator cracking. Conversely no test sites were removed from the CIR population.
16
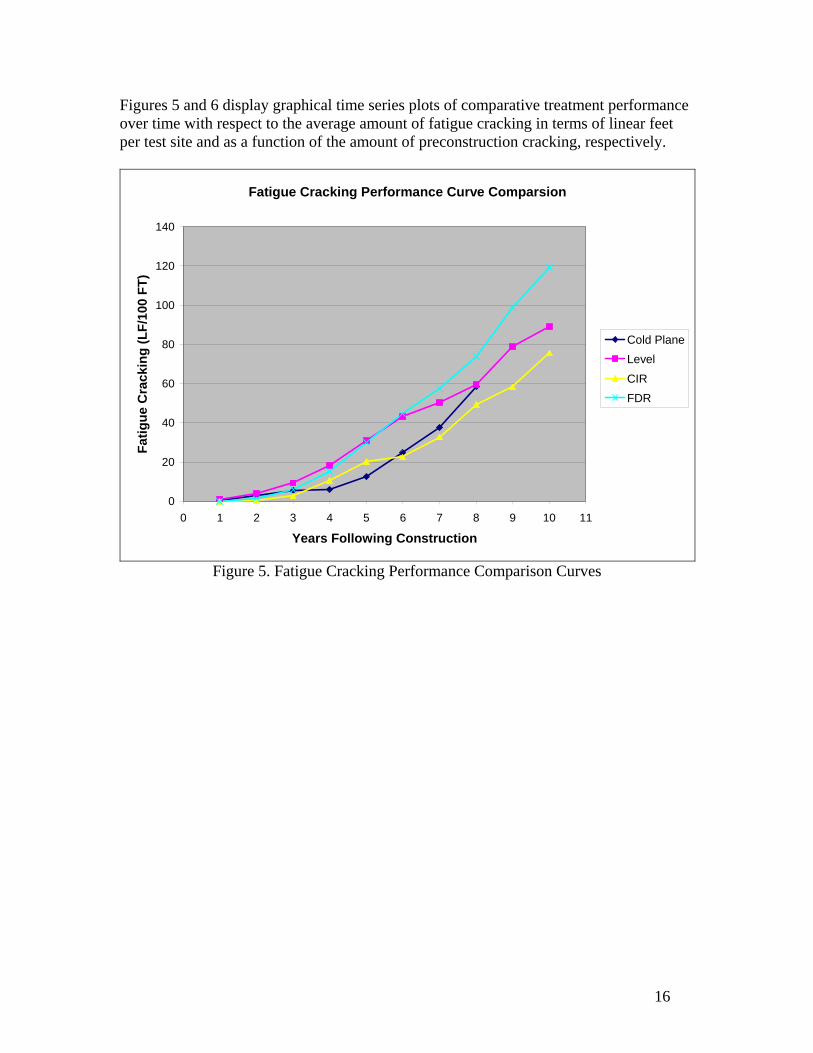
Figures 5 and 6 display graphical time series plots of comparative treatment performance over time with respect to the average amount of fatigue cracking in terms of linear feet per test site and as a function of the amount of preconstruction cracking, respectively.
Fatigue Cracking Performance Curve Comparsion
0
20
40
60
80
100
120
140
0 1 2 3 4 5 6 7 8 9 10 11
Years Following Construction
Fa
tig
ue
Cra
cki
ng
(L
F/1
00 F
T)
Cold Plane
Level
CIR
FDR
Figure 5. Fatigue Cracking Performance Comparison Curves

17
Fatigue Cracking Performance Curve Comparison
0%
20%
40%
60%
80%
100%
120%
140%
160%
180%
0 1 2 3 4 5 6 7 8 9 10 11
Years following Construction
Fa
tig
ue
Cra
ckin
g (
% o
f P
rec
on
.)
Cold PlaneLevelCIRFDR
End of Study Life
Figure 6. Percent of Preconstruction Fatigue Cracking Performance Comparison Curves
According to the information provided in Table 5, FDR projects display the most amount of fatigue cracking over time as compared to the other pavement treatments while CIR pavements were found to exhibit the least amount of fatigue cracking. Additional fatigue cracking was anticipated for the cold plane and level projects as these treatments do not address structural deficiencies that may exist in the subbase or underlying subgrade. However, the thickness of an overlay is often determined by the structural carrying capacity required to sustain projected future traffic loadings. In addition, as CIR and FDR roadway segments exhibited roughly the same amount of preconstruction cracking, FDR projects were expected to display the least amount of fatigue cracking as they are intended to correct structural inadequacies. This finding may be due to the variability of the specified FDR treatments as reclaim depths fluctuated between a minimum and maximum of 4” to 10”, respectively. Comparatively, the Nevada Department of Transportation recommends a reclaim depth between 8” to 12” incorporating existing pavement and subbase materials (1). Like CIR, many of the FDR projects incorporated into this study were in their infancy. All treatments display nonlinear rates of deterioration. When examining the performance of the treatments with respect to preconstruction conditions, CIR and FDR projects generally outperform cold plane and level roadway segments and have yet to meet or exceed preconstruction conditions at 39.6% and 82.2% ten years following construction, respectively. Unfortunately, level projects were found to exceed the amount of fatigue cracking prior to construction at approximately 6.8 years
18
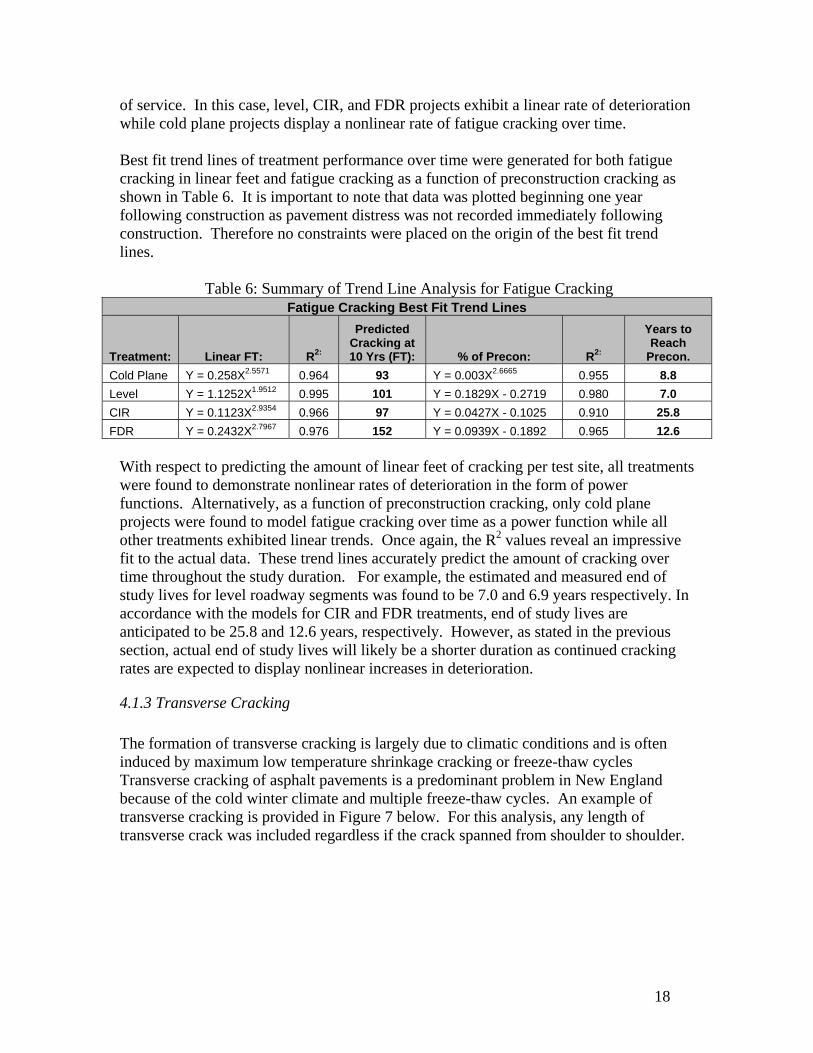
of service. In this case, level, CIR, and FDR projects exhibit a linear rate of deterioration while cold plane projects display a nonlinear rate of fatigue cracking over time. Best fit trend lines of treatment performance over time were generated for both fatigue cracking in linear feet and fatigue cracking as a function of preconstruction cracking as shown in Table 6. It is important to note that data was plotted beginning one year following construction as pavement distress was not recorded immediately following construction. Therefore no constraints were placed on the origin of the best fit trend lines.
Table 6: Summary of Trend Line Analysis for Fatigue Cracking Fatigue Cracking Best Fit Trend Lines
Treatment: Linear FT: R2:
Predicted Cracking at 10 Yrs (FT): % of Precon: R2:
Years to Reach
Precon.
Cold Plane Y = 0.258X2.5571 0.964 93 Y = 0.003X2.6665 0.955 8.8
Level Y = 1.1252X1.9512 0.995 101 Y = 0.1829X - 0.2719 0.980 7.0
CIR Y = 0.1123X2.9354 0.966 97 Y = 0.0427X - 0.1025 0.910 25.8
FDR Y = 0.2432X2.7967 0.976 152 Y = 0.0939X - 0.1892 0.965 12.6
With respect to predicting the amount of linear feet of cracking per test site, all treatments were found to demonstrate nonlinear rates of deterioration in the form of power functions. Alternatively, as a function of preconstruction cracking, only cold plane projects were found to model fatigue cracking over time as a power function while all other treatments exhibited linear trends. Once again, the R2 values reveal an impressive fit to the actual data. These trend lines accurately predict the amount of cracking over time throughout the study duration. For example, the estimated and measured end of study lives for level roadway segments was found to be 7.0 and 6.9 years respectively. In accordance with the models for CIR and FDR treatments, end of study lives are anticipated to be 25.8 and 12.6 years, respectively. However, as stated in the previous section, actual end of study lives will likely be a shorter duration as continued cracking rates are expected to display nonlinear increases in deterioration.
4.1.3 Transverse Cracking
The formation of transverse cracking is largely due to climatic conditions and is often induced by maximum low temperature shrinkage cracking or freeze-thaw cycles Transverse cracking of asphalt pavements is a predominant problem in New England because of the cold winter climate and multiple freeze-thaw cycles. An example of transverse cracking is provided in Figure 7 below. For this analysis, any length of transverse crack was included regardless if the crack spanned from shoulder to shoulder.

19
Figure 7. Typical Thermal Cracking
Table 7 summarizes the average amount of preconstruction cracking per treatment type. Please note that outliers have not been removed from this data set.
Table 7: Transverse Cracking Summary
Preconstruction Thermal Cracking Summary in LF/100 FT Test Section
Treatment # of Test
Sites Average Standard Deviation
Overall 298 101.4 77.0 Cold Plane 33 104.5 61.3
Level 147 93.6 78.5 CIR 37 121.8 51.9 FDR 81 96.2 82.6
The amount of preconstruction transverse cracking is fairly consistent across all treatment types with an average of 101.4 feet per 100’ test site. The amount of transverse cracking within the CIR test sites is slightly higher at 121.8 feet although this deviation is not that significant. Based upon the width of transverse cracks, they may either be repaired or replaced through crack sealing or removing and replacing the cracked pavement with an overlay. Therefore, each of the treatment types within this study should address transverse cracking to some extent. In addition, transverse cracks generally originate from the underlying subbase and subgrade soils. It may be surmised that subbase and base course treatments, such as full depth reclamation, may significantly reduce the onset and rate of thermal cracking. However, these treatments are more expensive and may not be warranted. Figures 8 and 9 display graphical time series plots of comparative treatment performance over time with respect to the average amount of fatigue cracking in terms of linear feet per test site and as a function of the amount of preconstruction cracking, respectively.

20
Transverse Cracking Performance Comparison Curve
0
10
20
30
40
50
60
70
80
90
100
0 1 2 3 4 5 6 7 8 9 10 11
Years following Construction
Cra
ckin
g (
LF
/100
FT
)
Cold Plane
LevelCIR
FDR
Figure 8. Transverse Cracking Performance Comparison Curves
Transverse Cracking Performance Comparsion Curve
0%
20%
40%
60%
80%
100%
120%
140%
160%
0 1 2 3 4 5 6 7 8 9 10 11
Years Following Construction
Cra
ckin
g (
% o
f P
rec
on
)
Cold PlaneLevel
CIRFDR
End of Study Life
Figure 9. Percent Transverse Cracking Performance Comparison Curves
21
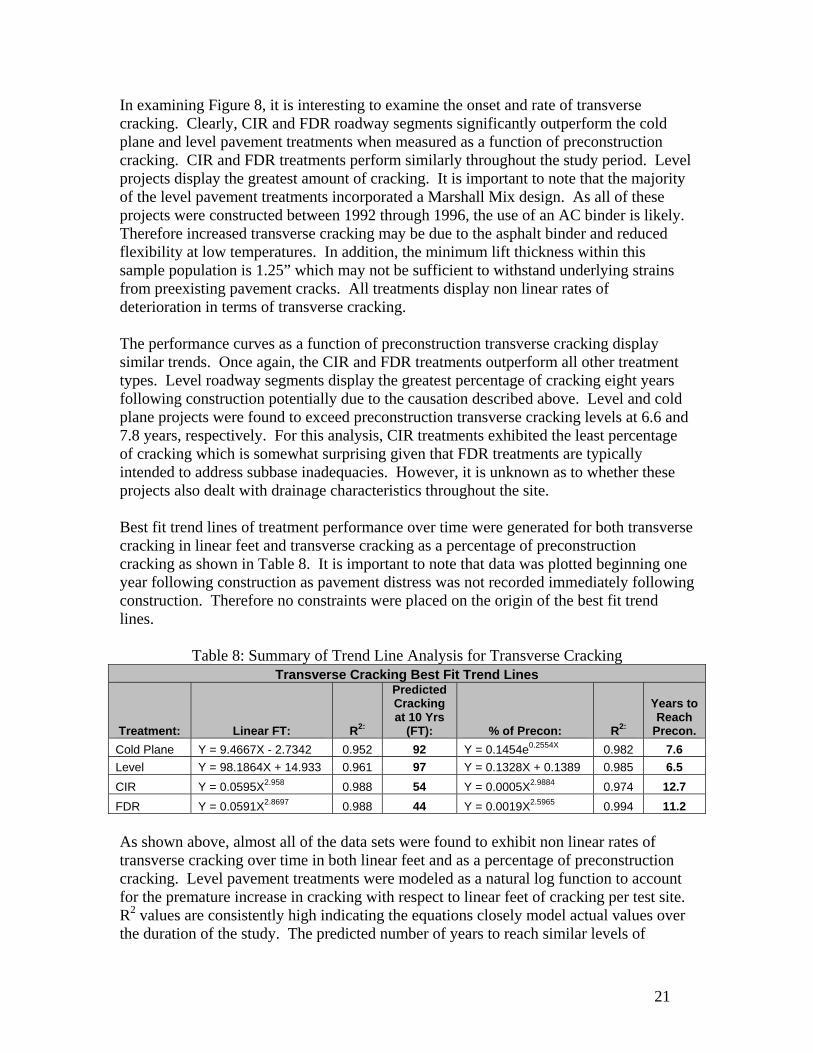
In examining Figure 8, it is interesting to examine the onset and rate of transverse cracking. Clearly, CIR and FDR roadway segments significantly outperform the cold plane and level pavement treatments when measured as a function of preconstruction cracking. CIR and FDR treatments perform similarly throughout the study period. Level projects display the greatest amount of cracking. It is important to note that the majority of the level pavement treatments incorporated a Marshall Mix design. As all of these projects were constructed between 1992 through 1996, the use of an AC binder is likely. Therefore increased transverse cracking may be due to the asphalt binder and reduced flexibility at low temperatures. In addition, the minimum lift thickness within this sample population is 1.25” which may not be sufficient to withstand underlying strains from preexisting pavement cracks. All treatments display non linear rates of deterioration in terms of transverse cracking. The performance curves as a function of preconstruction transverse cracking display similar trends. Once again, the CIR and FDR treatments outperform all other treatment types. Level roadway segments display the greatest percentage of cracking eight years following construction potentially due to the causation described above. Level and cold plane projects were found to exceed preconstruction transverse cracking levels at 6.6 and 7.8 years, respectively. For this analysis, CIR treatments exhibited the least percentage of cracking which is somewhat surprising given that FDR treatments are typically intended to address subbase inadequacies. However, it is unknown as to whether these projects also dealt with drainage characteristics throughout the site. Best fit trend lines of treatment performance over time were generated for both transverse cracking in linear feet and transverse cracking as a percentage of preconstruction cracking as shown in Table 8. It is important to note that data was plotted beginning one year following construction as pavement distress was not recorded immediately following construction. Therefore no constraints were placed on the origin of the best fit trend lines.
Table 8: Summary of Trend Line Analysis for Transverse Cracking Transverse Cracking Best Fit Trend Lines
Treatment: Linear FT: R2:
Predicted Cracking at 10 Yrs
(FT): % of Precon: R2:
Years to Reach
Precon.
Cold Plane Y = 9.4667X - 2.7342 0.952 92 Y = 0.1454e0.2554X 0.982 7.6
Level Y = 98.1864X + 14.933 0.961 97 Y = 0.1328X + 0.1389 0.985 6.5
CIR Y = 0.0595X2.958 0.988 54 Y = 0.0005X2.9884 0.974 12.7
FDR Y = 0.0591X2.8697 0.988 44 Y = 0.0019X2.5965 0.994 11.2
As shown above, almost all of the data sets were found to exhibit non linear rates of transverse cracking over time in both linear feet and as a percentage of preconstruction cracking. Level pavement treatments were modeled as a natural log function to account for the premature increase in cracking with respect to linear feet of cracking per test site. R2 values are consistently high indicating the equations closely model actual values over the duration of the study. The predicted number of years to reach similar levels of
22
preconstruction cracking of 7.6 and 6.5 years for cold plane and level projects very closely correlates to actual values. The predicted end of study lives for CIR and FDR roadway segments also appear to be reasonable.
4.1.4 Reflective Cracking
Reflective cracking is often defined as the propagation of cracks from the existing pavement layer into the newly constructed pavement treatment. Since cold plane treatments include the removal and/or replacement of the existing pavement structure, the onset and rate of reflective cracking is anticipated to be a reduced amount compared to less invasive pavement treatments. Additionally, the propagation of reflective cracks is also a function of the amount of preconstruction cracking. For example, a roadway segment with a greater amount of preconstruction cracking would be expected to exhibit a greater amount of reflective cracking following construction as compared to another roadway segment that received the same treatment. Please refer to Table 3 for a summary of the average amount of total cracking per treatment prior to construction. Reflective cracking was deciphered by overlaying the preconstruction data on top of the post construction data and counting the length of cracks that appear to be similar in location and overall length. However, there is a great deal of variability within the pavement surveys due to the nature of the data collection process, typically involving a large variation in field personnel, who may have differing personal interpretations. Figures 10 and 11 display graphical time series plots of comparative treatment performance over time with respect to the average amount of fatigue cracking in terms of linear feet per test site and as a function of the amount of preconstruction cracking, respectively.

23
Reflective Cracking Performance Curve Comparison
0
10
20
30
40
50
60
70
0 1 2 3 4 5 6 7 8 9 10 11
Years following Construction
Re
flec
tive
Cra
ckin
g (
LF
/100
FT
)
Cold Plane
Level
Figure 10. Reflective Cracking Performance Comparison Curves
Reflective Cracking Performance Curve Comparsion
0%
5%
10%
15%
20%
25%
0 1 2 3 4 5 6 7 8 9 10 11
Years following Construction
Ref
lect
ive
Cra
ckin
g (
% o
f P
reco
n. T
ota
l C
rac
kin
g)
Cold Plane
Level
Figure 11. Percent Reflective Cracking Performance Comparison Curves
24
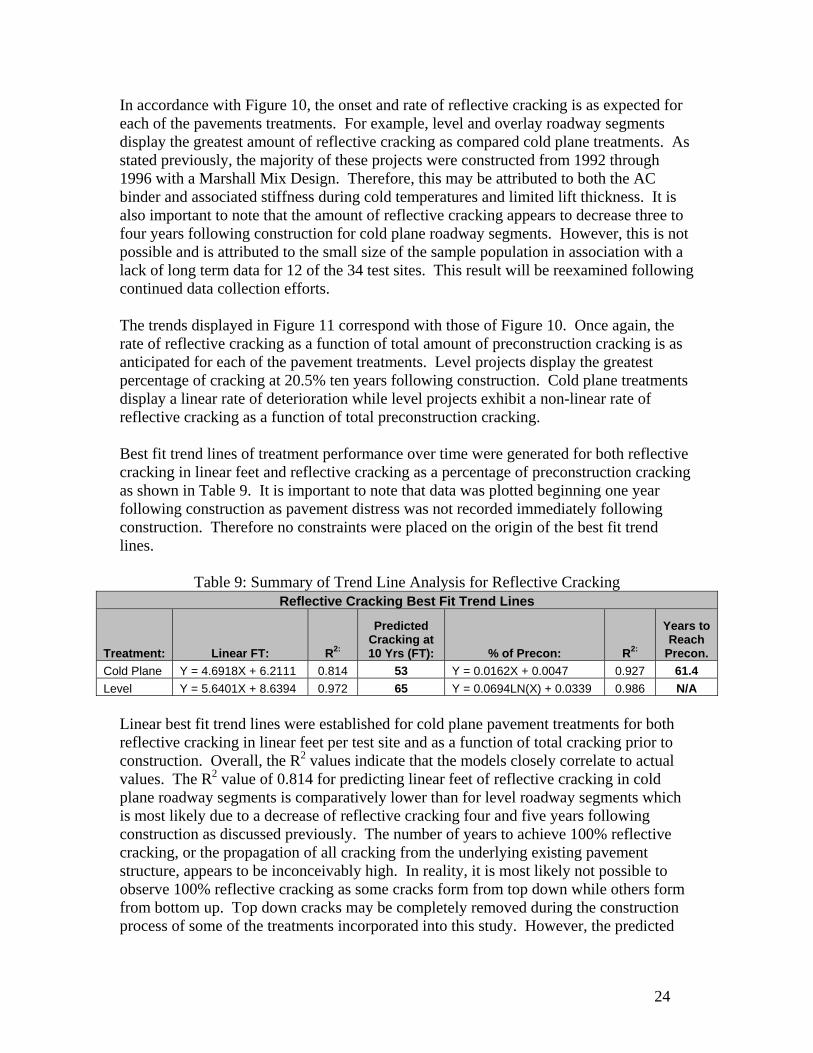
In accordance with Figure 10, the onset and rate of reflective cracking is as expected for each of the pavements treatments. For example, level and overlay roadway segments display the greatest amount of reflective cracking as compared cold plane treatments. As stated previously, the majority of these projects were constructed from 1992 through 1996 with a Marshall Mix Design. Therefore, this may be attributed to both the AC binder and associated stiffness during cold temperatures and limited lift thickness. It is also important to note that the amount of reflective cracking appears to decrease three to four years following construction for cold plane roadway segments. However, this is not possible and is attributed to the small size of the sample population in association with a lack of long term data for 12 of the 34 test sites. This result will be reexamined following continued data collection efforts. The trends displayed in Figure 11 correspond with those of Figure 10. Once again, the rate of reflective cracking as a function of total amount of preconstruction cracking is as anticipated for each of the pavement treatments. Level projects display the greatest percentage of cracking at 20.5% ten years following construction. Cold plane treatments display a linear rate of deterioration while level projects exhibit a non-linear rate of reflective cracking as a function of total preconstruction cracking. Best fit trend lines of treatment performance over time were generated for both reflective cracking in linear feet and reflective cracking as a percentage of preconstruction cracking as shown in Table 9. It is important to note that data was plotted beginning one year following construction as pavement distress was not recorded immediately following construction. Therefore no constraints were placed on the origin of the best fit trend lines.
Table 9: Summary of Trend Line Analysis for Reflective Cracking Reflective Cracking Best Fit Trend Lines
Treatment: Linear FT: R2:
Predicted Cracking at 10 Yrs (FT): % of Precon: R2:
Years to Reach
Precon.
Cold Plane Y = 4.6918X + 6.2111 0.814 53 Y = 0.0162X + 0.0047 0.927 61.4
Level Y = 5.6401X + 8.6394 0.972 65 Y = 0.0694LN(X) + 0.0339 0.986 N/A
Linear best fit trend lines were established for cold plane pavement treatments for both reflective cracking in linear feet per test site and as a function of total cracking prior to construction. Overall, the R2 values indicate that the models closely correlate to actual values. The R2 value of 0.814 for predicting linear feet of reflective cracking in cold plane roadway segments is comparatively lower than for level roadway segments which is most likely due to a decrease of reflective cracking four and five years following construction as discussed previously. The number of years to achieve 100% reflective cracking, or the propagation of all cracking from the underlying existing pavement structure, appears to be inconceivably high. In reality, it is most likely not possible to observe 100% reflective cracking as some cracks form from top down while others form from bottom up. Top down cracks may be completely removed during the construction process of some of the treatments incorporated into this study. However, the predicted

25
amount of time until 100% reflective cracking is achieved does supply comparative values for each treatment.
4.2 Rutting
Rutting is generally caused by permanent deformation within any of the pavement’s layers or subgrade and is usually caused by consolidation or lateral movement (shoving) of the materials due to traffic loading. Rutting may occur in the wearing surface as a result of insufficient compaction or subgrade as a result of insufficient pavement structure. Ruts may contribute to hydroplaning during rain events based on depth and intensity of rainfall. As stated previously, a rut gauge was utilized to quantify the overall depth of ruts within each test section. All measurements were recorded onto a standard field form in ⅛” increments. It is important to note that this procedure is highly subjective due to the nature of the data collection procedure. A photograph of standard rut measurement collection is provided in Figure 12.
Figure 12. Rut Data Collection
Rut performance curves were generated in terms of inches of rut depth and as a function of rut depths prior to construction. For the latter analysis, the amount of rutting per year was divided by the amount of preconstruction rutting for each test site and 50’ interval in order to standardize the data sets. Prior to initiating the analysis process, all rut values were carefully examined. In some instances, rut depths were less than that of the previous year which is highly unlikely unless a “rut fill” occurred over a test site. These discrepancies were addressed by plotting the depth of rut over time to identify general trends. Any rut depths that did not appear to follow the general trend were modified and denoted in blue font within the database. Then each data set was examined for outliers in the same manner as the cracking database. An outlier was defined for this study as any rutting value per test site greater than three standard deviations away from the mean for a particular pavement treatment. If an outlier was identified in any given year for a test site, then all associated rutting values were removed. For example, if an outlier was identified three years following construction within a test site along a CIR roadway segment, all of the information for that test site was removed from the sample population.
26
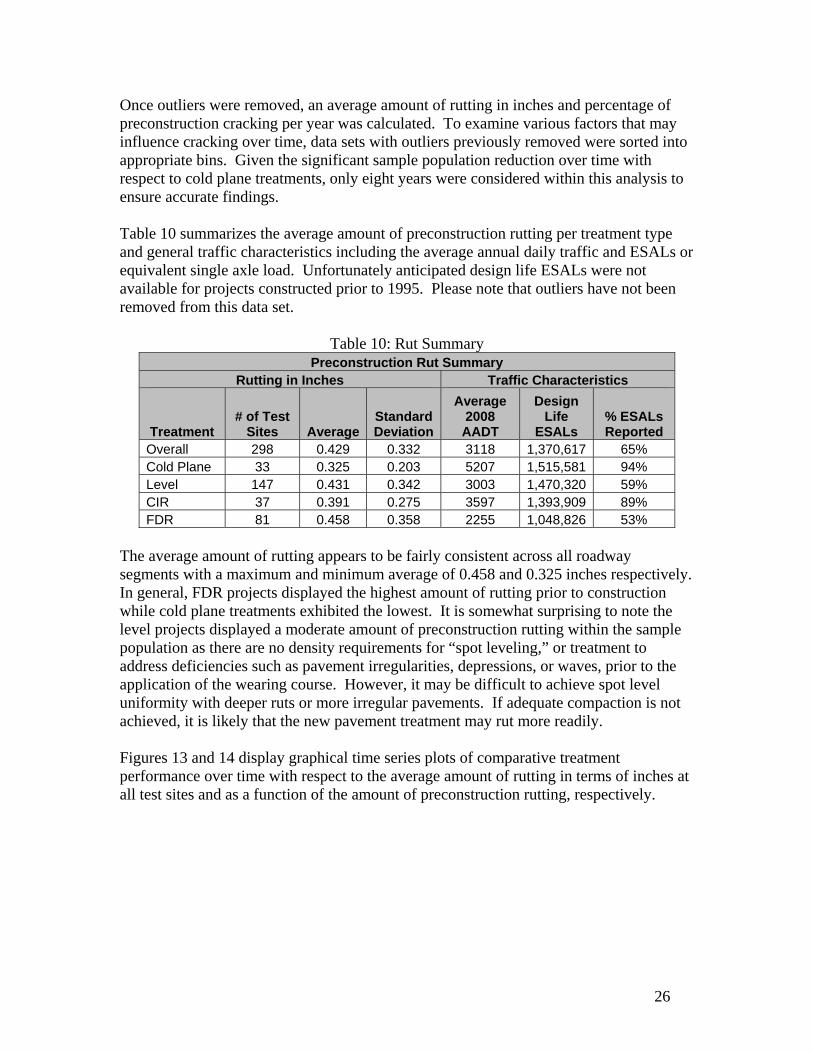
Once outliers were removed, an average amount of rutting in inches and percentage of preconstruction cracking per year was calculated. To examine various factors that may influence cracking over time, data sets with outliers previously removed were sorted into appropriate bins. Given the significant sample population reduction over time with respect to cold plane treatments, only eight years were considered within this analysis to ensure accurate findings. Table 10 summarizes the average amount of preconstruction rutting per treatment type and general traffic characteristics including the average annual daily traffic and ESALs or equivalent single axle load. Unfortunately anticipated design life ESALs were not available for projects constructed prior to 1995. Please note that outliers have not been removed from this data set.
Table 10: Rut Summary Preconstruction Rut Summary
Rutting in Inches Traffic Characteristics
Treatment # of Test
Sites AverageStandard Deviation
Average 2008 AADT
Design Life
ESALs % ESALs Reported
Overall 298 0.429 0.332 3118 1,370,617 65% Cold Plane 33 0.325 0.203 5207 1,515,581 94% Level 147 0.431 0.342 3003 1,470,320 59% CIR 37 0.391 0.275 3597 1,393,909 89% FDR 81 0.458 0.358 2255 1,048,826 53%
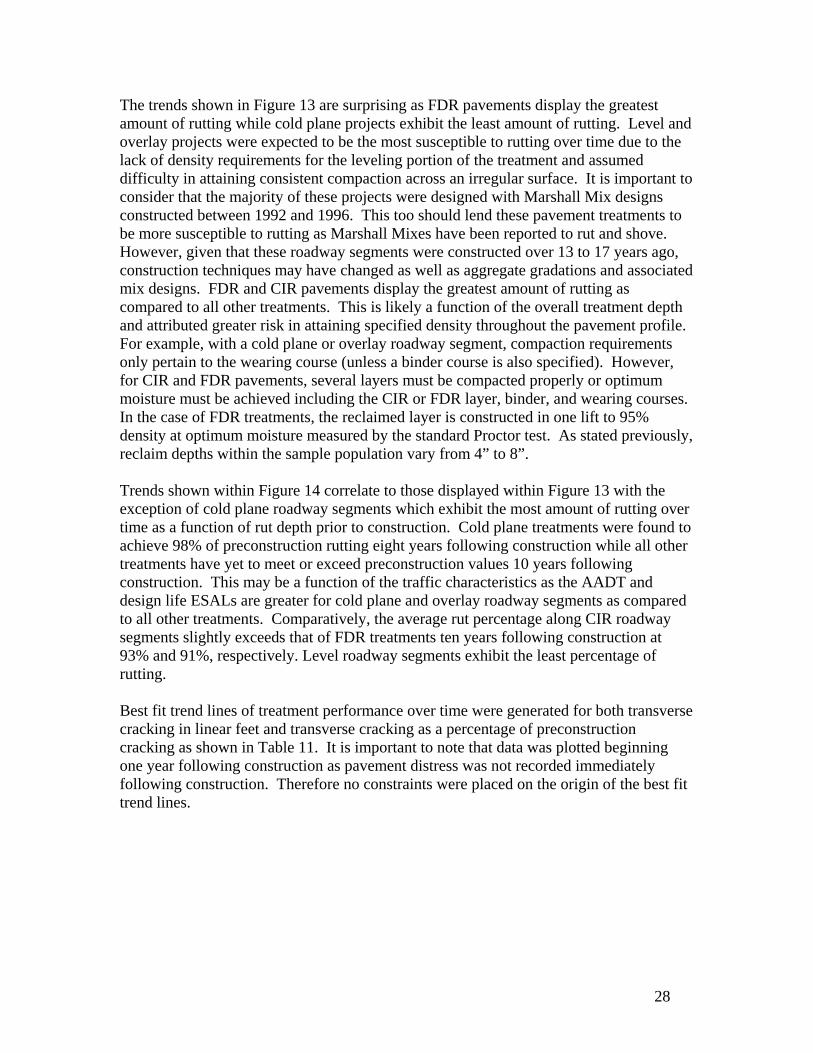
The average amount of rutting appears to be fairly consistent across all roadway segments with a maximum and minimum average of 0.458 and 0.325 inches respectively. In general, FDR projects displayed the highest amount of rutting prior to construction while cold plane treatments exhibited the lowest. It is somewhat surprising to note the level projects displayed a moderate amount of preconstruction rutting within the sample population as there are no density requirements for “spot leveling,” or treatment to address deficiencies such as pavement irregularities, depressions, or waves, prior to the application of the wearing course. However, it may be difficult to achieve spot level uniformity with deeper ruts or more irregular pavements. If adequate compaction is not achieved, it is likely that the new pavement treatment may rut more readily. Figures 13 and 14 display graphical time series plots of comparative treatment performance over time with respect to the average amount of rutting in terms of inches at all test sites and as a function of the amount of preconstruction rutting, respectively.
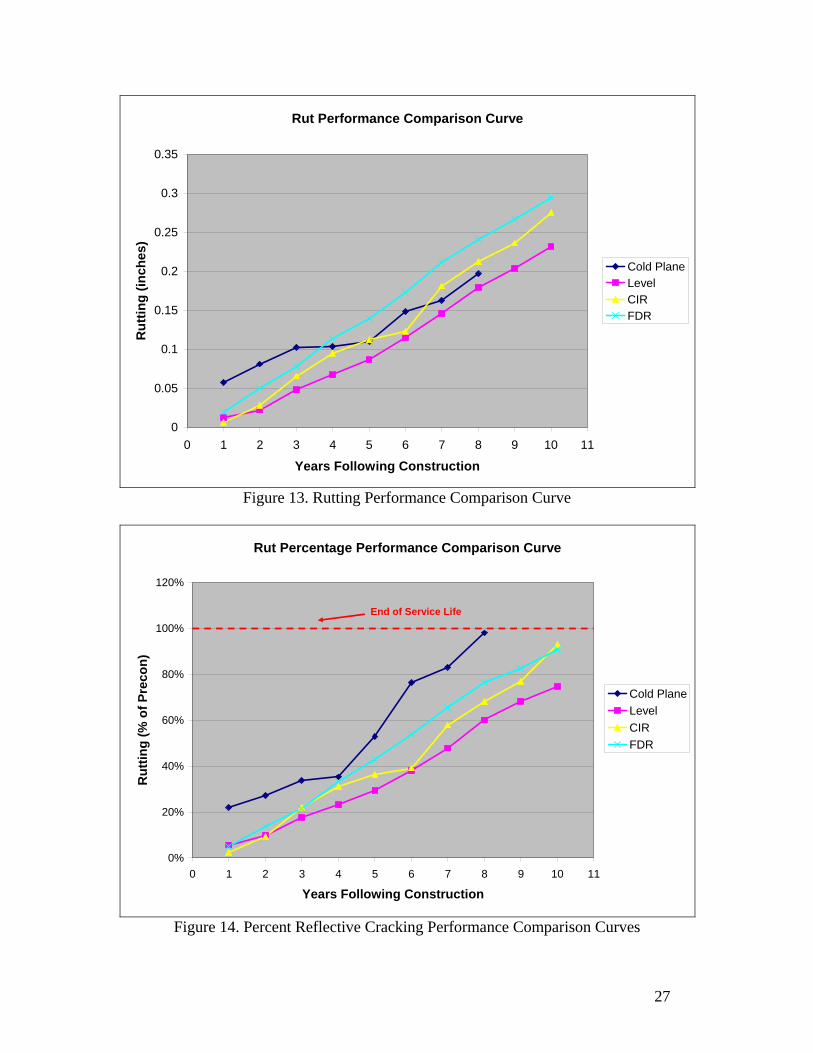
27
Rut Performance Comparison Curve
0
0.05
0.1
0.15
0.2
0.25
0.3
0.35
0 1 2 3 4 5 6 7 8 9 10 11
Years Following Construction
Ru
ttin
g (
inc
hes
)
Cold Plane
Level
CIRFDR
Figure 13. Rutting Performance Comparison Curve
Rut Percentage Performance Comparison Curve
0%
20%
40%
60%
80%
100%
120%
0 1 2 3 4 5 6 7 8 9 10 11
Years Following Construction
Ru
ttin
g (
% o
f P
reco
n)
Cold Plane
Level
CIR
FDR
End of Service Life
Figure 14. Percent Reflective Cracking Performance Comparison Curves
28
The trends shown in Figure 13 are surprising as FDR pavements display the greatest amount of rutting while cold plane projects exhibit the least amount of rutting. Level and overlay projects were expected to be the most susceptible to rutting over time due to the lack of density requirements for the leveling portion of the treatment and assumed difficulty in attaining consistent compaction across an irregular surface. It is important to consider that the majority of these projects were designed with Marshall Mix designs constructed between 1992 and 1996. This too should lend these pavement treatments to be more susceptible to rutting as Marshall Mixes have been reported to rut and shove. However, given that these roadway segments were constructed over 13 to 17 years ago, construction techniques may have changed as well as aggregate gradations and associated mix designs. FDR and CIR pavements display the greatest amount of rutting as compared to all other treatments. This is likely a function of the overall treatment depth and attributed greater risk in attaining specified density throughout the pavement profile. For example, with a cold plane or overlay roadway segment, compaction requirements only pertain to the wearing course (unless a binder course is also specified). However, for CIR and FDR pavements, several layers must be compacted properly or optimum moisture must be achieved including the CIR or FDR layer, binder, and wearing courses. In the case of FDR treatments, the reclaimed layer is constructed in one lift to 95% density at optimum moisture measured by the standard Proctor test. As stated previously, reclaim depths within the sample population vary from 4” to 8”. Trends shown within Figure 14 correlate to those displayed within Figure 13 with the exception of cold plane roadway segments which exhibit the most amount of rutting over time as a function of rut depth prior to construction. Cold plane treatments were found to achieve 98% of preconstruction rutting eight years following construction while all other treatments have yet to meet or exceed preconstruction values 10 years following construction. This may be a function of the traffic characteristics as the AADT and design life ESALs are greater for cold plane and overlay roadway segments as compared to all other treatments. Comparatively, the average rut percentage along CIR roadway segments slightly exceeds that of FDR treatments ten years following construction at 93% and 91%, respectively. Level roadway segments exhibit the least percentage of rutting. Best fit trend lines of treatment performance over time were generated for both transverse cracking in linear feet and transverse cracking as a percentage of preconstruction cracking as shown in Table 11. It is important to note that data was plotted beginning one year following construction as pavement distress was not recorded immediately following construction. Therefore no constraints were placed on the origin of the best fit trend lines.

29
Table 11: Summary of Trend Line Analysis for Rutting Rutting Best Fit Trend Lines
Treatment: Rut Depth (inches): R2:
Predicted Rutting at 10 Yrs (in): % of Precon: R2:
Years to Reach
Precon.
Cold Plane Y = 0.0553e0.1579X 0.953 0.27 Y = 0.1705e0.2248X 0.974 7.9
Level Y = 0.0106X1.3354 0.993 0.23 Y = 0.0492X1.1663 0.992 13.2
CIR Y = 0.0296X - 0.0291 0.988 0.27 Y = 0.0969X - 0.0973 0.982 11.3
FDR Y = 0.0311X - 0.0123 0.999 0.30 Y = 0.0992X - 0.0602 0.997 10.7
As shown above, rut depth in inches and as a function of preconstruction rutting was modeled as linear, power and exponential functions. The R2 values are close to one, indicating that the models closely correlate to actual values. As shown within the figures above, FDR and cold plane projects display the greatest amount of rutting while predicted amount of rutting 10 years following construction is equivalent for both cold plane and CIR treatments. Cold plane projects are anticipated to meet or exceed preconstruction rut depths 7.9 years following construction while level projects are expected to exceed these values in 13.2 years.
4.3 Variables Effecting Pavement Performance
As discussed previously, there is a large amount of variability between and along roadway segments, including soil types, traffic stream, roadway structure type and pavement characteristics including mix design, lift thickness, etc. Each of these variables likely contributes to the performance of the wearing surface. Therefore, several variables were examined to discern any associated effects on pavement performance. Through this process, the sample populations for each treatment type were sorted by various categories described previously and associated average cracking per year in terms of linear feet of cracking per test site and as a function of preconstruction conditions was calculated. Prior to initiating this process, correlation matrixes were generated in a statistical software package to aid in the identification of explanatory variables. Unfortunately, this method did not identify any strong correlations. This is likely due to the small size of the sample population. As variables are binned for each characteristic, the size of the sample population continues to decrease, resulting in increased variability for the test results.
4.3.1 Pavement Design
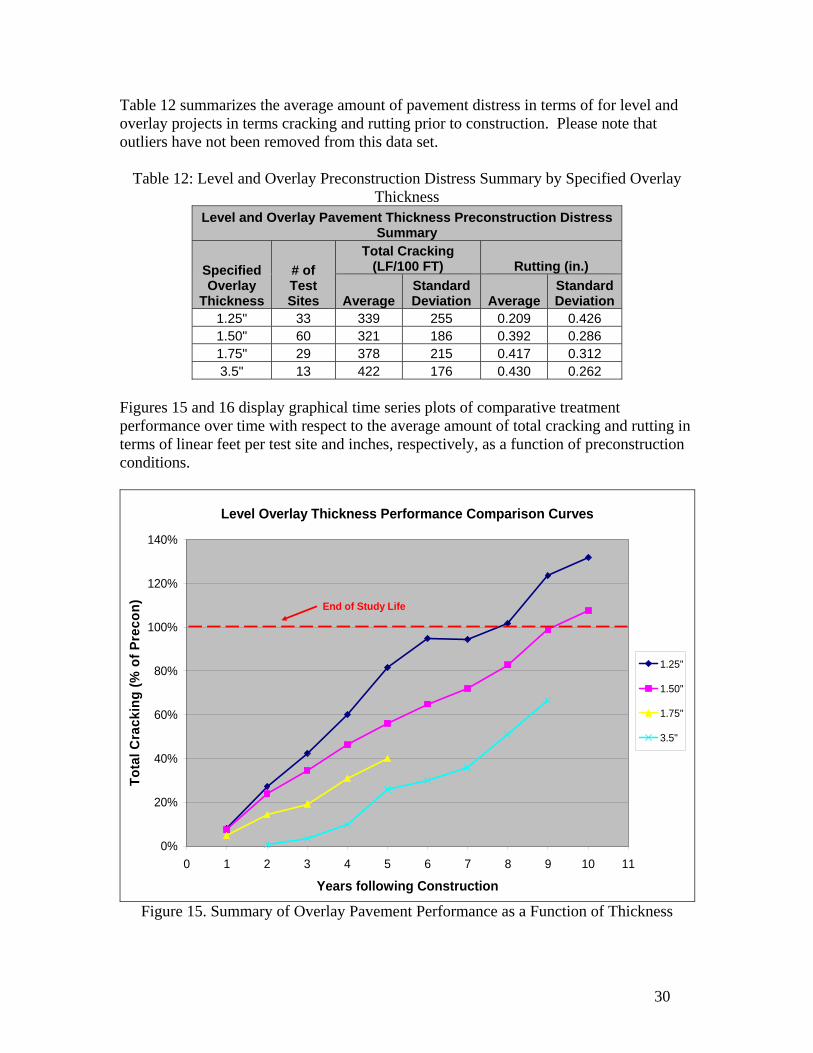
It is well known that the design of a pavement structure may impact pavement distress over time. Currently, pavements are designed for environmental conditions and traffic loading. The thickness of a pavement is often dictated by the future projected traffic stream over a certain period time. In an effort to explore pavement performance as a function of pavement thickness, the largest roadway treatment sample population, overlays, was appropriately binned into the following categories: 1.25”, 1.50” 1.75” and 3.5”. The average amount of total cracking and rutting per year as a function of preconstruction conditions was calculated.
30
Table 12 summarizes the average amount of pavement distress in terms of for level and overlay projects in terms cracking and rutting prior to construction. Please note that outliers have not been removed from this data set.
Table 12: Level and Overlay Preconstruction Distress Summary by Specified Overlay Thickness
Level and Overlay Pavement Thickness Preconstruction Distress Summary
Specified Overlay
Thickness
# of Test Sites
Total Cracking (LF/100 FT) Rutting (in.)
AverageStandard Deviation Average
Standard Deviation
1.25" 33 339 255 0.209 0.426 1.50" 60 321 186 0.392 0.286 1.75" 29 378 215 0.417 0.312 3.5" 13 422 176 0.430 0.262
Figures 15 and 16 display graphical time series plots of comparative treatment performance over time with respect to the average amount of total cracking and rutting in terms of linear feet per test site and inches, respectively, as a function of preconstruction conditions.
Level Overlay Thickness Performance Comparison Curves
0%
20%
40%
60%
80%
100%
120%
140%
0 1 2 3 4 5 6 7 8 9 10 11
Years following Construction
To
tal C
rack
ing
(%
of
Pre
con
)
1.25"
1.50"
1.75"
3.5"
End of Study Life
Figure 15. Summary of Overlay Pavement Performance as a Function of Thickness

31
Level and Overlay Rutting Performance Curves as a function of Pavement Thickness
0%
10%
20%
30%
40%
50%
60%
70%
80%
0 1 2 3 4 5 6 7 8 9 10 11
Years Following Construction
Ru
ttin
g (
% o
f P
rec
on
)
1.25"
1.50"
1.75"
3.5"
Figure 16. Summary of Overlay Rutting Performance as a Function of Thickness
The trends displayed in Figure 15 are as anticipated. Level and overlay roadway segments designed and constructed as thicker composites display longer lives. For example, bituminous pavements with specified overlay thicknesses of 1.25” and 1.50” were found to meet or exceed the amount of total preconstruction cracking eight to nine years following construction. While the data sets are small for pavements depths of 1.75” and 3.5”, it would appear that these composites outperform the thinner pavement structures. It is likely that the amount of total current cracking will not meet or exceed preconstruction conditions within a ten year period following construction. It is important to note that data are only provided through years five and nine for 1.75” and 3.5” pavement overlays, respectively, as the associated sample populations significantly decrease. In the case of overlays designed as 1.75” thick, only 66% of the population remains six years following construction. There are no data for 3.5” pavement ten years following construction. All treatments exhibit fairly linear trends. With respect to rutting as a percentage of preconstruction values, 1.25”, 1.50”, and 1.75”, appear to perform similarly and have yet to meet or exceed the amount of rutting prior to construction ten years following construction. Pavement composites 3.5” thick perform somewhat irregularly which is likely due to the small sample population. However, there does appear to be a significant increase in rutting between two to six years following construction. In an effort to predict end of study lives, best fit trends lines were established for each pavement thickness as shown in Table 12. It is important to note that data was plotted

32
beginning one year following construction as pavement distress was not recorded immediately following construction. Therefore no constraints were placed on the origin of the best fit trend lines. Table 13: Summary of Trend Line Analysis for Level and Overlay Pavement Thickness
Level and Overlay Pavement Thickness Best Fit Trend Line
Treatment Thickness
Total Cracking Rutting
% of Precon: R2:
Years to
Reach Precon. % of Precon: R2:
Years to Reach
Precon.
1.25" Y = 0.1334X + 0.0325 0.970 7.3 Y = 0.0776X - 0.1239 0.945 14.5
1.50" Y = 0.1063X + 0.0099 0.994 9.3 Y = 0.0873X - 0.159 0.969 13.3
1.75" Y = 0.0873X - 0.0422 0.988 11.9 Y = 0.0483X - 0.0025 0.948 20.7
3.5" Y = 0.0926X - 0.2303 0.965 13.3 Y = 0.2502LN(X) + 0.1091 0.915 N/A
All of the predicted study lives with respect to total cracking appear to be reasonable with the exception of pavements with a specified composite thickness of 3.5” as a greater number of years were anticipated. However, this may be the result of the small size of the sample population. Conversely, the results for the other specified thicknesses should be fairly robust as the sample sizes are considered significantly significant. Therefore, 2 additional years of service is anticipated for a 1.50” pavement as compared to a 1.25” pavement as a function of the amount of total cracking prior to construction. Predicted study lives for rutting appear to be somewhat reasonable although longer than would be anticipated. As shown in Figure 16, pavement depths of 1.25” and 1.50” display similar trends over time with comparable rates of deterioration in terms of rutting. Once again, the goodness of fit is close to one indicating that the models closely correlate to actual values. Similar analysis was performed on all other treatment types to examine various aspects including reclaim and cold recycle depths as well as cold plane depth and thicknesses of associated binder and wearing thicknesses. However, due to great deal of variability with respect to these parameters in all specified treatments, resulting sample sizes were too small (less than 30) to be considered statistically significant. Additionally, as many of the pavements are still under examination, there was less than 10 years of continuous data on many of the projects incorporated into the study. In some cases, this resulted in periodic decreases in cracking over time.
4.3.2 Marshall vs. Superpave Pavement Mix Design
In general, Superpave Mix Designs are reported to outperform Marshall Mixes with respect to transverse, or thermal cracking, and rutting due to associated performance graded asphalt binders and aggregate gradations. Therefore, the largest sample population, level and overlay, was sorted by pavement mix type. The average amount of transverse cracking and rutting per year as a function of preconstruction conditions was calculated.

33
Table 14 summarizes the average amount of preconstruction transverse cracking and rutting per treatment type as well as several other characteristics of each sample population including average AADT and pavement thickness. Please note that outliers have not been removed from this data set.
Table 14: Level and Overlay Design Type Preconstruction Summary Level and Overlay Pavement Design Type Preconstruction Summary
Design Type
# of Test Sites
Average AADT:
Average Pavement Thickness
(in.):
Transverse Cracking (LF/100 FT) Rutting (in.)
AverageStandard Deviation Average
Standard Deviation
Marshall 109 2323 1.6 104 83 0.445 0.352 Superpave 38 5840 2.0 80 61 0.392 0.217 Figures 17 and 18 display graphical time series plots of comparative treatment performance over time with respect to the average amount of transverse cracking and rutting in terms of linear feet per test site and inches, respectively, as a function of preconstruction conditions.
Level and Overlay Transverse Cracking Comparison Curves in Terms of Preconstruction Conditions
0%
20%
40%
60%
80%
100%
120%
140%
160%
0 2 4 6 8 10
Years following Construction
Tra
ns
vers
e C
rac
kin
g (
% o
f P
rec
on
)
Marshall
Superpave
End of Study Life
Figure 17. Level and Overlay Transverse Cracking Comparison by Mix Type

34
Level and Overlay Rutting Comparison Curves by Mix Type as a Function of Preconstruction Conditions
0%
20%
40%
60%
80%
100%
120%
0 1 2 3 4 5 6 7 8 9 10 11
Years Following Construction
Ru
ttin
g (
% o
f p
reco
n)
Marshall
Superpave
End of Study Life
Figure 18. Level and Overlay Rutting Comparison by Mix Type
As stated previously, level and overlay paving projects incorporating the Marshall Mix design were constructed between 1992 and 1996. Given the timeframe, these mixes were likely produced with an AC binder while the Superpave Mixes incorporated PG binders. As such, the onset and rate of transverse cracking for level and overlay treatments was anticipated to be greater for Marshall Mixes as compared to Superpave Mixes which was subsequently proven as shown in Figure 17. The increase in transverse cracking for Marshall Mix designs is likely due to the AC binder and lack of flexibility at low temperatures. In addition, the average lift thickness within this sample population is 1.6” as compared to 2.0” for Superpave projects. Thinner pavement sections may not have the ability to withstand underlaying strains produced by underlying preexisting pavement cracks. Surprisingly, level and overlay Superpave Mixes appear to rut more readily as compared to Marshall Mixes. This is highly counterintuitive as PG binders are supposed to account for traffic loading and therefore be less susceptible to rutting. In addition the aggregate matrix developed by highly angular Superpave requirements should reduce rutting. However, the AADT is 2.5 times greater for the Superpave Mix sample population as compared to the Marshall population. This coupled with common complaints with difficulty obtaining compaction during construction likely account for the increased onset and rate of rutting. Finally, the average pavement thickness for the Superpave projects is greater than that Marshall projects as stated in the paragraph above. This also may account for some additional consolidation within the wheel paths following construction.
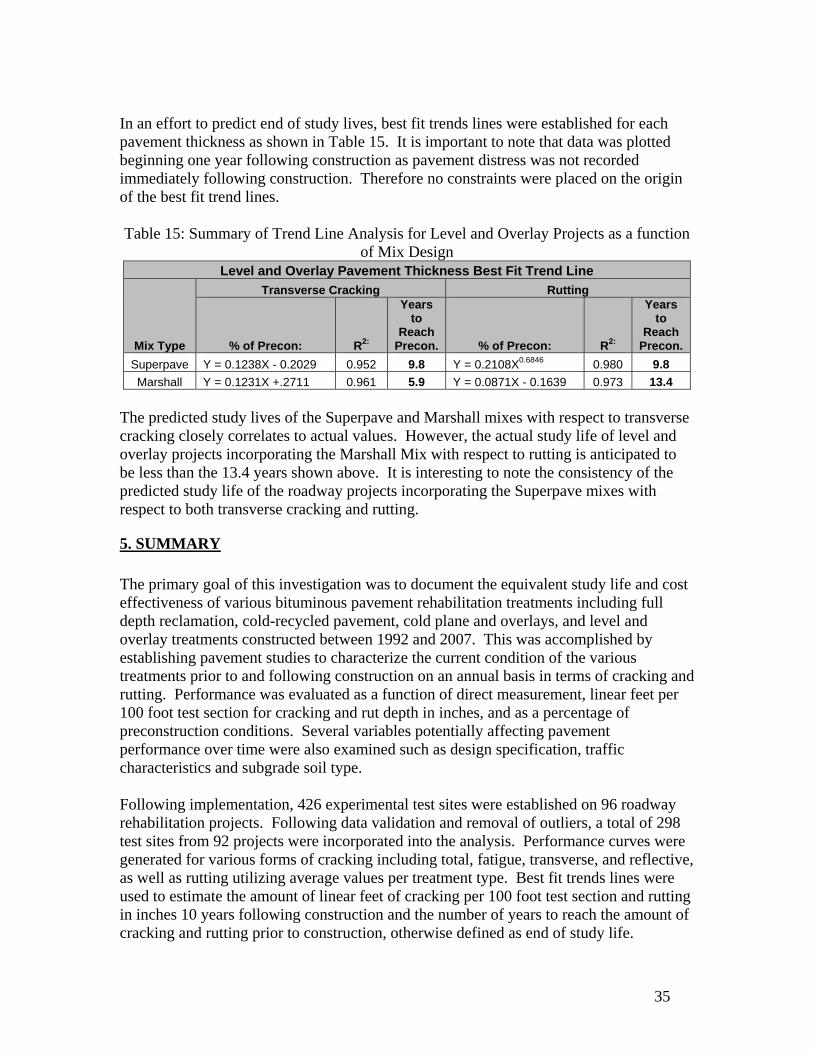
35
In an effort to predict end of study lives, best fit trends lines were established for each pavement thickness as shown in Table 15. It is important to note that data was plotted beginning one year following construction as pavement distress was not recorded immediately following construction. Therefore no constraints were placed on the origin of the best fit trend lines. Table 15: Summary of Trend Line Analysis for Level and Overlay Projects as a function
of Mix Design Level and Overlay Pavement Thickness Best Fit Trend Line
Mix Type
Transverse Cracking Rutting
% of Precon: R2:
Years to
Reach Precon. % of Precon: R2:
Years to
Reach Precon.
Superpave Y = 0.1238X - 0.2029 0.952 9.8 Y = 0.2108X0.6846 0.980 9.8
Marshall Y = 0.1231X +.2711 0.961 5.9 Y = 0.0871X - 0.1639 0.973 13.4
The predicted study lives of the Superpave and Marshall mixes with respect to transverse cracking closely correlates to actual values. However, the actual study life of level and overlay projects incorporating the Marshall Mix with respect to rutting is anticipated to be less than the 13.4 years shown above. It is interesting to note the consistency of the predicted study life of the roadway projects incorporating the Superpave mixes with respect to both transverse cracking and rutting.
5. SUMMARY
The primary goal of this investigation was to document the equivalent study life and cost effectiveness of various bituminous pavement rehabilitation treatments including full depth reclamation, cold-recycled pavement, cold plane and overlays, and level and overlay treatments constructed between 1992 and 2007. This was accomplished by establishing pavement studies to characterize the current condition of the various treatments prior to and following construction on an annual basis in terms of cracking and rutting. Performance was evaluated as a function of direct measurement, linear feet per 100 foot test section for cracking and rut depth in inches, and as a percentage of preconstruction conditions. Several variables potentially affecting pavement performance over time were also examined such as design specification, traffic characteristics and subgrade soil type. Following implementation, 426 experimental test sites were established on 96 roadway rehabilitation projects. Following data validation and removal of outliers, a total of 298 test sites from 92 projects were incorporated into the analysis. Performance curves were generated for various forms of cracking including total, fatigue, transverse, and reflective, as well as rutting utilizing average values per treatment type. Best fit trends lines were used to estimate the amount of linear feet of cracking per 100 foot test section and rutting in inches 10 years following construction and the number of years to reach the amount of cracking and rutting prior to construction, otherwise defined as end of study life.

36
Associated R2 values, or goodness of fit, were close to 1 in all cases indicating a high correlation between actual and modeled values. Overall, fatigue cracking was found to be the most significant form of cracking accounting for approximately 31% of overall cracking 10 years following construction. Roadway segments rehabilitated with level and overlay treatments displayed the greatest amount of transverse and reflective cracking. The average equivalent study life of a level and overlay treatment in terms of total, fatigue and transverse cracking was found to range between 6.5 and 8.7 years. Cold plane and overlay projects exhibited the greatest amount of total cracking with an equivalent study life between 7.6 to 8.8 years Cold recycled treatments displayed less fatigue and transverse cracking as compared to level and overlay and cold plane and overlay projects. The equivalent study life is anticipated to be between 12.7 to 25.8 years. Roadway segments treated with full depth reclamation displayed the least amount of total and transverse cracking. Surprisingly however, full depth reclamation projects exhibited the most amount of fatigue cracking. The average equivalent study life of FDR treatments was found to be between 11.2 to 16.5 years. As with any model, accuracy likely decreases with increases in long term pavement performance estimates. Therefore, the anticipated study lives are expected to be fairly accurate for level and overlay and cold plane rehabilitation treatments. Equivalent study lives for cold recycled and full depth reclamation projects are expected to be less than the predicted values. In terms of rutting, full depth reclamation projects were found to be most susceptible with a modeled rut depth of 0.30 inches 10 years following construction. Roadway segments rehabilitated with level and overlay treatments were found to display the least amount of rutting with a modeled rut depth of 0.23 inches. Associated equivalent study lives for all four treatments, level and overlay, cold plane, cold recycled and full depth reclamation were found to be 13.2, 7.9, 11.3 and 10.7 years respectively. As full depth reclamation treatments are typically utilized to address structural deficiencies, increased fatigue cracking and rutting was not anticipated. However, many of the specified FDR depths constructed prior to 1996 ranged between 4 to 6 inches within the sample population below the 6 to 12 inches recommended by the Nevada Department of Transportation (1) likely reducing optimum pavement performance. The sample population contained a great deal of variability. The majority of projects utilizing standard Marshall Mix designs were constructed between 1992 through 1996 while all projects specifying Superpave Mix Designs were constructed after 1995. In addition, all of these projects were constructed along Vermont and US routes. Generally, the associated pavement structure or more specifically the subgrade and subbase were not engineered. The traffic characteristics also varied across the sample population. Therefore corollary statistics was performed to identify explanatory variables affecting pavement performance overtime. Unfortunately no strong correlations were identified. Level and overlay roadway segments designed and constructed as thicker composites were found to display greater study lives in terms of total cracking and rutting. Level and overlay projects designed with Superpave Mix designs displayed the least amount of transverse cracking and greatest amount of rutting in comparison to those designed with

37
Marshall Mix designs. However, the AADT is 2.5 times greater for the Superpave Mix sample population as compared to the Marshall population. This coupled with common complaints with difficulty obtaining compaction during construction likely account for the increased onset and rate of rutting. While not examined within this study changes in specifications and construction techniques likely influence long term pavement performance. The Vermont Agency of Transportation will continue to monitor these roadway segments until such time when predicted equivalent study lives of each treatment can be verified by field measurements. In addition, an equivalent study life cost analysis will be performed to calculate average life cycle costs. The final report will include subsequent recommendations for the most cost effective treatment for optimum performance with respect to existing conditions on specific highway segments.
38
REFERENCES
1. Bemanian, S., P. Polish, and G. Maurer. Cold In-Place Recycling and Full-Depth
Reclamation Projects by Nevada Department of Transportation. In Transportation Research Record: Journal of the Transportation Research Board, No. 1949, Transportation Research Board of the National Academies, Washington, D.C., 2006, pp. 54-71.
2. Frascoia, R. Work Plan 92-R-16: Performance Life and Annualized Cost of Pavement Rehabilitation Methods. Montpelier: Vermont Agency of Transportation, 1992. Print.
3. Gerbrandt, R. and C. Berthelot. Life-Cycle Economic Evaluation of Alternative Road Construction Methods on Low Volume Roads. In Transportation Research Record: Journal of the Transportation Research Board, No. 1989,Vol. 1, Transportation Research Board of the National Academies, Washington, D.C., 2007, pp. 61-71.
4. Hall, K. T., C. E. Correa, S. H. Carpenter, and R. P. Elliot. Rehabilitation Strategies for Highway Pavements. NCHRP Web Document 35 (Project C1-38): Contractor’s Final Report: Rehabilitation Strategies for Highway Pavements. TRB, National Research Council, Washington, D.C., 2001.
5. Morian, D. A., Y. Zhao, J. Arellano, and D. E. Hali. Asphalt Pavement Rehabilitation Treatment: Analysis of 20 Years of Performance. In Transportation Research Record: Journal of the Transportation Research Board, No. 1905, Transportation Research Board of the National Academies, Washington, D.C., 2005, pp. 36-43.
6. Quintus, H. L. V., J. Mallela, J. Jiang, and M. Buncher. Expected Service Life of Hot-Mix Asphalt Pavements in Long-Term Pavement Performance Program. In Transportation Research Record: Journal of the Transportation Research Board, No. 1990, Transportation Research Board of the National Academies, Washington, D.C., 2007, pp. 102- 110.
7. California Division Pavement Management System. Federal Highway Administration, 13 Nov. 2003. Web. 29 April 2009.
8. Giummarra, G. J., T. Martin, Z. Hoque, and R. Roper. Establishing Deterioration Models for Local Roads in Australia. In Transportation Research Record: Journal of the Transportation Research Board, No. 1989, Vol. 2, Transportation Research Board of the National Academies, Washington, D.C., 2007, pp. 270-276.
9. Vermont Agency of Transportation. Standard Specifications for Construction. 2006.
10. Whiteley, L., S. Tighe, and Z. Zhang. Incorporating Variability onto Pavement Performance, Life-Cycle Cost Analysis, and Performance-Based Specification Pay Factors. In Transportation Research Record: Journal of the Transportation Research Board, No. 1940. Transportation Research Board of the National Academies, Washington, D.C., 2005, pp. 13-20.
11. Strategic Highway Research Program. Distress Identification Manual for the Long-Term Pavement Performance Project. National Academy of Sciences: Washington, DC, 1993.

39
12. AASTHO R 35, “Standard Practice for Superpave Volumetric Design for Hot-Mix Asphalt. Standard Specifications for Transportation Materials and Methods of Sampling and Testing, 27th Edition 2007.
13. AASHTO M 323, “Standard Specification for Superpave Volumetric Mix Design” Standard Specifications for Transportation Materials and Methods of Sampling and Testing, 27th Edition 2007.

40
APPENDIX A
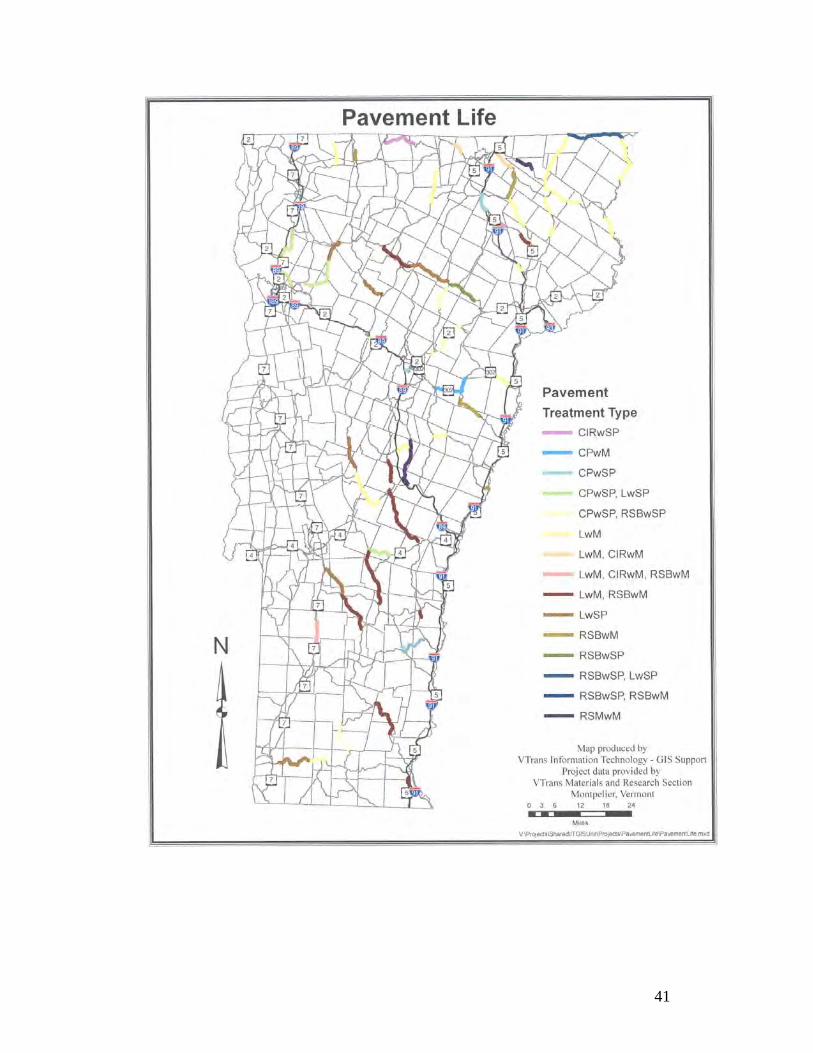
41

42
APPENDIX B
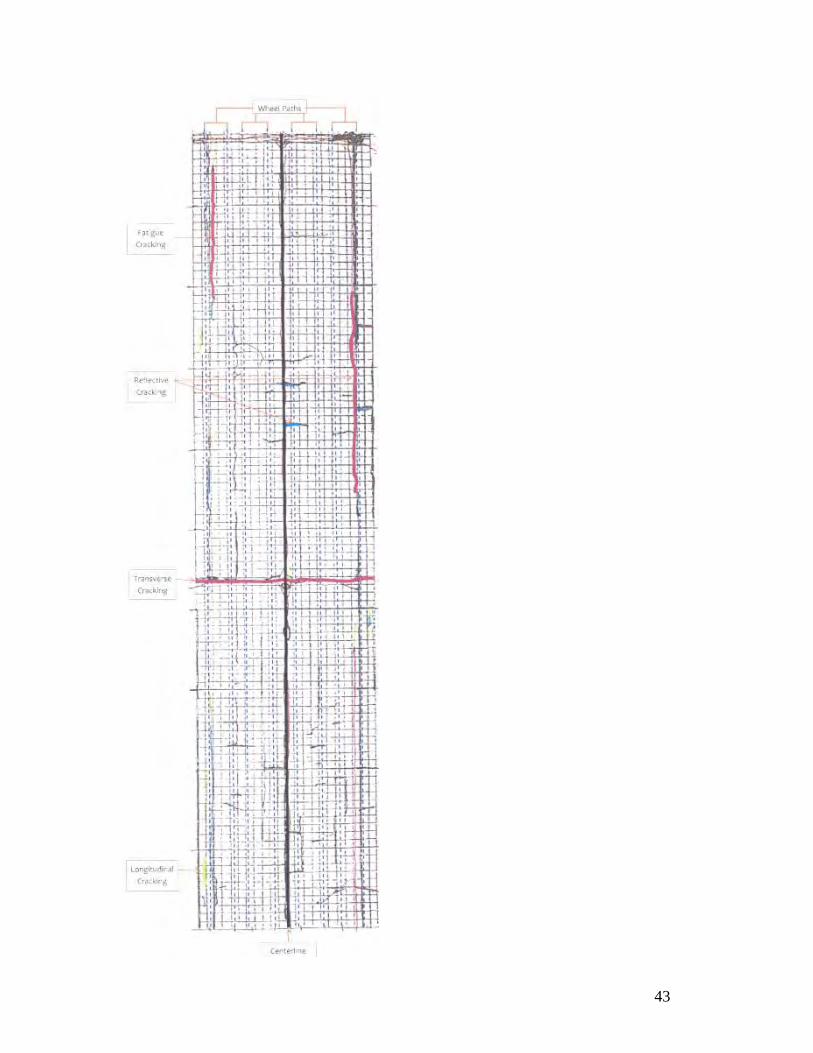
43
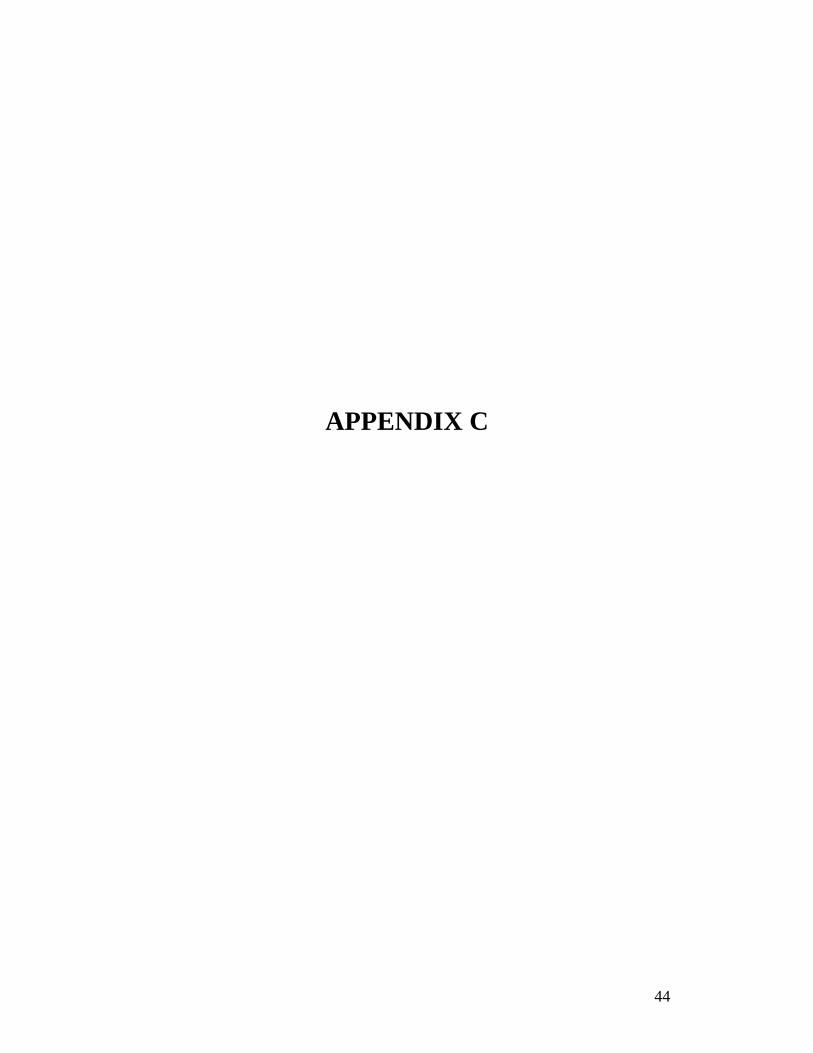
44
APPENDIX C

45
Total Cracking Best Fit Trend Lines
Total Cracking Performance Comparison Curves
CP: y = 16.695e0.3431x
R2 = 0.9216
LV: y = 32.82x - 16.123
R2 = 0.9976
CIR: y = 39.89x - 66.375
R2 = 0.982
FDR: y = 30.19x - 59.246
R2 = 0.95710
50
100
150
200
250
300
350
400
0 1 2 3 4 5 6 7 8 9 10 11
Years Following Construction
Cra
ckin
g (
LF
/10
0 F
T)
Cold Plane
Level
CIR
FDR
Percent of Preconstruction Total Cracking Performance Comparison Curves
CP: y = 0.0439e0.3749x
R2 = 0.9608
LV: y = 0.1195x - 0.0589
R2 = 0.9974
FDR: y = 0.0684x - 0.1294
R2 = 0.9531
CIR: y = 0.057x - 0.092
R2 = 0.97980%
20%
40%
60%
80%
100%
120%
140%
0 1 2 3 4 5 6 7 8 9 10 11
Years following Construction
Cra
ckin
g (
% o
f P
rec
on
)
ColdPlane
Level
CIR
FDR

46
Fatigue Cracking Best Fit Trend Lines
Fatigue Cracking Performance Comparsion Curves
CP: y = 0.258x2.5571
R2 = 0.9639
LV: y = 1.1252x1.9512
R2 = 0.995
CIR: y = 0.1123x2.9354
R2 = 0.9657
FDR: y = 0.2432x2.7967
R2 = 0.9759
0
20
40
60
80
100
120
140
160
0 1 2 3 4 5 6 7 8 9 10 11
Years Following Construction
Fat
igu
e C
rac
kin
g (
LF
/100
FT
)
Cold Plane
Level
CIR
FDR
Precent of Preconstruction Fatigue Cracking Performance Comparison Curves
CP: y = 0.003x2.6665
R2 = 0.955
LV: y = 0.1829x - 0.2719
R2 = 0.9804
FDR: y = 0.0939x - 0.1892
R2 = 0.9651
CIR: y = 0.0427x - 0.1025
R2 = 0.90980%
20%
40%
60%
80%
100%
120%
140%
160%
180%
0 1 2 3 4 5 6 7 8 9 10 11
Years following Construction
Fat
igu
e C
rack
ing
(%
of
Pre
con
.)
Cold Plane
LevelCIRFDR

47
Transverse Cracking Best Fit Trend Lines
Transverse Cracking Performance Comparison Curves
CP: y = 9.4667x - 2.7342
R2 = 0.9521
LV: y = 8.1864x + 14.933
R2 = 0.9607
CIR: y = 0.0595x2.9577
R2 = 0.9885
FDR: y = 0.0591x2.8697
R2 = 0.98830
20
40
60
80
100
120
0 1 2 3 4 5 6 7 8 9 10 11
Years following Construction
Cra
ck
ing
(L
F/1
00
FT
)
Cold PlaneLevelCIR
FDR
Percent of Preconstruction Transverse Cracking Performance Comparsion Curves
CP: y = 0.1454e0.2554x
R2 = 0.9815
LV: y = 0.1328x + 0.1389
R2 = 0.9847
FDR: y = 0.0019x2.5965
R2 = 0.9954
CIR:y = 0.0005x2.9884
R2 = 0.97420%
20%
40%
60%
80%
100%
120%
140%
160%
0 1 2 3 4 5 6 7 8 9 10 11
Years Following Construction
Cra
ck
ing
(%
of
Pre
co
n)
Cold Plane
LevelCIR
FDR

48
Reflective Cracking Best Fit Trend Lines
Reflective Cracking Performance Comparison Curves
CP: y = 4.6918x + 6.2111
R2 = 0.8142
LV: y = 5.6401x + 8.6394
R2 = 0.9717
0
10
20
30
40
50
60
70
0 1 2 3 4 5 6 7 8 9 10 11
Years following Construction
Ref
lect
ive
Cra
ckin
g (
LF
/100
FT
)
Cold Plane
Level
Percent of Preconstruction Reflective Cracking Performance Curve Comparsion
LV: y = 0.0694Ln(x) + 0.0339
R2 = 0.9859
CP: y = 0.0162x + 0.0047
R2 = 0.9273
0%
5%
10%
15%
20%
25%
0 1 2 3 4 5 6 7 8 9 10 11
Years following Construction
Ref
lect
ive
Cra
ckin
g (
% o
f P
reco
n. T
ota
l C
rac
kin
g)
Cold Plane
Level

49
Rut Best Fit Trend Lines
Rut Performance Comparison Curve
CP: y = 0.0553e0.1579x
R2 = 0.9526
LV: y = 0.0106x1.3354
R2 = 0.9931
CIR: y = 0.0296x - 0.0291
R2 = 0.9878
FDR: y = 0.0311x - 0.0123
R2 = 0.9989
0
0.05
0.1
0.15
0.2
0.25
0.3
0.35
0 1 2 3 4 5 6 7 8 9 10 11
Years Following Construction
Ru
ttin
g (
inc
hes
)
Cold PlaneLevel
CIRFDR
Percent of Preconstruction Rut Performance Comparison Curves
CP:y = 0.1705e0.2248x
R2 = 0.9743LV: y = 0.0492x1.1663
R2 = 0.9917
CIR: y = 0.0969x - 0.0973
R2 = 0.9818
FDR: y = 0.0992x - 0.0602
R2 = 0.9969
0%
20%
40%
60%
80%
100%
120%
0 1 2 3 4 5 6 7 8 9 10 11
Years Following Construction
Ru
ttin
g (
% o
f P
rec
on
)
Cold Plane
Level
CIR
FDR
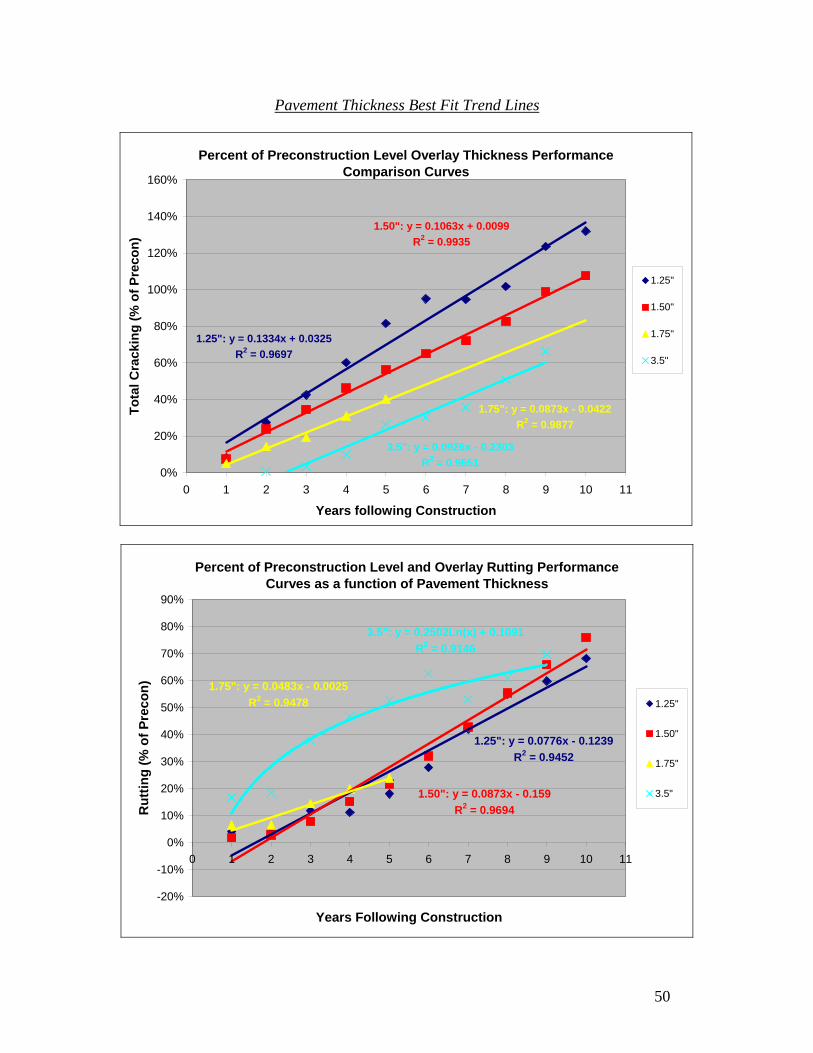
50
Pavement Thickness Best Fit Trend Lines
Percent of Preconstruction Level Overlay Thickness Performance Comparison Curves
1.25": y = 0.1334x + 0.0325
R2 = 0.9697
1.50": y = 0.1063x + 0.0099
R2 = 0.9935
1.75": y = 0.0873x - 0.0422
R2 = 0.9877
3.5": y = 0.0926x - 0.2303
R2 = 0.96510%
20%
40%
60%
80%
100%
120%
140%
160%
0 1 2 3 4 5 6 7 8 9 10 11
Years following Construction
To
tal
Cra
ckin
g (
% o
f P
reco
n)
1.25"
1.50"
1.75"
3.5"
Percent of Preconstruction Level and Overlay Rutting Performance Curves as a function of Pavement Thickness
1.25": y = 0.0776x - 0.1239
R2 = 0.9452
1.50": y = 0.0873x - 0.159
R2 = 0.9694
1.75": y = 0.0483x - 0.0025
R2 = 0.9478
3.5": y = 0.2502Ln(x) + 0.1091
R2 = 0.9146
-20%
-10%
0%
10%
20%
30%
40%
50%
60%
70%
80%
90%
0 1 2 3 4 5 6 7 8 9 10 11
Years Following Construction
Ru
ttin
g (
% o
f P
reco
n)
1.25"
1.50"
1.75"
3.5"
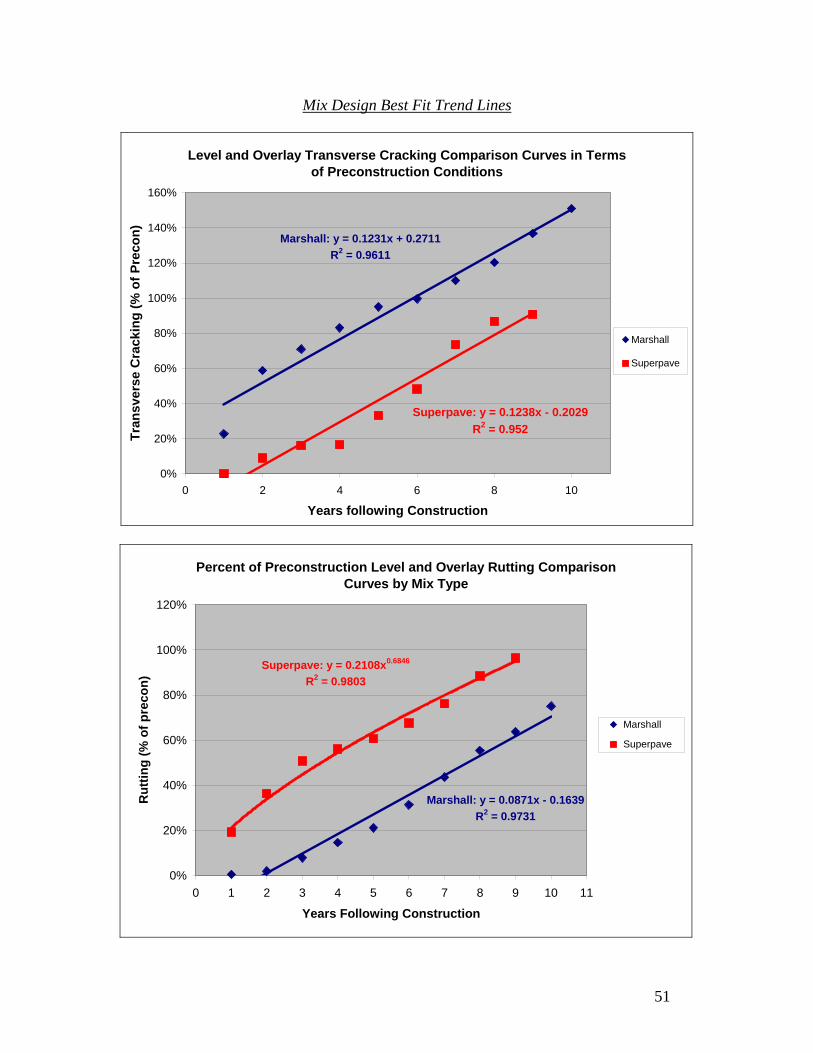
51
Mix Design Best Fit Trend Lines
Level and Overlay Transverse Cracking Comparison Curves in Terms of Preconstruction Conditions
Superpave: y = 0.1238x - 0.2029
R2 = 0.952
Marshall: y = 0.1231x + 0.2711
R2 = 0.9611
0%
20%
40%
60%
80%
100%
120%
140%
160%
0 2 4 6 8 10
Years following Construction
Tra
ns
vers
e C
rack
ing
(%
of
Pre
con
)
Marshall
Superpave
Percent of Preconstruction Level and Overlay Rutting Comparison Curves by Mix Type
Superpave: y = 0.2108x0.6846
R2 = 0.9803
Marshall: y = 0.0871x - 0.1639
R2 = 0.9731
0%
20%
40%
60%
80%
100%
120%
0 1 2 3 4 5 6 7 8 9 10 11
Years Following Construction
Ru
ttin
g (
% o
f p
reco
n)
Marshall
Superpave