the institute for global ethics - administration | … values & ethics survey prepared for the...
TRANSCRIPT
prepared for
Maricopa Community College District Governing Board
by
The Institute for Global Ethics
Rushworth M. Kidder, Ph.D. Paula Mirk, M.A.
with William E. Loges, Ph.D. University of Southern California
in collaboration with
O’Neil Associates, Inc.
© Institute for Global Ethics

Do anything. Be anyone. www.maricopa.edu
Maricopa Values & Ethics Initiative Team
Initiative Chair ~ Rufus Glasper, Ph.D., CPA Initiative Coordinator ~ Lorie O’Brien, M.Ed.
College Site Coordinator ~ Ann Adams Survey Facilitator ~ Helen Backer
To obtain copies, please contact: The Maricopa Community Colleges 2411 West 14th Street Tempe, AZ 85281-6942 Phone: (480) 731-8927 Fax: (480) 731-8928 E-mail: [email protected]

MMaarriiccooppaa VVaalluueess && EEtthhiiccss
SSuurrvveeyy
prepared for The Maricopa Community College District
Governing Board
by The Institute for Global Ethics
Rushworth M. Kidder, Ph.D.
Paula Mirk, M.A.
with
William E. Loges, Ph.D. University of Southern California
in collaboration with O’Neil Associates, Inc.
© Institute for Global Ethics

i
Table of Contents List of Figures and Tables......................................................................................................ii Letter of Transmittal .............................................................................................................iii EXECUTIVE SUMMARY ...................................................................................................1 THE SURVEY.......................................................................................................................4 Values.....................................................................................................................................4
Comparisons to Illinois Community Colleges ...................................................................6 Values and Demographics .................................................................................................6 Values, Politics, and Religion............................................................................................7
Teaching Ethics and Values in the Colleges ..........................................................................8 Value Change .........................................................................................................................9 Moral Boundaries...................................................................................................................13 Sources of Authority..............................................................................................................15
Respondents’ ......................................................................................................................15 Others’ Sources of Authority.............................................................................................16 Sources of Authority and Teaching Ethics ........................................................................17
Resolving Dilemmas..............................................................................................................17 1. Shoplifting Dilemma......................................................................................................17 2. Luddite Dilemma ...........................................................................................................19 3. Cheating Dilemma .........................................................................................................21
Priorities .................................................................................................................................23 CONCLUSIONS....................................................................................................................25 TECHNICAL APPENDIX ....................................................................................................28
MCCD Ethics Surveys: Methodology ...............................................................................28 A Note on Sampling Error .................................................................................................28
THE MARICOPA COMMUNITY COLLEGE DISTRICT ................................................32

ii
List of Figures and Tables
Figure 1: Future Students' Values................................................................................... 10
Figure 2: Respondents' Value Change ............................................................................ 11
Figure 3: Students' Value Change .................................................................................. 11
Table 1. Average ratings for moral values by Maricopa Colleges and General Public. . 5
Table 2. Teaching ethics and values in community colleges. ......................................... 8
Table 2a. Public responses to teaching ethics and values in community colleges. .......... 9
Table 2b. Students’ responses regarding teaching ethics and values in community colleges.............................................................................................................. 9
Table 3. Value change in the future. ............................................................................. 12
Table 3a. Value change in the future—college personnel and students. ........................ 12
Table 4. Others' decisions based on respondent's values. ............................................. 14
Table 5. Sources of authority. ....................................................................................... 15
Table 6. “Most people's” sources of authority. ............................................................. 16
Table 7. Resolutions to the Shoplifting Dilemma. ........................................................ 18
Table 8. Decision principles for the Shoplifting Dilemma. .......................................... 19
Table 9. Resolutions to the Luddite Dilemma. ............................................................. 20
Table 10. Decision principles for the Luddite Dilemma................................................. 20
Table 11. Decision principles for Shoplifting and Luddite Dilemmas. .......................... 21
Table 12. Resolutions to the Cheating Dilemma. ........................................................... 22
Table 13. Decision principles for the Cheating Dilemma............................................... 22
Table 14. Priorities chosen by respondents..................................................................... 23

iii
Maricopa Values and Ethics Initiative (Letter of Transmittal) May 20, 2002 Members of the Maricopa Community College District Governing Board 2411 W. 14th Street Tempe, AZ 85281-6942 Dear Governing Board members,
On behalf of our colleagues on the Chancellor’s Executive Council, we are pleased to transmit the final report of the Maricopa Values and Ethics Survey. The contents of this report are for information purposes; no action is requested from the Board at this time.
In the time since the Maricopa Community College District (Maricopa) was formed from an educational idea that began in downtown Phoenix with a junior college class of 15 students, dramatic changes have taken place locally, nationally and inter-nationally. Since the beginning of the last decade alone, we've witnessed unprecedented population growth throughout our metropolitan communities, in addition to the changing demographics that are making an enormous impact economically, environmentally, and culturally. While it is important to recognize where there has been marked improvement in areas such as civil rights, increased access to higher education, greater awareness of environmental needs, a heightened respect for diversity and a growing interest in ethics, these are often counter balanced by negative scenes of road rage, violence in our schoolrooms, corruption in business practices and in government circles, gang warfare, computer hacking, increasing incidents of juvenile suicide, domestic violence—all of which are generally viewed to be symptomatic of weakening values nationwide. What impact are these changes having on the values of Maricopa, among the employees, and among the students generally?
For more than 80 years, Maricopa's most notable hallmark has been its commitment to serving students well. This is the driving force behind every initiative and, simply, the reason Maricopa exists. Beyond that noble mission, our Governing Board posed big questions for every Maricopan’s consideration: what are the values that establish Maricopa's climate and culture, and influence the way people behave toward one another on a daily basis? What are our leadership models? Do we share a clear set of values for students to emulate? What kind of values fit into today's fast-paced, sometimes cynical and technologically driven society? And who determines what Maricopa's core values should be?

iv
The leadership of the Maricopa Community Colleges has recognized that our long-term success continues to depend in large part on the integrity of our employees and operations. The very nature of our services demands a special relationship of trust with our stakeholders—our students, employees, and the diverse public communities we strive to support. Throughout 1997, the Maricopa Governing Board adopted and amended a series of values statements (Motions # 8626, 8627, 8672, 8673). By February 1999, a strategic conversation was called to order by then Board President Linda B. Rosenthal, who described the evening as “not an attempt to wordsmith the District’s existing Statement of Values, but to discuss how we live those values, and how to strengthen them.” This conversation, in part, stimulated the development of our Strategic Planning Initiative that continues today, and the ultimate involvement of each College in continuing the conversation among its own colleagues and students. Several Colleges have maintained involvement in values exploration by working toward developing and/or refining individual College Values Statements. Additionally, other districtwide initiatives such as the Maricopa Integrated Risk Assessment as well as the Maricopa Values and Ethics Initiative currently include values appraisal at multiple levels across our workplace.
In Spring 2000, we responded to the Governing Board discussion related to Motion #8962: to continue development of a process for ongoing risk assessment and management in our daily operations, and ultimately throughout the entire Maricopa culture, and to also develop a districtwide code of ethics. The Maricopa Values and Ethics Initiative was officially launched. The Institute for Global Ethics (IGE) in Camden, Maine, under the direction of its president and CEO, Dr. Rushworth Kidder, subsequently entered into a contract with us to assist us in this work. By the close of the Fall 2000 semester, a voluntary values survey had been sent to all faculty and staff, and made available to randomly selected students, plus a random telephonic survey of the general public had been conducted. The survey, designed and analyzed by IGE with fieldwork carried out by O’Neil Associates of Tempe, helped identify the basic shared values of these various constituencies. Findings demonstrated deep commonality among the participants and confirmed not only a significant interest in teaching ethics and values on our campuses, but also indicated strong support for doing so among our public. The data from an additional student survey, conducted at all ten Maricopa Colleges during the Spring 2001 semester, was merged with the initial tabulations and are included in this IGE final report.
In February and March 2001, IGE conducted telephonic interviews with 18 administrators, faculty and representatives of other employee groups districtwide. The objective was to understand more deeply some of the findings from the survey data, which were shared in advance in brief form with the interviewees.
In March 2001, a senior member of the IGE team facilitated a three-day Ethics Awareness Workshop for a group of Maricopans from several colleges and the District office. Particular emphasis was placed on brainstorming methods to develop awareness of ethical standards and practices in all phases of Maricopa activities districtwide.
v
Additional efforts to incorporate awareness of ethics and values into daily Maricopa activities included a partnership with the Lincoln Center for Applied Ethics at Arizona State University. By sharing Maricopa college facilities to promote the Lincoln Visiting Scholars program, excellent presentations were made available to our students, faculty, staff and communities.
A significant step toward fulfilling the original Governing Board mandate occurred in May 2001. Dr. Kidder conducted a two-day code-building exercise that included all Governing Board members, the Chancellor, representative members of the Chancellor’s Executive Council, key faculty, and leaders of the various Maricopa employee policy groups. A comprehensive draft of Maricopa Guiding Principles resulted. Participants reported that they were gratified to have participated in a forum that fostered discussion about this topic so meaningfully, at such length, and one that included the top leadership of the organization. The group proposed that the drafted principles be distributed to the campuses for further comment, that those comments be integrated into a redrafting process, and a “final” draft document be submitted to the Board for adoption. Accordingly, focus groups and related discussions and activities were conducted throughout the Fall and Spring semesters at each campus under the direction of the College Presidents and their designees.
Also during the Fall, Dr. Charles R. “Chuck” Novak, President Emeritus of Richland Community College, and continuing Chair of the State-wide Steering Committee of the notable Illinois Leadership and Core Values Initiative (Illinois Community College System) was contracted to present to the Maricopa Executive Retreat held in Prescott, Arizona.
On behalf of the Maricopa Values and Ethics Initiative team, and the entire body of dedicated Maricopa employees, students, and community leaders, we extend sincere gratitude to the Maricopa Community College Governing Board for beginning this Initiative. We are convinced that continuing efforts in this endeavor will create new and valuable relationships between our colleges and the students and communities we serve, and among our internal employee communities, as well. Sincerely, Fred Gaskin Chancellor Rufus Glasper, Ph.D., CPA Vice Chancellor Maricopa Values and Ethics Initiative Chair

1
EXECUTIVE SUMMARY Surveys of faculty, staff, and students at Maricopa Community College, as well as of a sample of the general public in Maricopa County, conducted in the fall of 2000 and the spring of 2001, show the following responses to questions concerning values and ethics. Values The two values most important to those surveyed are responsibility and truth. Other important values include respect, fairness, and freedom. Compassion, which usually features strongly in survey data from the Institute, was lower on the list. The public holds very similar values to those of the college community, although freedom ranks higher on the public’s list. Moral Boundaries When asked, “How often are decisions made by others based on the same values you selected as most important to you?” most participants identified family as the group most likely to use the same values. Second to family came teachers and faculty, followed by people who work at the college in other capacities. Ratings for family were positively associated with conservatism and religiosity, in that the more conservative or religious the participant, the more he or she believes that family uses the same values. The Future About two-thirds of respondents agree, “Most people’s values change over time in response to events in their lives.” Those with incomes below $25,000 seem more apt to agree than others. Education is also negatively correlated with this belief, in that the more highly educated tend to disagree that value change is routine. More highly educated respondents are also more apt to disagree with the statement tha t, ten years after graduation, students’ values are likely to have changed. Slightly over half of those surveyed expect student values will be more diverse ten years from now than they are now. However, only about 15 percent believe that their own values will change very much in the next ten years.
2
Teaching Ethics and Values More than half the respondents agree, “Teaching ethics to students at my college will get more difficult in the coming years.” People who described themselves as conservative—but not very conservative—were notably more likely to believe that teaching ethics will become more difficult. Religiosity was also correlated with this belief. About two-thirds of all respondents agree, “Faculty members at my college know what is considered ethical behavior in most private businesses these days.” Among students, however, the number rose to 83 percent. When asked whether “My community college ought to help students develop values,” four-fifths agree that it should. Among students, however, only 70 percent agree—still a sizeable majority. The strongest agreement to this question came from the public. Responding to a similar question that asked whether “My community college should play a big role in educating students about ethics,” 65 percent of faculty and staff agree, although only 57 percent of students agree. The most conservative respondents also were least likely to agree that the colleges should play a big role in teaching ethics, although more than half of them did agree. Again, the public agreement, at 82 percent, was significantly stronger than that of the college community. Overall, only 21 percent agree that by the time people reach college age it’s too late to teach them ethics. The most conservative respondents were more likely to agree with this statement, but even so only 37 percent agreed. A large majority of faculty (86 percent) says they already help students develop values in their classes. And only 22 percent of faculty express discomfort about incorporating ethics training into their classes. Sources of Authority When asked to rate the importance of various sources of information about what is right and wrong, respondents listed personal experience, family and religion. Personal experience is cited as extremely or very important in shaping their knowledge of right and wrong by over 90 percent overall, but by only 72 percent of conservatives. Resolving Dilemmas Participants were presented with three “right-versus-right” ethical dilemmas. One involved observing a shoplifting and deciding how to respond. The second involved a case of destruction of property in a factory. The last involved an incidence of cheating in a college class. In each case, respondents were asked two questions: what they would choose to do, and which of three principles (corresponding to utilitarian, Kantian, or
3
Golden Rule principles) they would use to justify the ethics of their choice. They were also asked what action they thought others would take in each case. In the first dilemma, participants expressed significantly more willingness to act themselves than they attributed to others, whom they saw as far more willing to do nothing. Students, however, have more faith that others would act. A similar distinction emerges in the second dilemma, where respondents claimed others are seven times more likely to do nothing than are they themselves. Here, however, students believe that others who did choose to act would be harsher in their actions than they themselves would be. The third dilemma, on cheating, shows significant disparities among the respondents. In contrast to the choice made by faculty and staff, twice as many students favor letting the cheater graduate without punishment. Nevertheless, a strong majority in all categories chose to make the student retake the exam (74 percent of faculty/staff, 65 percent of students), and less than one-fifth support expulsion. Across all three dilemmas, several points are consistent:
1. Participants move freely among very different philosophical principles in justifying their decisions in these three dilemmas: It is not true, for example, that “once a utilitarian always a utilitarian.”
2. Values are not a good predictor of the decision principles individuals will choose: There is no correlation between holding a particular set of values and favoring a particular resolution principle.
3. The principle most favored overall is the utilitarian, followed by the Golden Rule, with the Kantian principle coming in as an often distant third.
These findings are consistent with findings from other Institute surveys. Priorities Respondents were asked to choose among five sometimes-competing goals: “personal financial success,” “a satisfying career,” “working in an environment where my ethics are respected,” “marriage and family life,” and “ethics and character development.” The most striking result is the consistent preference for family life over any alternative. To these respondents, character development takes place primarily in the family, and family members share their values more than any other people in their lives. Family life, in many ways, is character development. Also striking is the resounding rejection of financial success when it is compared to any other goal in the list. It is true that students choose financial success more often than the public or college employees, except when they are asked to compare financial success to family life. In that case, they too chose family.

4
“We’re truthful in our dealings, because we’ve
seen what happens when people are not
truthful.” – Faculty member
THE SURVEY In fall of 2000, the Maricopa Community College District in Arizona contracted with an international nonprofit organization, the Institute for Global Ethics, to design and carry out a survey on ethics and values within the community of Maricopa County. Administered by O’Neil Associates of Tempe, this survey captured data from 1,458 members of the Greater Phoenix community, including randomly selected members of the general population, faculty and staff of MCCD, and MCCD students. The survey asked questions about values, moral boundaries, ethical change, the future, the teaching of ethics and values, priorities and sources of authority in determining what is right.? In order to supplement a small student sample in the fall 2000 survey, students at the colleges were surveyed in the spring of 2001, using the identical survey instrument. These students were chosen through a random selection of several classes at each college, and 1,234 returned questionnaires. In general, the spring 2001 student survey tracked very closely to the findings of the fall 2000 survey. It also benchmarks these findings against an earlier survey, using substantially similar questions and methodologies, conducted by the Institute for the Illinois Community Colleges. Titled “Leadership and Values,” that survey was conducted in 1999 by the Gallup Organization (for the general Illinois population) and by the Illinois Community College Board (for the campus populations). That report is available at www.globalethics.org/edu/iccsurvey.html. For further information on the methodology of the survey process, see the Technical Appendix.
Values
Respondents were presented with a list of 14 moral values and asked to rate the importance of each value in their personal lives on a scale from 1 (not very important) to 4 (extremely important). Average ratings for the values ranged from a low of 3.02 (Humility) to a high of 3.75 (Truth). Table 1 reports the average value ratings for all college respondents and a 505-participant sample from the general public in Maricopa County. ? Quotes have been drawn from a series of in -depth background interviews about the survey results with MCCD faculty and administrators.

5
Table 1. Average ratings for moral values by Maricopa Colleges sample and for General Public (Scale: 1 = “Not very important”; 2 = “Moderately important”; 3 = “Very important”; 4 = “Extremely important”.)
Value
Students (n=1103)
Faculty (n=450) and Staff (n=566)
Public (n=505)
Responsibility 3.62 3.72 3.37 Respect 3.60 3.66 3.31 Freedom 3.60 3.58 3.42 Truth 3.58 3.75 3.44 Honor 3.48 3.51 3.34 Fairness 3.43 3.60 3.28 Reverence for Life 3.41 3.53 3.35 Devotion 3.28 3.14 3.07 Compassion 3.20 3.39 3.12 Tolerance 3.19 3.29 2.98 Social Harmony 3.13 3.12 2.82 Preservation of Nature 3.09 3.09 2.88 Generosity 3.08 3.06 2.90 Humility 2.90 3.02 2.84
Table 1. Average ratings for moral values by Maricopa Colleges and General Public.
Although given a four-point scale, for the most part respondents only differentiated between these values on a scale from 3 to 4; that is, from “very important” to “extremely important.” This is not too surprising—it is the nature of values per se that people will consider them all pretty important.
When value ratings of staff and faculty are compared to one another, only two significant differences are observed: Staff rate Truth and Respect higher than faculty rate them.
Students rate Responsibility highest, but Freedom comes a close second for
students, while neither staff nor faculty rate Freedom quite so highly. The only other distinction between students and the other two groups of respondents is that students rate Devotion a little higher. Otherwise, students’ responses result in a list of most to least important that differs very little from the lists in Table 1.
In short, there is a large amount of consensus in the three groups of respondents as
to the relative importance of these values, and as to the general importance of each of these values.
The general public rated every value a bit lower than the college respondents did,
probably indicating a tendency in the public to respond to the scale differently. The
6
The college “is known for its
compassionate attitudes—we stress that.” –Senior administrator
“If there were [a lack of
compassion], enrollments would not be increasing.” –Senior administrator
general distribution from high to low, however, is the same. Truth gets the highest rating from the general public, as it did in the college survey. The general public considered Freedom more important than Responsibility, unlike the college respondents who considered Freedom somewhat less important.
Comparisons to Illinois Community Colleges
The five values most frequently chosen as important in the Illinois survey were Responsibility, Truth, Fairness, Compassion, and Self-Respect. Four of those are in the top five in the Maricopa results (if Self-Respect is interpreted as Respect in the Maricopa survey). Compassion received somewhat less support in Maricopa than in Illinois, and Freedom received more support from the Arizona respondents. In Illinois as in Maricopa, students consider Freedom more important than either staff or faculty do. Generally, the most important values are the same in these two places, particularly the
paramount importance of Responsibility and Truth in both places. (See p. 14 of the “Leadership and Values” report to the ICC.)
Values and Demographics
Some differences could be noted among value choices of the demographic groups. When responses of men and women were compared, women faculty, staff, and students rated all 14 values higher than men, statistically significantly higher for ten values. This may indicate either a genuine higher level of importance of values for women, or a different reaction to the scale on the part of women such that they were reluctant to use the lower ratings. The overall list of values from highest to lowest for men and women did not differ much. The top eight were the same for men and women, with very slight differences among them (e.g., Respect and Fairness were in third and fourth place for women and vice versa for men).
Nonwhite respondents rated Devotion a bit higher (average =
3.25) than white respondents (3.10). There were no other significant differences by ethnicity. There is more consensus here than existed in Illinois, where white and nonwhite respondents evaluated five values differently.
Highly educated people–those with graduate degrees–
reported lower ratings for Devotion, Generosity, and Social Harmony than others. Larger households rated Devotion higher than small households.
Respondents in the higher income brackets rated Preservation of Nature lower and
Truth higher than others.

7
“We will have to give credibility to
other people’s values and ethics as we cement our own values—and that’s going to be hard. We can’t
preach.” –Faculty member
Among the general public, only Fairness was rated differently by white (3.30) and nonwhite (3.06) respondents. While there were other scattered demographic differences, none seem to indicate systematic or remarkable differences.
Values, Politics, and Religion
People who described themselves as more conservative rated Compassion, Preservation of Nature, and Tolerance lower, and Devotion, Freedom, Honor, Reverence for Life, and Truth higher, than self-described liberals. Political moderates rated Generosity, Responsibility, and Social Harmony lower than extreme liberals or extreme conservatives.
Religious respondents rated Compassion, Devotion, Generosity, Honor,
Reverence for Life, and Social Harmony more highly than less religious people. Weekly church attendance was associated with lower ratings for Tolerance, but ratings for Tolerance were not clearly related to overall religiosity. Conversely, ratings for Truth were not associated with church attendance, but strongly religious people rated Truth more highly. Religious liberals (i.e., people who scored highly on measures of religiosity and liberalism) rated Compassion particularly highly. Religious conservatives rated Honor particularly highly.
The relationship between religious belief and practice in
the general public is a bit less clear than for the campuses. Among the public, religious respondents rated ten values higher than the less religious: Compassion, Devotion, Fairness, Generosity, Honor, Humility, Respect, Reverence for Life, Social Harmony, and Truth. (The italicized are not rated more highly by religious people in the colleges). This factor indicates a more general inclination among the religious to rate all values more highly.
As was true of Illinois Community College respondents, demographics do not serve to separate people dramatically by values. Even the consistently higher ratings given the values by women do not seem to indicate a division as much as a different way of reacting to the response scale.
Politics and religion more frequently correlated to the ratings people gave the values. While Truth and Responsibility show up in some of the differences between conservatives and liberals and between the more- and less-religious, most of the values on which these groups differ are not the values considered most important overall. It would be surprising if political and religious beliefs did not translate into different value priorities, but it would be disappointing if politics and religion divided respondents where the core values are concerned. We don’t find much evidence of deep religious and political divide as to the importance of Truth, Responsibility, Respect, and Fairness.
8
“Part of the educational process is to
help [students] become critical thinkers so they
can develop their own sets
of values.” –Dean
Teaching Ethics and Values in the Colleges
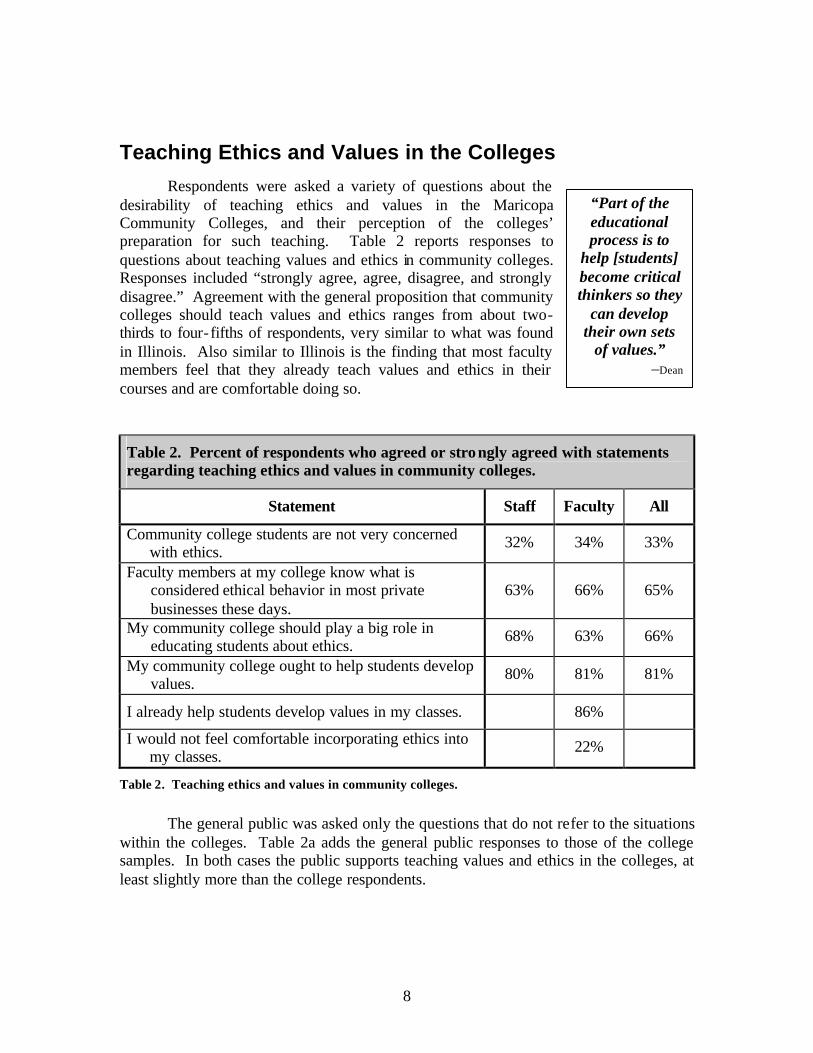
Respondents were asked a variety of questions about the desirability of teaching ethics and values in the Maricopa Community Colleges, and their perception of the colleges’ preparation for such teaching. Table 2 reports responses to questions about teaching values and ethics in community colleges. Responses included “strongly agree, agree, disagree, and strongly disagree.” Agreement with the general proposition that community colleges should teach values and ethics ranges from about two-thirds to four-fifths of respondents, very similar to what was found in Illinois. Also similar to Illinois is the finding that most faculty members feel that they already teach values and ethics in their courses and are comfortable doing so.
Table 2. Percent of respondents who agreed or strongly agreed with statements regarding teaching ethics and values in community colleges.
Statement Staff Faculty All
Community college students are not very concerned with ethics.
32% 34% 33%
Faculty members at my college know what is considered ethical behavior in most private businesses these days.
63%
66%
65%
My community college should play a big role in educating students about ethics.
68% 63% 66%
My community college ought to help students develop values.
80% 81% 81%
I already help students develop values in my classes. 86%
I would not feel comfortable incorporating ethics into my classes.
22%
Table 2. Teaching ethics and values in community colleges.
The general public was asked only the questions that do not refer to the situations
within the colleges. Table 2a adds the general public responses to those of the college samples. In both cases the public supports teaching values and ethics in the colleges, at least slightly more than the college respondents.

9
Table 2a. Percent of respondents who agreed [or strongly agreed] with statements regarding teaching ethics and values in community colleges.
Statement Staff Faculty Public
My community college should play a big role in educating students about ethics.
68% 63% 78%
My community college ought to help students develop values.
80% 81% 82%
Table 2a. Public responses to teaching ethics and values in community colleges.
Students have far more confidence than either staff or faculty that their instructors
“know what is considered ethical behavior in most private businesses these days” (see Table 2b). Eighty-three percent of students agree with this statement, compared to only 66 percent of faculty and 63 percent of staff. On the other hand, fewer students than faculty or staff agree with the statement “My community college should play a big role in educating students about ethics.” Only 57 percent of students agree with that, while 63 percent of faculty and 68 percent of staff agree. Similarly, students expressed less agreement with colleges developing students’ values—70 percent of students agree with this compared to about 80 percent of faculty and staff. Also, whereas most faculty would feel comfortable incorporating ethics into their classes, 66 percent of students would be uncomfortable with this. This gap between students and faculty and staff on these issues is very different from the findings in Illinois, where all three samples were nearly indistinguishable in their support for teaching ethics and va lues in the colleges.
Table 2b. Percent of student respondents who agreed [or strongly agreed] with statements regarding teaching ethics and values in community colleges.
Statement Staff Faculty Students
Community college students are not very concerned with ethics.
32% 34% 32%
Faculty members at my college know what is considered ethical behavior in most private businesses these days.
63%
66%
83%
My community college should play a big role in educating students about ethics.
68% 63% 57%
My community college ought to help students develop values.
80% 81% 70%
Table 2b. Students’ responses regarding teaching ethics and values in community colleges.
Value Change Respondents were asked a variety of questions regarding their expectations about
how values would change in the coming years. One question asked respondents to ponder

10
the prospects for increased diversity in the values of students in the colleges ten years from now. Figure 1 illustrates the distribution of responses to the question: “In 10 years I believe the values of students at my college will be (more diverse, less diverse, the same).” Over half the respondents in all three categories expect more diversity in the values students will have in the coming decade. Only about 6 percent expect less diversity. The responses to this question in Illinois produced a very similar distribution of responses. (See p. 27, Figure 2, of the ICC report.)
Figures 2 and 3 provide a comparison between peoples’ expectations about their
own likelihood of changing their value priorities and their expectations about increased value diversity among students. People expect their own values to stay relatively constant, but they expect that the population of students on college campuses will have a greater diversity of value priorities. A similar pattern of responses was observed in Illinois.
Students are more likely than faculty or staff to agree that their own values may
be different in ten years, but 67 percent of students still disagree with this prospect (Table 3a). Students also agree more with the statement that most people’s values change in response to events in their lives—73 percent of students agree with this, about 10 percent more than faculty or staff agree. Also, more students agree that ten years after they graduate students will have different values than those they have now; 68 percent of students agree, as opposed to about 60 percent of faculty and staff. (See Tables 3 and 3a that follow.)
The data in Figures 1 and 3 do not mean that respondents think that students’
values will change, but that they will be more diverse. That is, respondents may well believe that students in the future will have been raised with a greater diversity of values that they then bring to the campus as adults.
Less diverse6%
The same37%
Missing4%
More diverse53%
Figure 1: Future Students' Values

11
Figure 2: Respondents' Value Change
Figure 3: Students' Value Change
12
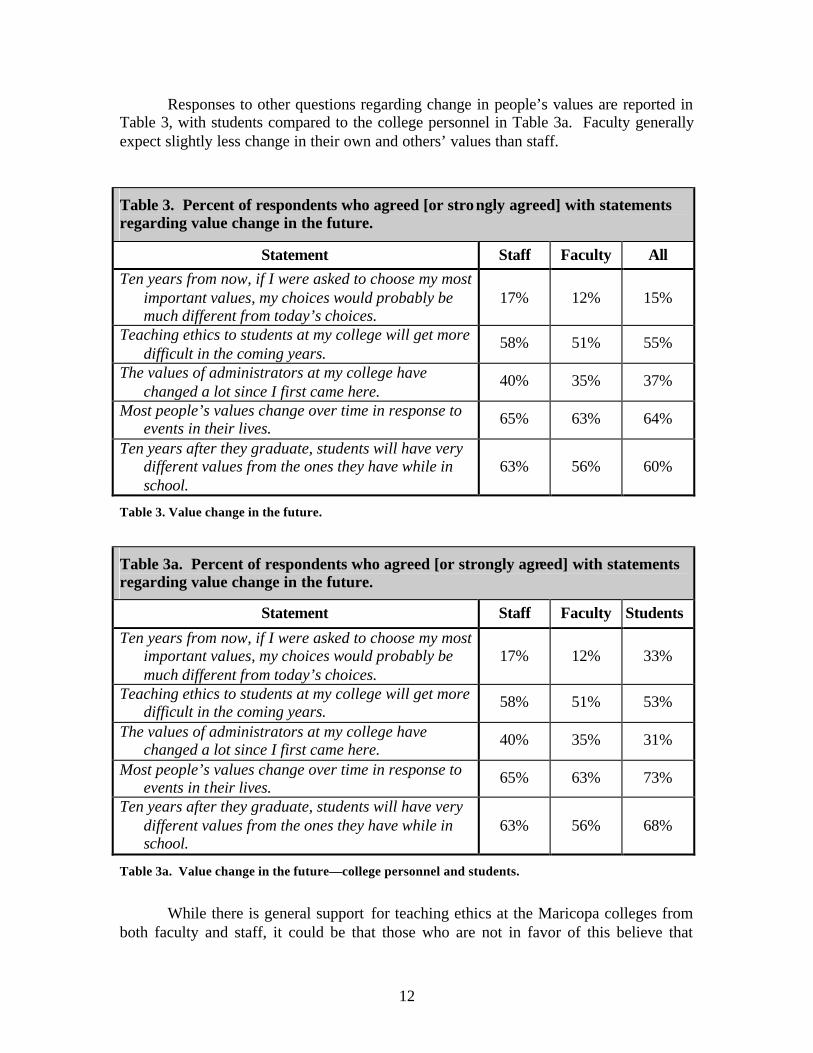
Responses to other questions regarding change in people’s values are reported in Table 3, with students compared to the college personnel in Table 3a. Faculty generally expect slightly less change in their own and others’ values than staff.
Table 3. Percent of respondents who agreed [or strongly agreed] with statements regarding value change in the future.
Statement Staff Faculty All Ten years from now, if I were asked to choose my most
important values, my choices would probably be much different from today’s choices.
17%
12%
15%
Teaching ethics to students at my college will get more difficult in the coming years.
58% 51% 55%
The values of administrators at my college have changed a lot since I first came here.
40% 35% 37%
Most people’s values change over time in response to events in their lives.
65% 63% 64%
Ten years after they graduate, students will have very different values from the ones they have while in school.
63%
56%
60%
Table 3. Value change in the future.
Table 3a. Percent of respondents who agreed [or strongly agreed] with statements regarding value change in the future.
Statement Staff Faculty Students
Ten years from now, if I were asked to choose my most important values, my choices would probably be much different from today’s choices.
17%
12%
33%
Teaching ethics to students at my college will get more difficult in the coming years.
58% 51% 53%
The values of administrators at my college have changed a lot since I first came here.
40% 35% 31%
Most people’s values change over time in response to events in their lives.
65% 63% 73%
Ten years after they graduate, students will have very different values from the ones they have while in school.
63%
56%
68%
Table 3a. Value change in the future—college personnel and students.
While there is general support for teaching ethics at the Maricopa colleges from
both faculty and staff, it could be that those who are not in favor of this believe that

13
“We should embed it in
everything we do, not pause and
say, ‘We’re teaching ethics.’”
–Administrator
values are too subject to change to make it worthwhile. In fact, the strongest correlation with the statement “My community college should play a big role in educating students about ethics” was not with items about future value change or difficulty teaching ethics or diverse values among students in the years to come. The strongest was a negative correlation between agreeing with the “big role” in ethics education and the notion that by the time a person reaches college age it’s too late to teach ethics. It is not change that discourages some from supporting ethical training, it is belief that change in the students is no longer possible where ethics is concerned.
Men and women do not differ either in their support for
teaching values or for their expectations of value change or difficulty teaching values in the future. Nonwhite respondents are more likely to agree that students’ values change ten years after they graduate, but not with any statement about teaching values at the colleges.
People who rated Fairness and Respect highly among the
values agree more strongly that colleges should play a “big role” in teaching ethics. More religious people also expressed stronger agreement with this statement.*
While both Fairness and Respect are core values in Maricopa, they are related to
endorsement of teaching ethics differently from Truth and Responsibility, which garner more general support than Fairness and Respect. Whatever small variable separates people who strongly support Fairness and Respect from the even larger majority that supports Truth and Responsibility, that variable is also associated with greater support for teaching ethics in community colleges.
Moral Boundaries
Respondents were asked how frequently they felt that decisions made by others were based on the same values the respondent considered important. These questions are designed to see how widely respondents feel that others in the social world around them share their values. Responses are summarized in Table 4.
The results in Maricopa are extremely similar to those from Illinois.
Unsurprisingly, both faculty and staff consider their families to be closest to them in the application of similar values. But the overall list from top to bottom replicates almost exactly the results from Illinois, not just in the order in which groups appear, but in the average level of agreement as well.
* Although in Illinois we saw no correlation between values and endorsement of teaching ethics in the colleges, we must remember that we measured things differently in Illinois. Rating a value higher is not the same as choosing it, and thus not choosing some other value in its place. Ratings allow for degrees of endorsement, and the results in Maricopa County show that Fairness and Respect are not just chosen, but favored more by people who favor teaching ethics.
14
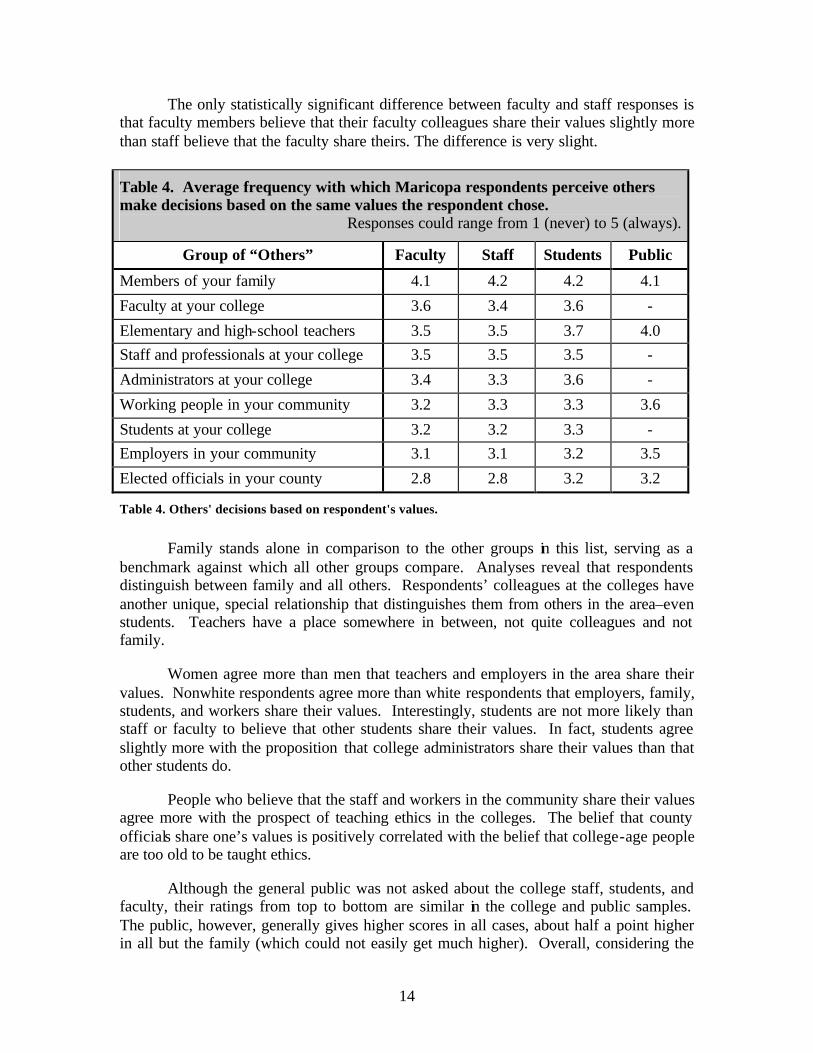
The only statistically significant difference between faculty and staff responses is that faculty members believe that their faculty colleagues share their values slightly more than staff believe that the faculty share theirs. The difference is very slight.
Table 4. Average frequency with which Maricopa respondents perceive others make decisions based on the same values the respondent chose.
Responses could range from 1 (never) to 5 (always).
Group of “Others” Faculty Staff Students Public
Members of your family 4.1 4.2 4.2 4.1
Faculty at your college 3.6 3.4 3.6 -
Elementary and high-school teachers 3.5 3.5 3.7 4.0 Staff and professionals at your college 3.5 3.5 3.5 -
Administrators at your college 3.4 3.3 3.6 -
Working people in your community 3.2 3.3 3.3 3.6
Students at your college 3.2 3.2 3.3 - Employers in your community 3.1 3.1 3.2 3.5
Elected officials in your county 2.8 2.8 3.2 3.2
Table 4. Others' decisions based on respondent's values.
Family stands alone in comparison to the other groups in this list, serving as a
benchmark against which all other groups compare. Analyses reveal that respondents distinguish between family and all others. Respondents’ colleagues at the colleges have another unique, special relationship that distinguishes them from others in the area–even students. Teachers have a place somewhere in between, not quite colleagues and not family.
Women agree more than men that teachers and employers in the area share their
values. Nonwhite respondents agree more than white respondents that employers, family, students, and workers share their values. Interestingly, students are not more likely than staff or faculty to believe that other students share their values. In fact, students agree slightly more with the proposition that college administrators share their values than that other students do.
People who believe that the staff and workers in the community share their values
agree more with the prospect of teaching ethics in the colleges. The belief that county officials share one’s values is positively correlated with the belief that college-age people are too old to be taught ethics.
Although the general public was not asked about the college staff, students, and
faculty, their ratings from top to bottom are similar in the college and public samples. The public, however, generally gives higher scores in all cases, about half a point higher in all but the family (which could not easily get much higher). Overall, considering the

15
students, college employees, and general public, this pattern seems fairly stable. Family seems to be the center of people’s moral boundaries–a finding that IGE reports in all its surveys. K-12 teachers are also held in fairly high regard in this area, which reflects the importance of their jobs where the transmission of values is concerned. Elected officials, by contrast, regularly end up at the bottom, although they still score above the scale’s midpoint (2.5 in this case), and the general public gives them higher ratings than do the college employees.
Sources of Authority
Respondents’
People were asked to rate the importance of a variety of sources of knowledge of right and wrong, or sources of moral authority. Table 5 summarizes their responses for each source.
Table 5. Average importance of sources of authority. Responses could range from 1 (not very important) to 4 (extremely important).
Source of Authority Faculty Staff Students Public
Personal experience in life 3.4 3.6 3.5 3.4
What I have learned from my family 3.4 3.6 3.4 3.3
What my religion has taught me 3.0 3.2 3.2 3.0
What I learned in school 2.6 2.7 2.8 2.8
What I learned at work 2.5 2.6 2.7 2.5
What I have learned from my friends 2.4 2.5 2.6 2.4 What I have learned from the mass
media 1.5 1.6 2.1 1.6
Table 5. Sources of authority.
When the average scores of staff and faculty are compared, all but the difference
for the influence of friends are statistically significant. None of the differences are of particularly high magnitude, however. Statistical significance makes us confident that the differences actually exist in the world. Low magnitude suggests that these differences aren’t that important. In every case, staff gave higher average ratings to every source of authority. This may be an indication that staff and faculty were different in their likelihood to give high scores on these items rather than substantially different in their actual relative estimation of the importance of these sources of authority. Students do not appear to differ from staff and faculty except that they are a bit more likely to credit mass media.
Women gave slightly higher scores to family, friends, and religion. Nonwhite
respondents gave slightly higher scores to experience, the media, and school.
16
The pattern of results in Maricopa is very similar to that in Illinois. The general order of high to low importance is the same (in Illinois family edged personal experience for first place, but not by enough to be significant). The top tier of sources, consisting of experience, family, and religion is the same in both locations, as is the middle tier of school, work, and friends, and the distinctly low marks for the media.
Clearly, the public is not different from college personnel or students. Even the
specific scores are about equa l (unlike values, for instance, where the general pattern is the same but the public uses notably lower scores).
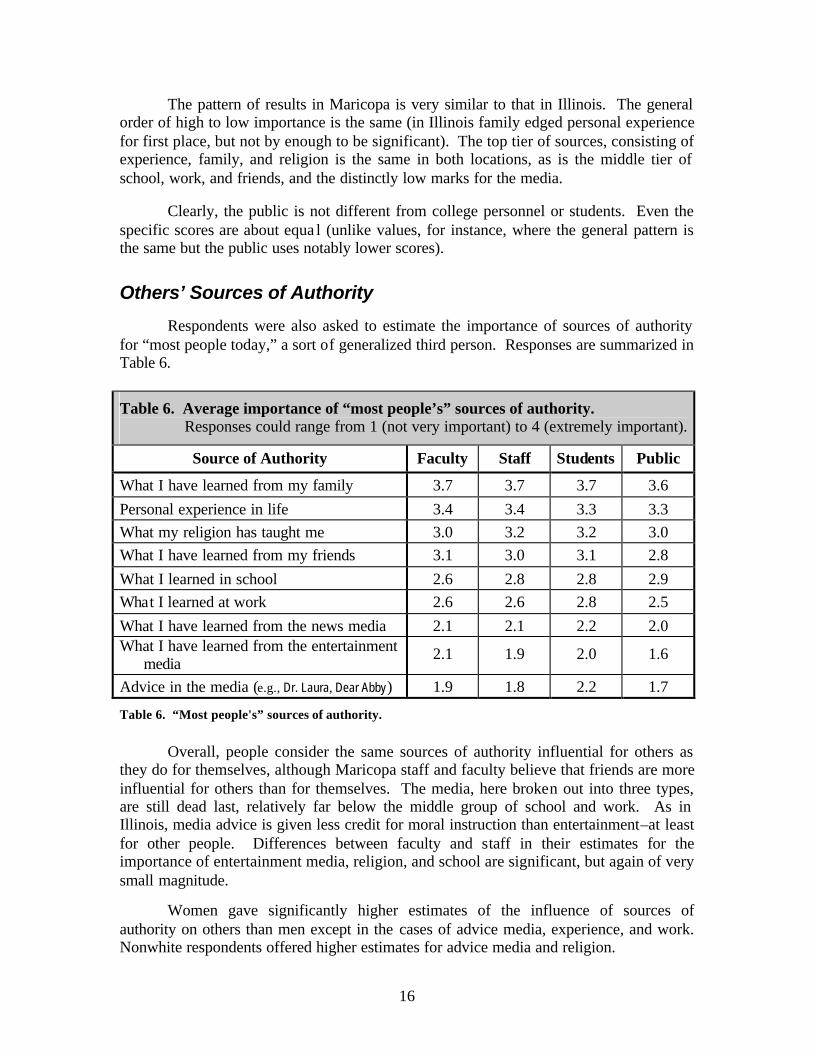
Others’ Sources of Authority
Respondents were also asked to estimate the importance of sources of authority for “most people today,” a sort of generalized third person. Responses are summarized in Table 6.
Table 6. Average importance of “most people’s” sources of authority. Responses could range from 1 (not very important) to 4 (extremely important).
Source of Authority Faculty Staff Students Public
What I have learned from my family 3.7 3.7 3.7 3.6 Personal experience in life 3.4 3.4 3.3 3.3 What my religion has taught me 3.0 3.2 3.2 3.0 What I have learned from my friends 3.1 3.0 3.1 2.8 What I learned in school 2.6 2.8 2.8 2.9 What I learned at work 2.6 2.6 2.8 2.5 What I have learned from the news media 2.1 2.1 2.2 2.0 What I have learned from the entertainment
media 2.1 1.9 2.0 1.6
Advice in the media (e.g., Dr. Laura, Dear Abby) 1.9 1.8 2.2 1.7
Table 6. “Most people's” sources of authority.
Overall, people consider the same sources of authority influential for others as they do for themselves, although Maricopa staff and faculty believe that friends are more influential for others than for themselves. The media, here broken out into three types, are still dead last, relatively far below the middle group of school and work. As in Illinois, media advice is given less credit for moral instruction than entertainment–at least for other people. Differences between faculty and staff in their estimates for the importance of entertainment media, religion, and school are significant, but again of very small magnitude.
Women gave significantly higher estimates of the influence of sources of authority on others than men except in the cases of advice media, experience, and work. Nonwhite respondents offered higher estimates for advice media and religion.

17
“If we were as effective as gangs in educating
people, we’d have dynamite institutions.”
–Respondent
The student survey found substantially similar results. As in their own lives, students give media a little more credit for influenc ing others’ moral education.
Again the pattern in the general public is very similar to the college responses,
except that the public seems even less confident than the college participants that the media influence the views of others.
Sources of Authority and Teaching Ethics People who credited experience, friends, and school for teaching themselves right
from wrong were more likely to agree with the suggestion of teaching ethics in the community colleges. Those crediting religion and school were more likely to agree that colleges should teach values. People who gave credit to their family as sources of moral authority were more likely to agree that people of college age were too old to be taught ethics (perhaps because family is most influential when one is young). People who credit school disagreed that college age people are too old to be taught ethics.
Respondents who thought that other people’s sources of moral authority include
school and work were more supportive of teaching ethics in the colleges. People who thought that others were influenced by advice media were more likely to agree that college comes too late to teach ethics.
Among the general public, there appears to be a solid association between feeling
the importance of teaching values and ethics on the campuses and crediting school as a personal source of authority. Otherwise there are no notable correlations.
In general, people credit their experience and the people
closest to them for showing them right from wrong, and they believe that “most people today” do the same. Generally, this pattern of beliefs is correlated positively with support for teaching ethics and values in the colleges. Only in the case of personally relying on family as a source of authority is this pattern interrupted. This general pattern is similar to the findings in Illinois: There are no big rifts between classes of respondents, and even statistically significant differences are small in magnitude.
Resolving Dilemmas
Respondents from the colleges were asked to resolve three ethical dilemmas. The general public was not asked the dilemmas.
1. Shoplifting Dilemma Your community has been plagued with stealing, and many small shops have had to close recently. At the market one day you see an obviously poor person stealing food. No one else seems aware of what this person is doing. A sign in the store window warns that

18
“The more I got involved, the more I felt people were trying to do the
right thing.” –Administrator
shoplifters will be fully prosecuted. The person sees you and realizes that you know what is happening. The person begs you not to tell.
Respondents were offered four resolutions to this dilemma. Those resolutions and the frequency with which respondents chose them for themselves–or thought that others would choose them–are shown in Table 7.
Table 7. Resolutions to the Shoplifting Dilemma. Figures are the percentage choosing each resolution.
Self Others Resolution Staff &
Faculty
Students Staff & Faculty
Students
Call the manager right away. 22% 20% 13% 23%
Let person go, then tell manager later. 34% 34% 14% 21%
Threaten the person if they’re ever seen again. 26% 26% 4% 9%
Do nothing. 18% 21% 69% 47%
Table 7. Resolutions to the Shoplifting Dilemma.
As in many other cases in which IGE has asked this dilemma, there is a sharp
difference between what people say they would do personally and what they believe others would do. Most starkly, respondents think that other people would do nothing in far greater numbers than they say that they themselves would do nothing in this situation. Additionally, more than six times as many respondents say that they would threaten the shoplifter personally as believe that others would do this–the most dangerous course of action.
Faculty and staff do not differ in the frequency with
which they choose resolutions to this dilemma. Students are more likely to believe that other people would act, although the proportion of choices for others’ actions look about the same. In other words, fewer students believe that others would simply do nothing. Men tend more than women to choose the more justice-oriented responses, calling the manager right away or threatening the person. White respondents are more likely than nonwhites to wait and tell the manager after the person is gone, and nonwhite respondents are more likely to threaten the shoplifter. There were few differences in how respondents thought about the likely actions of others, except that white respondents are more likely than nonwhites to believe others would do nothing, and nonwhites are more likely to believe that others would call the manager right away.
Following their personal resolution to the dilemma, respondents were asked why
they chose that resolution. The decision principles respondents were offered included a utilitarian approach (“This decision would produce the best outcome for the greatest

19
number of people”), a principle based on the categorical imperative of Immanuel Kant (“This decision is what everyone should do in such a situation, regardless of the consequences”), and the Golden Rule (“I would want to be treated this way [if I were the person in the dilemma]”). Responses are reported in Table 8.
Compared to faculty and staff, students were about 7 percent more likely to apply Kantian than utilitarian ideas, and about equally likely to apply the Golden Rule.
Table 8. Decision principles for the Shoplifting Dilemma
Principle Faculty & Staff Students
Utilitarian 43% 35%
Kant 16% 23%
Golden Rule 41% 42%
Table 8. Decision principles for the Shoplifting Dilemma.
There was a logical relationship between decision principles and the resolutions
people chose for this dilemma. Utilitarians tended to favor telling the manager only after the shoplifter got away. People who chose Kant’s principle were most likely to choose calling the manager right away—strictly enforcing the rule. Calling the manager immediately was the least favorite of those who chose the Golden Rule (only six Golden Rule respondents chose that resolution). Instead, people who chose the Golden Rule were more likely to choose to threaten the shoplifter personally.
The importance that respondents attribute to values does not help predict which
resolution or decision principle they will choose for this dilemma. While we did not include this dilemma in Illinois, this lack of a finding is consistent with IGE’s findings in other studies. Values rarely serve as good predictors of dilemma resolutions.
2. Luddite Dilemma You are employed by a company that is replacing many jobs with computerized systems. Even though you are not at risk, fellow employees in your department are losing their jobs. You discover that a good friend of yours is part of a group that is intentionally damaging the computer systems in order to try to save jobs.
The resolutions offered to respondents for this dilemma and the frequency with which they were chosen are detailed in Table 9.

20
Table 9. Resolutions to the Luddite Dilemma. Figures are the percentage choosing each resolution.
Self Others Resolution Staff &
Faculty
Students Staff & Faculty
Students
Tell the friend to confess or you will turn him/her in.
36% 29% 11% 19%
Tell the manager without exposing your friend.
57% 53% 38% 35%
Hide evidence of your friend’s guilt. 1% 3% 9% 14%
Do nothing. 6% 15% 42% 32%
Table 9. Resolutions to the Luddite Dilemma.
Most people report that they would alert management while still protecting their
friend, a middle ground somewhat similar to the resolution to the shoplifting dilemma favored by a plurality of respondents. In fact, two thirds of the respondents who chose calling the store manager after the shoplifter had gone chose to tell their own boss about the vandalism without implicating their friend. As in the shoplifting dilemma, the resolution chosen by the most respondents for others was “do nothing.”
Students seem more likely to do nothing, particularly as opposed to forcing the
friend to confess (the first option in Table 9). Fifteen percent of students would do nothing. Students believe that others would be more harsh than staff and faculty believe–19 percent of students believe that others would force a confession from the friend. Students are also more likely to believe that others would help the friend by hiding evidence–14 percent of students say this. These differences come at the expense of doing nothing; only 32 percent of students say others would do nothing, compared to 42 percent of college employees.
The decision principles chosen for the Luddite dilemma are shown in Table 10.
Again, fewer students chose utilitarianism to explain their decision (47 percent of students versus 53 percent of others).
Table 10. Decision principles for the Luddite Dilemma
Principle Faculty & Staff Students
Utilitarian 57% 47%
Kant 25% 32%
Golden Rule 18% 21%
Table 10. Decision principles for the Luddite Dilemma.
21
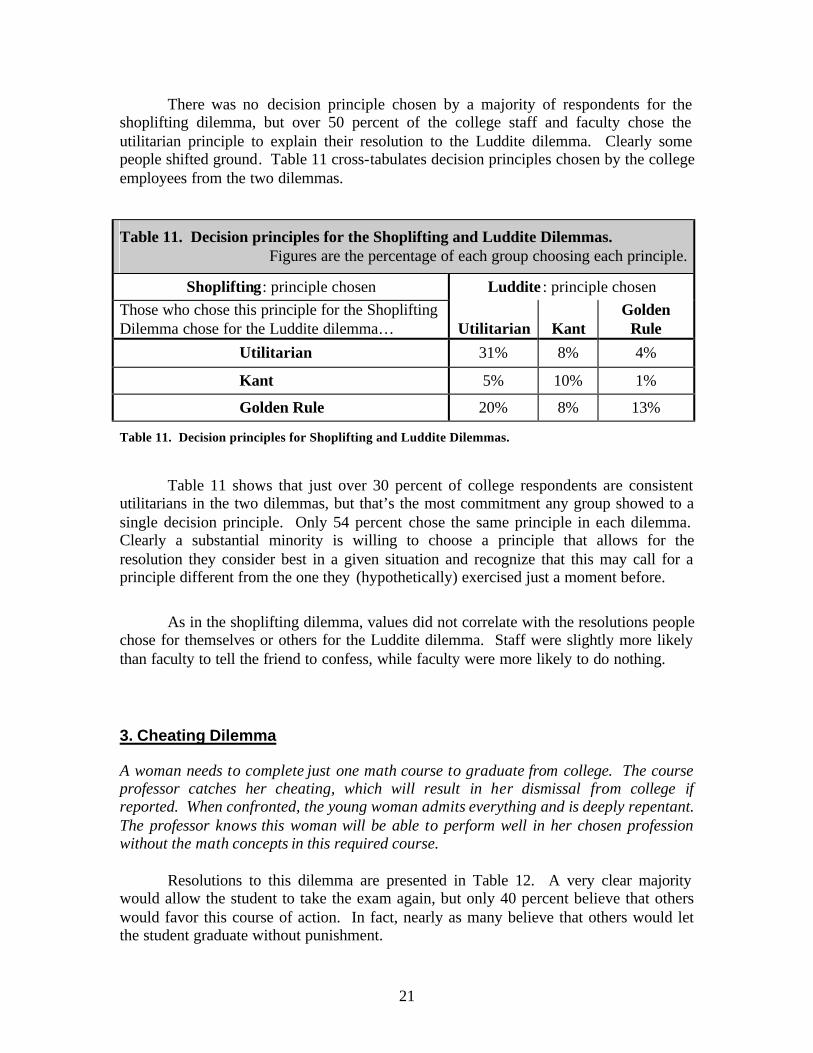
There was no decision principle chosen by a majority of respondents for the shoplifting dilemma, but over 50 percent of the college staff and faculty chose the utilitarian principle to explain their resolution to the Luddite dilemma. Clearly some people shifted ground. Table 11 cross-tabulates decision principles chosen by the college employees from the two dilemmas.
Table 11. Decision principles for the Shoplifting and Luddite Dilemmas. Figures are the percentage of each group choosing each principle.
Shoplifting: principle chosen Luddite : principle chosen Those who chose this principle for the Shoplifting Dilemma chose for the Luddite dilemma…
Utilitarian
Kant
Golden Rule
Utilitarian 31% 8% 4%
Kant 5% 10% 1%
Golden Rule 20% 8% 13%
Table 11. Decision principles for Shoplifting and Luddite Dilemmas.
Table 11 shows that just over 30 percent of college respondents are consistent utilitarians in the two dilemmas, but that’s the most commitment any group showed to a single decision principle. Only 54 percent chose the same principle in each dilemma. Clearly a substantial minority is willing to choose a principle that allows for the resolution they consider best in a given situation and recognize that this may call for a principle different from the one they (hypothetically) exercised just a moment before.
As in the shoplifting dilemma, values did not correlate with the resolutions people
chose for themselves or others for the Luddite dilemma. Staff were slightly more likely than faculty to tell the friend to confess, while faculty were more likely to do nothing.
3. Cheating Dilemma
A woman needs to complete just one math course to graduate from college. The course professor catches her cheating, which will result in her dismissal from college if reported. When confronted, the young woman admits everything and is deeply repentant. The professor knows this woman will be able to perform well in her chosen profession without the math concepts in this required course.
Resolutions to this dilemma are presented in Table 12. A very clear majority would allow the student to take the exam again, but only 40 percent believe that others would favor this course of action. In fact, nearly as many believe that others would let the student graduate without punishment.

22
“I’ve been getting the
feeling over the last few years
that students are becoming more
interested in money.” –Faculty member
Table 12. Resolutions to the Cheating Dilemma. Figures are the percentage choosing each resolution.
Self Others Resolution Staff &
Faculty
Students Staff & Faculty
Students
Expel the student. 19% 16% 23% 34%
Let the student graduate without punishment. 8% 19% 37% 27%
Make the student take the exam again. 74% 65% 40% 39%
Table 12. Resolutions to the Cheating Dilemma.
Interestingly, faculty and staff neither differ in the resolutions they favor for this
dilemma, nor in their expectations of others’ resolutions in this situation. Students were about equal with staff and faculty in their likelihood to support
expulsion- 16 percent of students and 19 percent of the other two groups. But only 65 percent of students chose to let the student take the exam again, and 19 percent of students chose to let the cheating student graduate without punishment - over twice as many as staff and faculty.
The decision principles chosen to explain resolutions to the cheating dilemma are
reported in Table 13.
Table 13. Decision principles for the Cheating Dilemma.
Principle Faculty & Staff Students
Utilitarian 50% 38%
Kant 19% 21%
Golden Rule 31% 41%
Table 13. Decision principles for the Cheating Dilemma.
As in the other two dilemmas, more college employees
prefer the utilitarian principle to explain their decision than any other principle. Also consistent with the other two dilemmas, there is some sensible correlation between principles and resolutions. Over 50 percent of the people who chose to expel the student explained their decision through a moral imperative – this is what everyone should do in this situation. Just over half of those who chose to allow the student to take the test again chose utilitarianism as the principle behind their decision, but 37 percent of people who chose that resolution chose the Golden Rule.

23
Students explain their decision differently. They are almost equally likely to cite the Golden Rule as utilitarianism to explain their resolution. This may be related to students’ increased likelihood of letting the cheating student graduate without punishment, and perhaps the greater ease with which they can imagine themselves in the shoes of the student in the dilemma.
As in much other Institute survey work, we don’t find people reluctant to adopt different decision principles from dilemma to dilemma. As in the past, just over 50 percent are consistent in their principles.
Priorities All respondents were presented with six pairs of life goals and asked to identify
which of the two they considered most important. The comparisons were:
1. Personal financial success vs. A satisfying career 2. Personal financial success vs. Working in an environment where my ethics are respected 3. Personal financial success vs. Marriage and family life 4. Marriage and family life vs. Ethics and character development 5. Marriage and family life vs. A satisfying career 6. A satisfying career vs. Ethics and character development
Table 14 reports the choices made by respondents to these questions.
Table 14. Priorities chosen by respondents: “Is X or Y more important?” Figures are the percentages of valid responses in each category.
Comparisons
Career satisfaction
(CS) vs.
Financial success
(FS)
Ethical environment
(EE) vs.
Financial success
(FS)
Marriage & family (MF)
vs. Financial success
(FS)
Marriage & family (MF)
vs. Character
development (CD)
Character development
(CD) vs.
Career satisfaction
(CS)
Marriage & family (MF) vs.
Career satisfaction
(CS) Respondents (N): CS FS EE FS MF FS MF CD CD CS MF CS
Public (505) 84 16 85 15 92 8 71 29 71 29 88 12 College staff (566) 83 17 83 17 88 12 61 39 67 33 83 17
College faculty (450) 83 17 85 15 81 19 56 44 64 36 82 18
Students (1193) 68 32 59 41 100 0 61 39 52 48 75 25
All (2714) 78 22 73 27 93 7 60 40 60 40 79 21
Table 14. Priorities chosen by respondents.

24
“We need to display ethical
behaviors in everything
we do.” –Respondent
“It’s our job to get students to see beyond.”
–Dean
The most striking result in Table 14 is the consistent preference for family life over any alternative. Students unanimously prefer family to financial success. It is rare in any survey when almost 900 people respond to a question the same way – although it
should be noted that almost 300 students declined to answer this question, perhaps accounting for the responses that would have broken the unanimity. Given earlier responses regarding the moral boundaries and sources of authority of respondents, it is not surprising that family is considered more important than character development. To these respondents, character development takes
place primarily in the family, and family members share their values more than any other people in their lives. Family life, in many ways, is character development. Also striking is the resounding rejection of financial success when it is compared to any other goal in the list. Students choose financial success more often than the public or college employees, except when finances are countered with family life. But financial success never achieves a majority. As with several other comparisons in the survey, there is a strong trend of overall agreement, although specific distributions of responses differ between groups. The general public’s responses are always more firmly split than any other group’s responses—their margin of support for the majority position shared by all groups is always wider, except for the unanimous student response favoring family over financial success. Students, apart from their anomalous unanimity, are generally more evenly split than any other group.

25
“When you get this large, values and ethics may get lost in the shuffle.”
–Administrator
CONCLUSIONS
The findings from the Maricopa surveys are broadly consistent with findings from other Institute surveys. In Maricopa County, as elsewhere around the world, individuals focus on a core of shared values that includes responsibility, truth, respect, and fairness. Compassion, often listed among the top values, came lower on this list, where freedom rounds out the top five. Here, as elsewhere, there seem to be few demographic variables at work behind these core-values choices, which appear generally unaffected by the race, gender, religion, politics, or educationa l level of the participant. It seems clear, in other words, that an effort to discuss values at the college will not encounter the cynical public response that asks, “But whose values will you teach?” The public and the college agree on the answer: Our collective values, the ones we jointly share.
When asked who else shared these values—in other words, who else in their
circle of acquaintances would be most apt to make decisions based on the values they themselves hold dear—these participants (like those in most Institute surveys) pointed immediately to members of their own family. However, they then pointed to teachers, faculty, and others who work in the college system—a solid endorsement that, far from indicating a misfit between individuals and the cultures in which they operate, the values actually practiced at the college square very well with their own.
Looking to the future , these participants expect to see some change in values over
time—although not in themselves. Here, as in the resolution to the dilemmas later in the survey, participants distinguish their own values-based behaviors from those of others, ranking their own as more fixed and (in the response to the dilemmas) more courageous, and taking a slightly more cynical view of others. Those with more education, however, are less apt to believe that values will change over time—perhaps reflecting a greater acquaintance with the timelessness of certain core truths that education seeks to provide.
Concerning the teaching of ethics and values, these respondents firmly dismiss
the notion that ethics ought not be taught, or that it is too late to teach it to college- level students, or that discussions of values have no place at the college. The strongest support for teaching ethics and values comes from the public itself—dispelling any notion that the public may not support such teaching on the campuses. The survey also indicates that, by very large numbers, faculty say they are already working with values and ethics in their classes—and tha t there is a low level of discomfort about incorporating ethics training into their classes.

26
“The fact that [developing values] is hard work turns
most people off. They want simple
answers to complex questions.”
– Faculty member
“The colleges are closer to where the goats eat the
grass and the tires hit the road.”
–Dean
It is also clear, however, that most participants turn to three sources—personal experience, family, and religion—as the guiding sources of authority in their own thinking about ethical matters. Friends, school, and work were less prominent—although more so than the popular media—as sources of authority. So while there is strong support for teaching ethics and values on the campuses, such teaching may need to be carried on with a particular humility, recognizing that it is competing with more powerful sources of authority. Here, however, the focus on personal experience may be key: Ethics teaching that connects immediately with personal experience, or that addresses practical issues and becomes part of a student’s own life, may have the greatest opportunity for success.
In the application of ethical ideas to moral dilemmas, these participants shed
helpful light on the ways in which the college might teach ethics:
1. The survey finds no correlation between values and decision-making principles. This point is very important, in that it helps dismiss the idea that, among the three ethical principles most commonly used, some are morally superior to others. It is clear that individuals who hold the same set of values may choose to practice them through different principles, all of which are noble and valuable. In other words, there is apparently no hierarchy of principles that would, for instance, cause people with “really good values” to be utilitarians, while those with “less good values” would end up being Kantians or proponents of the Golden Rule.
2. It is equally clear that individuals tend to move freely among decision principles
to justify the intuitions that lead to their actions. The important message for ethics teaching at the college level may be that, although there is no one “right” decision principle, there may be gravitational pulls within each respondent that draw him or her to particular principles more often than to others: In fact, more than 50 percent of
the sample consistently select the same resolution principle for resolving each of the three dilemmas. One importance of ethics education may be to compel a broader examination of alternative principles, in order to ensure that the decision has been thought through carefully rather than simply reached through habit or unexamined reaction.
3. Overall, these responses suggest that while there is a variety of ethical response
on the campuses, there is little disposition to shrug off ethics as unimportant or to resist having it taught. The atmosphere appears favorable for ethics teaching across the curriculum, if that should be the choice of the faculty. And while there are certain noticeable differences in responses among various demographic cohorts—conservatives, the highly religious, the less affluent, for example—there is little to indicate that stark polarities will make it difficult to engage in broad public discourse about ethical matters on the campuses.

27
“This is no longer a tearoom discussion. We’re in a boxing ring here, working out some very real
issues.” –Dean
Finally, the participants seem to have clear priorities as they choose among such
goals as financial success and family life. Maricopa Community College students clearly cherish financial success in comparison to many other goals. Most encouraging, however, is their unanimous choice of marriage and family over financial success—a far stronger affirmation of marriage and family than is given by any other subset in this survey. As they make other choices, students are more evenly split by these competing goals—perhaps indicating that those more settled in their careers, or further from their years of education, are part of a more clearly developed consensus than are students who are still testing and probing their own attitudes and feelings. But on financial success versus marriage and family, the students—at least for the time that they remain students—are resoundingly clear.
But the key finding among these “priority” questions is surely that character education, for all intents and purposes, is family life. That finding holds both concern and promise for higher education. While it is true that the public strongly endorses the teaching of ethics and values on the campuses—and that the campus communities share that endorsement—it is also clear that family remains, in the minds of most participants, the strongest educator for character. The message may be that no amount of curricular or extra-curricular emphasis on ethics and values can ever replace the role of the family—a point that should engender some modesty among educators about what they can hope to accomplish in these matters.
It may also be true, however, that the college populations at a community college remain more closely connected to family life than those in many institutions of higher learning, where family is often more distant from the lives of the students. Whatever the reason, family remains a priority in the lives of Maricopa Community College students. When this finding is coupled with another—that there are few if any real distinctions between the public’s view of values and ethics and the views held by those on the campuses—a promising possibility opens up. It seems logical that a program on ethics and values that roots itself in family life, and takes account of the commonality of core values between the campuses and the community, may provide a natural way forward to provide the kind of education in ethics and values that the public expects from the college.
28
TECHNICAL APPENDIX
MCCD Ethics Surveys: Methodology O’Neil Associates was involved in the design and administration of the MCCD Ethics Surveys. Specifically, we made minor technical comments and observations on the survey—which was drafted by the Institute for Global Ethics—and we helped construct the sampling design, and entered and tabulated all data. The specific methods involved to administer each of these surveys were as follows:
Staff Surveys. All MCCD staff (including administration, faculty, and other employees) were mailed copies of the MCCD survey along with a persuasion letter requesting that the survey be returned via campus mail for ultimate distribution to O’Neil Associates for data processing.
Student Surveys. Four classes were randomly selected from each of the district’s colleges and centers. These classes were selected from an administratively derived list of all classes. Each instructor was requested to administer the survey to all class members present at the next feasible classroom session. These groups of surveys were returned via campus mail to a central MCCD location, and ultimately given to O’Neil Associates for data processing.
O’Neil Associates scanned the above surveys with an optical scanning system. Each “double read” or “non read” entry was manually reviewed to determine the intent of the respondent—a somewhat precise process although still imperfect.
General Public Survey. We also conducted a random telephone survey of 505 residents of Maricopa County. We designed our methodology with an eye toward minimizing potential sources of error. For example, all of the interviewing was conducted in a single location under close professional supervision, and all interviewers who worked on this study underwent extensive training not only on the proper techniques of interviewing in general, but also on the unique interviewing requirements for this study. In addition, the interviews for this study were conducted using a Computer-Aided Telephone Interviewing (CATI) system. By programming a computer to control all of the skip patterns, we minimize the potential for interviewer errors involving asking questions of respondents who should not be asked those questions, based on their answers to previous questions. Likewise, CATI also controls for out-of-range answers, ensuring that all of the answers recorded are legitimate questionnaire responses.
A Note on Sampling Error There is probably more confusion and misinformation with respect to the issue of sampling error than regarding any other technical aspect of survey research. The term “error” is something of a misnomer; sampling error has nothing to do with a mistake on the part of the researcher or anyone else. Rather it has to do with the variability in our estimates that arise from the fact that we interview a sample rather than an entire
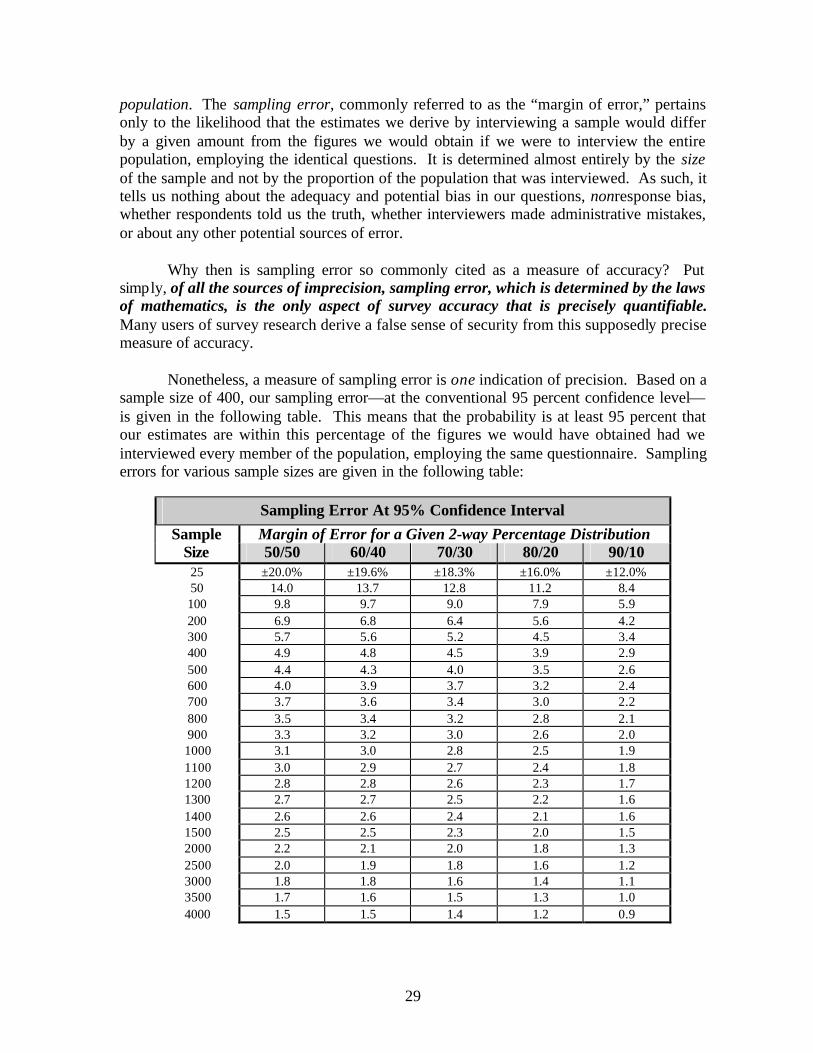
29
population. The sampling error, commonly referred to as the “margin of error,” pertains only to the likelihood that the estimates we derive by interviewing a sample would differ by a given amount from the figures we would obtain if we were to interview the entire population, employing the identical questions. It is determined almost entirely by the size of the sample and not by the proportion of the population that was interviewed. As such, it tells us nothing about the adequacy and potential bias in our questions, nonresponse bias, whether respondents told us the truth, whether interviewers made administrative mistakes, or about any other potential sources of error. Why then is sampling error so commonly cited as a measure of accuracy? Put simply, of all the sources of imprecision, sampling error, which is determined by the laws of mathematics, is the only aspect of survey accuracy that is precisely quantifiable. Many users of survey research derive a false sense of security from this supposedly precise measure of accuracy. Nonetheless, a measure of sampling error is one indication of precision. Based on a sample size of 400, our sampling error—at the conventional 95 percent confidence level—is given in the following table. This means that the probability is at least 95 percent that our estimates are within this percentage of the figures we would have obtained had we interviewed every member of the population, employing the same questionnaire. Sampling errors for various sample sizes are given in the following table:
Sampling Error At 95% Confidence Interval Sample Margin of Error for a Given 2-way Percentage Distribution
Size 50/50 60/40 70/30 80/20 90/10 25 ±20.0% ±19.6% ±18.3% ±16.0% ±12.0% 50 14.0 13.7 12.8 11.2 8.4 100 9.8 9.7 9.0 7.9 5.9 200 6.9 6.8 6.4 5.6 4.2 300 5.7 5.6 5.2 4.5 3.4 400 4.9 4.8 4.5 3.9 2.9 500 4.4 4.3 4.0 3.5 2.6 600 4.0 3.9 3.7 3.2 2.4 700 3.7 3.6 3.4 3.0 2.2 800 3.5 3.4 3.2 2.8 2.1 900 3.3 3.2 3.0 2.6 2.0 1000 3.1 3.0 2.8 2.5 1.9 1100 3.0 2.9 2.7 2.4 1.8 1200 2.8 2.8 2.6 2.3 1.7 1300 2.7 2.7 2.5 2.2 1.6 1400 2.6 2.6 2.4 2.1 1.6 1500 2.5 2.5 2.3 2.0 1.5 2000 2.2 2.1 2.0 1.8 1.3 2500 2.0 1.9 1.8 1.6 1.2 3000 1.8 1.8 1.6 1.4 1.1 3500 1.7 1.6 1.5 1.3 1.0 4000 1.5 1.5 1.4 1.2 0.9

30
The previous table illustrates that sampling error is also affected by the percentage distribution of responses obtained. For example, if a respondent is asked a question and 50 percent said yes and 50 percent said no, with a sample size of 400 the sampling error is ±4.9 percent; whereas if 90 percent said yes and 10 percent said no, the sampling error decreases to ±2.9 percent. In other words, the more unified or clustered the distribution of responses, the greater the precision of our sample-based survey estimates.

31

32
The Maricopa Community College District
2002 marks the 101st year of our nation's community colleges. The Maricopa Community Colleges stand proudly among them as the national model in higher education. Of the 10.4 million students attending 1,132 community colleges, 5.4 million are enrolled in credit classes with another 5 million enrolled in non-credit classes. Students represent widely differing backgrounds, cultures, ages, nationalities, interests and goals. As the job market continues to demand greater competency in basic skills, and technology requires new training or retraining in many occupations, the number of students attending the Maricopa Community Colleges increases annually. The following provides a general overview and the most current data on the Maricopa County Community College District. Growth Trends
The Maricopa Community Colleges began with one college – Phoenix College, originally founded in 1920 with 53 students. It became the flagship college when in 1962 voters elected to establish today's Maricopa County Community College District. Approximately 7,000 students were enrolled in the one college, where today over 2 million students have attended the District's multiple colleges spread throughout metropolitan Phoenix. Ten nationally accredited colleges, two skill centers and multiple satellite extensions now comprise the Maricopa County Community College District. The Maricopa Community Colleges educate and train a diverse student body with an enrollment of 197,432 students in credit courses and over 80,000 enrollments in non-credit special interest courses. The Maricopa County Community College District ranks among the nation's largest community college systems and is the largest single provider of higher education in Arizona – a major resource for those seeking post-secondary education and job training. Workforce Development
Customized workforce training is an important asset for both local and relocating businesses and industries in the Valley. Since 1982, thousands of employees, representing new and existing Valley companies, have received training from partnerships with the Maricopa Community Colleges and the District's Center for Workforce Development. The Maricopa Community Colleges are the largest providers of higher education in Arizona, as well as the largest providers of health care workers in Arizona, preparing more than 2,000 adults each year for jobs in the Valley's growing health care industry. A Good Investment - A Great Return
A full-time student at any one of the Maricopa Community Colleges spends $1,290 for tuition and fees–18% LOWER than the national average. Yet, a Maricopa Community
33
College graduate with an Associate Degree can expect to earn more than $1 million during a lifetime– $250,000 MORE than an individual with a high school diploma. The median income of a person with an AA degree is $8,000 a year MORE than a high school graduate. Faculty
The Maricopa Community Colleges maintain 1,280 full-time faculty augmented by more than 3,800 adjunct faculty who are specialists in their respective fields. Courses, Degrees, Transfer Opportunities
The Maricopa Community Colleges offer 8,438 credit courses in addition to 738 occupational programs. Six degrees are offered: Associate in Arts (AA); Associate in Science (AS); Associate in Applied Science (AAS); Associate in Business (ABus); Associate in General Studies (AGS); and Associate in Transfer Partnership (ATP). Certificates of Completion are offered in diverse occupational areas. At the end of an academic year, Maricopa Colleges award more than 4,000 degrees and 10,000 certificates.
In 2000-2001, 54% of Arizona State University's baccalaureate degree recipients transferred credits from one of the Maricopa Community Colleges. Articulation agreements exist with numerous other colleges and universities in Arizona and nationally. Technology
The Maricopa Community Colleges rank among the nation's leading institutions of higher education in the use of computers and telecommunications. Large computer labs at each college combine with libraries to provide students access to worldwide information. E-mail and the Internet are essential tools in everyday activities for faculty, staff and students. Scholarships
Since 1987, $6.2 million in scholarships have been awarded to 17,777 students through the Maricopa Community Colleges Foundation. The Foundation raises money for scholarships and special programs – from corporations, private foundations, and individuals. Student Profiles
Students range in age from 13 to 90. Women comprise 56% of the student population and more than 60% of all students plan to work full-time or part-time.
The diverse student body represents the variety of ages, interests, backgrounds and ethnic mixture of the local population. More than 14,000 students are aged 50 plus. Some 70,000 students are culturally and ethnically diverse, including 16,000 international students. Approximately 40% of all adults residing in Maricopa County have attended one of the Maricopa Community Colleges. At least 8.7% of the county population ages 18 and above attends each year.

34
TThhee IInnssttiittuuttee ffoorr GGlloobbaa ll EEtthhiiccss Rushworth M. Kidder, Ph.D., Founder and President
Camden, Maine 04843
The Institute for Global Ethics is an international nonprofit membership organization dedicated to elevating public awareness and discussion of ethics in a global context.
Independent, nonsectarian, and nonpartisan, the Institute focuses on ethical activities for corporations, educators, other professionals, and communities.
Our Vision
A world where shared moral values shape relationships, determine decisions, and guide actions for every individual, institution, and nation.
Our Mission
To promote ethical behavior in individuals, institutions, and nations through research, public discourse, and practical action.
Stop by anytime: http://www.globalethics.org ~ (800) 729-2615
OO''NNeeiill AAssssoocciiaatteess,, IInncc.. Michael J. O'Neil, Ph.D., President
412 East Southern Ave Tempe, AZ 85282
E-mail: [email protected] Web site: http://www.oneilresearch.com
Expert: MARKETING RESEARCH - Surveys & Opinion Research Full-service custom opinion research firm with a twenty-plus year history of
service to a blue-chip clientele.
Specialties: Design and analytical staff. Centralized Computer Assisted Telephone Interviewing (CATI) facility, web surveys, focus groups. Litigation strategy, jury simulations, mock trials, jury selection, trademark confusion, expert testimony.
Corporate experience in statistical consulting, public opinion, high technology, medical, banking, financial, consumer, marketing, political, media, public relations, social research, employee relations, litigation, government policy studies.
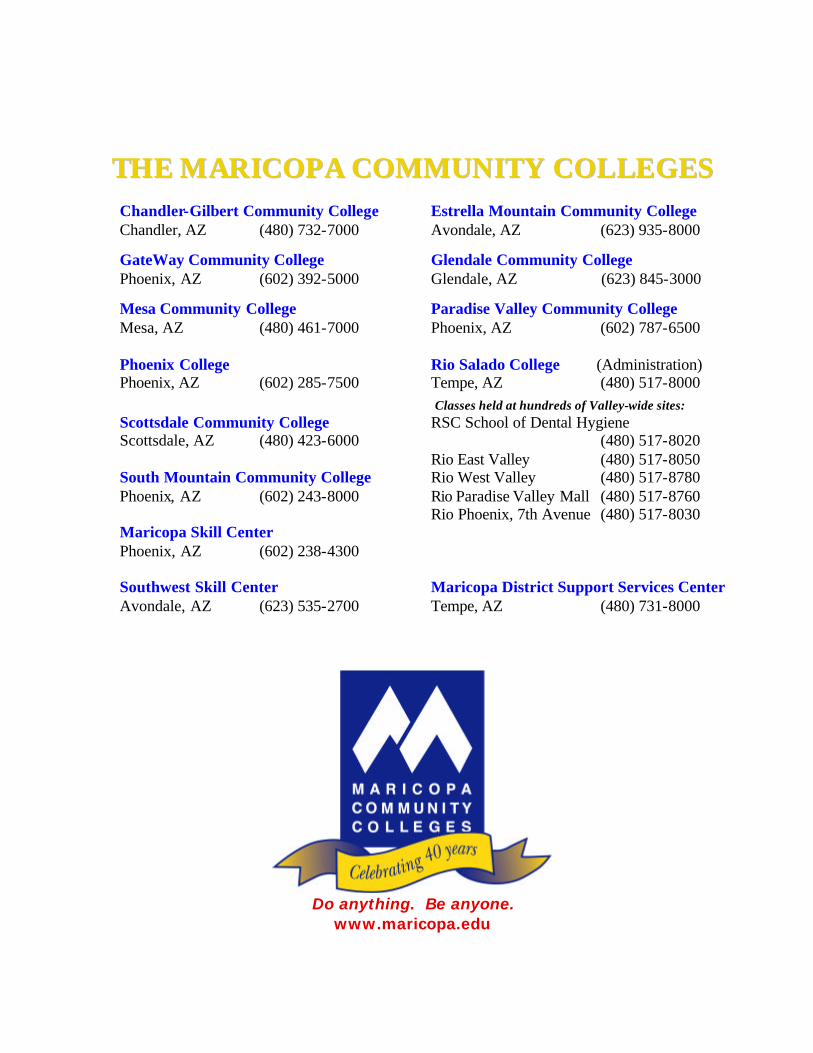
TTHHEE MMAARRIICCOOPPAA CCOOMMMMUUNNIITTYY CCOOLLLLEEGGEESS
Chandler-Gilbert Community College Estrella Mountain Community College Chandler, AZ (480) 732-7000 Avondale, AZ (623) 935-8000
GateWay Community College Glendale Community College Phoenix, AZ (602) 392-5000 Glendale, AZ (623) 845-3000
Mesa Community College Paradise Valley Community College Mesa, AZ (480) 461-7000 Phoenix, AZ (602) 787-6500 Phoenix College Rio Salado College (Administration) Phoenix, AZ (602) 285-7500 Tempe, AZ (480) 517-8000
Classes held at hundreds of Valley-wide sites: Scottsdale Community College RSC School of Dental Hygiene Scottsdale, AZ (480) 423-6000 (480) 517-8020 Rio East Valley (480) 517-8050 South Mountain Community College Rio West Valley (480) 517-8780 Phoenix, AZ (602) 243-8000 Rio Paradise Valley Mall (480) 517-8760 Rio Phoenix, 7th Avenue (480) 517-8030 Maricopa Skill Center Phoenix, AZ (602) 238-4300 Southwest Skill Center Maricopa District Support Services Center Avondale, AZ (623) 535-2700 Tempe, AZ (480) 731-8000
Do anything. Be anyone.
www.maricopa.edu