the integrated performance report highlights key themes
TRANSCRIPT

CLASSIFICATION: unrestricted
Version: 1.0 Page x of x Retention Date: 31/12/2037
Report to: Trust Board Agenda item:
SFT 4048
Date of Meeting: 7th June 2018
Report Title: Integrated Performance Report, February 2018
Status: Information Discussion Assurance Approval
X
Prepared by: Executive Directors
Executive Sponsor (presenting):
Executive Directors
Appendices (list if applicable):
Recommendation:
To note the information contained in the integrated performance report Executive Summary:
The Integrated Performance Report highlights key themes and issues across the organisation, attempting to make links between the various aspects of the Trust’s business. As such it brings together themes from the: quality, people, performance and finance reports and seeks to set out the interlinking issues and plans to move forward the challenges faced. Board Assurance Framework – Strategic Priorities Local Services - We will meet the needs of the local population by developing new ways of working which always put patients at the centre of all that we do
x
Specialist Services - We will provide innovative, high quality specialist care delivering outstanding outcomes for a wider population
x
Innovation - We will promote new and better ways of working, always looking to achieve excellence and sustainability in how our services are delivered
x
Care - We will treat our patients, and their families, with care, kindness and compassion and keep them safe from avoidable harm
x
People - We will make SFT a place to work where staff feel valued and are able to develop as individuals and as teams
x
Resources - We will make best use of our resources to achieve a financially sustainable future, securing the best outcomes within the available resources
x
1 | P a g e
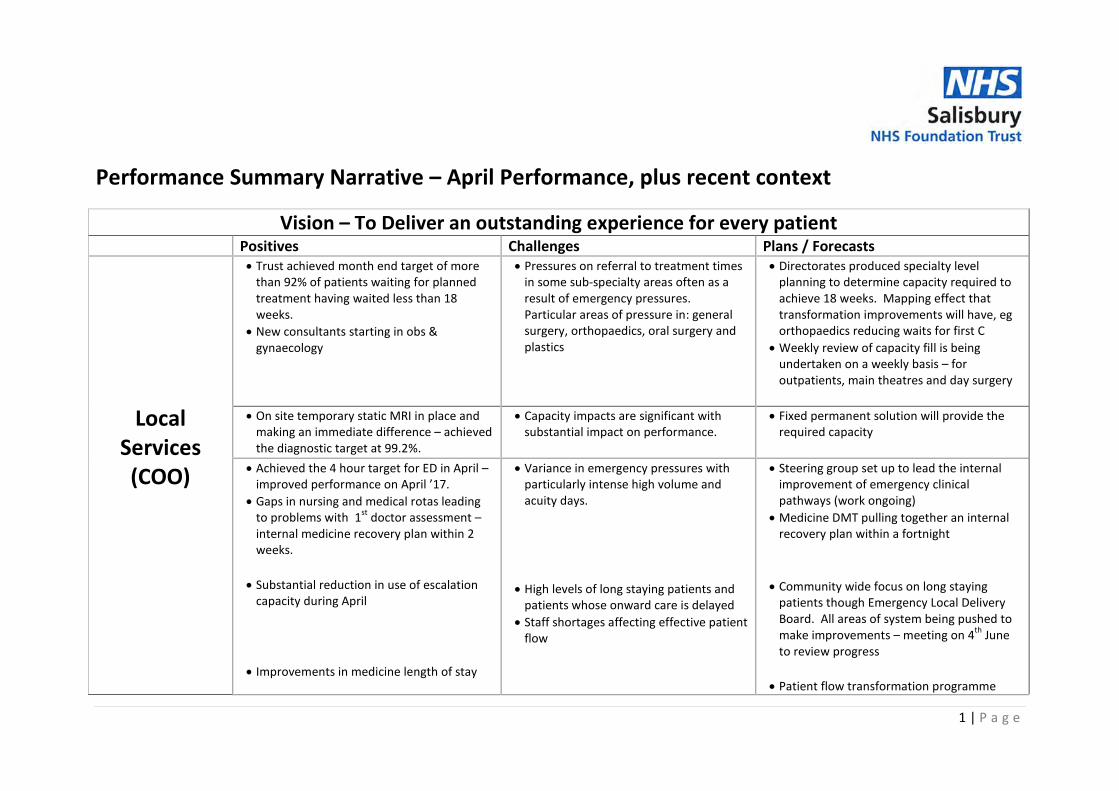
Performance Summary Narrative – April Performance, plus recent context
Vision – To Deliver an outstanding experience for every patient Positives Challenges Plans / Forecasts
Local Services (COO)
• Trust achieved month end target of more than 92% of patients waiting for planned treatment having waited less than 18 weeks.
• New consultants starting in obs & gynaecology
• Pressures on referral to treatment times in some sub-specialty areas often as a result of emergency pressures. Particular areas of pressure in: general surgery, orthopaedics, oral surgery and plastics
• Directorates produced specialty level planning to determine capacity required to achieve 18 weeks. Mapping effect that transformation improvements will have, eg orthopaedics reducing waits for first C
• Weekly review of capacity fill is being undertaken on a weekly basis – for outpatients, main theatres and day surgery
• On site temporary static MRI in place and
making an immediate difference – achieved the diagnostic target at 99.2%.
• Capacity impacts are significant with substantial impact on performance.
• Fixed permanent solution will provide the required capacity
• Achieved the 4 hour target for ED in April – improved performance on April ’17.
• Gaps in nursing and medical rotas leading to problems with 1st doctor assessment – internal medicine recovery plan within 2 weeks.
• Substantial reduction in use of escalation
capacity during April • Improvements in medicine length of stay
• Variance in emergency pressures with particularly intense high volume and acuity days.
• High levels of long staying patients and
patients whose onward care is delayed • Staff shortages affecting effective patient
flow
• Steering group set up to lead the internal improvement of emergency clinical pathways (work ongoing)
• Medicine DMT pulling together an internal recovery plan within a fortnight
• Community wide focus on long staying
patients though Emergency Local Delivery Board. All areas of system being pushed to make improvements – meeting on 4th June to review progress
• Patient flow transformation programme

2 | P a g e
Vision – To Deliver an outstanding experience for every patient Positives Challenges Plans / Forecasts
refreshed and directed to focus on medical length of stay with clear actions and delivery trajectory
Local Services
(COO)
• Challenging in month but will achieve standards for quarter
• High levels of demand in a number of cancer pathways, eg breast, and ability to deliver on 31 day target
• High number of patient choice related breaches
• Small numbers and specific pathway challenges leading to breaches
• All cancer standards being monitored on an individual patient basis for 62 day pathway.
• Focussed improvement on 2ww pathways to address increases in referrals especially for in breast and urology pathways
• New Pembroke unit opened in mid May
Specialist Services (COO)
• Setting up plastics network for Wessex area – to be launched in June
• National burns major incident exercise rescheduled – SFT to be major participant
• Continue to monitor the impact of the ward reconfiguration on plastics
• Plans in place for regular meeting at COO/MD level to discuss future working between SFT and UHS
• Focussed validation on the waiting list for plastic surgery
• Continued improvements in spinal rehabilitation pathways - recent review undertaken by COO, MD and DoN
• Waiting list reduced for patients for admission to the spinal unit
• Value of the spinal contract with commissioners
• Increased demand for spinal rehabilitation
• Increased numbers of delayed transfers of care
• Commissioner support for new pathways
• Closely monitoring improvements and action plan, including pre and post hospital pathways
Innovation (MD)
• Research recruitment 98.5% of target

3 | P a g e
Vision – To Deliver an outstanding experience for every patient Positives Challenges Plans / Forecasts
Care (MD/DoN)
• Mortality rate is now at expected levels – for third month in a row
• No c-diff, zero MRSAs. • No instances of mixed sex accommodation
breaches in April • Improvements in review of high risk
referrals of patients with suspected transient ischaemic attack (TIA)
• Moving to good programme continues with good engagement across four core services
• Well led review by Deloitte’s completed
• Stroke performance operationally remains challenging – SSNAP score of D
• Staffing remains challenging in a number of ward areas
• Two new serious incident inquiries • Reduction in patients with hip fracture
having surgery within 36-48 hours
• Retention workstream for registered nurses
commenced in March. Domestic and overseas recruitment continues
• Twice daily staffing reviews utilising safe care data continue
• Dedicated trauma lists introduced in May, with new theatre timetable providing a daily trauma list
• Intensive support programme instigated in
theatres, with executive oversight • Incidents under investigation. Task and
finish group chaired by Deputy COO assessing immediate actions to tumour site pathways where required
People (DoOD&P)
Recruitment: • Domestic and international campaigns
continue for nursing (Australia, India and UAE) 109 offers made in India. 4 nurses have passed IELTs/OET already with 1 who already has NMC decision letter and should arrive in June. Additional event held in Perth on 26 May 2018, 8 offers made.
• Student nurses offered a guaranteed values
Recruitment: • Vacancies have increased from 5.90% in
month 12 to 7.90% in month 1. This increase is due to the movement of subsidiary companies (OML, STL) with above average vacancy levels into the Trust's consolidated account, general movement of capital FTE to revenue (GS1, Informatics, etc), creation of a
Recruitment: • Longer term recruitment - “grow your own”
plan to achieve fill to 95% for ward based nursing
• Recruitment microsite will be live at TRAC implementation.
• Noticeboards and banners to improve physical marketing
• Guardian advertisement placed in the NHS

4 | P a g e
Vision – To Deliver an outstanding experience for every patient Positives Challenges Plans / Forecasts
People (DoOD&P)
based interview (13 offers of employment made, 12 offers accepted, 1 yet to accept due to issue with preceptorship start date – Deputy Director of Nursing leading.
• 10 OSCE passes in the past month, releasing new RNs to the wards.
• Closed Facebook group set up for international nurses to improve onboarding.
Agency Spend: • Workforce pay control group manages
process and monitors spend • Overtime review next area of deep dive • Audit report (Reasonable assurance - 4
areas to improve) • Collaboration with external hospitals
Collaborative bank now live with Hampshire, Royal Surrey and Ashford and St Peters Hospitals, via Locums Nest
reserve to fund posts when they come on stream and permanent funding of other initiatives including enhanced cleaning, OD and People transformation.
• Overseas nursing has low conversion rate • Lack of available domestic registered
nurses
Agency Spend: • Agency used to keep nursing staffing
levels safe, continuing • Month 1 control total exceeded,
increased by £222k from £439k in month 12 to £661k in month 1. The staff group with the largest increase was Registered Nurses which was up by £116k compared with Month 12. Spend for Allied Health Professionals increased due to the re-coding of ODPs from ST&T to AHPs from Month 1.
• Spend for NHS Infrastructure Support increased due to the inclusion of Laundry agency spend (£117k) in the figures from Month 1 for the first time.
70th birthday edition Agency Spend: • Agency spend tracked in month versus
2018/19 control total • Workforce committee business case
proposal for Managed Service Provider requiring further detail and analysis.
• Workforce pay control group to review additional areas of non-contractual pay spend

5 | P a g e
Vision – To Deliver an outstanding experience for every patient Positives Challenges Plans / Forecasts
Sickness: • Theatres group established and on-going • Initial stages of STP wide collaboration for
health and wellbeing underway • HAWB strategy in development • Sickness fallen slightly to 3.53%, compared
to local Trusts average of 3.59%.
Engagement: • OD and Engagement plan launched & has
great response throughout May. • positive staff survey results – engagement
score in top 20% in the country Other: • MaST compliance stands at 85.59% • Medical appraisal rates are 87.7%
Sickness: • Long term sickness decreased slightly
this month, “anxiety/stress/depression” remaining top 20% of cases.
• Hotspot area remains Theatres • Hotspot staff group remains nursing Engagement: • Staff morale at time of intense
operational pressures • Areas of concern in staff survey Other: • Appraisal challenging to hit 85% (Non-
medical rates currently at 84.1%)
Sickness: • Theatres working group supporting
managers on a case by case basis • Managing attendance policy (now approved)
and managers toolkit to be implemented in June.
• OH service redesign, HAWB strategy • Head of HAWB post to be advertised
Engagement: • Staff engagement group to be established
(May 18) M2 of engagement plan • Long term retention strategy for all staff
groups is in progress
Resources (DoF)
• The Trust has been offered revised control total which would allow the Trust to access PSF and mitigate further risks.
• The Trust is behind £0.3M in month, predominately due to an under delivery of activity particularly in elective orthopaedics.
• Trust has ongoing work to agree Dorset contract for 2018/19, steps in place to agree data accuracy audit to underpin contract (June).
• Trust is developing a plan to consider proposed revised control total. (June)
• Trust engaged with STP financial recovery plan, with a focus on reducing Length of stay and the associated costs of capacity at SFT.

CLASSIFICATION Unrestricted
Version: 1.0 Page 1 of 7
Retention Date: 31/12/2037
Report to: Trust Board (Private) Agenda
item:
Date of Meeting: 07 June 2018
Report Title: Month 1 Operational Performance Report
Status: Information Discussion Assurance Approval
X
Prepared by: Andy Hyett, Chief Operating Officer
Executive Sponsor (presenting):
Andy Hyett, Chief Operating Officer
Appendices (list if applicable):
Appendix : 1 Performance & Score Card Appendix: 2 EPR Meeting overview report
Recommendation:
The committee are asked to note the Trust Performance for Month 1
Executive Summary:
The Trust delivered the ED, RTT and Diagnostic standards for Month 1. At the time of writing this report, Cancer performance was still being validated. Board Assurance Framework – Strategic Priorities
Select as applicable
Local Services - We will meet the needs of the local population by developing new ways of working which always put patients at the centre of all that we do ☒ Specialist Services - We will provide innovative, high quality specialist care delivering outstanding outcomes for a wider population ☒ Innovation - We will promote new and better ways of working, always looking to achieve excellence and sustainability in how our services are delivered ☐ Care - We will treat our patients, and their families, with care, kindness and compassion and keep them safe from avoidable harm ☐ People - We will make SFT a place to work where staff feel valued and are able to develop as individuals and as teams ☐ Resources - We will make best use of our resources to achieve a financially sustainable future, securing the best outcomes within the available resources ☒

CLASSIFICATION
Version: 1.0 Page 2 of 7 Retention Date: 31/12/2037
Executive Summary of Key Operational Performance – April 2018
ED
Performance
In month (1): National standard was delivered in month 1 with performance at 95% Year to date: YTD performance 95%
RTT
Performance
In month (1): National standard was delivered in month with performance at 92% Year to date: YTD performance 92%
Diagnostics
In month (1): National standard was delivered reporting 92.2%. Year to date: The standard has been delivered for M1
Cancer
In month (1): At the time of writing this report, final cancer performance was not available – a verbal update will be provided at the meeting.
DTOCs
In month (1): 590 bed days Year to date: 590 bed days
GREEN
Green
AMBER
GREEN
RED

CLASSIFICATION
Version: 1.0 Page 3 of 7 Retention Date: 31/12/2037
Emergency Pathway 4 hour performance for April 2018 : Type 1 92.58% Type 1, 2 and 3 95% Ambulance breaches: Total 3 (none over 60 minutes) No 12 hour trolley waits in April
Time to triage – April
14.8 minutes (Majors & Resus patients)
Time to Treatment - April
53.1 minutes (Majors & Resus patients)

CLASSIFICATION
Version: 1.0 Page 4 of 7 Retention Date: 31/12/2037
RTT RTT Incomplete by Unify Specialty
Total <18 weeks Total % <18
weeks
General Surgery 577 733 78.72%
Urology 1006 1115 90.22%
Trauma & Orthopedics 1643 1901 86.43%
Ear, Nose & Throat (ENT) 920 966 95.24%
Ophthalmology 1233 1251 98.56%
Oral Surgery 1331 1586 83.92%
Neurosurgery 0 0 Plastic Surgery 1046 1264 82.75%
Cardiothoracic Surgery 0 0 General Medicine 42 43 97.67%
Gastroenterology 818 862 94.90%
Cardiology 842 843 99.88%
Dermatology 689 735 93.74%
Thoracic Medicine 339 400 84.75%
Neurology 0 0 Rheumatology 313 316 99.05%
Geriatric Medicine 148 153 96.73%
Gynaecology 949 975 97.33%
Other 4038 4171 96.81%
Total 15934 17314 92.03%
General Surgery
• Reviewing waiting list is on-going to ensure waits are evenly spread. Most of backlog is hernias. Wiltshire CCG commissioned a community hernia pathway from April 18 so expect to see an impact of that. Managing waiting list in house and monitoring demand impact before reviewing outsourcing opportunities
Urology • Meeting clinical team on 20th April to agree action to see long waiters and
follow up’s. Weekly meetings are in place with the COO and CD. Consultants are reviewing patients on the backlog weekly and appropriate action is being taken.

CLASSIFICATION
Version: 1.0 Page 5 of 7 Retention Date: 31/12/2037
Trauma and Orthopaedics
• Additional staff in Ortho Outpatients from January 2018 to increase capacity (evening & weekend), 100 additional patients seen in April.
• Additional theatre lists linked to Theatre utilisation and delivery of orthopaedic business case : 8 sessions in April
• 2 additional Consultants appointed to support business case delivery. Oral Surgery
• Additional outpatient lists Oral & Maxillofacial Surgery • Saturday paediatric snatch lists being planned dependent upon volunteers • Additional Orthodontic Consultant appointed in May 2018 to support
increased capacity to improve waiting times.
Plastic Surgery • Additional theatre lists • Additional Malignant Melanoma & Squamous Cell Carcinoma lists. Increased
capacity during March identified in both Day Surgery Units and Minor Operations, ongoing in April
• Additional Clinic capacity in March, ongoing in April • Additional breast reconstruction lists planned, ongoing in April
Diagnostic (DM01) In April 99.23% of patients were seen within 6 weeks. There were 27 breaches (16 MRI,4 CT, 4 Endoscopy and 3 Audiology).

CLASSIFICATION
Version: 1.0 Page 6 of 7 Retention Date: 31/12/2037
Cancer April has been a particularly challenging month with us failing the 2WW target which is very unusual. We had breaches in the following specialties: haem, lung, upper GI, breast and colorectal (34 in April). The colorectal team have now set up a weekly meeting with the Booking Team to look at capacity issues with the 2WW. Currently the colorectal team is short-staffed due to sickness. 62 day performance is tight but we are confident that we can reach 85% for the month. A report to show the monthly and quarterly Cancer Target Performance figures for the current quarter
Description Standard April May June Q1 2018-19
% In target Total % In
target Total % In target Total % In
target Total %
All cancer Two Week wait 93 694.0 777.0 89.32 716.0 793.0 90.29 21.0 31.0 67.74 1431.0 1601.0 89.38
Symptomatic Breast Two Week wait
93 68.0 97.0 70.10 52.0 64.0 81.25 1.0 1.0 100.00 121.0 162.0 74.69
31 Day Standard 96 95.0 98.0 96.94 47.0 49.0 95.92 0.0 3.0 0.00 142.0 150.0 94.67
31 Day Subsequent: Drug
98 9.0 10.0 90.00 5.0 6.0 83.33 0.0 0.0 - 14.0 16.0 87.50
31 Day Subsequent: Surgery
94 11.0 11.0 100.00 7.0 7.0 100.00 0.0 0.0 - 18.0 18.0 100.00
62 Day Standard 85 49.0 58.0 84.48 30.5 38.5 79.22 0.5 2.5 20.00 80.0 99.0 80.81
62 Day Screening Patients
90 1.0 1.0 100.00 1.0 1.0 100.00 0.0 0.0 - 2.0 2.0 100.00
Link to: Cancer Target Breaches By Month

CLASSIFICATION
Version: 1.0 Page 7 of 7 Retention Date: 31/12/2037
ICU
Links to Assurance Framework/ Strategic Plan: Choice – Ensuring deliver key of performance targets to encourage patients in choosing to be treated locally at SFT as a provider of high quality care and ensuring that intervention by regulators is not required
0
1
2
3
0
2
4
6
8
10
12
14
16
February March AprilCa
ncel
led
oper
atio
ns
Dela
yed
tran
sers
Delayed ITU transfers Feb - Apr 18
Over 72 hours
48-72 hours
24-48 hours
12-24 hours
0-12 hours
Cancelledoperations

L
Rolling 12 months
Metric NameNational Ceiling
/Standard
Local
TrajectoryApr-18
Patients Affected
in Apr-18
Trend Against National
Standard
Referral to Treatment Incomplete Performance 92% STF = 92.0% 92.0% 1,381
Referral to Treatment Incomplete Specialty
Compliance16 out of 16 10 out of 16
Zero tolerance RTT waits > 52 weeks 0 0 0
Metric NameNational Ceiling
/Standard
Local
TrajectoryApr-18
Patients Affected
in Apr-18
Trend Against National
Standard
A&E - 4 Hour wait from Arrival 95% STF = 93.8% 95.0% 290
A&E - 12 Hour Trolley Waits 0 0
Diagnostics - Patients waiting less than 6 weeks 99% 99.2% 27
Diagnostic Test Compliance*** 10 out of 10 6 out of 10
Urgent Ops Cancelled for 2nd time (Number) 0 1
Mixed Sex Accommodation Breaches 0 0
Infection control – Clostridium difficile (YTD) YTD: 2 YTD: 0 0
Infection control - MRSA* 0 0
Metric NameNational Ceiling
/Standard
Local
TrajectoryApr-18
Patients Affected
in Apr-18
Trend Against National
Standard
All Cancer two week waits 93% 89.2% 84
Symptomatic Breast Cancer - two week waits 93% 70.1% 29
31 day wait standard 96% 96.9% 3
31 day subsequent treatment : Drug 98% 90.0% 1
31 day subsequent treatment : Surgery 94% 100.0% 0
62 day wait standard from GP referral 85% 84.7% 9.0
62 day screening patients 90% 100.0% 0.0
Cells with black dotted outlines indicate provisional
data
*Please note: MRSA is no longer monitored by Monitor
**This excludes patients transferred to another Provider and now exceed 104 days
***Only Diagnostic examinations carried out in the reporting month shown are counted
Salisbury Hospital NHS Foundation Trust Board Report - April 2018
Reporting Month
Page 1 of 1

CLASSIFICATION: Unrestricted
Version: 1.0 Page 1 of 2 Retention Date: 31/12/2037
Report to: Trust Board Agenda
item: SFT4048
Date of Meeting: 7 June 2018
Report Title: Quality indicator – April 2018
Status: Information Discussion Assurance Approval
X
Prepared by: Claire Gorzanski, Head of Clinical Effectiveness
Executive Sponsor (presenting):
Dr Christine Blanshard, Medical Director Lorna Wilkinson, Director of Nursing
Appendices (list if applicable):
Quality indicator report – April 2018
Recommendation:
To note the Trust quality indicators and actions being taken to improve. Executive Summary:
Positive indicators show good infection prevention and control outcomes and no non-clinical mixed sex accommodation breaches. HSMR is within the expected range for the third consecutive month and high risk TIA performance has been sustained.
Of concern, is a reduction in the number of hip fracture patients being operated on within 36 hours. The introduction of the orthopaedic dedicated trauma lists was delayed until May and daily lists will be available in June. Stroke indicators are also an area for improvement with the team engaged with other acute Trusts in the STP and stroke network to determine how performance can be sustainably improved. Board Assurance Framework – Strategic Priorities Local Services - We will meet the needs of the local population by developing new ways of working which always put patients at the centre of all that we do
Specialist Services - We will provide innovative, high quality specialist care delivering outstanding outcomes for a wider population
Innovation - We will promote new and better ways of working, always looking to achieve excellence and sustainability in how our services are delivered
Care - We will treat our patients, and their families, with care, kindness and compassion and keep them safe from avoidable harm
People - We will make SFT a place to work where staff feel valued and are able to develop as individuals and as teams
Resources - We will make best use of our resources to achieve a financially sustainable future, securing the best outcomes within the available resources

1.0 Purpose 1.1 To provide the Board, Committees and Forums with the Trust’s quality indicators.
2.0 Background 2.1 The Accountability Framework sets out the performance function which oversees the delivery of all
elements of Trust performance throughout the year, including service performance and quality of care linked to the delivery of the Trust’s transformational and financial plans.
2.2 The Performance Framework sets out the metrics that each directorate will be held accountable for. The quality indicator report provides the metrics that the Trust uses to establish the quality of care provided by the Trust.
3.0 Quality indicator report 3.1 No cases of hospital apportioned C Difficile in April. Upper limit in 18/19 reduced to 18 cases. 3.2 Three MSSA bacteraemias. None were line related and all were on different wards. 3.3 One E Coli bacteraemia. Currently being investigated. 3.4 Two new serious incident inquiries. The Trust is seeking a downgrade from the CCG of one never
event that occurred in 17/18 as following the investigation it is felt it did not meet the criteria for a never event.
3.5 A decrease in the crude mortality rate in April. HSMR decreased to 102.8 to January 18 and is within the expected range. SHMI increased to 109 to September 17 and when adjusted for palliative care is 104.4 and is as expected. SFT has made good progress in Learning from Deaths and will be reporting Q3 and Q4 17/18 figures to the Board in June 18.
3.6 A decrease of patients with a hip fracture receiving surgery within 36-48 hours of admission. The introduction of orthopaedic dedicated trauma lists was delayed until May and daily lists will be available in June.
3.7 There was 1 fall resulting in moderate harm (fractured nose). The falls improvement work continues. 3.8 Time to CT scan 100%. The time to reach the stroke unit within 4 hours missed the standard due to
late transfers from ED (6) and admission to AMU instead of the stroke unit (3). 80% of patients spent 90% of their stay on the stroke unit.
3.9 Sustained improvement in the performance of high risk TIA patients seen within 24 hours. 3.10 Escalation bed capacity and multiple ward moves reduced. 3.11 No non-clinical mixed sex accommodation breaches. 3.12 A significant increase in the number of patients giving real time feedback about the quality of their
care as helpdesk managers now go to the wards to speak with patients directly. The Q4 staff friends and family test showed a decrease in those recommending the Trust as a place to work.
4.0 Summary Positive indicators show good infection prevention and control outcomes and no non-clinical mixed sex accommodation breaches. HSMR is within the expected range for the third consecutive month and high risk TIA performance has been sustained.
Of concern, is a reduction in the number of hip fracture patients being operated on within 36 hours. The introduction of the orthopaedic dedicated trauma lists was delayed until May and daily lists will be available in June. Stroke indicators are also an area for improvement with the team engaged with other acute Trusts in the STP and stroke network to determine how performance can be sustainably improved.
5.0 Recommendation To note the Trust quality indicators and actions being taken to improve. Claire Gorzanski, Head of Clinical Effectiveness, 14 May 2018

E-Coli - Trust apportioned reportable
2Serious Incidents Requiring
Investigation
In hospital cardiac arrests and futile CPR
Quality MeasuresTrust Quality Indicators - April 2018
Infection Control 2017-18 YTD 2018-19 YTD Trust Incidents 2017-18 YTD 2018-19 YTD
April
3 0
25
* Of these commissioned, 2 have been downgraded as they did not meet the SI definition. This was in agreement with the CCG.
MRSA (Trust Apportioned)
Clostridium Difficile - Trust Apportioned MSSA - Trust Apportioned
Never Events0 0
10 0 0 0
1 12
10
2
0 00
2
4
6
8
10
12
14
16
18
20
Clostridium Difficile - Trust apportioned HPA reportable Clostridium Difficile - Trust Cumulative YTD
Clostridium Difficile - Trust Target
0 0
1
2
1
0
1
2
0 0
3
1
3
0
1
2
3
4
5
6
7
8
9
10
MSSA - Trust apportioned reportable
*
3
00
1
2
3
4
5
Cardiac arrests Futile CPR
Please note cardiac arrests which occurred in ED, ITU, CCU and Paediatrics are excluded.
1
0
1
2
3
4
5
E-Coli - Trust apportioned reportable
Page 1 of 6

Quality MeasuresTrust Quality Indicators - April 2018
April
HSMR and SHMI
Fracture Neck of Femur operated on within 36 hours (Revised following TIAA Audit)Emergency Readmissions within 7, 14 & 30 days of Discharge
Hospital Mortalities
0
1000
2000
3000
4000
5000
6000
0
20
40
60
80
100
120
EL NE Under Palliative Care All other NE Total Admissions
68 78 100 82 73 62 69 54 70 67 68 66 49 96 87 74 79 69
0
40
80
120
160
200
90
95
100
105
110
115
120
125
130
Total Mortalities SHMI SHMI Adjusted for Palliative Care
Target Remodelled HSMR Weekend HSMR
23 25 24 25 25 20 32 26 25 33 17 22 31 27 24 28 18 140%
10%
20%
30%
40%
50%
60%
70%
80%
90%
100%
% Patients operated on <36hrs of Admission % Patients operated on 36-48hrs of Admission
No.of Patients admitted with #NOF % BPT Compliance
Target
0%
2%
4%
6%
8%
10%
12%
% Emergency Readmissions <7 Days % Emergency Readmissions <14 Days % Emergency Readmissions <30 Days
Page 2 of 6

Quality MeasuresTrust Quality Indicators - April 2018
April
Please note, in Mar-17 1 patient has 2 fractures. Please note, due to the time it takes to complete Clinical Coding, the current months Fracture Neck of Femur data will be subject
to change over the following months.
Patient Falls in Hospital
Pressure Ulcers Safety Thermometer - One Day Snapshot per Month
Venous Thrombous Embolism: Risk Assessment & Prophylaxis
1201 1406 1086 1251 1287 1246 1375 1527 1352 1313 1348 1330 1315 1115 1213 1140 1208 1438
250 333 334 377 328 323 308 309 257 305 308 350 296 265365 292 348 343
0
500
1000
1500
2000
2500
3000
70%
75%
80%
85%
90%
95%
100%
Number Risk Assessed Number Treatment Given
% VTE Risk Assessment % VTE Treatment received
0
1
2
3
4
5
6
7
8
Falls resulting in moderate harm Falls resulting in fracture or major harm Total Number of Fractures
1.3% 1.1%1.8% 1.7%
1.2%1.6%
1.0% 1.3% 1.0%
0.0%0.5%
0.9% 1.1%0.7%
1.6% 1.5%0.9% 0.8%
0%
1%
2%
3%
4%
5%
6%
7%
8%
9%
10%
50%
55%
60%
65%
70%
75%
80%
85%
90%
95%
100%
Ne
w P
ressu
re U
lcersH
arm
Fre
e P
ati
en
ts
% Harm Free Patients % New Harm Free % Patients with New Pressure Ulcer
New Pressure Ulcer Baseline (1.38%) New Pressure Ulcer Target (0.966%)
0.00
0.20
0.40
0.60
0.80
1.00
1.20
1.40
0
5
10
15
20
25
Qu
art
erl
y (
pe
r 1
,00
0 b
ed
da
ys)
No. of Grade III & IV Pressure Ulcers: Hospital Acquired No. of Grade II Pressure Ulcers
Quarterly Grade ll Pressure Ulcers per 1000 Bed Days
Page 3 of 6

Quality MeasuresTrust Quality Indicators - April 2018
April
SSNAP Case Ascertainment Audit
Highest level = Grade A
Lowest level = Grade E
Complaints - Total received
Complaints - Total re-opened
Concerns - Total received
Concerns - Total re-opened
25 24
2017-18
Tri-annually Apr - Jul Aug - Nov Dec - Mar
2016-17 B B D *From April 2016 escalation capacity includes beds on Breamore, DSU, Clarendon, Endoscopy, Avon, Britford SAU overnight stays,
Whiteparish AMU overnight stays, Clarendon NHS, Pembroke Suite and Burns assessment room.
TIA Referrals
36 29
Jan-18 Feb-18 Mar-18
26 12 26 8 17
1 0
2015-16
Dec-17
C
Escalation Bed DaysComplaints and Concerns
2
20
3
12
Apr-18Nov-17
37
4 3 2 3 3
1 1 2
Oct-17
12
4
24
1
D
Q3
C
Q4
C
Stroke Care
Q1 Q2
D C
Quarterly
0
200
400
600
800
1000
1200
1400
1600
1800
Total Number of Occupied Bed Days in Escalation Beds (see above for list)*
33 18 28 32 39 21 30 26 29 23 41 30 28 33 41 31 36 260%
10%
20%
30%
40%
50%
60%
70%
80%
90%
100%
Stroke Discharges % with 90% of their stay on Farley
% arrival to SU within 4 hours % CT'd within 12 hrs (from Jun-13)
17 11 24 23 12 16 22 18 15 16 9 18 19 29 36 17 18 310%
10%
20%
30%
40%
50%
60%
70%
80%
90%
100%
% High Risk TIA patients seen <24hrs (OP only from Dec-14) % High risk TIA patients seen 24 - 30hrs (OP only)
Total High Risk Patients (OP only from Dec-14)
100% 100% 100% 100% 100% 100% 100%
0
10
20
30
40
Oct-17 Nov-17 Dec-17 Jan-18 Feb-18 Mar-18 Apr-18
Complaints - Total re-opened Concerns - Total re-opened
Complaints - Total received Concerns - Total received
Complaints - % acknowledged (within 3 working days)
Page 4 of 6

Quality MeasuresTrust Quality Indicators - April 2018
April
Ward moves between 22:00 and 06:00
Delivering Same Sex Accommodation Patients moving multiple times during their Inpatient Stay
Apr-18
0
10
20
30
40
50
60
70
Nov-
16
Dec-
16
Jan-
17
Feb-
17
Mar-
17
Apr-
17
May-
17
Jun-
17
Jul-
17
Aug-
17
Sep-
17
Oct-
17
Nov-
17
Dec-
17
Jan-
18
Feb-
18
Mar-
18
Apr-
18
8 26 62 29 0 0 0 0 0 0 0 0 0 0 59 35 49 0
1 4 9 5 0 0 0 0 0 0 0 0 0 0 5 3 5 0
Number of Non-Clinical Breaches (Patients affected) Number of Non-Clinical Occurrences
2367 2793 2430 2682 2652 2720 2677 2720 2851 2878 2781 2869 2734 2879 2793
0.00%
0.20%
0.40%
0.60%
0.80%
1.00%
1.20%
1.40%
1.60%
1.80%
Total Admissions %age of patients moved more than 2 times
%age of patients moved more than once %age of patients moved more than 3 times
0
10
20
30
40
50
60
70
80
22:00
- 22:59
23:00
- 23:59
00:00
- 00:59
01:00
- 01:59
02:00
- 02:59
03:00
- 03:59
04:00
- 04:59
05:00
- 05:59
Moves per hour
Page 5 of 6

Quality MeasuresTrust Quality Indicators - April 2018
April
From October 2014 the Net Promoter Score (NPS) is no longer being used as a headline score.
The new score measures the % Recommended (Likely + Extremely Likely) and the % Not Recommended (Unlikely + Extremely Unlikely) to show the percentage of responses that would or wouldn't recommend the Trust.
Don't Know and Neither Likely or Unlikely responses are excluded from this measure.
The information contained in this document remains the property of Salisbury NHS Foundation Trust, and must not be used, copied, shared, or distributed without prior authorisation of the Trust. Any information approved for lease must be appropriately protected in line
with the NHS Information Security Standards and not shared via unsecure means.
Real Time Feedback: Overall how would you rate the quality of care you received?
Friends & Family Test: Responses by Area
Friends & Family Test: Staff (% Responses)
142 86 113 70 112 79 96 74 71 88 89 93 95 68 103 62 77 2100
50
100
150
200
250
6
7
8
9
10
Number of Respondents Mean Score of 5 possible responses Previous Year Average Goal
0%
10%
20%
30%
40%
50%
60%
70%
80%
90%
100%
2016-17 Q4 2017-18 Q1 2017-18 Q2 2017-18 Q4
Care or Treatment: Other Responses Place of Work: Other Responses Care or Treatment: Extremely & Likely
Place of Work: Extremely & Likely Overall Response Rate
0%
10%
20%
30%
40%
50%
60%
70%
80%
90%
100%
17-18 Q2 17-18 Q3 17-18 Q4 18-19 Q1
OP: % Not Recommend DC: % Not Recommend OP: % Recommend DC: % Recommend
0%
10%
20%
30%
40%
50%
60%
70%
80%
90%
100%
17-18 Q2 17-18 Q3 17-18 Q4 18-19 Q1
IP: % Not Recommend Maternity: % Not Recommend A&E: % Not Recommend
IP: % Recommend Maternity: % Recommend A&E: % Recommend
Page 6 of 6

An outstanding experience for every patient
Safe Staffing NQB Report
April 2018

Monthly Comparisons – Actual Staffing Levels Registered Nurses Nursing Assistants Combined Skill Mix
Month Planned hours Actual Hours % Planned
Hours Actual Hours % Planned Hours Actual Hours % RN NA
April -2018 61045 55646 91% 33609 4007 119% 94653 95716 101% 58% 42%

Overview of Nurse Staffing Hours – April 2018
Day RN NA
Total Planned Hours 36932 21072
Total Actual Hours 32477 25322
Fill Rate (%) 88% 119%
Night RN NA
Total Planned Hours 24113 12537
Total Actual Hours 23169 14748
Fill Rate (%) 97% 128%
The percentage hours are based on actual versus planned and are measured on a shift by shift basis.

Nursing Hours by Day Shifts Row Labels
Day RN Planned
Day RN Actual
Day RN Fill Rate
Day NA Planned
Day NA Actual
Day NA Fill Rate
Medicine 15481 13065 86% 10135 12869 125% AMU 1979 1773 90% 1038 1654 159%
Durrington 1153 1108 96% 819 1226 150% Farley 2220 1858 84% 1431 1967 137%
Hospice 895 915 102% 667 844 127% Pembroke 868 895 103% 726 740 102%
Pitton 1829 1445 79% 1185 1258 106% Redlynch 1589 1312 83% 1100 1318 120% Tisbury 2105 1817 86% 688 642 93%
Whiteparish 1324 858 65% 1021 1329 130% Winterslow 1520 1085 71% 1464 1894 129% Surgery 8034 7854 98% 3123 3849 122% Britford 2080 1982 95% 1095 1242 113%
Downton 1263 1305 103% 910 1118 123% Radnor 3447 3353 97% 423 412 97%
Breamore Short Stay 1244 1213 98% 696 1078 155% MSK 7893 6465 82% 6489 7353 117%
Amesbury 1605 1487 93% 1348 1489 110% Avon 1648 1285 78% 1884 1812 96% Burns 1560 1226 79% 737 1006 136%
Chilmark 1685 1321 78% 1076 1416 132% Tamar 1395 1147 82% 1443 1631 113% CSFS 5524 5094 95% 1326 1251 98%
Maternity 3112 2750 88% 987 913 93% NICU 1046 1077 103% 0 0 100% Sarum 1367 1267 93% 339 338 100%
Grand Total 36932 32477 88% 21072 25322 119%
Key: Less than 80% Between 80 - 90% Between 90 - 115% Greater than 115%

Nursing Hours by Night Shifts Row Labels
Night RN Planned
Night RN Actual
Night RN Fill Rate
Night NA Planned
Night NA Actual
Night NA Fill Rate
Medicine 9623 9338 98% 5671 7422 135% AMU 1507 1419 94% 345 748 217%
Durrington 690 691 100% 690 909 132% Farley 1035 1047 101% 690 1001 145%
Hospice 570 575 101% 510 729 143% Pembroke 690 692 100% 334 431 129%
Pitton 1035 1116 108% 690 713 103% Redlynch 1035 932 90% 690 771 112% Tisbury 1371 1258 92% 345 432 125%
Whiteparish 690 679 98% 688 745 108% Winterslow 1001 932 93% 690 945 137% Surgery 5449 5284 98% 2402 2817 115% Britford 1035 967 93% 679 826 122%
Downton 690 688 100% 690 741 107% Radnor 3045 2943 97% 345 334 97%
Breamore Short Stay 679 686 101% 689 917 133% MSK 4086 3822 95% 3417 3500 102%
Amesbury 1035 932 90% 686 755 110% Avon 900 852 95% 870 911 105% Burns 989 852 86% 690 654 95%
Chilmark 572 575 101% 572 600 105% Tamar 590 612 104% 600 580 97% CSFS 4957 4727 96% 1047 1010 165%
Maternity 2760 2577 93% 1035 976 94% NICU 1035 1035 100% 0 0 100% Sarum 1162 1115 96% 12 35 300%
Grand Total 24113 23169 97% 12537 14748 128%
Key: Less than 80% Between 80 - 90% Between 90 - 115% Greater than 115%

Overview of Areas with Red (Internal Rating Below 80%)
Flag Ward % RN NA Shift Mitigation
Red Pitton 79 √
Day
Uncovered shifts were reviewed throughout the day based on patient acuity and dependency & managed within the available skills sets to ensure safe care.
Red Whiteparish 65 √
Day
Additional NA shifts were implemented to support staffing gaps and ensure safe staffing supported by the remaining qualified staff on shift
Red Winterslow 71 √
Day Overstaffing of NA shifts enabled bolstering of staffing numbers to support safe staffing as above
Red Avon 78 √
Day
Unfilled shifts are reviewed on a shift by shift basis . If there are no respiratory patients or unfilled shifts are not causing concern , patient acuity and demand demonstrates the shift is manageable and safe then they are not escalated for temporary staff fill. Some shifts are covered by a locally skilled Band 3
Red Burns and Plastics
79 √
Day
The unit has high vacancy rates and utilises Band 3 staff to assist with cover . If there is no plastic surgery flap patient then the 3rd RN shift may remain unfilled and not put out for escalation.
Red Chilmark 78 √
Day Alternative grade cover used on to bolster staffing gaps and support safe staffing.
NB: Flags based on green 90% and above, amber 80-90%, red below 80% - no ratings yet agreed by NHS England

Trends and Themes TRENDS Although the shift in the wards flagging red continues the number of wards doing so has reduced from 8 to 6. The RN fill rate continued to be low during April at 91% with a compensatory uplift of additional NA numbers demonstrating a sustained widening gap between RN /NA fill rates The downward trend for RN fill rates now evidences a 7% reduction between November 2017 and this reporting month. This still appears to be a result of the increasing RN vacancy rate despite a concerted recruitment drive and on-going recruitment/retention initiatives.
The staffing trends remain reflected within the skill mix but this has been static for the last 2 months RN/NA are 58/42 for March & April compared to 59/41 for February. STAFFING NOTES The reporting percentage now includes day time Ward Leader supervisory shifts to reflect the continued demand for them to provide on-going clinical support from within this role (There are some exceptions*) Whilst shifts may remain unfilled, staff of this calibre help guarantee the presence of high level skills sets to support the provision of safe care against existing challenges. There is also the ability to bolster unfilled RN day shifts using other staff groups available during the day on an ad-hoc basis. These methods ensure focus is given to safe levels of RN cover at night where obtaining temporary staff cover is more challenging and expensive. By using flexible rostering this ensures good skills sets are provided. * Exceptions for including supervisory shifts where roles are different Amesbury ( ward leader covers two wards and is counted in Chilmark), Maternity, NICU and Radnor and Hospice Unfilled shifts:- often there is utilisation of alternative grade cover. Some shifts may remain unfilled but are managed within the existing skills sets. All are based on assessing staffing skills & numbers against patient acuity and demand to ensure they are both manageable and the provision of safe care.

Over-staffing
All additional shifts were for NA staff with over-staffing evidencing at 123% fill rate for both Day and Night shifts. The main reasons for NA Overstaffing remain the same as previous months and were for either: 1.Enhanced 1:1 care for patients at risk of falls, mental health
needs or confusion 2.Flexing bed stock and staffing levels to meet fluctuating patient
demands 3.Supporting RN shifts.

Actions taken to mitigate risk
The nurse-in-charge of individual wards in discussion with the DSN/ADSN review the following on a shift by shift basis.
• The accounting of the staff skills set when deciding on the band of staff needed.
• Staffing is discussed via safecare at least twice daily with senior nurses in attendance.
• All shifts are gauged with staff moved across wards by Directorate Senior Nurses and Clinical Site Team as required. This ensures safe levels of care are maintained whilst trying to reduce reliance on expensive temporary staff
• Staffing levels are reduced when beds empty/ procedure lists reduced whilst maintaining appropriate staffing ratios
• Shifts that are difficult to cover (nights and weekends) are prioritised.
• If all of the above measures have been taken there may be a requirement that staff on training days are brought back to work clinically as required and / or Sisters on supervisory shifts work clinically.
• CCOT team support wards where acuity of patients high.

Report to: Trust Board Agenda item:
Date of Meeting: 7th June 2018
Report Title: Finance Report Month 1
Status: Information Discussion Assurance Approval
x
Prepared by: Mark Collis, Deputy Director of Finance
Executive Sponsor (presenting):
Lisa Thomas, Director of Finance
Appendices (list if applicable):
Report attached
Recommendation:
Trust Board is asked to note the financial position for April 2018, the key risks and the actions being taken to mitigate them. Executive Summary:
The purpose of this report is to set out the Trust’s financial performance for the period to 30th April 2018. The deficit of £1,690k is £354k behind plan and this is mainly attributable to the clinical income plan not being achieved and is partly offset by underspends on pay and non-pay. The key clinical specialities which have material elective income variances are Orthopaedics £320k (44%) which is 50 elective spells behind plan; and Plastics £103k (33%) which is 15 elective spells. Both specialities are within the MSK directorate who has been asked to develop a recovery plan and are being monitored weekly. All of the main commissioner's contract financial envelopes have been agreed other than Dorset CCG and it has been recommended that a system audit is undertaken before any agreement can be reached on the baseline 2018/19.

PageArea of Review
Key HighlightsStatus against Plan
1 Income & Expenditure
2 NHS Clinical Income
3 Workforce
4 Non Pay
5Efficiency - Better Care at Lower Cost
6 Capital Expenditure
6 Cash Management
Executive Summary of Key Financial Performance - April 2018
RED
The deficit of £1,690k is £354k behind plan and this is mainly attributable to the clinical income plan not being achieved and is partly offset by underspends on pay and non-pay. The key clinical specialities which have material elective income variances are Orthopaedics £320k (44%) which is 50 elective spells behind plan; and Plastics £103k (33%) which is 15 elective spells. Both specialities are within the MSK directorate who has been asked to develop a recovery plan and are being monitored weekly.
The majority of activity under-performance against plan of £834k relates to elective activity (£612k) and excluded drugs & devices (£112k). Excluded drugs & devices are a pass-through cost and as such offset by underspends on expenditure. The key clinical specialities which have material elective income variances are Orthopaedics £320k (44%) which is 50 elective spells behind plan; Plastics £103k (33%) 15 elective spells and Urology £50k (36%) 8 elective spell behind plan. All of the main commissioner's contract financial envelopes have been agreed other than Dorset CCG and it has been recommended that a system audit is undertaken before any agreement can be reached on the baseline 2018/19.
Overall pay is underspent £103k but agency costs have exceeded plan by £130k due to the continuing high levels of vacancies and absence rates. Over half of the overspend on agency relates to the laundry using additional temporary staff to deliver new contracts. The overspend on Healthcare Assistants (HCAs) is partly offset by an underspend on registered nurses and it is acknowledged that this staff group is over-established in most ward areas to provide effective and safe patient care . The overspend on infrastructure costs relates to the laundry winning several new contracts and the associated increase costs of delivering the new service. This has been matched by additional income and therefore net zero impact on the bottom-line.
Red
The Trust is £122k behind the capital plan for the year but is expected to catch up in future months. The plan includes the purchase of hardware required for a substantial upgrade to the Trust's IT network. This work is expected to complete in September 2018 and the source of funds will be a finance lease. Otherwise, the source of capital funds for 2018-19 will be the Trust's planned depreciation charge for the year. The risks of capital schemes not being prioritised for 2018/19 will be shared with clinical governance committee.
RED
Drugs have a favourable variance of £175k, and this is offset by an under-recovery of income relating to excluded drugs. The adverse variance on clinical supplies mainly relates to the fact that non-pay savings targets sit in this non-pay grouping and have not been achieved. The overspend on outsourced healthcare is due to the continuing use of 18ww to deliver the endoscopy waiting times target. Within other non-pay variance, £265k relates to phased budget held in reserves.
The adverse variance against the plan of £381k is mainly driven by the poor performance of income schemes, particularly theatres - adverse £136k of which £99k is the additional orthopaedic activity. The remainder mainly relates to theatre utilisation and reduction in DNAs and cancellations not being achieved.
Green
The Trust's cash balance at the end of April was £4,943k which is £372k behind plan. The Trust borrowed £1.5m to help fund the anticipated deficit for the month. The Trust has submitted a 2018-19 plan to borrow £11.8m to cover the revenue deficit for the year. Debtors are slightly higher than plan as there is an outstanding invoice owed by Dorset CCG of £1.4m relating to over performance in 2017-18 and agreement in principle for payment of £1.2m has been reached with the expert determination panel.
Amber
Green
Green

RTT MIU
Incomplete pathways month end position 1 Arrival to departure 4 hour stay
#
#
#
#
#
#
#
1 Incomplete pathways #
Inpatient assessments Mean Inpatient Length of Stay Discharge timings
5 1 PURAT Ailesbury, Cedar, Longleat Before midday
1
Delayed Transfers of Care - bed days lost Community teams 90 day reablement 1 End of life support
No action needed
Action needed
Continuing challenge -Care homes reluctant to take in morning and at weekends.
92%
ActionLD service remains an area of concern - previously flagged to commissioners. Community Teams flagging as not in control with declining performance - likely to include some data quality errors - system design work ongoing to lessen likelihood of this in future.
100%
100%
Dementia
VTE
VTE prophylaxis
MUST
MRSA
#
In control On target ActionAction
No action needed
Mulberry
Step up
Step up excluding
delays
Action
Action needed
In Control On target
100%
99%
Ailesbury, Cedar,
Longleat
Action
No action needed
98%
99%
98%
All overall targets in control and on target.
PURAT
Falls
In Control On target
On target Action
of occupied beds (Target <20%)
10
17
31
1
9
In Control On target
99%
96%
98%
No action needed
April 2018
Community Teams
Continence service
LD
Outpatient Physio
Podiatry
Wheelchair service
WON
% under 18 weeks
Complete pathwaysIncomplete pathways
Performance Dashboard
Breaches
114
1
88%
99%
63%
99%
Significant data quality concerns affecting both cohort and performance. Action: System project underway to address cohort concerns and to allow transparent performance review.
67%Data quality
concerns
In control On target ActionExcellent performance continues.
No action needed
11%In Control
Process changes in December 2017 have had a significant impact on the number of days lost to delays each month. Care package delays continue to be the biggest cause of lost days each month.
Action needed
Left without being seen Transfers to acute
In Control On target Action
99% 5% 6%
Performance on 4 hour stay and patient feedback remains strong. Data challenges remain around left without being seen and transfers to acute - action to put MIU on SystmOne to address this; project ongoing. Significant operational pressures are not reflected in the data.
Arrival to departure 4 hour stay
patients supported by the community teams to die in place of choice
26.0
38.7
33.6
29.9
In control On target
all measured in days excludes transfers to hospital and deaths
Before midday Weekend
38% 10%
Progress on DToCs has not yet translated into significant LoS reduction. Action ongoing - focus to incorporate stranded patients.
95th centile
138 88%
90%
92%
94%
96%
98%
100%
May Apr
Target Data Mean Control limits
Arrival to seen
92%
94%
96%
98%
100%
102%
May Apr
Target Data Mean Control limits
median 27 minutes
minutes
82%84%86%88%90%92%94%96%98%
100%
May Apr
Target Data Mean Control limits
05
101520253035404550
May Apr
Target Data Mean Control limits
0%10%20%30%40%50%60%70%
May Apr
Target Data Mean Control limits
1 0 0
24 62
118 0
18 0
48
AssessmentFunding
Non acute NHS careResidential home
Nursing homeCare package
EquipmentChoice
DisputesHousing
0%
5%
10%
15%
20%
25%
30%
35%
40%
May Apr
Target Data Mean Control limits
Control limits recalculated due to process change Dec-2017: Closer management of delayed patients
0%10%20%30%40%50%60%70%80%90%
100%
May Apr
Target Data Mean Control limits
April
April
50%
60%
70%
80%
90%
100%
May Apr
Target Data
Mean Control limits

Sickness: Sickness absence has increased in month fro
Va Incidents Complaints/Concerns RIDDOR
37
Actual impact# 1-Near Miss Duty of Candour compliance
# 2-None (No Harm)
# 3-Low
# 4-Moderate
# 5-Severe
# 6-Death National Mandatory Audits - 1 completed in month
2
Sickness/Vacancy Training/Appraisals Turnover Bank/Agency spend %
Infection Prevention & Control Deaths Falls Medication errors5 5
4 death(s) in month 12 1 0 4.4 per 1000 OBD 1.5 per 1000 OBD 4.8 0
# 0 0
# 0 2 1
# 0 0
##
#
41
Avoidable Pressure Ulcers Safety Thermometer Friends and Family Test Inpatient assessments
2 5
Mar-18
18
2
Picker are currently not sending us through any data and so we have nothing to report. WHC are planning to bring the FFT in house in the future and are developing ways to manage this.
Missed
0
98%Wards and Teams combined
92.64%
Community Wards 97.70%
Community Teams 90.06%
Completed
100%
Bank Staff Spend (%)
Mar-18
VTE prophylaxis
VTE assessment
100%Early Warning Score
Palliative care deaths are excluded from Apr 17 (in line with National benchmarking definition)
error(s) in month
99%
Percentage of Harm Free Care (new harms)
Fall(s) with harmfall(s) in month
Financial Year to Date
3RIDDOR report(s)
OverdueCompleted
In month
Mar-18 Mandatory training
83% Appraisals compliance
76% Mar-18
20%80%
80%
Sickness is 1% above same time last year. This is due to management of long term sickness.
4
40%15
per 1000 OBD
Verbal
Written
Report shared
60%
20%
Prev 12 months
March 2018Quality Dashboard
7
122
Mar-18
All services
Incidents Requiring Further Investigation
3.61% 10.50%96.83 WTE
Overdue incidents
%
Vacancy rate
Voluntary turnover
rate13.78%Turnover
rate15.96%
Sickness rate
7 avoidable pressure ulcers acquired in month 1.03 per 1000 caseload
MRSA incidence
Bed days lost to norovirus
00
The patient was recorded as C.difficile colonisation in Aug 17 whilst in RUH, however they were asymptomatic and did not require isolation or treatment, although
4.2% of discharges
C diff incidence
E coli incidence
0Hospital Acquired Thrombosis
Audit uploads
#N/A
MUST assessment 96% 98%
Please note: There is no benchmarking value for medication errors with harm
Falls assessment
#N/A
98%
Harmful error(s)13
100% 100%
100%
100%
per 1000 OBD
Feb-18
Response compliance 50% Open ombudsman cases 0
Medication errors now included on the community teams and specialist services sections within this dashboard.
This graph shows the total verified Category III and IV avoidable pressure ulcers. Decrease in return for March, see community teams and inpatients tabs. The quality team continue to work with teams to improve compliance.
Agency staff spend (%)
recommend score
3
0
95
0
The figures for both appraisals and training are below our excpectation, however plans are in place and WHC are working toward a 90% target in both areas
0%
2%
4%
6%
8%
10%
12%
14%
Apr May Jun Jul Aug Sep Oct Nov Dec Jan Feb Mar
Selected ward mean (4 wards) Benchmark
2 1 1 3 1 3 2 3 9 2 2 4 No. of deaths
0
5
10
15
20
25
30
Apr May Jun Jul Aug Sep Oct Nov Dec Jan Feb Mar
Selected ward mean (4 wards) Benchmark
41 24 35 31 27 21 32 24 21 18 31 12 No. of falls
0%
5%
10%
15%
20%
Apr Mar0%
5%
10%
15%
20%
Apr Mar
0
50
100
150
200
250
300
Apr May Jun Jul Aug Sep Oct Nov Dec Jan Feb Mar
Inci
dent
s
Clinical incidents Non clinical incidents
0
2
4
6
8
10
12
Apr May Jun Jul Aug Sep Oct Nov Dec Jan Feb Mar
Number of complaints Number of concerns/queries
0123456789
10
Apr May Jun Jul Aug Sep Oct Nov Dec Jan Feb Mar
STEIS and HFC Harm Free Care panel only
0123456789
1011
Apr May Jun Jul Aug Sep Oct Nov Dec Jan Feb Mar
Selected ward mean (4 wards) Benchmark
8 11 7 3 4 3 6 2 8 3 8 13 No. of errors
No. of pressure ulcers (all)
0
2
4
6
8
10
Apr May Jun Jul Aug Sep Oct Nov Dec Jan Feb Mar
Selected team mean (11 teams) Benchmark
16 12 9 10 15 15 14 11 10 9 12 7
0%
5%
10%
15%
Apr Mar50%
75%
100%
Apr Mar
Category III
Category IV
0 0 0 1 1 1 1 2 0 0 1 1
1 1 1 0 1 1 0 0 1 0 1 0
0%
25%
50%
75%
100%
Apr Mar
50%
75%
100%
Apr Mar
Show response numbers
0%
50%
100%
Apr May Jun Jul Aug Sep Oct Nov Dec Jan Feb Mar
Verbal Written Completed & Report Shared

CLASSIFICATION Unrestricted Staff
Version: 1.0 Page 1 of 7
Retention Date: 31/12/2037
Report to: Trust Board (Public)
Agenda item:
SFT4048
Date of Meeting: 07 June 2018
Report Title:
Status: Information Discussion Assurance Approval
X
Prepared by: Mark Geraghty, Head of Workforce Information & Planning Glennis Toms, Interim Deputy Director of OD and People
Executive Sponsor (presenting):
Paul Hargreaves, Director of OD and People
Appendices (list if applicable):
Executive Summary of Key Workforce Performance Month 12 Workforce KPIs Month 12 2017/18 Areas for Concern Month 12 2017/18 Phase 2 People Strategy template example
Recommendation:
It is recommended that the Trust Board note the report, areas of concern and actions underway. Executive Summary:
The Executive Summary of Key Workforce Performance and the Month 1 Workforce Dashboard (see appendix) details the Trust’s performance against the key workforce indicators. The pay bill is overspent by £11k (0.09%) year to date. Agency spend has increased in month by £222k to £661k, with significant increases in Registered Nursing & Midwifery of £116k and the addition of NHS Infrastructure Support of £117k agency spend for Laundry which has not previously been included. Recruitment remains challenging; however we are taking proactive measures to recruit both domestically and internationally, as detailed in the paper. The implementation plan for TRAC electronic recruitment system this week is in place. The Trust’s sickness rate has reduced slightly again this month to 3.53%. With local sickness management action plans underway, long term sickness has decreased although there has been an upturn in short term absence. “Anxiety/stress/depression” remains the top reason for absence, accounting for 20% of the total.

CLASSIFICATION
Version: 1.0 Page 2 of 7 Retention Date: 31/12/2037
Board Assurance Framework – Strategic Priorities
Select as applicable
Local Services - We will meet the needs of the local population by developing new ways of working which always put patients at the centre of all that we do ☐ Specialist Services - We will provide innovative, high quality specialist care delivering outstanding outcomes for a wider population ☐ Innovation - We will promote new and better ways of working, always looking to achieve excellence and sustainability in how our services are delivered ☐ Care - We will treat our patients, and their families, with care, kindness and compassion and keep them safe from avoidable harm ☐ People - We will make SFT a place to work where staff feel valued and are able to develop as individuals and as teams ☒ Resources - We will make best use of our resources to achieve a financially sustainable future, securing the best outcomes within the available resources ☒ 1. Purpose
This report provides the position against workforce key performance indicators at Trust level, with trend analysis over time, and sets out actions underway or necessary to achieve targets.
2. Background The Month 1 data shows a £11k (0.09%) overspend on the pay bill year to date, which remains to be, in part, due an over-reliance on agency as a result of recruitment difficulties and sickness absence levels.
Agency spend has increased by £222k to £661k, sickness absence has reduced to 3.53% and the vacancy rate has increased by 2% to 7.9%. This increase is due to the movement of subsidiary companies (OML, STL) with above average vacancy levels into the Trust's consolidated account, general movement of capital FTE to revenue (GS1, Informatics, etc), creation of a reserve to fund posts when they come on stream and permanent funding of other initiatives including enhanced cleaning, OD and People transformation. Agency usage in this area will create a significant challenge to spend.
Mandatory training compliance is green at 85.59%, however has increased slightly from last month’s 85.39%). Appraisal compliance for non-medical staff remains amber at 84.10% whilst appraisal compliance for medical staff is above target at 88.11%.
3. Resourcing 3.1 Recruitment Nursing remains a challenging area to recruit; using the Month 1 baseline, the Trust needs to recruit 116 wte nurses to achieve a fill rate of 95% of establishment. Over the last year the Trust has recruited an average of 6 wte nurses per month, with the same number leaving.

CLASSIFICATION
Version: 1.0 Page 3 of 7 Retention Date: 31/12/2037
If nurse recruitment was doubled to 12 wte per month (on average), it would take 19 months to reach our target of 95% establishment fill.
We aim to increase our vacancy fill rate. We are: • Contracting with MSI who provide IELT’s/OET passed international nurses for
interview via Skype. This means that the arrival time can be as quick as 8 weeks or up to 8 months. First skype interviews will be held in June. Aim is to interview at least 10 per month for a duration of 6 – 8 months.
• Arranging to attend Career events for 3rd year nursing students at 2 large universities in Perth (Edith Cowan and Murdoch Universities).
• Attending the recruitment events in Brisbane, Sydney and Melbourne in June (9th, 13th and 16th) with Health Sector Jobs.
• Attending recruitment events in Dubai and Abu Dhabi in November (9th and 10th) with Health Sector Jobs.
• Attending Military Event, Tidworth – 20 June 2018 • British Forces Relocation Services Event, Tidworth – 13 September 2018. To note,
the Trust has arranged for a 1 year advertising booked with Pathfinder (magazine for military, 25,000 copies in circulation with 12 month shelf life) which is circulated free to all armed forces service leavers.
• University of South Wales, Cardiff - attended the Careers Events for Nursing students at on 10 April 2018. 47 contacts to be followed up.
• Nursing Assistant Careers Event – rescheduled to 16 June 2018 Nursing Summary
Turnover (year to date)
Nursing and Midwifery Registered 10.24%
Top 3 areas of turnover (year to date) > 5.00 FTE
Rheumatology Clinic 36.83%
Pitton Ward 29.35%
Downton Ward 25.38%
Vacancies M1
Nursing and Midwifery Registered 17.58%
Top 3 areas of Vacancies >10.00 FTE
DSU Clinical Staff 16.80 FTE
Farley Ward 10.72 FTE
Avon Ward 8.82 WTE
Sickness Absence Rolling 12 Months
Nursing and Midwifery Registered 3.90%

CLASSIFICATION
Version: 1.0 Page 4 of 7 Retention Date: 31/12/2037
Top 3 areas of sickness absence > 10.00 FTE
Theatres Recovery 8.68%
Tisbury Ward 8.05%
Palliative Care/Hospice 7.06%
Voluntary services
Work Experience interviews taking place with placement offers being sent out early July.
• Met with HelpForce on Wednesday 9th May at 11.00am. Very positive meeting from which we are hoping SDH will be recruited to work with them on improving service delivery. Future meetings being set up in late June/early July
• Attended Leadership Development Programme meeting in London on 30th May 2018 held by HelpForce to discuss what training/development volunteer leads should have, what it should look like, how long it should take, and whether it would be a degree/masters level.
• Volunteers Week 1 – 7th June. Notice boards in Springs • Volunteers Day as part of Volunteers Week, to include the presentation of Service
Awards to volunteers on Wednesday 6th June 2018 from 2.00pm – 5.00. Afternoon tea to be served with Nick Marsden presenting volunteers with their awards.
• Physiotherapy Study Day planning for event 10th July 2018. • Volunteering Policy approved and ratified by OMB and sent to SMARTCARDS • Planning next Volunteers Trust Induction for early July 2018
3.2 Retention Staff turnover is above target at 10.28% and a slight improvement on last month’s 10.62%. Work is ongoing to improve retention generally, and particularly for nurses, including:
• Revised Exit questionnaire and 100 day process refreshed with process agreed now live.
• Review of the Trust Induction Programme has now commenced to encompass delivery of sessions, extent of programme and MLE.
• 3rd year student nurses, 13 were interviewed and 13 offers made – 1 yet to accept • Scoping and development of a 2 year Graduate Development Programme for newly
qualified Nurses commencing employment at the Trust • Development of Careers Clinics for Registered Nurses; following mixed success of
pilot (due to weather conditions), a second session was held on 24 May 2018 which 4 individuals attended. Intended to use this format for “road show” across the Trust.
• The Internal ‘Transfer Scheme’ for Registered Nurses is now live and in future we will report on uptake of this arrangement.

CLASSIFICATION
Version: 1.0 Page 5 of 7 Retention Date: 31/12/2037
3.3 Temporary Staffing Month 1 agency spend has increased to £661k which is a £229k overspend against our £432k NHSI agency control total. Of this overspend, £117k relates to Laundry Agency spend which has not previously been included in the Trust total. This represents a significant challenge since STL rely on Agency staff to service their required flexibility and their method of working is outside of the Trust’s control. However, Registered Nursing has also increased by £116k and we are focussing on recruitment and reducing sickness absence in order to address this element. We aim to reduce our reliance on expensive agency staff. We are:
• The Workforce Committee meeting on 21st May discussed the potential for a Managed Service Provider and further work is required on this prior to a decision. In the meantime, the contract with current supplier ends in July and Brookson had been engaged on an interim basis to manage medical, AHP and HCS locum requirements.
• Continuing to use Locums Nest for bank medical locums and implemented collaborative working with Hampshire, Royal Surrey and Ashford and St Peters Hospitals from 1st May.
4. Health & Wellbeing
4.1 Sickness Absence Our current sickness absence rate of 3.53% in month 1 is a slight improvement over last month and lower than the average rate for local Acute NHS Trusts at 3.59%. A reduction in our sickness rate of 0.53% (to reach the 3% target) would mean a reduction in sickness by 15.45wte (£637k based on an average salary cost). There has been a decrease in long term sickness and an upturn in short term sickness in the month, with anxiety/stress/depression still accounting for over 20% of the total absence. We aim to bring sickness absence back to target. We are:
• The Management of Attendance Policy and manager toolkit is being implemented in week commencing 4th June. At least 15 management teams across the Trust have requested a briefing session on the toolkit which will roll out throughout June.
• People Business Partners will be working closely with their Directorates to create individual action plans for those absent long term and those with frequent short term absences.
• Refreshing the focussed piece of work in Theatres to support the management of both short and long term sickness absence. Additional support from Occupational Health for this piece of work has been agreed.
• Evaluating the results of recent resilience work/training undertaken separately by Clinical Psychology and Occupational Health to determine the potential positive effects of rolling out this approach, given the high levels of stress/anxiety/depression within the absence profile.

CLASSIFICATION
Version: 1.0 Page 6 of 7 Retention Date: 31/12/2037
5. Organisational Development & Engagement
5.1 Learning & Development Mandatory training
Compliance has slightly increased this month and remains green at 85.59%. Following conversations with other Trusts who use MLE supported by Kallidus it has become clear that our IT infrastructure may be a contributing factor to issues with MLE. IT are running a series of checks on the MLE packages to try and identify whether the issues are around, browsers, plug-ins, java script etc. Once the checks have been completed an action plan will need to follow to address the issues. In the meantime a trouble shooting guide has been produced which will help users to overcome some of the compatibility issues.
Appraisals Compliance for non-medical staff remains amber at 84.1%, a slight reduction on last month’s compliance of 84.7%. Medical staff appraisals are green at 88.11% compared with last month’s compliance of 91%. 5.2 Engagement The “Let’s Get Engaged” plan was launched in April and over a hundred ideas and suggestions put forward so far. A good number and range of people have volunteered or been nominated to join the staff engagement group which will be inaugurated in June. 5.3 Apprenticeships
The latest apprenticeship standards have been circulated and this will be updated on a monthly basis. Drop in sessions for prospective apprentices are being run regularly and there is an increasing amount of interest with recognition that coaching, leadership, management and the development of clinical skills can all be accessed via this route. For example, the recent broadcast about a Senior Leadership Master Apprenticeship has resulted in 10 expressions of interest in 24 hours.
6. Workforce Risks
Work continues to align our risks to the revised Board Assurance Framework and our four key priorities in the developing People Strategy, namely:
• Resourcing and Talent Management - Failure to recruit and retain staff will result in SFT being unable to deliver safe, sustainable services for patients.
• Business Partnering – Inaccurate workforce information will result in misalignment between the organisational and workforce strategies.
• Health and Wellbeing - Failure to achieve an outstanding experience for every patient because staff do not feel valued and able to contribute fully to work as a consequence of low morale.

CLASSIFICATION
Version: 1.0 Page 7 of 7 Retention Date: 31/12/2037
• Organisational Development and Engagement - Failure to deliver excellence for all patients if the workforce is not appropriately skilled and staffed to the right level
The Corporate Risk Register has been updated this month and actions are ongoing to mitigate the risks recorded.
7. Future Workforce Plan
The plan for the remainder of this year is to implement Phase 2 of the People Strategy within the four pillars mentioned in the previous section. The scope, interventions, and target savings required for each of these are being worked up currently and the completed example for Health and WellBeing is included in the Appendices to this Report.
8. Summary
The situation remains challenging, although generally improving. The actions described in section 3, 4 and 5 will ensure that the workforce is appropriately engaged and managed to maximise patient care and experience. However, it is acknowledged that the key areas of pressure remain recruitment, temporary staffing overspend and sickness absence. Our focus at a local level continues to be supporting both managers and staff in resolving these difficult areas while we begin to build sustainable solutions through the OD & People restructure at Salisbury whilst we continue to be at the centre of the workforce collaboration in the STP.
9. Recommendations The Trust Board note the report, areas of concern and actions underway.
Paul Hargreaves Director of Organisational Development and People

Area of Review Key Highlights Status Trend Target
Turnover/ Retention
8.50%
Vacancies 5.00%
Temporary Spend
£513,333
Sickness 3.00%
Training 85.00%
Non-Medical Appraisals
85.00%
Executive Summary of Key Workforce Performance
In Month: In month there were 67 leavers and 70 starters (headcount) compared to 52 leavers and 71 starters in the month before. This figure includes bank and locum staff. Year to Date: For the rolling year to date, the turnover rate was above target at 10.28%, this compares to last months position which was 10.62%. For the rolling year to M1 2017/18, the Trust's turnover rate was 10.98%. Top 3 Hotspots: The Directorate with the highest turnover rate for the rolling year was Corporate at 13.41%, followed by Medicine (10.18) and Clinical Support and Family Services (9.94%).
In Month: Vacancies have increased from 5.90% in month 12 to 7.90% in month 1. This increase is due to the movement of subsidiary companies (OML, STL) with above average vacancy levels into the Trust's consolidated account, general movement of capital FTE to revenue (GS1, Informatics, etc), creation of a reserve to fund posts when they come on stream and permanent funding of other initiatives including enhanced cleaning, OD and People transformation. Year to Date: The average vacancy rate is 6.56%, this compares to last months average position which was 7.38%. The Trust's vacancy rate for the same period last year was 6.97%. Top 3 Hotspots: The Directorate with the highest vacancy rate for the month was Corporate at 13.69%, followed by Musculo-Skeletal (10.80%) and Medicine (9.58%).
In Month: There has been an increase in agency spend this month to £661,496, compared to last month's position which was £438,670. There was a technical adjustment in M12 (there was an over accrual in M11) totalling £114K. Year to Date: The financial year to date total agency spend is £661,496, compared to the spend for the same period in the previous year which was £513,765. Top 3 Hotspots: The Directorate with the highest agency spend for the month was Medicine with £279,639, followed by Surgery (£126,119) and Musculo-Skeletal (£57,357).
In Month: There has been a decrease in the sickness rate this month at 3.53%, this compares to last months position of 3.56%. Year to Date: The year to date rolling sickness rate is at 3.64%, which compares to last months position of 3.61%. The sickness rate for same period last year was 3.42%. Top 3 Hotspots: The Directorate with the highest sickness rate for the month was Facilities with 5.69%, followed by Surgery (4.52%) and Musculo-Skeletal (4.20%).
In Month: Mandatory training compliance levels have increased this month to 85.59%, this compares to last months position of 85.39%. Compliance for the same period in 2017 stood at 84%. Year to Date: The year to date average compliance level is 85.81%, this compares to last months position of 85.57%. Top 3 Hotspots: The Directorate with the lowest compliance rate was Medicine with 79.36%, followed by Corporate (79.40%) and Clinical Support and Family Services (86.35%).
In Month: Non-Medical Appraisal compliance has decreased this month to 84.10%. Non-medical appraisal compliance for the same period last year stood at 80%. Year to Date: The year to date average compliance is 84.40%, this compares to last months position of 82.67%. Top 3 Hotspots: The Directorate with the lowest compliance rate was Medicine with 71.70%, followed by Corporate (74.40%) and Musculo-Skeletal (82.90%).
RED
GREEN
AMBER
AMBER
RED
RED

TrainingStarters (head count in month)
Starters (FTE in month)
Leavers (head count in month)
Leavers (FTE in month)
Average Heads (in year)
Number of Leavers (in year)
Turnover (rolling year)
Budget Wte (Ledger)
Staff In Post Wte (Ledger - month end)
Vacant Wte
Vacancy Rate
spend on Agency
% Temp Spend on Agency (in month)
spend on Bank
Total Temp Spend
Agency Budget
Long Term Sick WTE lost (in month)
% Short Term Sick WTE lost (in month)
% Total WTE lost to Sickness (in month)
Sickness Rate
Mandatory Training
% Complete Medical Staff
% Complete non-medical staff
Perf
orm
ance
Dis
cipl
inar
y
Grie
vanc
e
Bully
ing
and
Har
assm
ent
Tota
l Cas
eloa
d
YTD Trend
Month Trend
Target 29 242 8.50% 157.20 5.00% £ 513,333 40.00% 88.60 3.00% 85.00% 85.00% 85.00% 0
Jan-18 74 35.17 59 29.81 2,845 292 10.27% 3,143.94 2,953.46 190.48 6.06% 608,118£ 52.46% 550,985£ 1,159,103£ Over 69.19 53% 60.76 47% 129.95 4.42% 86.76% 89.41% 84.40% 4 4 1 - 9
Feb-18 37 29.11 41 20.04 2,854 292 10.24% 3,148.92 2,947.53 201.39 6.40% 629,765£ 50.30% 622,370£ 1,252,135£ Over 68.88 60% 46.01 40% 114.89 3.90% 85.49% 88.57% 84.40% 6 4 1 - 11
Mar-18 71 36.81 52 29.78 2,862 304 10.62% 3,150.10 2,964.36 185.74 5.90% 438,670£ 40.79% 636,797£ 1,075,467£ Under 63.73 60% 43.04 40% 106.77 3.56% 85.39% 91.06% 84.70% 6 5 1 - 12
Apr-18 70 40.13 67 18.25 2,880 296 10.28% 3,300.81 3,040.14 260.67 7.90% 661,496£ 52.70% 593,631£ 1,255,127£ Over 61.28 58% 44.76 42% 106.04 3.53% 85.59% 88.11% 84.10% 10 6 4 - 20
0
0
0
0
0
0
0
0
totals 252 141.22 219 97.88 Average 10.35% Average 6.56% 584,512£ Rolling Year 3.64% 85.81% 26 19 7 - 52
Sickness Employee Relations - Formal
Salisbury NHS Foundation Trust Workforce Dashboard
Data excludes: Docs in Training & Tupe Transfers. Data includes: Bank Staff
Strs/Lvrs Turnover (FTE) Vacancies Temporary Spend Appraisal
Note: Month 1 position shows an overspend on workforce of £11k (0.09%).

TrainingStarters (headcount in month)
Leavers (headcount in month)
Average Heads (in year)
Number of Leavers (in year)
Turnover (rolling year)
Budget Wte (Ledger)
Staff In Post Wte (Ledger - month end)
Vacant Wte
Vacancy Rate
spend on Agency
% Temp Spend on Agency (in month)
spend on Bank
Total Temp Spend
Agency Budget
Long Term Sick WTE lost (in month)
% Short Term Sick WTE lost (in month)
% Total WTE lost to Sickness (in month)
Sickness Rate
Mandatory Training
% Complete Medical Staff
% Complete non-medical staff
YTD Trend
Month Trend
Target 3 29 8.50% 21.07 5.00% 40.00% 9.55 2.75% 85.00% 85.00% 85.00%
Jan-18 5 3 346 30 8.65% 421.39 347.26 74.13 17.59% 76,453£ 47.11% 85,835£ 162,288£ 7.93 58% 5.76 42% 13.69 3.91% 88.65% 86.54% 84.10%
Feb-18 2 5 344 33 9.62% 422.19 342.20 79.99 18.95% 92,411£ 41.78% 128,769£ 221,180£ 6.86 60% 4.51 40% 11.37 3.31% 89.79% 82.69% 82.80%
Mar-18 12 4 343 35 10.17% 420.39 344.07 76.32 18.15% 70,380£ 29.45% 168,600£ 238,980£ 8.36 58% 6.12 42% 14.48 4.10% 89.86% 88.46% 86.70%
Apr-18 4 3 352 34 9.80% 516.61 460.82 55.79 10.80% 57,357£ 41.51% 80,813£ 138,170£ 6.95 47% 7.84 53% 14.79 4.20% 89.80% 84.62% 82.90%
totals 23 15 Average 9.56% Average 16.37% 74,150£ Rolling Year 3.90% 89.53%
Data excludes: Docs in Training & Tupe Transfers. Data includes: Bank Staff
Musculo Skeletal Directorate Workforce DashboardStrs/Lvrs Turnover (FTE) Vacancies Temporary Spend Sickness Appraisal

Area of Review Key Highlights Status Trend Target
Turnover/ Retention
8.50%
Vacancies 5.00%
Temporary Spend
Sickness 2.75%
Training 85.00%
Non-Medical Appraisals
85.00%
Executive Summary of Key Workforce Performance
In Month: In month there were 3 leavers and 4 starters (headcount) compared to 4 leavers and 12 starters in the month before. This figure includes bank and locum staff. Year to Date: For the rolling year to date, the turnover rate was above target at 9.80%, this compares to last months position which was 10.17%.
In Month: There was an decrease in the vacancy rate this month, 10.80%, compared to 18.15% last month. Year to Date: The average vacancy rate is 16.37%, this compares to last months average position which was 15.65%.
In Month: There has been a decrease in agency spend this month at £57,357, compared to last month's position which was £70,380. Year to Date: The financial year to date total agency spend is £57,357, compared to the spend for the same period in the previous year which was £94,814.
In Month: There has been an increase in the sickness rate this month at 4.20%, this compares to last months position of 4.10%. Year to Date: The year to date rolling sickness rate is at 3.90%, which compares to last months position of 3.83%.
In Month: Mandatory training compliance levels have decreased this month to 89.80%, this compares to last months position of 89.86%. Year to Date: The year to date average compliance level is 89.53%, this compares to last months position of 88.72%.
In Month: Non-Medical Appraisal compliance has decreased this month to 82.90%, from last months position of 86.70%. Year to Date: The year to date average compliance is 84.13%, this compares to last months position of 80.86%.
RED
GREEN
RED
RED
AMBER
GREEN

TrainingStarters (headcount in month)
Leavers (headcount in month)
Average Heads (in year)
Number of Leavers (in year)
Turnover (rolling year)
Budget Wte (Ledger)
Staff In Post Wte (Ledger - month end)
Vacant Wte
Vacancy Rate
spend on Agency
% Temp Spend on Agency (in month)
spend on Bank
Total Temp Spend
Agency Budget
Long Term Sick WTE lost (in month)
% Short Term Sick WTE lost (in month)
% Total WTE lost to Sickness (in month)
Sickness Rate
Mandatory Training
% Complete Medical Staff
% Complete non-medical staff
YTD Trend
Month Trend
Target 5 46 8.50% 32.49 5.00% 40.00% 19.42 3.40% 85.00% 85.00% 85.00%
Jan-18 12 5 545 59 10.82% 649.75 571.10 78.65 12.10% 375,835£ 63.76% 213,662£ 589,497£ 18.65 63% 10.86 37% 29.51 5.24% 78.82% 87.93% 73.50%
Feb-18 7 - 549 57 10.34% 649.70 580.97 68.73 10.58% 361,918£ 62.42% 217,860£ 579,778£ 19.23 72% 7.48 28% 26.71 4.69% 79.29% 82.54% 72.30%
Mar-18 9 3 552 58 10.50% 651.97 583.54 68.43 10.50% 282,229£ 51.70% 263,642£ 545,871£ 17.64 69% 8.03 31% 25.67 4.34% 78.93% 89.23% 71.20%
Apr-18 9 5 555 56 10.18% 650.29 588.00 62.29 9.58% 279,639£ 55.81% 221,452£ 501,091£ 12.71 55% 10.19 45% 22.90 3.84% 79.36% 87.69% 71.70%
totals 37 13 Average 10.46% Average 10.69% 324,905£ Rolling Year 4.00% 79.10%
Data excludes: Docs in Training & Tupe Transfers. Data includes: Bank Staff
Medicine Directorate Workforce DashboardStrs/Lvrs Turnover (FTE) Vacancies Temporary Spend Sickness Appraisal

Area of Review Key Highlights Status Trend Target
Turnover/ Retention
8.50%
Vacancies 5.00%
Temporary Spend
Sickness 3.40%
Training 85.00%
Non-Medical Appraisals
85.00%
Executive Summary of Key Workforce Performance
In Month: In month there were 5 leavers and 9 starters (headcount) compared to 3 leavers and 9 starters in the month before. This figure includes bank and locum staff. Year to Date: For the rolling year to date, the turnover rate was above target at 10.18%, this compares to last months position which was 10.50%.
In Month: There was a decrease in the vacancy rate this month, 9.58%, compared to 10.50% last month. Year to Date: The average vacancy rate is 10.69%, this compares to last months average position which was 12.94%.
In Month: There has been a decrease in agency spend this month at £279,639, compared to last month's position which was £282,229. Year to Date: The financial year to date total agency spend is £279,639, compared to the spend for the same period in the previous year which was £255,248.
In Month: There has been a decrease in the sickness rate this month at 3.84%, this compares to last months position of 4.34%. Year to Date: The year to date rolling sickness rate is at 4.00%, which compares to last months position of 3.94%.
In Month: Mandatory training compliance levels have increased this month to 79.36%, this compares to last months position of 78.93%. Year to Date: The year to date average compliance level is 79.10%, this compares to last months position of 78.49%.
In Month: Non-Medical Appraisal compliance has increased this month to 71.70%, from last months position of 71.20%. Year to Date: The year to date average compliance is 72.18%, this compares to last months position of 71.12%.
RED
RED
AMBER
RED
RED
RED

TrainingStarters (headcount in month)
Leavers (headcount in month)
Average Heads (in year)
Number of Leavers (in year)
Turnover (rolling year)
Budget Wte (Ledger)
Staff In Post Wte (Ledger - month end)
Vacant Wte
Vacancy Rate
spend on Agency
% Temp Spend on Agency (in month)
spend on Bank
Total Temp Spend
Agency Budget
Long Term Sick WTE lost (in month)
% Short Term Sick WTE lost (in month)
% Total WTE lost to Sickness (in month)
Sickness Rate
Mandatory Training
% Complete Medical Staff
% Complete non-medical staff
YTD Trend
Month Trend
Target 5 48 8.50% 30.73 5.00% 40.00% 20.14 3.40% 85.00% 85.00% 85.00%
Jan-18 10 4 564 50 8.84% 614.69 592.23 22.46 3.65% 175,873£ 61.75% 108,935£ 284,808£ 19.43 64% 10.98 36% 30.41 5.24% 90.44% 91.55% 86.60%
Feb-18 4 4 567 49 8.58% 616.82 587.79 29.03 4.71% 177,129£ 60.40% 116,148£ 293,277£ 16.17 55% 13.48 45% 29.64 5.08% 89.50% 93.33% 87.60%
Mar-18 12 10 571 53 9.22% 617.13 600.40 16.73 2.71% 131,007£ 45.80% 155,009£ 286,016£ 13.32 57% 9.97 43% 23.29 3.92% 90.08% 94.67% 90.40%
Apr-18 14 14 576 56 9.66% 629.37 607.38 21.99 3.49% 126,119£ 51.36% 119,433£ 245,552£ 15.31 57% 11.78 43% 27.09 4.52% 90.23% 93.15% 89.30%
totals 40 32 Average 9.08% Average 3.64% 152,532£ Rolling Year 4.68% 90.06%
Data excludes: Docs in Training & Tupe Transfers. Data includes: Bank Staff
Surgical Directorate Workforce DashboardStrs/Lvrs Turnover (FTE) Vacancies Temporary Spend Sickness Appraisal

Area of Review Key Highlights Status Trend Target
Turnover/ Retention
8.50%
Vacancies 5.00%
Temporary Spend
Sickness 3.40%
Training 85.00%
Non-Medical Appraisals
85.00%
Executive Summary of Key Workforce Performance
In Month: In month there were 14 leavers and 14 starters (headcount) compared to 10 leavers and 12 starters in the month before. This figure includes bank and locum staff. Year to Date: For the rolling year to date, the turnover rate was above target at 9.66%, this compares to last months position which was 9.22%.
In Month: There was an increase in the vacancy rate this month, 3.49%, compared to 2.71% last month. Year to Date: The average vacancy rate is 3.64%, this compares to last months YTD position which was 4.96%.
In Month: There has been a decrease in agency spend this month at £126,119, compared to last month's position which was £131,007. Year to Date: The financial year to date total agency spend is £126,119, compared to the spend for the same period in the previous year which was £58,608.
In Month: There has been an increase in the sickness rate this month at 4.52%, this compares to last months position of 3.92%. Year to Date: The year to date rolling sickness rate is at 4.68%, which compares to last months position of 4.86%.
In Month: Mandatory training compliance levels have increased this month to 90.23%, this compares to last months position of 90.08%. Year to Date: The year to date average compliance level is 90.06%, this compares to last months position of 87.44%.
In Month: Non-Medical Appraisal compliance has decreased this month to 89.30%, from last months position of 90.40%. Year to Date: The year to date average compliance is 88.48%, this compares to last months position of 83.82%.
RED
RED
GREEN
GREEN
GREEN
GREEN

TrainingStarters (headcount in month)
Leavers (headcount in month)
Average Heads (in year)
Number of Leavers (in year)
Turnover (rolling year)
Budget Wte (Ledger)
Staff In Post Wte (Ledger - month end)
Vacant Wte
Vacancy Rate
spend on Agency
% Temp Spend on Agency (in month)
spend on Bank
Total Temp Spend
Agency Budget
Long Term Sick WTE lost (in month)
% Short Term Sick WTE lost (in month)
% Total WTE lost to Sickness (in month)
Sickness Rate
Mandatory Training
% Complete Medical Staff
% Complete non-medical staff
YTD Trend
Month Trend
Target 7 67 8.50% 41.43 5.00% 40.00% 20.62 2.50% 85.00% 85.00% 85.00%
Jan-18 17 19 788 82 10.45% 828.55 824.85 3.70 0.45% 49,066£ 45.55% 58,646£ 107,712£ 10.86 38% 17.47 62% 28.33 3.53% 86.10% 90.91% 86.70%
Feb-18 7 10 792 80 10.14% 831.31 818.75 12.56 1.51% 22,842£ 24.74% 69,496£ 92,338£ 12.58 54% 10.62 46% 23.20 2.89% 85.24% 94.55% 87.70%
Mar-18 10 11 795 84 10.51% 830.14 818.87 11.27 1.36% 27,503£ 24.28% 85,750£ 113,253£ 9.07 46% 10.77 54% 19.84 2.45% 85.12% 90.74% 87.10%
Apr-18 13 9 790 79 9.94% 722.96 699.41 23.55 3.26% 23,642£ 27.06% 63,716£ 87,358£ 11.58 60% 7.70 40% 19.28 2.38% 86.35% 85.19% 88.50%
totals 47 49 Average 10.26% Average 1.64% 30,763£ Rolling Year 2.61% 85.70%
Data excludes: Docs in Training & Tupe Transfers. Data includes: Bank Staff
Clinical Support and Family Services Directorate Workforce DashboardStrs/Lvrs Turnover (FTE) Vacancies Temporary Spend Sickness Appraisal

Area of Review Key Highlights Status Trend Target
Turnover/ Retention
8.50%
Vacancies 5.00%
Temporary Spend
Sickness 2.50%
Training 85.00%
Non-Medical Appraisals
85.00%
Executive Summary of Key Workforce Performance
In Month: In month there were 9 leavers and 13 starters (headcount) compared to 11 leavers and 10 starters in the month before. This figure includes bank and locum staff. Year to Date: For the rolling year to date, the turnover rate was above target at 9.94%, this compares to last months position which was 10.51%.
In Month: There was an increase in the vacancy rate this month, 3.26%, compared to 1.36% last month. Year to Date: The average vacancy rate is 1.64%, this compares to last months average position which was 2.38%.
In Month: There has been a decrease in agency spend this month at £23,642, compared to last month's position which was £27,503. Year to Date: The financial year to date total agency spend is £23,642, compared to the spend for the same period in the previous year which was £90,975.
In Month: There has been a decrease in the sickness rate this month at 2.38%, this compares to last months position of 2.45%. Year to Date: The year to date rolling sickness rate is at 2.61%, which compares to last months position of 2.59%.
In Month: Mandatory training compliance levels have increased this month to 86.35%, this compares to last months position of 85.12%. Year to Date: The year to date average compliance level is 85.70%, this compares to last months position of 85.91%.
In Month: Non-Medical Appraisal compliance has increased this month to 88.50%, from last months position of 87.10%. Year to Date: The year to date average compliance is 87.50%, this compares to last months position of 85.59%.
RED
GREEN
GREEN
GREEN
GREEN
GREEN

TrainingStarters (headcount in month)
Leavers (headcount in month)
Average Heads (in year)
Number of Leavers (in year)
Turnover (rolling year)
Budget Wte (Ledger)
Staff In Post Wte (Ledger - month end)
Vacant Wte
Vacancy Rate
spend on Agency
% Temp Spend on Agency (in month)
spend on Bank
Total Temp Spend
Agency Budget
Long Term Sick WTE lost (in month)
% Short Term Sick WTE lost (in month)
% Total WTE lost to Sickness (in month)
Sickness Rate
Mandatory Training
% Complete Medical Staff
% Complete non-medical staff
YTD Trend
Month Trend
Target 7 32 8.50% 20.25 5.00% 40.00% 267.24 3.00% 85.00% 85.00% 85.00%
Jan-18 25 24 377 50 13.37% 405.01 387.31 17.70 4.37% 9,792£ 21.06% 36,705£ 46,497£ 8.85 47% 9.84 53% 18.69 4.32% 88.93% N/A 79.10%
Feb-18 13 27 377 50 13.32% 404.35 389.42 14.93 3.69% 9,258£ 20.57% 35,758£ 45,016£ 9.23 62% 5.69 38% 14.92 3.47% 81.07% N/A 79.00%
Mar-18 29 24 376 54 14.45% 405.92 389.79 16.13 3.97% 58,469£ 62.13% 35,639£ 94,108£ 8.16 63% 4.82 37% 12.98 3.14% 80.14% N/A 78.00%
Apr-18 27 38 378 51 13.41% 471.49 406.94 64.55 13.69% 33,221£ 41.07% 47,674£ 80,895£ 5.39 55% 4.49 45% 9.88 2.43% 79.40% N/A 74.40%
N/A
N/A
N/A
N/A
N/A
N/A
N/A
N/A
totals 94 113 Average 13.64% Average 6.43% 27,685£ Rolling Year 2.88% 82.39%
Data excludes: Docs in Training & Tupe Transfers. Data includes: Bank Staff
Corporate Directorates Workforce DashboardStrs/Lvrs Turnover (FTE) Vacancies Temporary Spend Sickness Appraisal

Area of Review Key Highlights Status Trend Target
Turnover/ Retention
8.50%
Vacancies 5.00%
Temporary Spend
Sickness 3.00%
Training 85.00%
Non-Medical Appraisals
85.00%
Executive Summary of Key Workforce Performance
In Month: In month there were 38 leavers and 27 starters (headcount) compared to 24 leavers and 29 starters in the month before. This figure includes bank and locum staff. Year to Date: For the rolling year to date, the turnover rate was above target at 13.41%, this compares to last months position which was 14.45%.
In Month: There was an increase in the vacancy rate this month, 13.69%, compared to 3.97% last month. This increase is due to the movement of capital FTE to revenue (GS1, Informatics) and creation of a reserve to fund Trust wide posts when they come on stream. Year to Date: The average vacancy rate is 6.43%, this compares to last months average position which was 5.43%.
In Month: There has been a decrease in agency spend this month at £33,221, compared to last month's position which was £58,469. Year to Date: The financial year to date total agency spend is £33,221, compared to the spend for the same period in the previous year which was £3,361.
In Month: There has been a decrease in the sickness rate this month at 2.43%, this compares to last months position of 3.14%. Year to Date: The year to date rolling sickness rate is at 2.88%, which compares to last months position of 2.85%.
In Month: Mandatory training compliance levels have decreased this month to 79.40%, this compares to last months position of 80.14%. Year to Date: The year to date average compliance level is 82.39%, this compares to last months position of 84.42%.
In Month: Non-Medical Appraisal compliance has decreased this month to 74.40%, from last months position of 78.00%. Year to Date: The year to date average compliance is 77.63%, this compares to last months position of 79.13%.
RED
RED
RED
RED
GREEN
RED

TrainingStarters (headcount in month)
Leavers (headcount in month)
Average Heads (in year)
Number of Leavers (in year)
Turnover (rolling year)
Budget Wte (Ledger)
Staff In Post Wte (Ledger - month end)
Vacant Wte
Vacancy Rate
spend on Agency
% Temp Spend on Agency (in month)
spend on Bank
Total Temp Spend
Agency Budget
Long Term Sick WTE lost (in month)
% Short Term Sick WTE lost (in month)
% Total WTE lost to Sickness (in month)
Sickness Rate
Mandatory Training
% Complete Medical Staff
% Complete non-medical staff
YTD Trend
Month Trend
Target 3 19 8.50% 11.23 5.00% 40.00% 8.00 3.50% 85.00% 85.00% 85.00%
Jan-18 4 6 222 21 9.32% 224.55 228.48 3.93- -1.75% 16,787£ 76.13% 5,263£ 22,050£ 3.46 37% 5.79 63% 9.25 4.39% 95.58% N/A 97.80%
Feb-18 3 - 223 20 8.89% 224.55 226.17 1.62- -0.72% 24,563£ 70.04% 10,509£ 35,072£ 4.81 53% 4.23 47% 9.05 4.28% 94.29% N/A 97.30%
Mar-18 2 6 223 20 9.07% 224.55 225.46 0.91- -0.41% 23,362£ 68.63% 10,680£ 34,042£ 7.17 68% 3.33 32% 10.50 4.97% 95.05% N/A 96.90%
Apr-18 5 1 223 20 9.07% 235.19 220.23 14.96 6.36% 25,953£ 68.36% 12,011£ 37,964£ 9.34 77% 2.75 23% 12.10 5.69% 94.33% N/A 96.50%
N/A
N/A
N/A
N/A
N/A
N/A
N/A
N/A
totals 14 13 Average 9.09% Average 0.87% 22,666£ Rolling Year 4.90% 94.81%
Data excludes: Docs in Training & Tupe Transfers. Data includes: Bank Staff
Facilities Directorate Workforce DashboardStrs/Lvrs Turnover (FTE) Vacancies Temporary Spend Sickness Appraisal

Area of Review Key Highlights Status Trend Target
Turnover/ Retention
8.50%
Vacancies 5.00%
Temporary Spend
Sickness 3.50%
Training 85.00%
Non-Medical Appraisals
85.00%
Executive Summary of Key Workforce Performance
In Month: In month there was 1 leaver and 5 starters (headcount) compared to 6 leavers and 2 starters in the month before. This figure includes bank and locum staff. Year to Date: For the rolling year to date, the turnover rate was above target at 9.07%, this compares to last months position which was 9.07%.
In Month: The vacancy rate this month is at 6.36%, compared to -0.41% last month. Year to Date: The average vacancy rate is 0.87%, this compares to last months average position which was 0.76%.
In Month: There has been an increase in agency spend this month at £25,953, compared to last month's position which was £23,362. Year to Date: The financial year to date total agency spend is £25,953, compared to the spend for the same period in the previous year which was £10,759.
In Month: There has been an increase in the sickness rate this month at 5.69%, this compares to last months position of 4.97%. Year to Date: The year to date rolling sickness rate is at 4.90%, which compares to last months position of 4.85%.
In Month: Mandatory training compliance levels have decreased this month to 94.33%, this compares to last months position of 95.05%. Year to Date: The year to date average compliance level is 94.81%, this compares to last months position of 93.63%.
In Month: Non-Medical Appraisal compliance has decreased this month to 96.50%, from last months position of 96.90%. Year to Date: The year to date average compliance is 97.13%, this compares to last months position of 96.88%.
RED
RED
GREEN
GREEN
GREEN
GREEN

KPI Targets/RAG Rating Parameters
KPI Target Green Range Amber Range Red RangeTurnover Rate 8.50% 10% and under Between 10% and 12% Over 12%Vacancy Rate 5.00% 5% and under Between 5% and 7% Over 7%Monthly Agency Spend £513,333 Under target - Over targetSickness Rate 3.00% Under target - Over targetTraining Compliance 85% 85% and over Between 80% and 85% Under 80%Appraisal Compliance 85% 85% and over Between 80% and 85% Under 80%

KPI Overall CommentaryMar-18 Apr-18 T
1 Rheumatology 29.68% 30.22%2 Ophthalmology 23.70% 23.52%3 Urology 20.23% 20.08%
1 Corporate Directorate 14.29% 13.37%
1 Add Prof Scientific and Technical 13.80% 13.03%
1 Obstetrics & Gynaecology 26 27 2 Theatres 20 24 3 Adult Medical Wards 23 21
1 Clinical Support & Family Services 102 96
1 Nursing and Midwifery Registered 88 93
Mar-18 Apr-18 T1 Spinal Unit 19.16% 21.16%2 Dermatology 14.88% 20.15%3 Rheumatology 20.01% 19.59%
1 Musculo-Skeletal Directorate 18.15% 10.80%
1 Nursing and Midwifery Registered 18.52% 17.58%
1 Adult Medical Wards 17.96 22.84 2 Spinal Unit 19.91 22.84 3 Elderly Care 30.23 22.20
1 Medicine Directorate 68.43 62.29
1 Nursing and Midwifery Registered 173.58 162.34
KPI Overall CommentaryMar-18 Apr-18 T
1 Laundry 100.00%2 Elderly Care - Medical Staff 100.00% 100.00%3 Medicine - Medial Staff 100.00% 100.00%
1 Facilities 68.63% 68.36%
1 Professions Allied to Medicine 100.00% 100.00%
1 Laundry 116,522£ 2 Emergency Department Nursing 43,352£ 42,914£ 3 Winterslow Ward 30,480£ 22,198£
1 Medicine Directorate 282,229£ 279,639£
1 Nursing and Midwifery Registered 153,878£ 270,142£
Mar-18 Apr-18 T1 Main Outpatients 15.24% 16.00%2 Dermatology 10.59% 9.83%3 Theatres 7.01% 6.91%
1 Facilities Directorate 4.85% 4.90%
1 Additional Clinical Services 5.63% 5.70%
1 Theatres 13.26 13.57 2 Hotel Services 6.10 6.44 3 Corporate Development 4.77 5.14
1 Surgery Directorate 26.53 27.67
1 Nursing and Midwifery Registered 29.60 30.81
KPI Overall CommentaryApr-18 May-18 T
1 Medical Staff - Child Health 61.75% 60.00%2 Medical Staff - Medicine 66.55% 64.67%3 Clinical Haematology 67.47% 65.85%
1 Medicine Directorate 78.93% 79.36%
1 Medical and Dental 76.48% 77.31%
Apr-18 May-18 T1 Elderly Care Wards 50.00% 48.44%2 Director of Operations 46.15% 50.00%3 Pembroke Unit 50.00% 51.52%
1 Medicine 71.20% 71.70%
1 Allied Health Professionals 81.70% 78.85%
Key Areas of Concern
highest Vacancy rateVacancies Target 5%
highest Turnover rates
highest number of leavers
Vacancies have increased from 5.90% in month 12 to 7.90% in month 1. This increase is due to the movement of subsidiary companies (OML, STL) with above average vacancy levels into the Trust's consolidated account, general movement of capital FTE to revenue (GS1, Informatics, etc), creation of a reserve to fund posts when they come on stream and permanent funding of other initiatives including enhanced cleaning, OD and People transformation.
109 offers have been made following the recent trip to India. 25 International Nurses are scheduled to arrive between June and August 18, a further 3 are starting in May. Steps we are taking to fill our vacancies include international recruitment campaigns, local radio and social media advertising campaigns, linking with Educational establishments in Salisbury, and
Turnover increased slightly this month and is amber rated. For Service Lines this month : the highest number of leavers for the year to date was from Obstetrics & Gynaecology (27), Theatres (24) and Adult Medical Wards (21). For Staff Groups this month: highest number of leavers was Nursing and Midwifery Registered (93) in the year to date. The average Headcount turnover for local Trusts is 12.42%, which we remain below at 10.28% FTE.
Turnover (measured in a rolling year) Target 8.5%
highest WTE Vacant
Key Areas of ConcernHighest proportion of temporary spend spent on Agency
Temporary Spend Agency Control Total £6,200,000
The Trust is endeavouring to reduce the proportion of temporary spend on agency staff to 40% or below. For some areas the nature of work makes this difficult. For Service Lines this month : Elderly Care and Medicine record all of their temporary spend as agency this was in Medical & Dental (locum cover) covering difficult to recruit to vacancies. The agency usage is also required to avoid breaches of access/waiting times. For Staff Groups this month : The highest spend is on Nursing and Midwifery Registered.
highest £ spent on Agency
Sickness Year to date Target 3%
Sickness for April (M1) is at 3.53%. Sickness for the rolling year to date is 3.64% which is average for the surrounding Local Acute hospital Trusts. Our sickness project team are working with departments to identify those individuals whose sickness absence remains problematic (both short and long term). Ensuring the above individuals are managed in an appropriate manner which will either support their return to work or see them being escalated through the Management of Attendance Policy. For Service Lines this month: the highest sickness rate was Main Outpatients at 16.00%. For Staff Groups this month: the highest sickness rate was Additional Clinical Services at 5.70% in the rolling year to date.
highest Sickness rate
highest WTE sick in month
Key Areas of Concernlowest Mandatory training rates
Mandatory Training Target 85%
Compliance has increased this month and remains green rated at 85.59%. A focus on hand hygiene Training is required for Clinical staff as this is the subject with the least compliance. Focus needs to be on employees completing training before they come out of compliance.
Non-Medical Appraisals Target 85%
Appraisal compliance has slightly decreased to 84.10% and is amber rated. 52 Departments are red rated and these will be the focus over the next month to reach target.
lowest appraisal rates

Workforce Plan example