the international bunker industry association capt peter w
TRANSCRIPT

The International
Bunker Industry
Association
Capt Peter W Hall
What lies ahead?
10

What lies ahead?
• Decision time
• Change
• Paradigm shift for marine fuels
• We are sailing into unchartered waters
10

10
It is not the strongest.It is not the most intelligent.But it is the most responsive (adaptable),that will survive.
Charles Darwin:

Paradigm shift for Marine Fuel?
• Decision time is upon us.
• Economy is growing - slowly
• There is an over supply of shipping
Consequently low charter rates, freight rates, and demand
• Macro drivers changing, Panama canal, Suez, logistic train changes.
• Low oil prices are changing patterns.
• Multiple fuel options for owners/charterers to decide.
• Uncertainty for refiners, challenge for fuel suppliers.
• Time is ticking for decisive, decisions.
• Compliance strategy emerging?
• Regulation and enforcement is inconsistent.
Is this doom and gloom or an opportunity to position for a boom?

Our course was set by key drivers
10
Trade and Operational
costs
Price and Energy
demand
Legislation

Legislation
• Global Cap reports to IMO?
• MRV reporting EU
• CO2 management?
10

Draft report
submitted to
Steering
Committee (SC)
May 2016
One month delay
for rework on SC
suggestions
June 16
Contractor
reports on
availability of
0.50% in 2020
with assumptions
SC as the “Group
of Experts”
reports to
MEPC 70
MEPC 70
decides
In Oct 2016
Implement Global
Cap (GC) in
2020
Implement Global
Cap (GC) in
2025
Refer to
MEPC 71
Mid 2017
No changes to
Annex VI
Formally
announced with
little or no chance
of it changing
Industry starts
planning
accordingly
Nov 2016
No changes to
Annex VI
Formally
announced with
little or no chance
of it changing
Industry starts
planning
accordingly
Mid 2017
Possible changes
to Annex VI
Dates
Areas
Sulphur
Industry starts
planning
accordingly
Late 2017
MEPC 71
decides
2020 or 2025
MEPC 71
Considers
additional review
MEPC 72
Review of
2020/2025 or
otherMid 2017
7


Monitoring, Reporting and Verification (MRV) regulations
10
• Regulations
MRV applies to all commercial ships
over 5,000 GT from beginning of
2018 leavingor entering an EU port
Each vessel is to report on each voyage
and submit annual summaries that must
be
validated by third parties
• Voyage reports to contain
Arrival port, date and time and departure
date and time
Fuel consumed and hence CO2 emitted
during last voyage
Distance travelled
Time at sea
Cargo carried/work done
Annual reports
Will summarise this data with a compulsory
verification process for each vessel for each
year

Monitoring, Reporting and Verification (MRV) regulations
10
• Implementation Schedule From 1/ 1/2018 voyage reporting leading to
annual reporting
From 2019 submit annual report by end of April
each year
From end June 2019 all vessels entering EU
ports to carry valid compliance documentation
From end June 2019 EU will publically report
each ship’s annual reports
• Penalties for non compliance The penalties shall be effective, proportionate
and dissuasive
Failure to report in twoconsecutive periods
can result in an expulsion order banning the
ship from EU ports until the vessel’s reports
are up to date
• IMO will eventually implement similar regulation
globally, leading to Market BasedMeasures

Price and Energy demand
10

• Introducing the cap in 2020 increase distillate demand by 132 million tons
• but decreases residual demand by 130 million tons
Million Tons
Source: MECL 12
Assumes 20% non-compliance
Equivalent to 60 million tons
Global cap in 2020

At 100% compliance unlikely to be sufficient 0.50% bunkers in 2020• Refinery expansions to be commissioned between 2015 and 2020 were planned
some five years ago, since then Distillate demand has not been as high as expected Completion slippage has not been significant particularly in Asia and ME But continuing tightening in inland sulphur specifications
• Rate of reduction in residual consumption has not accelerated
• Refiners may be able to produce sufficient 0.50% bunkers but not find a market for the residual products
• Even with an announcement in 2016 it is unlikely that there will be adequate time to implement the predominantly smaller scale projects Refiners shortage of funds Ship owners’ lack funds Uncertainty as so how fast the take up of scrubbing will be Future levels of compliance
• The distillate and residual balances to meet the global cap in 2020 will be tight

20 European Scene
14
I

20European Scene impact of closures
on Diesel
15
I

Scrubbers
• Capex
• Opex
• Challenges with
scrubbed waste
disposal
• Turn on turn off
system to meet global
requirements.
• Could benefit from
lower HFO prices.
16

1. ExxonMobil HDME 50
2. ExxonMobil AFME 200
3. BP HCRO
4. Lukoil Eco
5. Cepsa Diesel Oil
6. Bominflot IF 30
7. Gazprom Marine Bunker
8. Neste DMB
9. BP
10. Shell ULSFO
11. Phillips 66
12. Caltex, HFO 380 cSt
17
Hydro - processed VGO*
Sulphur reduced residue
Hydrocracker recycle oil*
Marine Fuel High visc DMB
DMB
RMB
DMB
DMB
RMA
Heavy Blended Diesel
DMB
LSFO
• Usage issues
•Compatibility when blended with residuals, distillates and other
hybrids•Cold flow•Stability
•ISO spec
• Discounts on LSMGO range from $15 to $100
Emergence of “Hybrid Fuels”

LNG
18
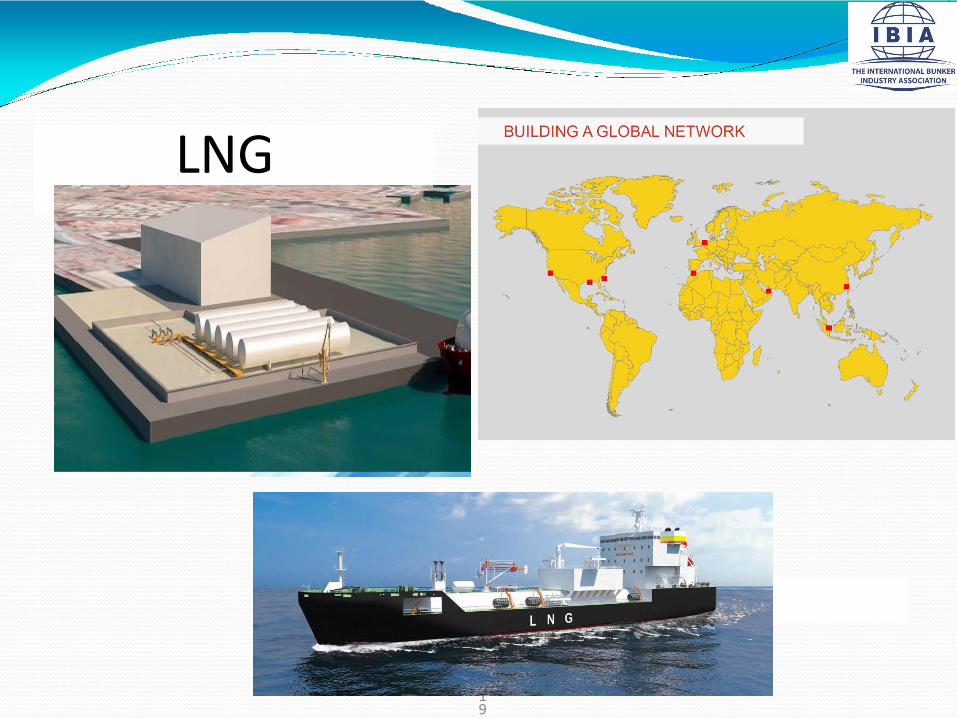
LNG
19

LNG Growth
0
50
100
150Tugboat
Tanker
Offshore patrol vessel
Ferry
Cargo vessel
Barge
40
250
At the end of 2015 the fleet was 107 vessels with 96 on order
200
Practically all these vessels are duel fuelled

MethaneEthaneMethanolLPGHydrogenBatteryRenewablesDual variations
Choices
21
Trade and Shipping
22

Global Fleet and Bunker Demand
• Global bunker fuel demand has slowed down markedly over the last years due to various factors:
– Legislation changes
– Slowdown in global trade
– Overcapacity in global vessel fleet
– Increasing fuel efficiency
– Slow steaming
• Growing fleet surplus due to bulge in new fleet deliveries from post 2004 new investments – coinciding with economic downturn.
• Global fleet capacity is currently nearly double 2004 level.
• Fleet capacity is set to continue growing faster than trade through next few years.
• This will further encourage slow steaming for existing fleet
80
100
120
140
160
180
200
220
240
19
99
20
00
20
01
20
02
20
03
20
04
20
05
20
06
20
07
20
08
20
09
20
10
20
11
20
12
20
13
20
14
International Shipping Industry Indicators (1999=100)
Seaborne trade
World Fleet Capacity
GDP
Slow steaming started 2008, when incremental
fleet capacity started exceeding trade growth
-90
-60
-30
0
30
60
90
120
150
180
19
95
19
96
19
97
19
98
19
99
20
00
20
01
20
02
20
03
20
04
20
05
20
06
20
07
20
08
20
09
20
10
20
11
20
12
20
13
20
14
Yearly Global Fleet Capacity Change
Delivered
Scrapped
Net
DW
T
Source: Outlook for Marine Bunkers & Fuel Oil -2035 (FGE/Marine & Energy Consulting)

Orders for container ships
10

Physical growth
10

Trade Flows
10

90% of all goods are shipped by sea
Shipping is here to stay.
Shipping is innovative, but conservative.
Information is key.
Location is key.
Let IBIA help unlock the
Opportunity.

Conclusion
10
• Adaptation and Innovation
• The industry is changing - the speed of this process is dictated by
– Policy decision– Market forces– Pricing
– IMO decision will be the start of a paradigm shift– Opportunity knocks?– Competitive advantage? First adopter or ?
– Information is key and IBIA remains committed to providing this information.