the international tropical timber organization global outlook for the tropical timber trade and...
TRANSCRIPT

THE INTERNATIONAL TROPICAL TIMBER ORGANIZATION
Global Outlook for the Tropical Timber Trade Global Outlook for the Tropical Timber Trade
and Furniture Export Markets and Furniture Export Markets
Where are the Emerging Markets?Where are the Emerging Markets?

Trends in Tropical Timber Exports
0.00
2.00
4.00
6.00
8.00
10.00
12.00
14.00
1991 1992 1993 1994 1995 1996 1997 1998 1999 2000
Val
ue (
Billi
ons
US
D)
Primary Secondary
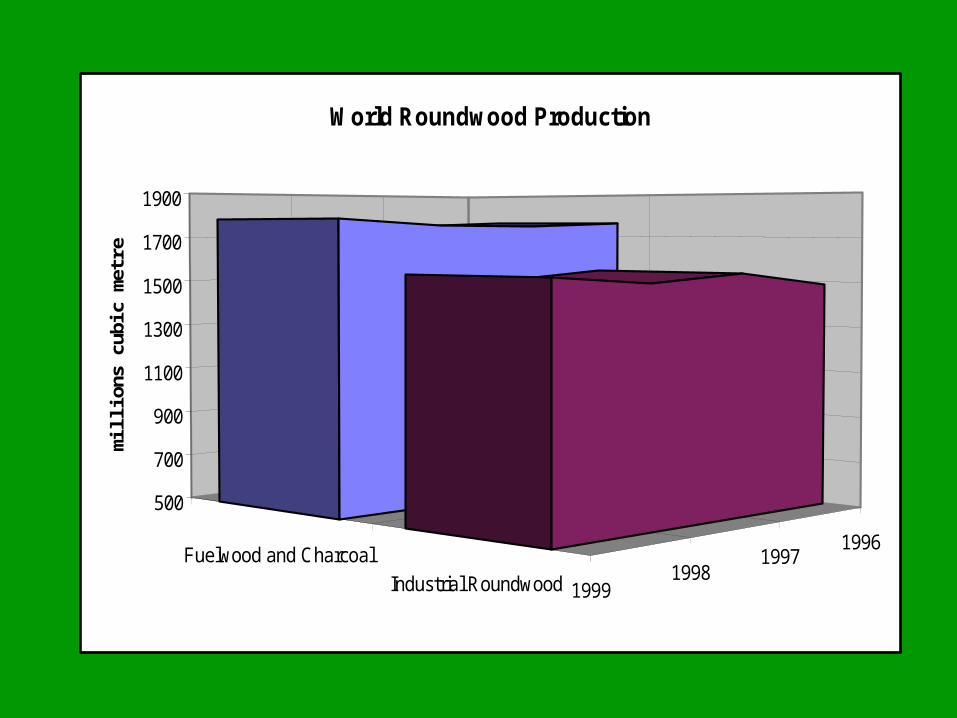
19961997
19981999
Fuelwood and Charcoal
Industrial Roundwood
500
700
900
1100
1300
1500
1700
1900
mill
ions
cub
ic m
etre
sWorld Roundwood Production

19951996
19971999 Fuelwood and
CharcoalIndustrialRoundwood
0
200
400
600
800
1000
1200
1400
1600
mil
lio
ns c
ub
ic m
etr
es
Developing Country Roundwood Production
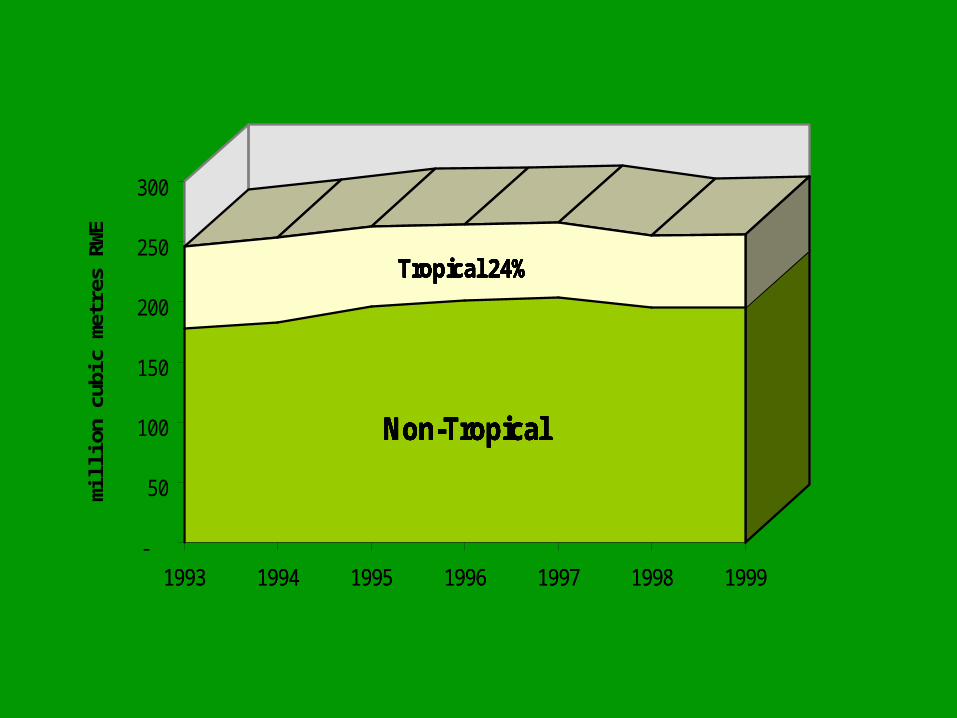
1993 1994 1995 1996 1997 1998 1999
Non-Tropical
Tropical 24%
Non-Tropical
Tropical 24%
Non-Tropical
Tropical 24%
Non-Tropical
Tropical 24%
Non-Tropical
Tropical 24%
Non-Tropical
Tropical 24%
Non-Tropical
Tropical 24%
Non-Tropical
Tropical 24%
-
50
100
150
200
250
300
mill
ion
cubi
c m
etre
s R
WE
1993 1994 1995 1996 1997 1998 1999

Composition of Exports By Region
0
10
20
30
40
50
60
Logs Sawnwood Veneer Plywood
Asia Pacific Latin America Africa

Imports of Tropical Timber 1996-2000
0
5000
10000
15000
20000
25000
1996 1997 1998 1999 2000
000'
s c
ub
ic m
etr
es
Japan EU 15 China

Japan's Tropical and Non-tropical Timber Imports
0
5,000
10,000
15,000
20,000
25,000
30,000
35,000
40,000
1993 1994 1995 1996 1997 1998 1999 2000
RWE
Thou
sand
s
Tropical Non-tropical

China's Tropical and Non-tropical Timber Imports
0
2,000
4,000
6,000
8,000
10,000
12,000
1993 1994 1995 1996 1997 1998 1999 2000
RWE
Thou
sand
s
Tropical Non-tropical
0
0.5
1
1.5
2
2.5
3
3.5
4
4.5
Billions USD
1990 1992 1994 1996 1998 2000
estimated
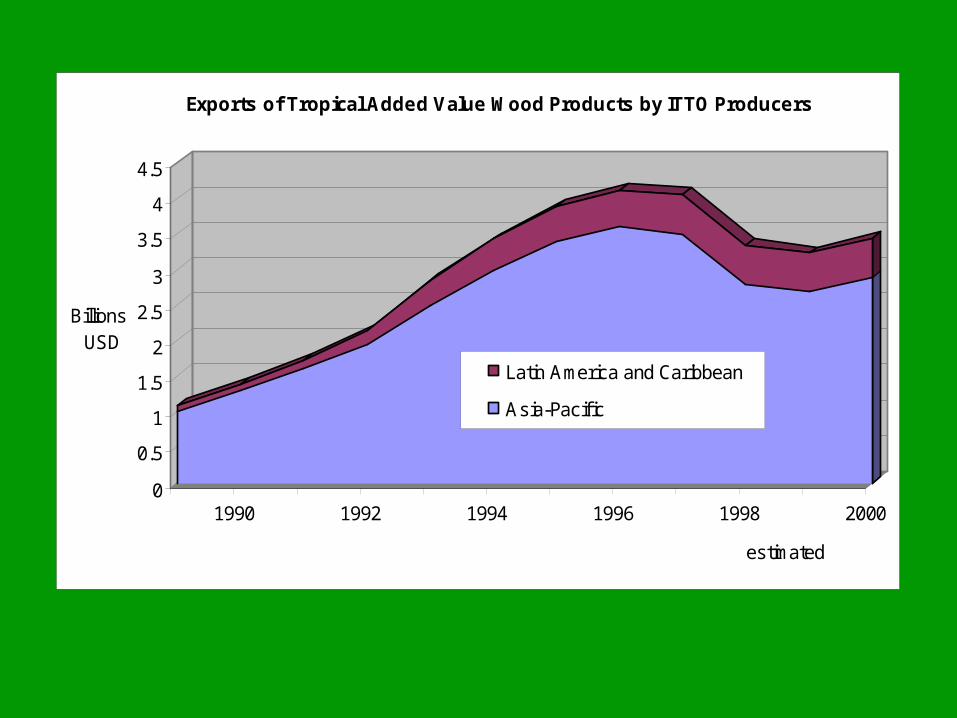
Exports of Tropical Added Value Wood Products by ITTO Producers
Latin America and Caribbean
Asia-Pacif ic
0
0.5
1
1.5
2
2.5
3
3.5
4
4.5
Billions USD
1990 1992 1994 1996 1998 2000
estimate
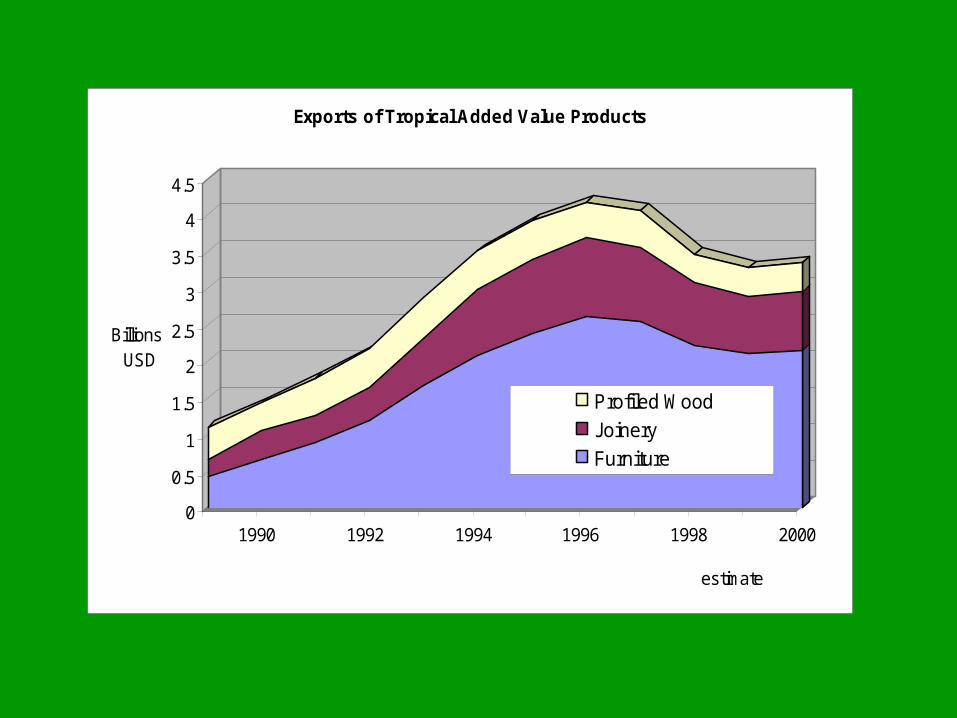
Exports of Tropical Added Value Products
Profiled Wood
Joinery
Furniture
0.00
0.50
1.00
1.50
2.00
2.50
Billion USD
1990 1992 1994 1996 1998 2000
estimate
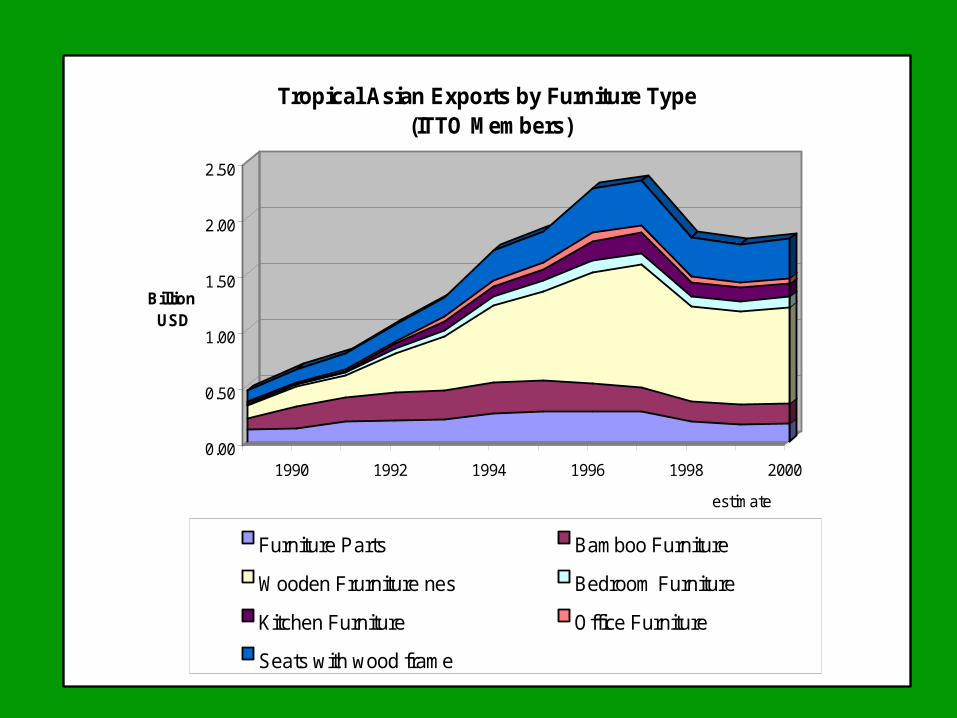
Tropical Asian Exports by Furniture Type (ITTO Members)
Furniture Parts Bamboo Furniture
Wooden Frurniture nes Bedroom Furniture
Kitchen Furniture Office Furniture
Seats with wood frame

World Furniture Production
Other Developed countries
18%
UK4%
Canada3%
Other Developing Countries
13%
Poland1%
Mexico3%
United States25%
Germany11%
Italy9%
France4% Japan
9%

Furniture Market Trends
• US, Germany and Japan not expected to grow
• Italy, France, UK, Brazil, Spain and Mexico to grow moderately
• Only China expected to show high growth

• Amongst other 40 markets
• India, Chile Ireland and Malaysia in high growth group
• General optimism of last year replaced by a more guarded posture
• US the engine of growth for the international furniture trade - demand for imported furniture has grown
• however the slowing US economy may put export trade under pressure, especially for medium-low priced furniture

• producers must prepare for weaker demand in major markets
• seek new niche markets, distribution systems and promotional tools
• introduce market specific designs and regularly launch new ranges
The Import “iceberg”
• Explosion of furniture imports to the US - account for 34% of all furniture sales
• 29% of all furniture imports from China - 1992 USD 69mil, over 2000 USD 1.8 bil.
• In 10 years just a handful of US domestic manufacturers

and in China
• Asia Pacific main force reshaping furniture trade
• China single most important country in region dynamics
• Chinese market holds promise for expanding trade in added value products

• house ownership encouraged
• home getting bigger
• imported brands favoured
• reduced domestic timber supply
• economy opening - WTO entry

• China market not lived up to expectations
• within a decade domestic production created stiff competition
• Now an aggressive exporter with non tariff barriers
• distribution channels, unclear customs and import licensing rules
Winning Market Share
• Added value exports will continue to grow at expense of primary product trade
• will expand at annual rate of 8-10%
• USD5 billion in 2001, USD 6.6 billion in 2003
• Win market share in OECD countries
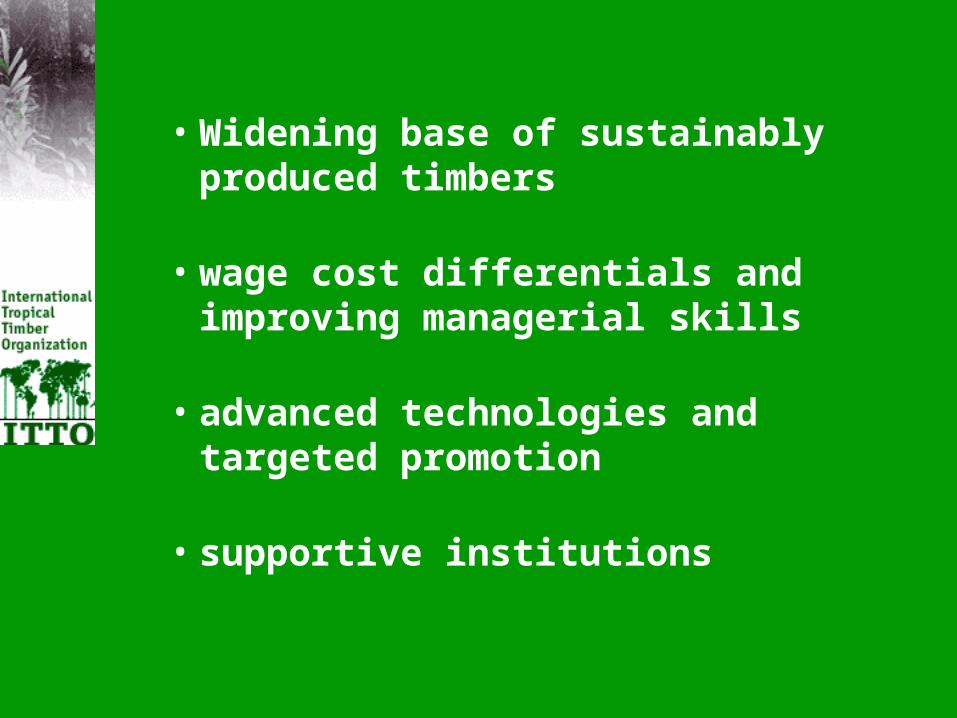
• Widening base of sustainably produced timbers
• wage cost differentials and improving managerial skills
• advanced technologies and targeted promotion
• supportive institutions
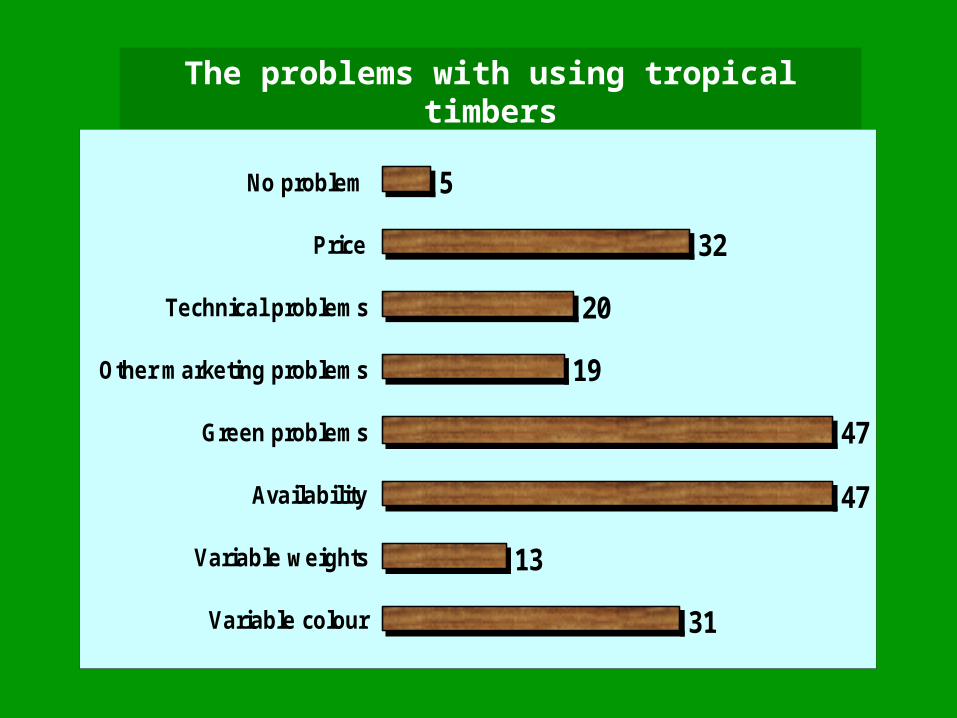
The problems with using tropical timbers
31
13
47
47
19
20
32
5
Variable colour
Variable weights
Availability
Green problems
Other marketing problems
Technical problems
Price
No problem

Which tropical country has scored greatest success with tropical added value exports?
43
18
8
2
3
1
2
Malaysia
Indonesia
Brazil
Chile
China
Taiwan
Ghana
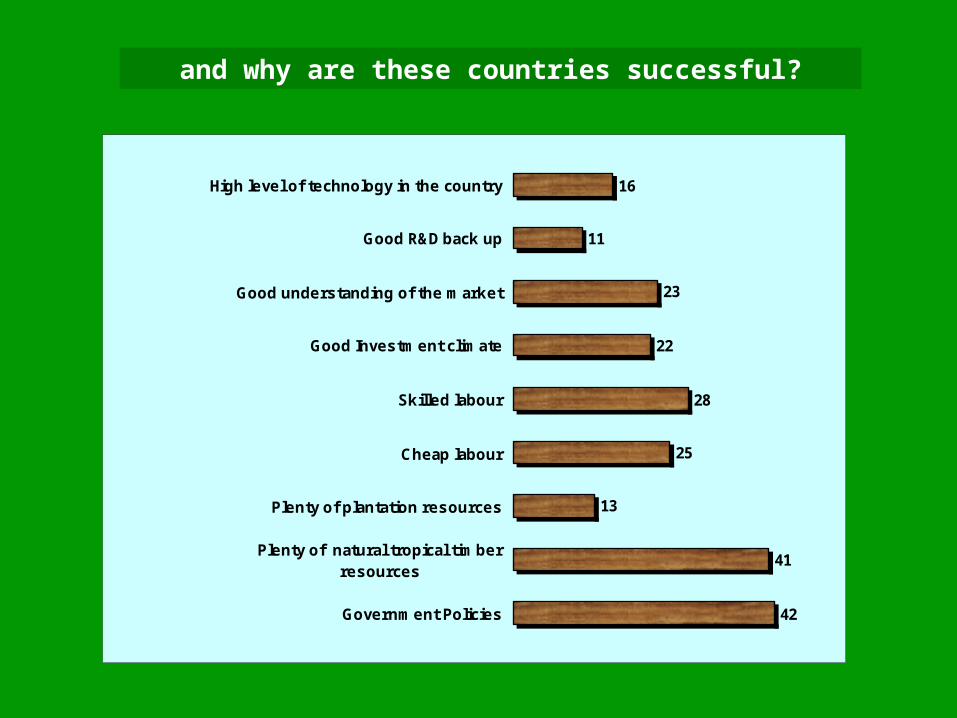
and why are these countries successful?
42
41
13
25
28
22
23
11
16
Government Policies
Plenty of natural tropical timberresources
Plenty of plantation resources
Cheap labour
Skilled labour
Good Investment climate
Good understanding of the market
Good R&D back up
High level of technology in the country
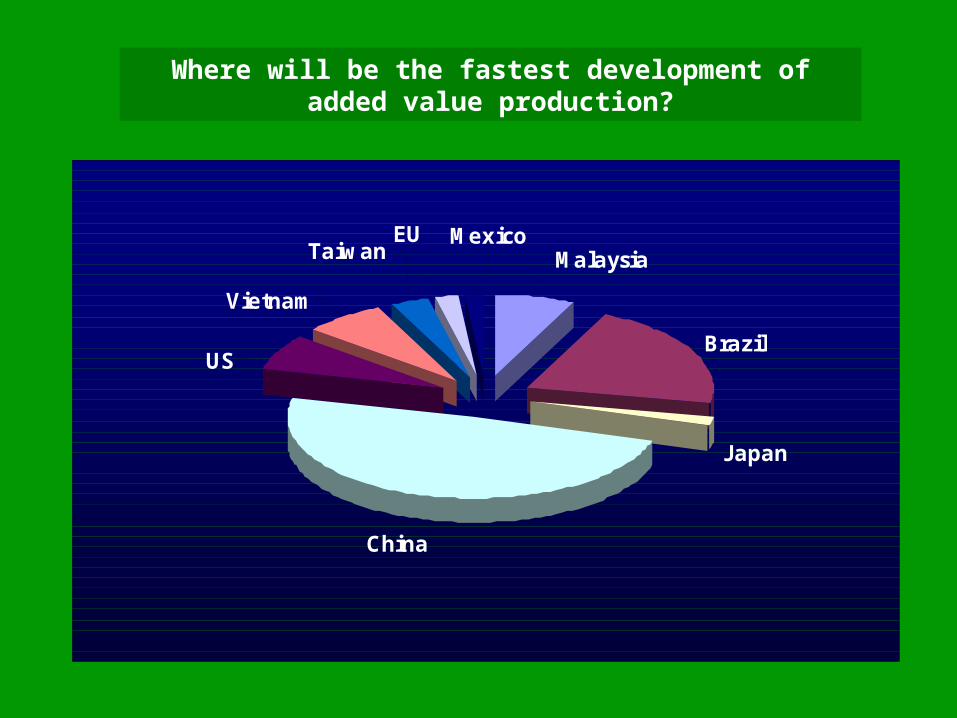
Where will be the fastest development of added value production?
Brazil
Japan
China
MalaysiaTaiwanMexicoEU
Vietnam
US

Forecast Trends in Exports of Primary and Secondary Tropical Products
0.00
2.00
4.00
6.00
8.00
10.00
12.00
14.00
1991 1992 1993 1994 1995 1996 1997 1998 1999 2000 2001 2002 2003
estimated
Valu
e (B
illio
ns U
SD)
Primary Secondary
