the international wellbeing index: a psychometric progress report robert a. cummins deakin...
Post on 18-Dec-2015
214 views
TRANSCRIPT

The International wellbeing Index: A psychometric progress report
Robert A. CUMMINSDeakin University, Australia
Beatriz ARITA Universidad Autónoma de Sinaloa, Mexico
Sergiu BALTATESCU University of Oradea, Romania
Jozef DZUKA Presov University, SLOVAKIA
Ferran CASAS University of Girona, Spain
Anna LAU The Hong Kong Polytechnic University, Hong Kong
Linda Luz GUERRERO Social Weather Stations,Philippines
Gerard O'NEILL Amárach Consulting, Ireland
Habib TILIOUINE University of Oran, Algeria
Graciela TONON Universidad Nacional de Lomas de Zamora, Argentina
Annapia VERRI Neurologic Institute C. Mondino and University of Pavia,Italy.
Joar VITTERSOUniversity of Tromso, Norway
This is an initiative of the International Wellbeing Group.
AIM-1
To examine the relative psychometric performance of a standard SWB Index
in different cultural and language groups.
AIM-2
To get beyond simplistic (and misleading) between-country comparisons of SWB
To build understanding of WHY countries differ in their SWB
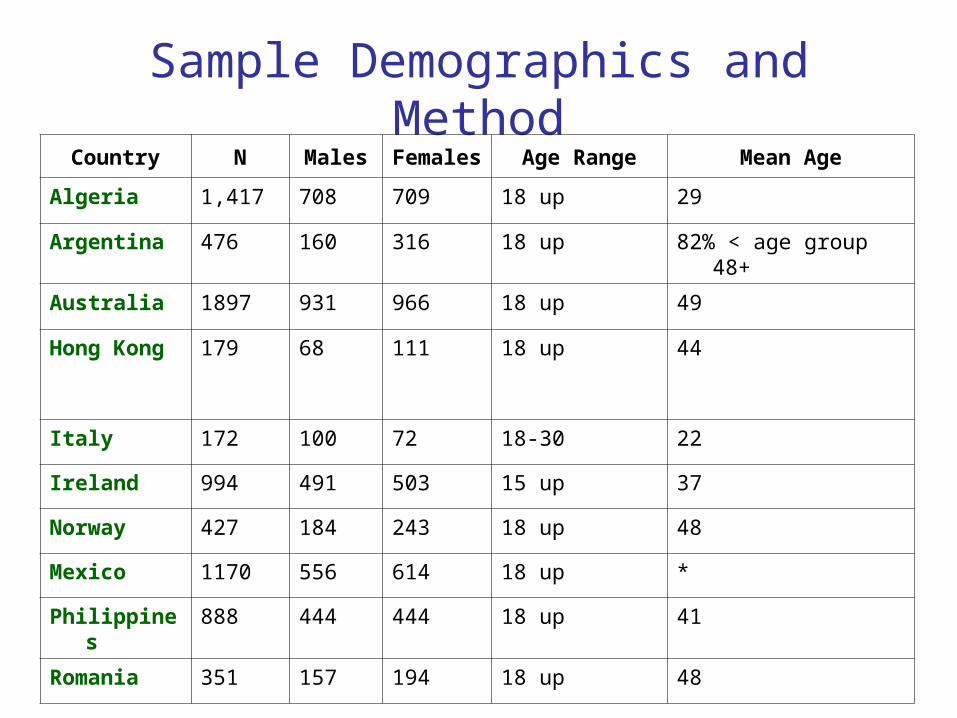
Sample Demographics and MethodCountry N Males Females Age Range Mean Age
Algeria 1,417 708 709 18 up 29
Argentina 476 160 316 18 up 82% < age group 48+
Australia 1897 931 966 18 up 49
Hong Kong 179 68 111 18 up 44
Italy 172 100 72 18-30 22
Ireland 994 491 503 15 up 37
Norway 427 184 243 18 up 48
Mexico 1170 556 614 18 up *
Philippines 888 444 444 18 up 41
Romania 351 157 194 18 up 48

Sample Demographics and MethodCountry Sample Demographics Method
Response Rate
Algeria Recruited around colleges, Universities and institutions
Questionnaire and interview
n/a
Argentina Randomly selected from general population (approx. 30% small cities and rural areas)
Interview public places
n/a
Australia Randomly selected from general population Telephone interview
n/a
Hong Kong
Recruited to age quota Telephone interview
n/a
Italy College students Interview n/a
Ireland Random/quota-controls Interview n/a
Norway Randomly selected from general population Postal survey 35%
Mexico Randomly selected from electoral role zones in the urban zone of Culiacan
Interview n/a
Philippines
Random/general population Interview 64%
Romania Random/general population Interview 70%
The theoretical conception of the
Index
It represents the First Level Deconstruction of two global
constructs.

1. the economic situation in Algeria?
2. the state of the natural environment in Italy?
3. the social conditions in Spain?
4. Government in Romania?
5. business in Australia?
6. national security in Argentina?
1. your standard of living?
2. your health?
3. what you achieve in life?
4. your personal relationships?
5. how safe you feel?
6. feeling part of your community?
7. your future security?
National Wellbeing Index
“How satisfied are you with -------”
Personal Wellbeing Index
“How satisfied are you with -------”
Two global constructs
Satisfaction with Life as a Whole Satisfaction with Life in [country]
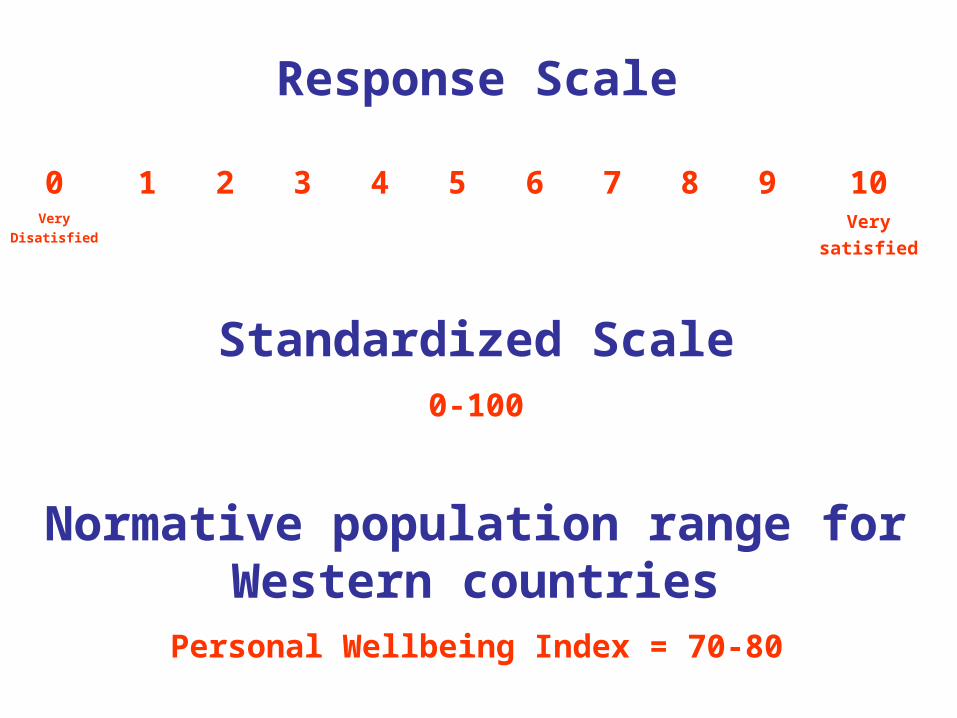
Response Scale
Very
satisfied
Very
Disatisfied
109876543210
Standardized Scale0-100
Normative population range for Western countries
Personal Wellbeing Index = 70-80

Factor AnalysisAUSTRALIA
Factor 1 Factor 2
S2 S5 S6 S2 S5 S6Government .75 .81 .79Business .75 .77 .77Social .70 .76 .67Environment .69 .73 .69Economic .72 .73 .68Nat. Security .63 .61 .70Achievements .69 .70 .67
Fut. Security .68 .69 .62
Standard .74 .67 .67Relations .67 .60 .62Safety .52 .58 .50Community .60 .57 .58Health .57 .48 .56Eigen Values 3.21 3.48 4.53 3.03 2.92 1.60% variance explained 24.69 - - 23.30 - -Reliability .82 .78

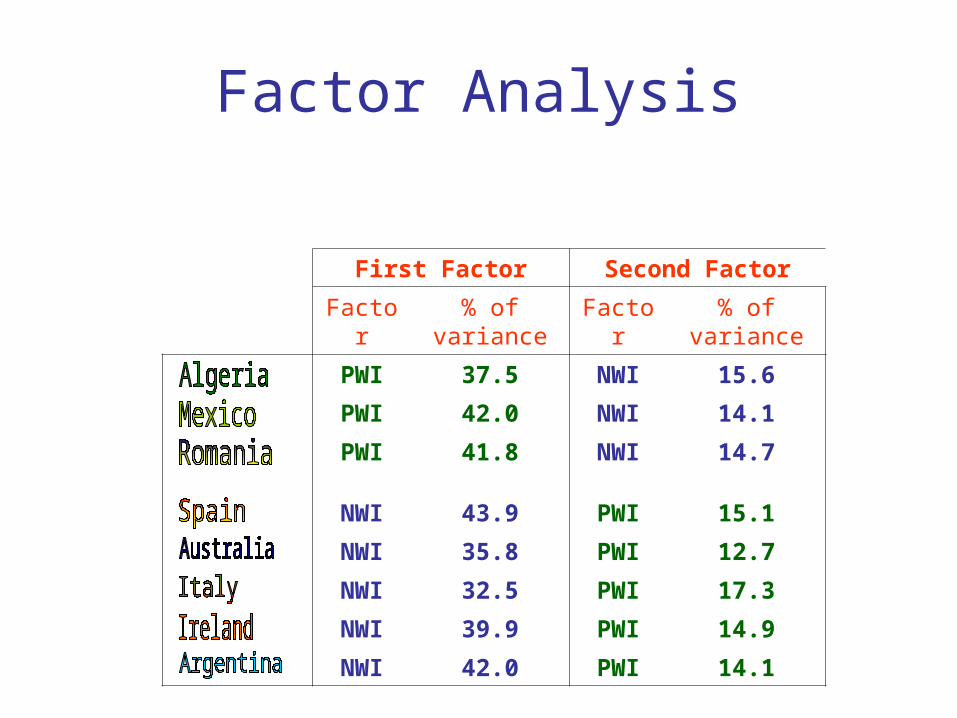
Factor Analysis1. All countries tested produce two clean factors (using an item-loading
cut-off score of .4
2. BUT, the factors emerge in different orders
First Factor Second Factor
Factor% of
variance Factor% of
variance
PWI 37.5 NWI 15.6
PWI 42.0 NWI 14.1
PWI 41.8 NWI 14.7
NWI 43.9 PWI 15.1
NWI 35.8 PWI 12.7
NWI 32.5 PWI 17.3
NWI 39.9 PWI 14.9
NWI 42.0 PWI 14.1

What causes one factor to be stronger than the other?
The strongest factor will be the one with the largest variance
0 100Satisfaction scale
50
Factor 1
Factor 2
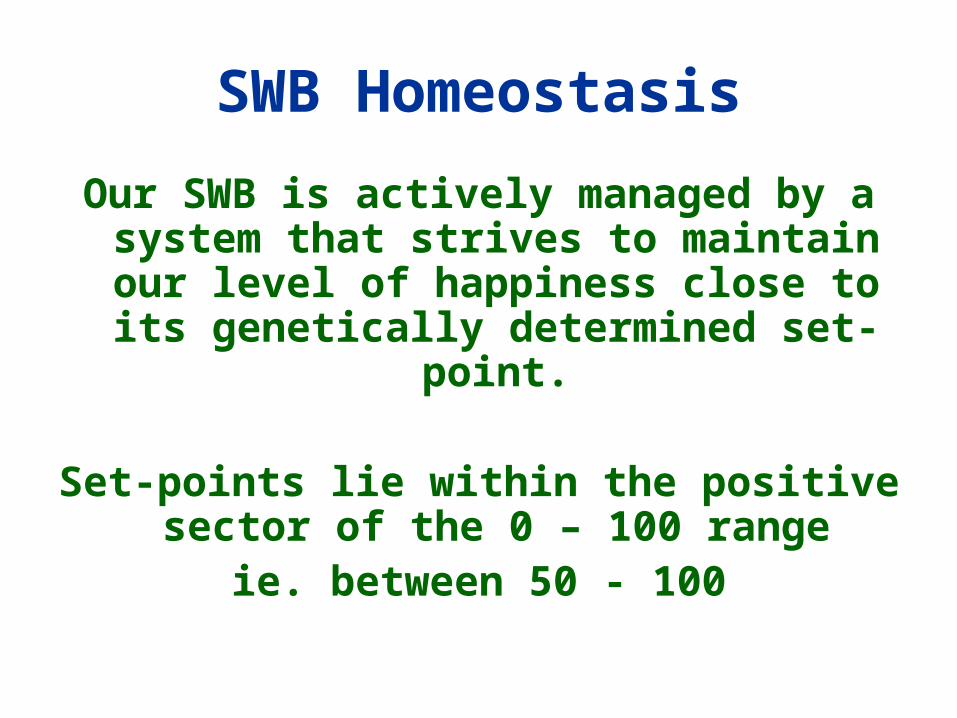
SWB Homeostasis
Our SWB is actively managed by a system that strives to maintain our
level of happiness close to its genetically determined set-point.
Set-points lie within the positive sector of the 0 – 100 range
ie. between 50 - 100
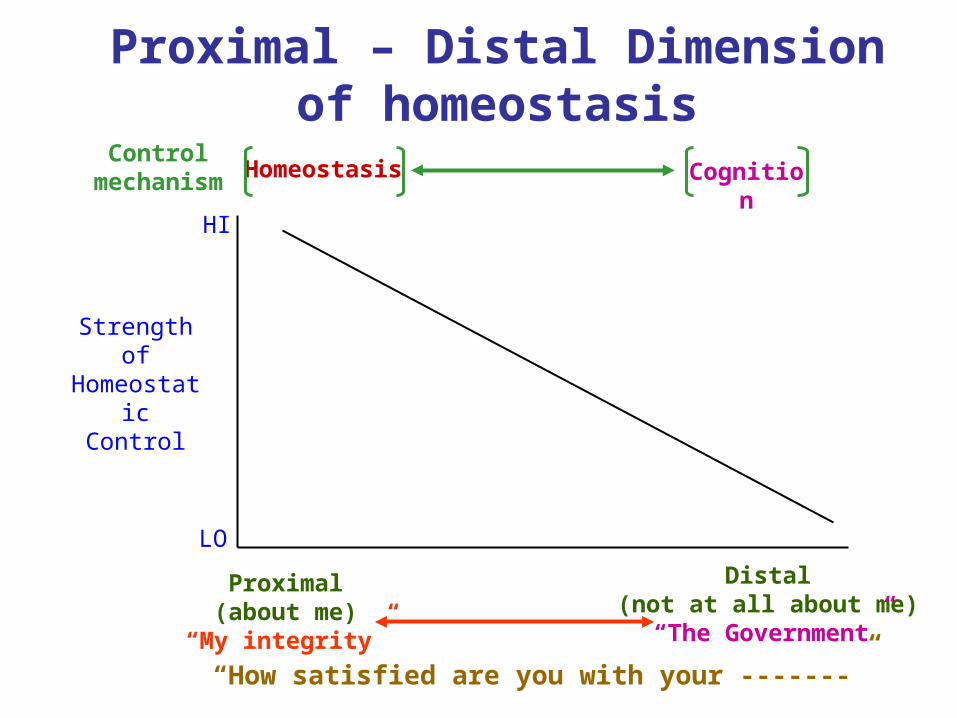
Proximal – Distal Dimension of homeostasis
LO
HI
Strength of Homeostatic
Control
“How satisfied are you with your -------”
Proximal(about me)
“My integrity”
Distal(not at all about me)“The Government”
Controlmechanism CognitionHomeostasis

Why does the National Wellbeing Index normally emerge first as the
strongest factor?
National wellbeing normally has the largest variance
0 100Satisfaction scale
50
National wellbeing: Factor 1
Personal wellbeing: Factor 2
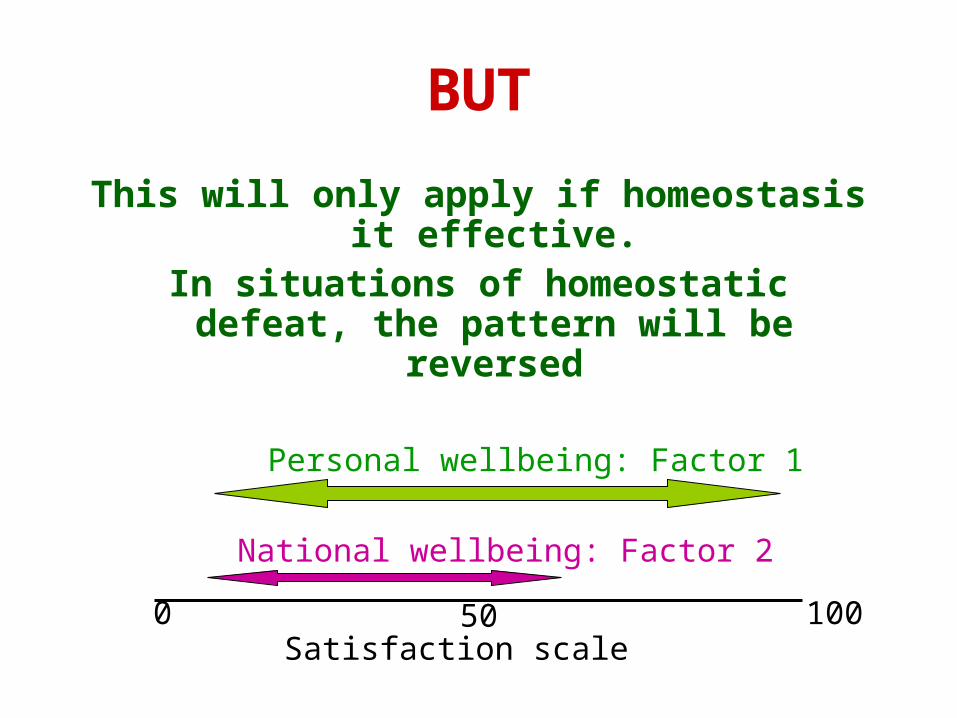
BUT
This will only apply if homeostasis it effective.
In situations of homeostatic defeat, the pattern will be reversed
0 100Satisfaction scale
50
National wellbeing: Factor 2
Personal wellbeing: Factor 1

Prediction
PWI : NWIPWI > NWI
NWI : PWINWI > PWIVariance Factor order
EnvironmentBenign
Hostile
Theory: The factor order can be diagnostic of a hostile environment
Factor Analysis
First Factor Second Factor
Factor% of
variance Factor% of
variance
PWI 37.5 NWI 15.6
PWI 42.0 NWI 14.1
PWI 41.8 NWI 14.7
NWI 43.9 PWI 15.1
NWI 35.8 PWI 12.7
NWI 32.5 PWI 17.3
NWI 39.9 PWI 14.9
NWI 42.0 PWI 14.1
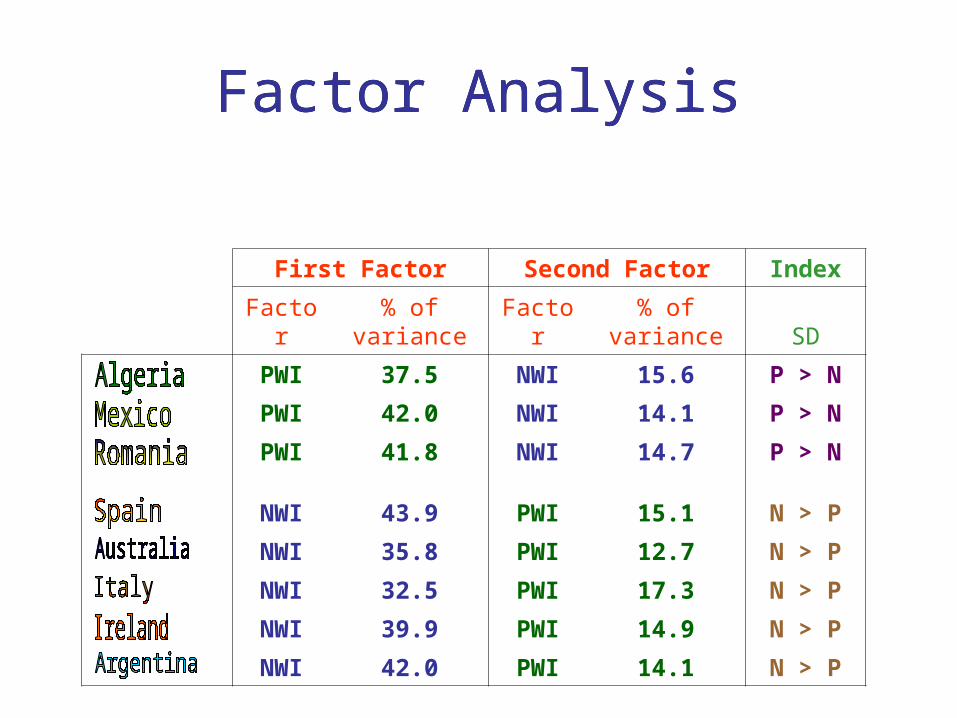
Factor AnalysisFactor Analysis
First Factor Second Factor Index
Factor% of
variance Factor% of
variance SD
PWI 37.5 NWI 15.6 P > N
PWI 42.0 NWI 14.1 P > N
PWI 41.8 NWI 14.7 P > N
NWI 43.9 PWI 15.1 N > P
NWI 35.8 PWI 12.7 N > P
NWI 32.5 PWI 17.3 N > P
NWI 39.9 PWI 14.9 N > P
NWI 42.0 PWI 14.1 N > P
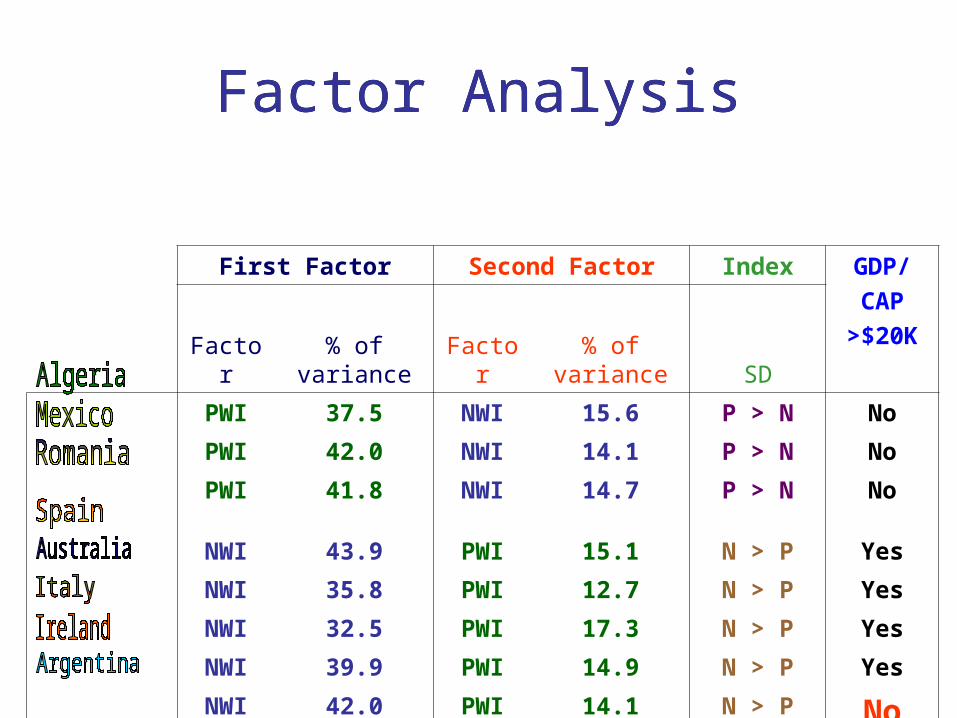
Factor AnalysisFactor Analysis
First Factor Second Factor Index GDP/
CAP
>$20K
Factor% of
variance Factor% of
variance SD
PWI 37.5 NWI 15.6 P > N No
PWI 42.0 NWI 14.1 P > N No
PWI 41.8 NWI 14.7 P > N No
NWI 43.9 PWI 15.1 N > P Yes
NWI 35.8 PWI 12.7 N > P Yes
NWI 32.5 PWI 17.3 N > P Yes
NWI 39.9 PWI 14.9 N > P Yes
NWI 42.0 PWI 14.1 N > P No

Personal Wellbeing Index
77.4
73.0 72.871.1 71.0
69.6
65.6
52.3
50
55
60
65
70
75
80
Mexico Australia Ireland Spain Italy Romania Argentina Algeria
Strengthof
satisfaction
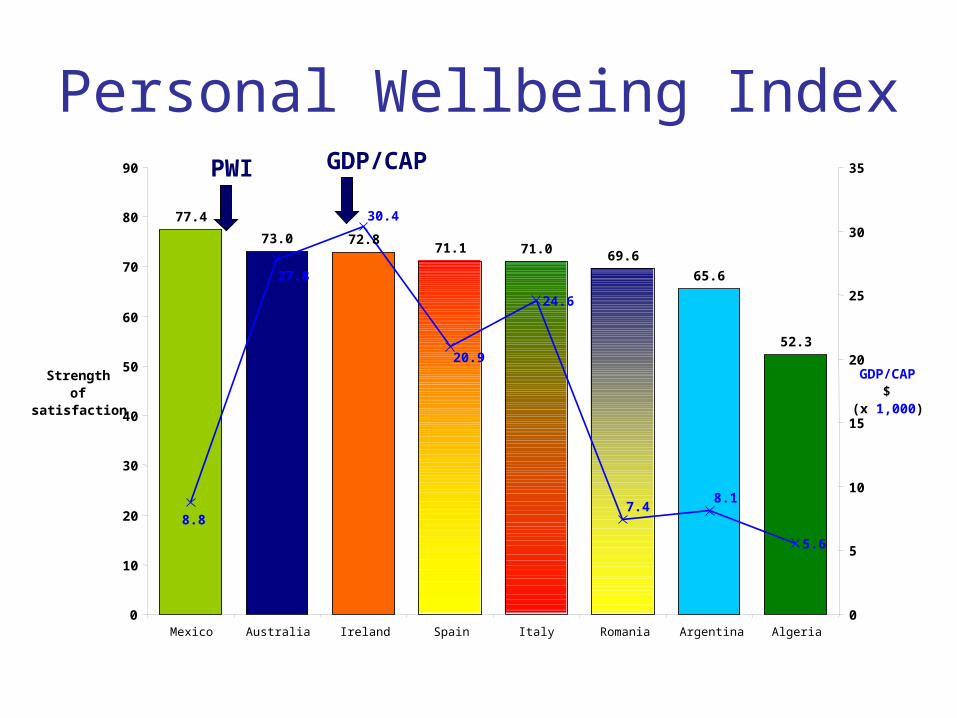
Personal Wellbeing Index
77.4
73.0 72.871.1 71.0 69.6
65.6
52.3
24.6
5.6
8.17.4
20.9
30.4
27.8
8.8
0
10
20
30
40
50
60
70
80
90
Mexico Australia Ireland Spain Italy Romania Argentina Algeria
Strengthof
satisfaction
0
5
10
15
20
25
30
35
GDP/CAP$
(x 1,000)
PWI GDP/CAP

Steel, P. & Ones, D.S. (2000). Journal of Personality & Social Psychology, 83, 767-81.
Compared SWB and Personality
Source of SWB: Veenhoven’s World Database of Happiness
Number of countries:
• EPQ (39), NEO-PI-R (24)
Mean sample size per country:
• Affect (hedonic balance) = 2,901
• Happiness = 25,300
• Satisfaction = 28,654
Number of people involved in the overall data = 2,100,000
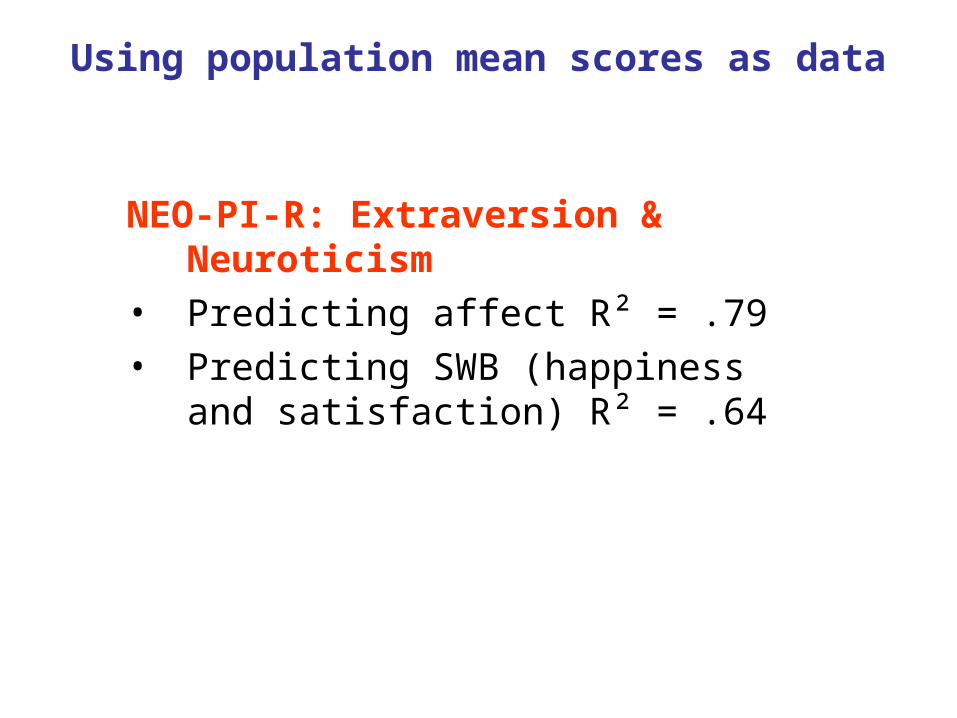
NEO-PI-R: Extraversion & Neuroticism• Predicting affect R² = .79• Predicting SWB (happiness and
satisfaction) R² = .64
Using population mean scores as data
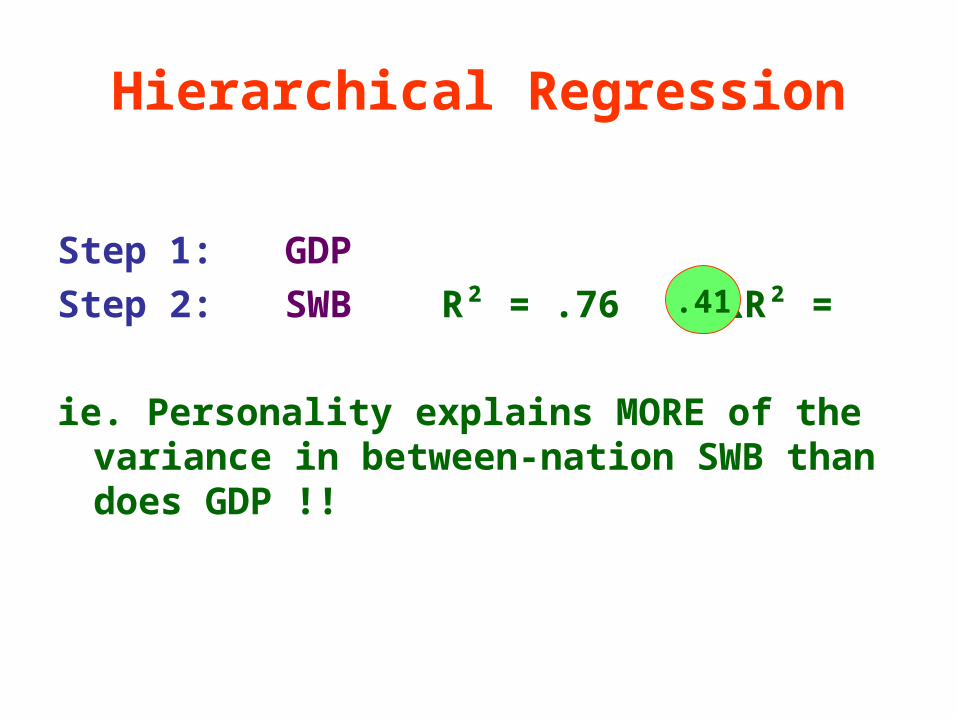
Hierarchical Regression
Step 1: GDP
Step 2: SWB R² = .76 R² =
ie. Personality explains MORE of the variance in between-nation SWB than does GDP !!
.41

Neuroticismvs.
Personal Wellbeing Index
10.3
14.2
14.6
15.5
16.7
13.3 71.0
75.6
69.4
79.3
65.1
75.3
9
10
11
12
13
14
15
16
17
Norway Romania Mexico Hong Kong Australia Italty
Country
Neuroticism
60
62
64
66
68
70
72
74
76
78
80
PWI
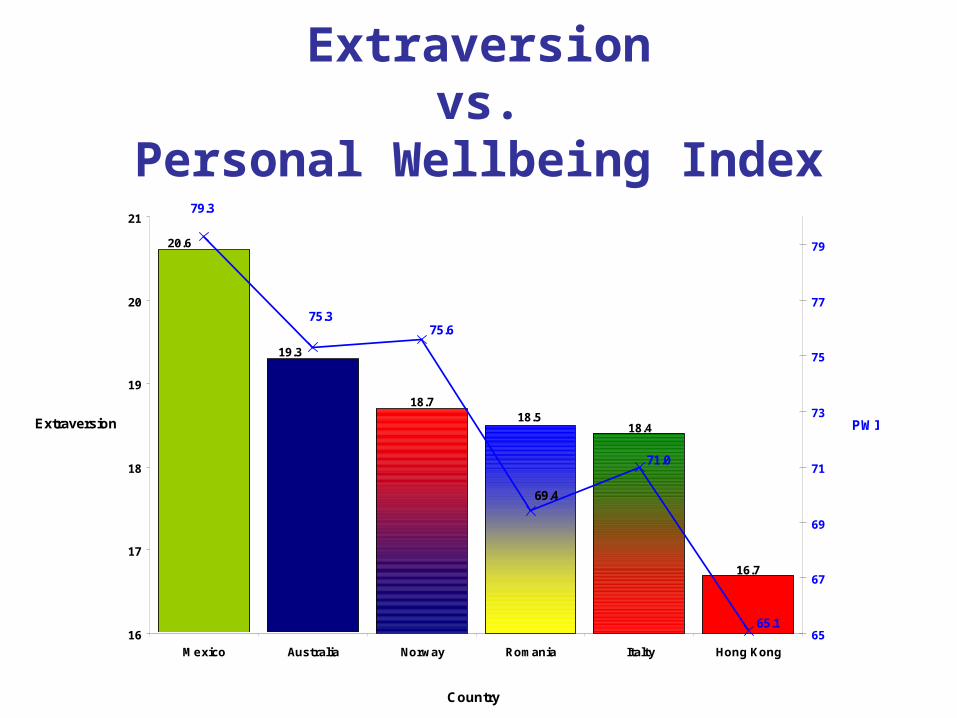
Extraversionvs.
Personal Wellbeing Index
18.518.4
16.7
20.6
19.3
18.7
79.3
75.375.6
71.0
65.1
69.4
16
17
18
19
20
21
Mexico Australia Norway Romania Italty Hong Kong
Country
Extraversion
65
67
69
71
73
75
77
79
PWI
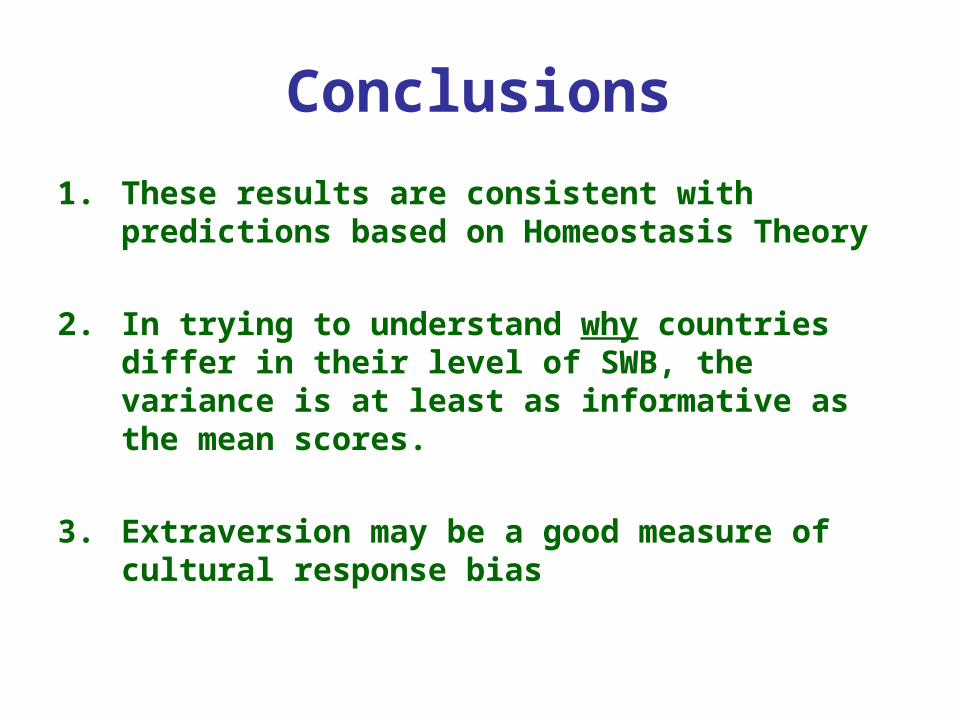
Conclusions
1. These results are consistent with predictions based on Homeostasis Theory
2. In trying to understand why countries differ in their level of SWB, the variance is at least as informative as the mean scores.
3. Extraversion may be a good measure of cultural response bias