the internet of things in retail -...
TRANSCRIPT

02.17 EB9645 RETAIL
The Internet of Things in Retail
THE INTERNET OF THINGS IN RETAIL 2
The problem for many retailers is knowing where to start. The IoT offers a plethora of opportunities, and retailers find themselves overwhelmed with the possibilities and unsure of their next move. Unfortunately, if retailers wait too long, they’ll find themselves quickly falling behind. According to Gartner, leading retailers are already using sensor data to make more informed business decisions:
“IoT customer- and employee-facing initiatives in the store include trials, pilots and implementations of smart shelves, RFID for check-out, electronic shelf labels (ESLs) for both price management and customer promotions, in-store beacons, traffic counters, smart packaging, 3D printers, smart mirrors, interactive dressing rooms, smart signage, smart shopping carts and smart robots.”3
Visionary retailers are paving the way, making it easier for mainstream adopters to identify use cases that deliver optimal business value. These use cases have one thing in common: they involve big data analytics of sensor data joined to corporate data. This includes a retailer’s existing troves of multi-dimensional product, store, customer, and sales data, plus external data sources such as weather data. The real business value of the IoT will be driven by leveraging the integrated data and analyzing it to optimize stores, get a handle on inventory, reduce shrinkage, manage fleets of vehicles, and more.
This white paper illustrates how retailers are acting on analytics of sensor data, providing specific use case
examples, and offers guidance for those who want to move quickly to become part of the early majority.
What Is the Internet of Things (IoT)?
The Internet of Things (IoT) refers to the enormous network of devices and physical objects (“things”) that leverage technology to capture and exchange data via the Internet and emit sensor data. IoT devices have sensors that collect and transmit data every millisecond, second, or minute. This sensor data can then be used to inform business decisions and address challenges like improving operational efficiencies to reduce costs and driving customer engagement to increase revenue.
The IoT encompasses new types of big data generated by sensors and beacons as well as existing technologies like RFID. RFID use is on the rise again as retailers take advantage of the decreasing cost of RFID tags and begin applying them to high-value products. Some manufacturers are including RFID tags in product packaging, providing retailers with merchandise that is already tagged.
The State of the IoT in Retail: Common Use Cases
When it comes to the IoT, retail is lagging behind other industries. Industries such as manufacturing and transportation have been harvesting value from IoT sensor data and the insights it drives for over a decade. While visionary retailers recognize the potential of the IoT and are exploring how to leverage sensor data and analytics, they’re just beginning to experiment and innovate with IoT, searching for those one-to-three percent upticks in the bottom line. They are also building skills in order to pull ahead of competitors.
Introduction
It’s high time retailers embrace a key trend: Internet of Things (IoT) sensor data analytics. Sensor data from the IoT is an order of magnitude larger than big data, and many industries are already benefitting from its transformative effects. Gartner forecasts endpoints (aka things) of the Internet of Things will grow at a 32.9 percent CAGR from 2015 through 2020, reaching an installed base of 20.4 billion units.1 They also forecast 87 million endpoints in 2017 for retail and wholesale with a 44 percent compound growth rate. Forward-thinking retailers recognize the IoT’s potential to improve efficiency, reduce costs, and drive new revenue streams. According to an August 2015 study by Retail Systems Research, the majority of retailers worldwide with above-average sales growth believes that the IoT is poised to dramatically change the way they do business in the next three years.2 So why are most retailers reluctant to embrace IoT?
1 Gartner, Forecast Internet of Things — Endpoints and Associated Services, Worldwide, 2016, December 29, 2016.
2 Nikki Baird and Steve Rowen, “The Internet of Things in Retail: Great Expectations,” Retail Systems Research, August 2015, https://www.business.att.com/content/productbrochures/2015_IoT_RSR_Report.pdf.
3 Gartner, IoT in Retail — Understand the Benefits of the IoT for Digital Business Success, September 9, 2016.
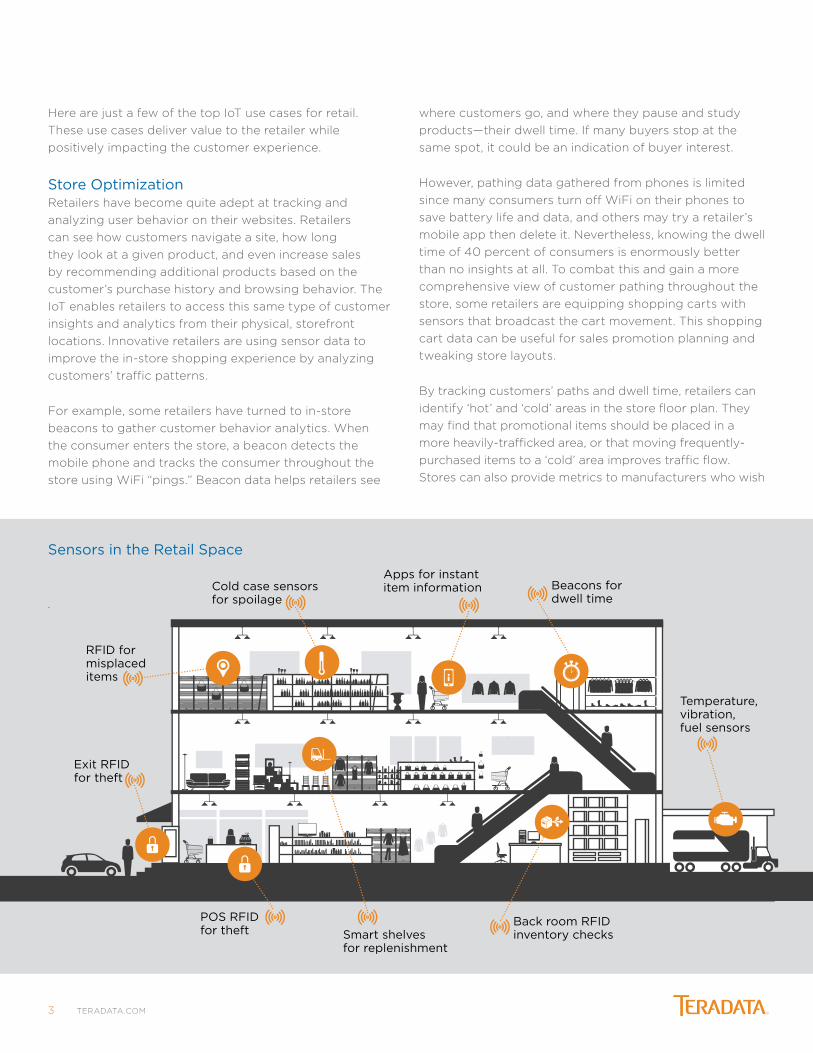
Cold case sensorsfor spoilage
Apps for instantitem information
RFID formisplaceditems
Beacons fordwell time
Smart shelvesfor replenishment
Back room RFIDinventory checks
Temperature,vibration,fuel sensors
POS RFIDfor theft
Exit RFIDfor theft
TERADATA.COM3
Here are just a few of the top IoT use cases for retail. These use cases deliver value to the retailer while positively impacting the customer experience.
Store Optimization Retailers have become quite adept at tracking and analyzing user behavior on their websites. Retailers can see how customers navigate a site, how long they look at a given product, and even increase sales by recommending additional products based on the customer’s purchase history and browsing behavior. The IoT enables retailers to access this same type of customer insights and analytics from their physical, storefront locations. Innovative retailers are using sensor data to improve the in-store shopping experience by analyzing customers’ traffic patterns.
For example, some retailers have turned to in-store beacons to gather customer behavior analytics. When the consumer enters the store, a beacon detects the mobile phone and tracks the consumer throughout the store using WiFi “pings.” Beacon data helps retailers see
where customers go, and where they pause and study products—their dwell time. If many buyers stop at the same spot, it could be an indication of buyer interest.
However, pathing data gathered from phones is limited since many consumers turn off WiFi on their phones to save battery life and data, and others may try a retailer’s mobile app then delete it. Nevertheless, knowing the dwell time of 40 percent of consumers is enormously better than no insights at all. To combat this and gain a more comprehensive view of customer pathing throughout the store, some retailers are equipping shopping carts with sensors that broadcast the cart movement. This shopping cart data can be useful for sales promotion planning and tweaking store layouts.
By tracking customers’ paths and dwell time, retailers can identify ‘hot’ and ‘cold’ areas in the store floor plan. They may find that promotional items should be placed in a more heavily-trafficked area, or that moving frequently-purchased items to a ‘cold’ area improves traffic flow. Stores can also provide metrics to manufacturers who wish
Sensors in the Retail Space
.
Cold case sensorsfor spoilage
Apps for instantitem information
RFID formisplaceditems
Beacons fordwell time
Smart shelvesfor replenishment
Back room RFIDinventory checks
Temperature,vibration,fuel sensors
POS RFIDfor theft
Exit RFIDfor theft

THE INTERNET OF THINGS IN RETAIL 4
to purchase space on endcaps, and retailers may be able to raise the price in particular locations using data that shows these endcaps get more traffic.
Contextualizing pathing data with product and sales data offers many opportunities for big data analytics. Retailers can ask the following questions about purchase behavior and look to IoT for the answers to optimize in-store experiences and increase purchases.
• How does traffic change based on time of day, seasonality, or weather?
• Do promotions impact store traffic?
• Does rearranging the store increase sales (as some think) or does it actually negatively impact sales?
• Can successful tactics used in one store be tested in other stores, and what is the result of those tests, both on store traffic and on revenue?
Inventory Accuracy and ManagementA laborious, manual process prone to human error, inventory has historically been a challenge for retailers. When shipments arrive at the store, retailers often accept what the manifest tells them without conducting a complete count of the product received. And once product goes to the sales floor, multi-unit products get separated. Customers pick up products and later leave them in the wrong department. Some products don’t even make it onto the selling floor—or they do, but not in a timely manner. It’s nearly impossible to accurately track the quantity and location of all the products in the store. Sensor data enables retailers to address these challenges and increase top-line revenue by enabling improved inventory accuracy and making it easy for associates to find products anywhere in the store.
The difference between inventory counts that are automated and accurate every day and the current infrequent, manual inventory check is enormous. Research from IHL Group estimates that the amount retailers around the world lose from inventory distortion is $1.1 trillion, nearly the GDP of Australia.4 Inventory distortion, defined as the cost of out-of-stock merchandise plus lost sales, combined with the losses resulting from deeply discounted overstock, is easily combated with big data analytic sources like RFID tagging.
Thus, inventory accuracy can be driven using RFID tags. The dropping cost of RFID tags, and, in some cases, the willingness of manufacturers to install them, makes RFID tags a cost-effective way to tag and track high-margin items. For instance, manufacturers are tagging razor blades, which are expensive and prone to theft. Some manufacturers are tagging name brand jeans and shoes. Not only do these tags help prevent loss due to theft, but they enable store employees to track items that get moved around the store. If a customer wants to buy a pair of jeans but can’t find her size, a sales associate can determine whether there is a pair in her size on another shelf. If shoes become separated, a sales associate can track down the other shoe within a square meter. Both scenarios enable retailers to improve top-line revenue, because they are able to sell product that might otherwise be overlooked.
Accurate daily inventory is crucial for supporting in-store pickup of online purchases for a high-quality customer experience. In order to maintain a positive customer experience, retailers must make the “buy online/pickup in store” process seamless and convenient for the customer. This means when customers are told online that a specific store has the item they seek, staff must be able to locate sought-after items quickly to place them on hold. This requires the ability to find items even if they are in the wrong location. This capability is predicated on combining in-store item location tracking with order-entry systems typically driven by e-commerce applications and mobile applications. Armed with accurate inventory information from stores, big data analytics can improve in-store pickup commitments and send buyers to the nearest store that has the items in stock, building a positive customer experience.
Shrinkage Reduction Analytics on sensor data can help retailers with the problem of shrinkage, a $1.23 billion problem, according to the Global Retail Theft Barometer for 2014-2015. RFID tags or other sensors allow retailers to track item location and analyze trends. Analytics on sensor data won’t pinpoint every theft, but it will allow retailers to identify patterns that reveal where they’re losing the most money. This prioritizes and simplifies investigations so that retailers can stop the bulk of their losses.
For example, it might be clear that goods are coming into the store from shipping but are not correlated at the point of sale with an invoice or receipt. If items are leaving
4 Greg Buzek, “We Lost Australia: Retail’s $1.1 Trillion Inventory Distortion Problem,” 2015.

TERADATA.COM5
the store without a receipt, RFID and other sensors can often identify the doorway or POS station the items pass through. The sensor data date-time stamp can be correlated with a checkout person at the POS. Similarly, if sensor data reveals that 20 pairs of jeans were shelved and suddenly disappear, there may be a “dead zone” in a part of the store, enabling surreptitious removal of goods. Sensor data analytics can help pinpoint that area, allowing the retailer to correct the problem. In this case, big data analytics are required to correlate data in stores and across the supply chain to identify patterns associated with possible crime and to evolve their tactics.
Retailers are using sensor data to reduce shrinkage and waste along the cold chain. This involves using sensors to track food products and environmental conditions as shipments go from the farm to the store in order to reduce spoilage. For example, sensors on farm harvesting equipment track movement of food to packaging and storage. Sensors in trucks monitor temperature and humidity in transit to distribution centers. Sensors track environmental conditions in the warehouse, on more trucks, and finally throughout the store itself. By integrating sensor data across this transfer of goods from supplier to retailer, problems like trucks with poor refrigeration causing food spoilage can be identified early on.
Sensors in the cold chain also extend to in-store refrigeration. Cold cases and freezers can break down but before they do, they often show signs of malfunctioning. The resulting fluctuations in temperature can negatively impact the quality of goods. However, sending employees around to manually check temperatures in freezers or cold cases is costly and unreliable. A manual misread or disregard for a subtle temperature difference on the part of the employee can cause a problem to be neglected. The downstream effect is a poor customer experience when a consumer accidentally purchases spoiled food.
Be on the lookout for IoT value cases. Any time you see a thermometer, it’s an indicator of a manual process that could be automated using sensors. Every item in the store not in the correct location is a possible lost sale or stolen item. Every truck in the fleet offers an opportunity for cost optimization.

THE INTERNET OF THINGS IN RETAIL 6
Temperature sensors yield better measurements 24 hours a day, freeing employees for more important tasks. Temperature sensors from display cases and back room freezers also help retailers avoid costly repairs and reduce downtime by predicting compressor failures long before spoilage occurs.5 Furthermore, detailed data visibility into the cold chain allows grocers and distributors to reduce the $40 billion annual loss in farm produce and perishable goods due to supply chain inefficiencies. Equally important is that the consumer gets a fresher product and knows which retailer is most reliable for perishables.
Pharmacies also see the value in this type of insight and are beginning to use sensor data to comply with regulatory requirements as they relate to the supply chain. Laws related to serialization, such as the Drug Supply Chain Security Act in the US, require every hand-off of prescription medicine to be documented. The documentation must include the time of hand-off, weight of the shipment, and any temperature issues that the shipment experienced. Data from sensors on prescription medicine enables pharmacies to provide the required visibility to regulators and ensure that medicine comes from trusted sources. The EU, China, and Brazil have similar regulatory requirements around pharmaceutical compliance.
For food and pharmaceuticals in particular, any illness or death resulting from spoiled food or bad medicine can quickly turn into a financial disaster. At one end of the spectrum, a customer who buys a bad food item is likely not to purchase from that source for up to 2 years, resulting in lost revenue. But the reputational loss from food-borne illnesses or harmful medicine is a broader risk, with enormous public relations implications. A few lawsuits and widespread negative publicity can cause a company to go out of business. The seemingly mundane work of gathering and analyzing sensor temperatures in cold cases or trucks can be seen in an entirely different light: analytics on sensor data acts as insurance by detecting problems before they affect public health and the bottom line.
Fleet ManagementRetailers are also beginning to use data from the Internet of Things to better manage their transportation fleets. Unlike cars, sensors in trucks have been in place since
the 1990s, so leveraging the IoT for fleet management isn’t necessarily an added expense. On-board diagnostics sensors can collect and transmit data in 3G. Along with GPS data and other sensors, retailers can monitor the velocity and direction of vehicles to determine their location and estimated time of arrival. This data can be used to negotiate lower rates with insurance companies or as evidence in a claim scenario. If, for example, an accident was due to weather conditions as opposed to driver negligence, the retailer can use the sensor data to make this case to the insurance company.
Location tracking data can also be correlated with weather data to estimate when a shipment will arrive at a specific location. Typically, if there is a delay due to weather or another unforeseeable event, the retailer only becomes aware of it if the driver calls in. With this sensor data, however, retailers can make business decisions around product availability much sooner.
Sensors on trucks also provide visibility into the drivers’ behaviors. The retailer can ensure that drivers are not exceeding the maximum number of daily hours on the road and that they are adhering to the route plan. Sensors on the truck’s back door can indicate if and when the container is opened and closed. If the truck is full of perishable items, that data can be correlated with the temperature inside the truck to determine if this activity is causing spoilage. When correlated with inventory data, sensor data can also be used to point to possible fraud.
Analyzing sensor data can also help retailers improve fuel efficiency. Retailers combine GPS sensor routing information with shipping manifests to determine whether a delivery is time-sensitive. If not, then an algorithm can direct trucks to travel a lower fuel-efficient route. Vehicle age can be factored into the route and cargo planning system to select the best vehicle for the task. A newer vehicle with better fuel efficiency may be used for heavier loads, reducing fuel cost and increasing margin on a particular shipment. Furthermore, retailers can also determine when it makes sense to replace older vehicles based on better fuel efficiency.
Retailers also have fuel theft to contend with when it comes to fleet management. Sensor data can help there, too. A drop in fuel might appear as 10 percent of the tank reduced at odd intervals until sensor data and GPS patterns are analyzed. The data may reveal a place where the fuel drop occurs repeatedly, leading to an investigation.
5 Gartner, Inc. “IoT in Retail – Understand the Benefits of the IoT for Digital Business Success.”

TERADATA.COM7
All of these use cases can add up to big savings. In a proof of concept test, one company found that it could save $3 million annually in fuel costs through big data analytics of sensor data, fleet information, delivery expectations, and driving routes to improve fuel efficiency.
Getting Started
The evidence that IoT can help retailers make smarter business decisions and influence their customers’ purchase decisions is there. So, how can retailers get started on their IoT journey?
Build a business case. First of all, form a team of cross-functional business leaders and IT professionals that can identify and prioritize retail IoT use cases. Many retailers get stuck in this step, unable to justify and prioritize projects. This is the time to hire a business value consultant who is steeped in retail sensor data analysis applications. As a neutral participant with knowledge of what other retailers are doing in different industries with
sensor data, this expert becomes the catalyst for working with the retailer’s team to prioritize important first projects. Only after building the business case around the opportunity and determining how data and analytics will support it should teams identify and deploy technology.
Drive business results with analytics. The cross-functional team should aim to find multiple use cases that leverage the same data and infrastructure. This will help maximize the re-usability of IoT investments both in the store and in the IT department. This requires IT architects to participate in the cross-functional planning. It is also important for the team to clearly define actions that will be driven from the data and analytics, as well as how the business results will be quantified. Focus on the business opportunity and process. Investigate what can be discovered by combining sensor data with existing data to drive new, actionable analytics and insights.
Run a Proof-of-Concept (PoC). The turning point is the proof-of-concept (PoC) projects. The first PoC is a test of
Smart ShelfSensors
Beacons
Smart CartSensors
In Store RFID
WiFi
In Store Sensors
Product Description
Product Margin
Store Promotions Store Sales
Store Map Promotions On Order
Store Planagram Store Staffing
Total Store on Hand
Sensors on Trucks
Ratings and Reviews
Marketing Campaign Response
CustomerStore on Hand by Location
Product Sales and Returns
Customer Interactions
Call CenterProduct
Retail and Cost
Product Attributes
Customer Value
Clickstream Social Media

skills, the ability to work together as a team, the technology, and the business benefits generated. View a PoC as a learning opportunity, not a phase one development project. Experience gained in the first PoC will pave the path for the IoT roadmap and for additional projects, so keep the scope and costs low. Anticipate future challenges, learn and adapt as a prelude to making major commitments.
Work with suppliers. Collaborate with suppliers on IoT initiatives. Discuss how data might be shared with them and whether it’s possible to leverage their investment in sensor data. Sharing data about product movement, such as in cold chains, is an important way to gain value from analysis. Companies seeing strong returns from IoT investments point to data sharing as an important strategy. Companies with stronger analytics capabilities are about twice as likely to share data with suppliers, customers, and even competitors.1 Do this before competitors, or at least be a fast follower.
Don’t get tempted by point solutions. IT architects must plan ahead. According to an EMA survey7 of 700 IoT projects, more than half of companies invested in the
IoT have implemented between two and three different projects. Some have eight to eleven IoT implementations. Therefore, it’s best to implement an infrastructure that can support both the initial use case and serve as the foundation for future use cases and business applications. This means that boutique point solutions will be less cost effective than a shared infrastructure.
The Analytics of Things
Work on building a competency in the analytics of things. An MIT Sloan Management Review’s 2016 Global Executive survey found that having a strong analytics capability is highly correlated with a company’s ability to derive value from IoT investments.
The analytics of things requires combining sensor data with existing data. It’s one thing to confirm, via sensor data, that certain items are out of stock. It’s another thing entirely to know if these items were actually sold or stolen, whether a nearby store is also running out of the item frequently and if there’s an advertising campaign or distribution issue occurring that’s causing stock to repeatedly run out. This is where the larger business picture of the data warehouse brings value.
Putting sensor data in the larger context of other key data generates a very high return on investment as supplier data, stocking data, labor data, campaign management, and other channels are combined into one high-resolution digital image. This offers a definitive view of the state of a retailer’s business and points out new opportunities to increase market share and drive new consumer purchases.
If you would like to learn more about how Teradata can help you use analytics to drive business value from the IoT, contact your sales account executive to start a dialog with our experienced business consultants.
10000 Innovation Drive, Dayton, OH 45342 Teradata.com
Teradata and the Teradata logo are registered trademarks of Teradata Corporation and/or its affiliates in the U.S. and worldwide. Teradata continually improves products as new technologies and components become available. Teradata, therefore, reserves the right to change specifications without prior notice. All features, functions and operations described herein may not be marketed in all parts of the world. Consult your Teradata representative or Teradata.com for more information.
Copyright © 2017 by Teradata Corporation All Rights Reserved. Produced in U.S.A.
02.17 E9645
6 MIT Sloan Management Review report, “Data Sharing and Analytics Drive Success with IoT,” September 2016.
7 Enterprise Management Associates, The Rise of the Internet of Things: Connecting Our World One Device at a Time, July 18, 2016.
Putting sensor data in the larger context of other key data generates a very high return on investment as supplier data, stocking data, labor data, campaign management, and other channels are combined into one high-resolution digital image.