the ipo of industrial and commercial bank of china and...
TRANSCRIPT
The IPO of Industrial and Commercial Bank of China and the ‘Chinese Model’ of Privatizing Large Financial Institutions*
Franklin Allen Jun “QJ” Qian† The Wharton School Carroll School of Management University of Pennsylvania Boston College, WFIC & CAFR [email protected] [email protected]
Susan Chenyu Shan Mengxin Zhao School of Economics and Finance School of Business
The University of Hong Kong University of Alberta [email protected] [email protected]
Last Revised: January 24, 2012 Forthcoming, European Journal of Finance
Abstract
We examine the privatization process of the Industrial and Commercial Bank of China (ICBC), the largest bank in the world by market capitalization, and its dual IPOs in the Hong Kong and Shanghai Stock exchanges in 2006. The Chinese government retains majority equity ownership of ICBC while foreign institutional investors hold minority equity stakes. Other large financial institutions went through the same reform process and have similar, post-IPO ownership structures. The largest Chinese banks, as a group, outperformed their counterparts from other emerging and developed markets before and during the 2007-2009 financial crisis. We argue that the ‘Chinese model’ of privatizing and managing large financial institutions can be advantageously used in other countries. JEL Classifications: G2, G3, L1,
Keywords: banks, IPO, privatization, non-performing loans, stock returns.
* We wish to thank Edward Lee and Wenxuan Hou (editors) and two anonymous referees for helpful comments, Darien
Huang for excellent research assistance, and Boston College, University of Alberta, University of Hong Kong, and the Wharton Financial Institutions Center for financial support. The authors are responsible for all the remaining errors.
† Corresponding author: Finance Department, Carroll School of Management, Boston College, MA 02467. Phone: 617-552-3145, fax: 617-552-0431, E-mail: [email protected].
1
I. Introduction Large financial institutions have been at the center of the 2007-2009 global financial crisis
and the ongoing Euro Zone debt crisis. With perverse incentives, these ‘too big to fail’ institutions
from developed countries took on excessive risks that were concealed from the public and
regulators, and their downfall triggered the near collapse of the global financial system and led to
massive welfare losses around the world. Even with substantial regulatory reforms such as the
Dodd-Frank Act in the US, much debate remains on how to restrain these large institutions without
excessive regulations that would discourage any risk-taking behavior, an essential part of all profit-
maximizing corporations. 1 Effective monitoring of large financial institutions is of particular
importance in emerging economies, since the banking sector plays a more important role in
supporting economic growth than financial markets in most countries (e.g., Levine 2002). But this
task can be a tall order in the developing world characterized by the lack of sophisticated
institutional investors and underdeveloped markets and institutions.
In this paper we examine the privatization process of the Industrial and Commercial Bank of
China (ICBC), the largest bank in the world in terms of market capitalization, and its dual initial
public offerings (IPOs) in the Hong Kong Stock Exchange (HKSE) and Shanghai Stock Exchange
(SHSE). ICBC’s largest shareholder is the Chinese government while foreign institutional investors
hold minority stakes. Many other large financial institutions went through the same reform process
and have similar ownership structures after the IPO. We find that the largest Chinese banks, as a
group, outperformed large banks from other emerging and developed economies before, during and
after the 2007-2009 crisis. Our conclusion is that the ‘Chinese model’ of privatizing large financial
institutions can be advantageously used in other emerging countries, because it provides a balance
between effective monitoring and maintaining the competitiveness of these institutions in the
1 See, e.g., Acharya et al (2010) on a review of the Dodd-Frank Act and regulations on financial institutions, and Johnson and Kwak (2011) on the adverse impact of the large financial institutions.
2
market place.
China’s intermediation sector has been dominated by a few large but inefficient financial
institutions for many years. The four largest, state-owned commercial banks (“Big Four” banks)
have nationwide networks of branches and control the majority of assets in the banking system.
Before the crisis, the most glaring problem of the banking sector had been high levels of non-
performing loans (NPLs), most of which accumulated in the ‘Big Four’ banks from poor lending
decisions to state-owned enterprises (SOEs). Following the Asian Financial Crisis in 1997 and
especially after China joined the World Trade Organization (WTO) in December 2001, a series of
reforms began and focused on state-owned banks, with the goal of improving their efficiency—i.e.,
to make these banks behave more like profit-maximizing commercial banks and lower the level of
NPLs.
A critical part of ICBC’s reform process was to strengthen its capital base and asset quality,
and two steps were undertaken. First, China’s Ministry of Finance, through the establishment of a
bank holding company – the Central Huijin Investment Company (Huijin hereafter), injected capital
(e.g., government bonds and foreign currency reserves) into ICBC and other banks. Second, four
asset management companies, established by the central government, assumed the NPLs of the Big
Four banks. In particular, Huarong Asset Management Corporation took the bad loans that were
transferred from ICBC’s balance sheet. ICBC’s legal status was changed from state-owned to a
‘joint-stock limited company’ in October 2005, with the Ministry of Finance and Huijin as
promoters.
The next phase of the privatization process was to list the large banks on the Hong Kong
Stock Exchange (HKSE), so that they would be subject to international banking accords (e.g., Basel
II), disclosure requirements and governance mandates. Prior work has emphasized the benefits from
improved corporate governance, since listing a domestic firm on an exchange located in more
3
developed financial markets can be a ‘bonding’ mechanism for the firm to enhance protection of
minority investors and reduce the agency costs of the controlling shareholders (e.g., Coffee, 1999,
2002; Stulz, 1999; Reese and Weisbach, 2002). On the other hand, the Chinese government,
through various agencies, will retain majority ownership of all the banks while attracting foreign
institutional investors as minority shareholders. ICBC’s IPOs, carried out simultaneously on the
Shanghai Stock Exchange (SHSE) and HKSE on October 27, 2006, were successful—they raised a
total of $22 billion, the largest amount of any IPO up to that point. From July 2010 onwards, all Big
Four banks that were previously wholly state-owned have been corporations listed on HKSE. Other
large financial institutions, including insurance companies, have gone through similar privatization
process and are also listed on HKSE and domestic exchanges.
Next, we compare the performance of the largest five Chinese state-owned banks (Big Four
plus the Industrial Bank of China) with other large, non-state-owned banks from China, the largest
banks from emerging markets (both state-owned and non-state-owned) as well as the largest banks
from developed countries over the period of 2006-2011. The five largest Chinese banks have
improved their performance considerably as compared to the pre-IPO period and the upward trend
continued during 2006-2011. As a group, these banks generate higher return on assets (ROA),
returns on equity (ROE) and excess stock returns than all the other groups of banks from developed
and emerging markets during the period.
We also look at two measures of risk-taking activities—Tier 1 capital ratio, a balance sheet
measure, and the standard deviation of daily stock returns (on an annual basis), a market based
measure. There is no significant difference, using either measure, between the five state-owned
banks from China and other banks from developed and emerging markets during the sample period.
This indicates that the superior performance of the state-owned banks from China is not driven by
less risk-taking during a period of global financial crisis. This also supports the view that majority
4
government ownership in these state-owned banks from China has not stifled risk-taking activities
of these banks relative to privately owned banks.
Overall, we conclude that the “Chinese model” of privatizing state-owned banks has been
successful in improving efficiency. The main implication of our results is that such a model—
partially privatizing large state-owned financial institutions and converting them into listed
companies with a diverse investor base and the government retaining the majority stake—can be
used in other emerging economies. Prior studies have emphasized the adverse effects of government
ownership of banks—inefficiencies due to poor incentives and agency problems in the form of
‘tunneling’ by insiders and connected borrowers.2 We argue that the impact of the adverse effects
can be significantly reduced if state-owned banks are listed on foreign exchanges and committed to
enhancing minority shareholder protection and reducing agency costs. Moreover, as a publicly
listed firm, profit maximization is part of their goals and these banks are also subject to international
standards and face competition from other banks in the domestic and international sectors.
One of the key lessons from the 2007-2009 crisis is how to contain excessive risk-taking by
large financial institutions. Risk-taking was justified as generating the highest possible returns to the
shareholders; but excessive risk-taking by large institutions leads to higher systemic risk and more
fragility. In this regard, the government, as the controlling shareholder of large financial institutions,
can impose non-profit goals such as systemic stability (of the financial system) and ensure
continued lending during recessions and crisis periods.3 In developing countries, legal and financial
institutions are underdeveloped, and market-based forces such as institutional investors, who play a
prominent role in the governance of listed firms in developed countries, are weak or nonexistent. In 2 With a cross-country sample La Porta et al. (2002) find government ownership of banks to be associated with less financial development. Sapienza (2004) shows inefficiencies in the lending process by state-owned banks in Italy, and Dinc (2005) shows the influence of political elections in the lending process in a sample of emerging markets. 3 Consistent with this argument, Beltratti and Stulz (2010) study an international panel of large banks and find that pro-shareholder boards are associated with higher (lower) performance before (during) the crisis, reflecting decisions that sought to maximize shareholder value but that did not perform as expected when the crisis hit.
5
such an environment, government and government-appointed officials are perhaps the only force
that can rein in excessive risk-taking of large financial institutions; as long as these banks are
competitive relative to non-state banks in the country/region, majority government ownership
should not smother risk-taking. We also discuss how a government can enhance its presence in a
banking sector dominated by privately owned banks. As observed during the crisis period, the
government can obtain majority equity stakes of large banks in exchange for a capital injection, or
acquire an entire financial institution in danger of collapsing.
Our paper extends the literature on privatizing state-owned companies. Prior research
generally finds that (partial) privatization (in transition and developing economies) improves
efficiency and performance.4 We show that listing state-owned banks in foreign exchanges is an
important step in the privatization process, and that government ownership of listed banks has
benefits, especially during crisis-prone periods and environments. Our paper also contributes to a
growing literature examining China’s banking industry. In particular, Berger, Hasan and Zhou
(2009) find that minority foreign ownership of the Big Four banks is associated with improved
operating performance. We extend their analysis by showing that listing the Big Four banks on
HKSE is another important step in reforming these banks and that these listed banks actually
outperform large banks from emerging and developed markets during the 2007-2009 crisis period.
Section II of the paper provides background information on the China’s banking sector and
documents the privatization process of ICBC and its dual IPOs. In Section III we compare the
performance of the largest Chinese banks with majority state ownership with other large banks in
the world. Finally, Section IV concludes.
4 For example, Bonin, Hasan and Wachtel (2005a, b) examine privatization of banks in Eastern European countries, and Serdar and Nandini (2011) examine the political influence of privatizing banks in India. See Megginson (2005) for a review of bank privatizations and Megginson and Netter (2001) for a review on privatization of all types of firms.
6
II. China’s Financial Intermediation Sector and the Privatization Process of ICBC 5
Between 1949 and 1979, China’s entire financial system consisted of one bank, the People’s
Bank of China (PBOC), managing deposit-taking, lending and payment system functions of the
state planning system. In 1979, PBOC’s international trade and foreign exchange businesses were
spun off to the Bank of China (BOC), while the agriculture and fixed investment and construction
functions were allocated to the Agricultural Bank of China (ABC) and the China Construction Bank
(CCB), respectively. In 1984, PBOC became the central bank after its savings and loan functions
were transferred to ICBC. In 1993 and 1994, three policy banks (the State Development Bank of
China, the Export-Import Bank of China and the Agricultural Development Bank of China) were
established, and the largest four specialized banks became the Big Four commercial banks. Along
with nine joint-stock commercial banks, they formed the top-tier structure of the Chinese banking
system, which also included numerous cooperatives and finance companies.6
For most of the past three decades China’s banking sector, and to some extent the entire
financial system, was dominated by the Big Four banks. For example, Demirgüç-Kunt and Levine
(2001) compare the five-bank concentration (share of the assets of the five largest banks over total
banking assets), and find that China’s concentration ratio of 91% at the end of 1997 was one of the
highest in the world. The concentration ratio has been falling sharply since 1997 with the entrance
of many non-state banks and intermediaries. Currently there are more than 30,000 banks and non-
bank financial institutions operating as legal entities in China, although the Big Four banks still
control more than half of the total banking assets.
The most significant problem for China’s banking sector had been the amount of NPLs
5 For a review of China’s financial system (banking sector, financial markets and beyond), see, for example, Allen, Qian and Qian (2008), and Allen, Qian, Zhang, and Zhao (2011). 6 All of the non-bank financial institutions can be classified into or more of the following: trust and investment companies (TICs), finance companies, financial leasing companies, rural credit cooperatives and urban credit cooperatives.
7
within state-owned banks, especially the Big Four banks. In 2000 and 2001, the total amount of
NPLs within the banking sector is about 20-23% of GDP, much higher than other large economies,
with most of the bad loans accumulated in the Big Four banks from poor lending decisions to SOEs.
Recognizing the importance of and its responsibility in reducing NPLs in the Big Four banks, the
Chinese government began to take actions to improve the banking industry’s asset quality, risk
management and capital base in the late 1990s. To reduce the level of NPLs and improve the banks’
capital adequacy, the government injected large amounts of capital into the banks. In 1998, the
Ministry of Finance issued RMB270 billion in bonds to enhance the capital adequacy of the Big
Four banks. At the end of 2003, Central Huijin Investment Company was established. The PBOC,
through Huijin, injected multiple rounds of capital (foreign currency reserves mostly in the form of
US dollars, T-bills, Euros and Yen) into these banks to improve their balance sheets. In addition,
four asset management corporations—Huarong, Great Wall, Xinda, and Oriental were established
in 1999 to assume RMB1.4 trillion worth of NPLs from the Big Four banks.
With the help of sustained economic growth, the government’s concerted effort during the
past decade has paid off, as NPLs in China have been steadily decreasing and dropped below 2% of
GDP in each of the past three years.7 All of the Big Four banks have become publicly listed and
traded companies in recent years, with the government retaining majority control. With prudent
investment approaches, these banks have not been severely affected by the 2007-2009 global
financial crisis, and are currently among the largest banks, both in terms of market capitalization
and assets, in the world, as shown in Table 1. While the stock prices of most of the large banks in
Europe and US fell on concerns in the Euro Zone in 2011, shares of ICBC and the largest bank from
Australia held up well. With the anticipation of further and potentially substantial write downs in
7 A large number of new loans were extended as a result of China’s massive economic stimulus plan in 2008-2009; a significant fraction of these loans went to local governments and were invested in infrastructure and real estate related projects. There are concerns about a new wave of NPLs resulted from these loans; see Allen, Qian, Zhang and Zhao (2011) for more details.
8
assets for the largest European banks, all the Chinese banks are expected to move up in rankings of
(book) assets in the coming months.
Following the Asian Financial Crisis in 1997, a series of reforms began in China’s banking
sector, with the central goal of improving the efficiency and competitiveness of the banking sector.
Another round of reforms began in 2002, after China joined the World Trade Organization (WTO),
which requires each member country to (eventually) liberalize its banking sector and financial
system. On the operations side, many banks broadened their loan portfolios and tapped into the
massive and uncharted territories of consumer and household products such as credit cards, auto
loans and mortgages. The more diversified loan portfolios allow banks to substantially enhance
their capacity and generate higher and steadier streams of fees and commissions. Reforming their
organizational structure and providing more incentives to individual employees within banks was
another major step toward improving efficiency. A key structural change is decentralization—so
that many tasks went from group-based processes to individual based. In corporate lending, the new
policies grant more authority to individuals in charge of different steps of making loans and
monitoring borrowers and hold them responsible for poor performance.8
The banking sector also became less concentrated with the entry of new banks and non-bank
institutions. In 2001, the total assets, deposits, and loans made of all “other commercial banks,”
where various joined ownerships are forged among investors and local governments, and foreign
banks, are about a quarter of those of the Big Four banks; in 2008, the scale of these institutions in
the same categories is more than half of the Big Four banks. Figure 1 presents the structure of
China’s banking industry structure at the end of 2005. Among the Big Four banks, ICBC remained
the largest bank in terms of both assets and deposits.
8 Qian, Strahan and Yang (2011) find that decentralization in the lending process improves the quality of an internal borrower risk measure of a large bank. Bailey, Huang and Yang (2010) show that the stock market is ‘informed’ about the lending process, and reacts negatively to firms that obtained bank loans but have poor performance and high agency costs.
9
Chinese banks are jointly regulated by the PBOC and the China Banking Regulatory
Commission (CBRC). The publicly listed banks, along with all other listed companies, are also
subjected to the supervision of China Securities Regulatory Commission (CSRC, equivalent to the
SEC in the US). The Ministry of Finance (MOF) determines tax and local accounting rules for the
banks. The PBOC limits the movements of interest rates on both deposits and loans by setting base
rates and upper and lower bounds, which vary over business cycles and with loan maturities. Within
the bounds, however, lenders can freely set interest rates and use other nonpricing tools (e.g.,
maturity, loan covenants) to control risk (e.g., Stiglitz and Weiss, 1981; Qian and Strahan, 2007).9
II.1 The Privatization Process for ICBC
Prior to the IPO, ICBC had undertaken several rounds of reforms, with the focus on
establishing efficient operations, sound corporate governance and modern risk management systems.
For example, ICBC realigned customer-oriented business activities including corporate and
personal banking and treasury operations, and centralized capital and financial management with a
better reporting platform and a comprehensive review system. In addition, ICBC went through a
series of financial restructuring activities to enhance its capital adequacy, with the key dates and
events summarized in Figure 2. The MOF injected RMB85 billion into ICBC through a special
issue of 30-year government bonds in 1998. In 1999 and 2000, NPLs in the amount of RMB408
billion were transferred to (state-owned) Huarong AMC, in exchange for RMB95 billion of cash
and non-transferable ten-year government bonds with face value of RMB313 billion. To prepare for
the IPO, in 2005 ICBC received another round of capital injection (RMB124 billion) from Huijin
and land use rights worth RMB20 billion from the central government, disposed of a total of
RMB705 billion of non-performing assets from its books, and MOF further amended the terms of
9 China liberalized lending rates on the upside after 2003; rates on deposits have not been liberalized unless the deposit, in foreign currencies, is above US$3million (RMB deposits have fixed rates regardless of the size of the deposits).
10
the special government bonds issued to it.
In April 2006, a consortium comprised of Goldman Sachs, Allianz Group (through its
subsidiary, Dresdner Bank Luxembourg S.A.), and American Express, acquired an 8.45% equity
stake in ICBC (Goldman’s stake is 5.75%) at the Latest Practicable Date (latest date for compiling
statistics prior to the IPO filing). ICBC also worked with Goldman Sachs to strengthen their
corporate governance practices, risk management and internal controls, and enhance their treasury,
asset management, corporate and investment banking operations as well as their NPL disposal
capabilities. They collaborated with Allianz to develop bank assurance products and services, and
collaborated with American Express to expand their bank card business, risk management and
customer services. Figure 3, Panel A shows ICBC’s ownership structure just before the IPO. Table
2, Panel A lists the largest shareholders and the size of their ownership stakes as of July, 2011. The
Chinese government remains the largest and controlling shareholder, while foreign institutional
investors from the US and Japan continue to hold minority stakes.
Establishment of a Board of Directors is an important part of the corporate governance
practice of publicly listed firms. The design of ICBC’s board is in accordance with the Provisional
Guidelines on Due Diligence of the Board of Directors of Joint Stock Commercial Banks in China.
There were fourteen members on the board just before the IPO: four executive directors, seven non-
executive directors, and three independent directors. Six of the seven non-executive directors were
government officials prior to joining ICBC’s board, and the other one is from Goldman Sachs. Two
independent directors are professors from Tsinghua University, one of the leading academic
institutions in China, and the other is a former investment banker from Hong Kong. Table 2, Panel
B illustrates the history of the composition of the ICBC board since its IPO in 2006. In 2010 ICBC
increased its board size to 16 and also added two more independent board members (for a total of 6).
ICBC’s board has four committees: strategy, audit, risk management, and nomination and
11
compensation; under the risk management committee, a related party transaction committee was
also established. Most listed companies in China have a supervisory board besides the Board of
Directors, similar to the two-tier boards in Germany and other continental European countries.
ICBC’s supervisory board has five members, two of whom are external. Two of the three internal
supervisors are appointed by the State Council. The two external supervisors have had prior
government experience, and one (internal) supervisor representing ICBC employees is the general
manager of the Legal Affairs Department.
On the compensation front, ICBC implements an EVA (economic value added) based
incentive scheme, such that employee pay is tied to their personal performance and the contribution
made by their respective work units. This scheme is intended to attract, retain, motivate and develop
a high quality workforce. ICBC compensates their directors, supervisors and senior management
with salaries, bonuses, enterprise annuities, social security plans, and housing subsidy plans. These
executives and directors can also participate in a share appreciation rights plan, similar to (restricted)
stocks and stock option grants in US companies. Established in preparation for the IPO, the
benchmark price of the plan is based on the market value of the stocks that are traded on the HKSE.
Finally, ICBC exerted concerted efforts to implement a series of modern risk management
systems. With the promulgation of China’s Commercial Banking Law in 1995, ICBC began to
operate on a more commercial-bank basis and started to more proactively manage their risks. Its
current risk management framework covers credit, liquidity, market and operational risks. The Risk
Management Department at the head office reported directly to the bank’s Chief Risk Officer
(CRO), a position established in July 2006. This department is primarily responsible for
coordinating the bank’s efforts in establishing their comprehensive risk management framework,
preparing consolidated reports on their credit, market and operational risks, developing
methodologies for the quantification of credit risk, developing and implementing the internal rating-
12
based project and monitoring and managing their NPLs. In addition to establishing a bank-wide risk
management framework and related systems, ICBC undertook a number of initiatives to enhance
their risk management capabilities: (1) strengthening the independence of the internal audit
functions; (2) developing enhanced risk management information systems; and (3) increasing
employees’ accountability for their own performance and compliance with the bank’s policies and
procedures. ICBC also made efforts to align their risk management and internal control capabilities
with international best practices.
II.2 The Dual IPOs of ICBC
In terms of the stock exchange where the Big Four banks are listed, the goal of the Chinese
government had been very clear from the beginning that the IPOs should be conducted at HKSE.
HKSE is one of the most developed exchanges in Asia (and in the world) and Hong Kong is an
important financial center in Asia. Upon listing, these banks would follow more stringent disclosure
requirements and governance mandates than firms listed only on the domestic exchanges and those
required by international banking accords. In addition to the traditional benefits of listing overseas
(and cross-listing), such as having access to more capital, recent research shows that there can be
additional benefits from improved corporate governance. This is because listing a (domestic) firm
on an exchange located in more developed markets is a commitment device (or ‘bonding’
mechanism) of the firm to enhance protection of minority investors and reduce the agency costs of
the controlling shareholders. As a result, many such cross-listed firms are traded at a premium over
similar firms that are only listed on domestic exchanges (e.g., Doidge, Karolyi and Stulz, 2004).
One unique aspect of ICBC’s IPO is that it planned to carry out an H-share offering in
HKSE (Hong Kong dollars) and an A-share offering in SHSE (RMB) on the same day. It was the
first ever simultaneous IPO of two types of shares (H-shares and A-shares) in two different stock
13
exchanges. Specifically, the H share offering, the primary target of the offerings, includes a Hong
Kong Public Offering and an International Offering, and the offering prices for A-shares and H-
shares would be the same after taking into account the (spot) currency conversion (RMB and HKD)
rate on the issuing day.10 The H-share underwriting syndicate included both renowned foreign and
Chinese investment banks, while the Shanghai A-share underwriting syndicate included only
Chinese investment banks. The H-share international offering underwriters solicited prospective
investors’ indications of interest in acquiring the H shares. In particular, ICBC and the investment
banking syndicate solicited qualified institutional buyers in the US (as defined in SEC Rule 144a)
and outside of the US in accord with SEC Regulation S. The targeted investors include sovereign,
institutional, corporate, and retail investors with the goal of establishing a wide and stable
shareholder base. ICBC was expected to use the net proceeds from the Global Offering to
strengthen its capital base and support the ongoing growth of its businesses.
ICBC was listed on both the HKSE and SHSE on October 27, 2006. It was the world’s
largest IPO up to that point in time valued at US$21.9 billion. ICBC raised US$14 billion in Hong
Kong (H-shares) and another US$5.1 billion in Shanghai (A-shares). Due to heavy subscriptions, all
of the Green Shoe options for over-allotment of the shares were exercised (by investment banks). At
the end of its first trading day, ICBC’s shares closed up almost 15% in Hong Kong, and its first
week return was 17%. Meanwhile, ICBC’s Shanghai-listed A-shares recorded more modest gains
on its first day (5.1%) and first week (4.8%). ICBC continued to improve its operating performance
after the IPO. During the first year post IPO, ICBC’s net profits increased about 60%, higher than
the average growth rate in profitability of 30% per year before its IPO. During the post-IPO period
of 2006-2010, while ICBC’s total assets and profits (gross and net) have been growing rapidly, NPL
ratios have been falling steadily (Table 3, Panel B).
10 See Allen, Qian and Zhao (2011) for the valuation of ICBC shares using an equity cash flow model and more details on the IPO process.
14
In fact, as shown in Panel A of Table 3, the IPOs of the largest five state-owned Chinese
banks (Big Four plus Bank of Communications) were all successful, as measured by the first day
and week returns and amount raised. All five banks are listed on HKSE, and all but the Construction
Bank (PCBC) are also listed on SHSE. In particular, the IPO of the Agricultural Bank of China, the
last of the Big Four, carried out in July 2010, amid all the uncertainties of the post-2007-2009
global crisis and ongoing Euro Zone crisis, raised over $22 billion total from HKSE and SHSE. All
of these banks attracted foreign institutional investors to hold minority stakes.
The privatization process in China’s financial intermediation sector is not limited to the Big
Four banks. In recent years, numerous large banks and non-bank financial institutions such as
insurance companies went public both on SHSE and HKSE. Table 4, Panel A lists the dates of large
banks’ (outside the Big Four) IPOs—all of these banks were listed in SHSE, and four banks were
also listed in HKSE. Panel B lists the dates of the four largest insurance companies’ IPOs—all four
companies were listed in Hong Kong and two of them were also listed in Shanghai.
III. Comparing Banks’ Performance and Risk-taking Activities
To justify our main conclusion that the ‘Chinese model’ of privatizing large financial
institutions is suitable for other emerging countries, we must demonstrate that the privatized
Chinese institutions outperform their peers from other developing countries. Therefore we compare
the performance of the largest five state-owned banks from China, including ICBC, with other large
banks from both emerging and developed markets. We also compare the performance of large state-
owned institutions versus non-state-owned institutions from a number of developed and emerging
economies, as well as the performance of institutions from emerging economies versus those from
developed countries.
Table 5 lists the names of the large banks, their headquarter countries and size (book assets
15
and market capitalization), with data on banks’ accounting and financial information as well as
stock returns (as of August, 2011) obtained from Bloomberg. Panel A lists the largest five state-
owned banks from China (Big Four and the Industrial Bank of China); Panel B shows the largest
four state-owned banks from other emerging economies—Russia, South Africa and Indonesia; all
the nine state-owned banks (in China and elsewhere) are publicly listed and traded. Panel C lists the
largest twenty-one listed banks that are non-state-owned from both developed nations (twelve banks)
as well as nine banks from emerging countries including China, Brazil and India.11 We classify a
bank to be (ultimately) state-owned if the government’s ownership stake is at least 30%.12 The
average total asset of Chinese state-banks is $1,558 billion, which is slightly larger than that of the
group of non-state banks ($1,435 billion). State-owned banks from other emerging markets are
much smaller, with average total assets of $165 billion. When we compare the performance of
banks from emerging markets with those from developed markets we also have three groups: the
five largest state-owned banks from China, the other 10 large banks (four state-owned and six non-
state-owned) from emerging markets and 15 (non-state-owned) banks from developed markets.
Banks from developed markets have the largest average total asset value of $2,187 billion, while
banks from emerging markets (excluding the five large Chinese state-owned banks) have average
total assets of $435 billion.
III.1 Comparing the Performance of Banks
Univariate Comparisons
Table 6 reports the summary statistics of operating performance of the banks in our sample
over the period 2006-2011; we choose 2006 as the first year of our sample period because ICBC 11 Our classification of emerging and developed markets follows that in Country of Domicile in Bloomberg. In particular, emerging markets include: Asia Pacific, Eastern Europe, Latin American & Caribbean and Middle East and Africa. 12 Ideally, we need to include ownership types for each year during our sample period, but Bloomberg only reports the most recent ownership type (in most cases ownership types are stable over time).
16
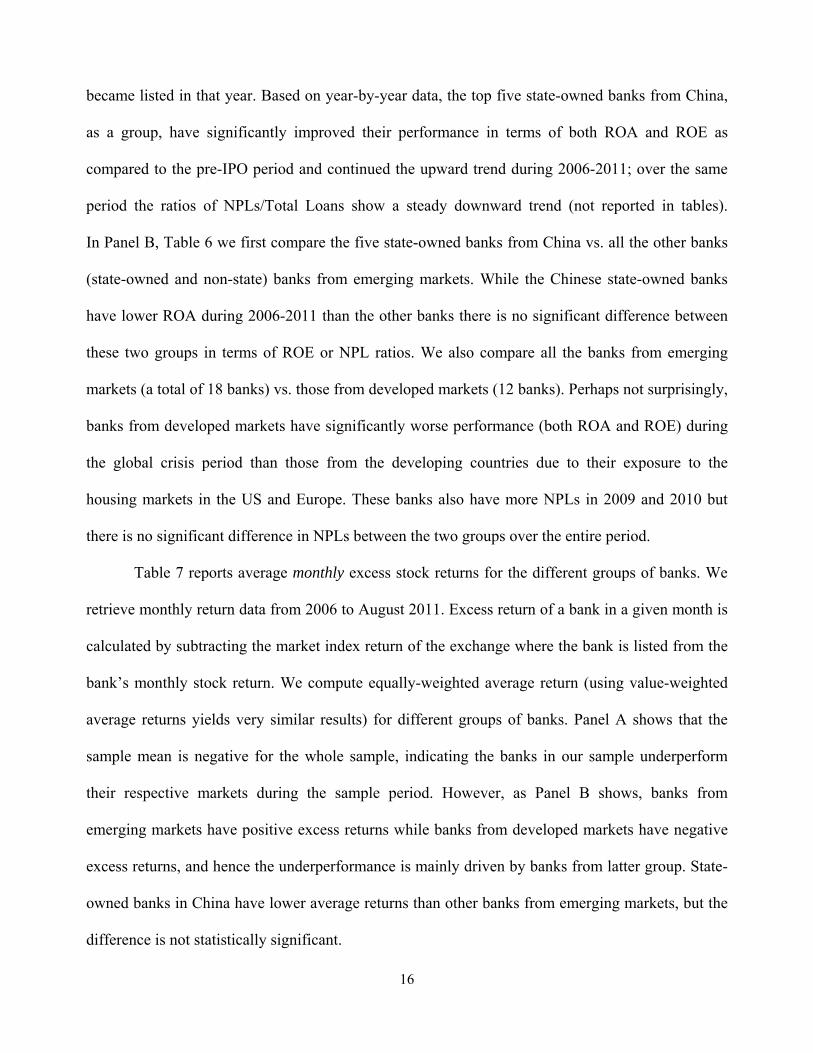
became listed in that year. Based on year-by-year data, the top five state-owned banks from China,
as a group, have significantly improved their performance in terms of both ROA and ROE as
compared to the pre-IPO period and continued the upward trend during 2006-2011; over the same
period the ratios of NPLs/Total Loans show a steady downward trend (not reported in tables).
In Panel B, Table 6 we first compare the five state-owned banks from China vs. all the other banks
(state-owned and non-state) banks from emerging markets. While the Chinese state-owned banks
have lower ROA during 2006-2011 than the other banks there is no significant difference between
these two groups in terms of ROE or NPL ratios. We also compare all the banks from emerging
markets (a total of 18 banks) vs. those from developed markets (12 banks). Perhaps not surprisingly,
banks from developed markets have significantly worse performance (both ROA and ROE) during
the global crisis period than those from the developing countries due to their exposure to the
housing markets in the US and Europe. These banks also have more NPLs in 2009 and 2010 but
there is no significant difference in NPLs between the two groups over the entire period.
Table 7 reports average monthly excess stock returns for the different groups of banks. We
retrieve monthly return data from 2006 to August 2011. Excess return of a bank in a given month is
calculated by subtracting the market index return of the exchange where the bank is listed from the
bank’s monthly stock return. We compute equally-weighted average return (using value-weighted
average returns yields very similar results) for different groups of banks. Panel A shows that the
sample mean is negative for the whole sample, indicating the banks in our sample underperform
their respective markets during the sample period. However, as Panel B shows, banks from
emerging markets have positive excess returns while banks from developed markets have negative
excess returns, and hence the underperformance is mainly driven by banks from latter group. State-
owned banks in China have lower average returns than other banks from emerging markets, but the
difference is not statistically significant.
17
Regression Results
Table 8 reports regression results on operating performance (Panels A and B), NPLs (Panel
C) and monthly excess stock returns (Panel D). Specifically, we estimate the following model:
We include an indicator to identify state-owned banks, and it takes on the value of one if a bank’s
government ownership stake equals or exceeds 30%. We also use the continuous variable—the
percentage of government ownership—in a different specification. In some models we include
characteristics of the banks (size, profitability and leverage) measured in the first year of the sample
period (2006) as controls to draw better inferences on the performance in later years. In all the
models we include country and year fixed effects to control for all the country-level factors,
constant over time, that may affect performance and to control for changing macroeconomic and
financial conditions. We cluster standard errors by countries so as to allow for possible correlations
among error terms from banks headquartered in the same country. Finally, we include the
interaction of the China indicator (takes on the value of one for all Chinese banks) and the state-
ownership indicator to single out the group of Chinese state-owned banks from other banks (the
China indicator itself is absorbed by country fixed effects). We also compare banks from developed
markets vs. those from emerging markets. Similar to the first test discussed above, we employ the
following model:
where Developed is an indicator that equals one if a bank is from developed markets, and zero
otherwise.
tii
iititi
ControlssticsCharacteriBankownedStateChina
OwnershipGovernmentownedStateturnsStockExcessorePerformancOperating
,32
1,,
*
/Re
tiititi ControlsInitialDevelopedturnStockExcessorePerformancOperating ,21,,Re
18
From Panel A, we do not observe any difference in ROA for the group of state-owned banks
and non-state banks when we do not control for initial bank conditions (Models 1 and 2). We do
find that the state-owned banks from China have higher ROAs than other banks, while other state-
owned banks from emerging markets have lower ROAs than non-state banks (Model 3). Adding the
initial bank controls strengthens the dominance of state-owned banks from China over other banks.
The coefficient in Model 6 indicates that ROA of state-owned banks in China is 0.17% higher
(.4897−.3153; significant at 1%) than that of all the non-state banks from emerging and developed
markets. On the other hand, the ROA of banks from developed markets is 1.08% lower than that of
banks from emerging markets (Model 4); this effect loses statistical significance when we add
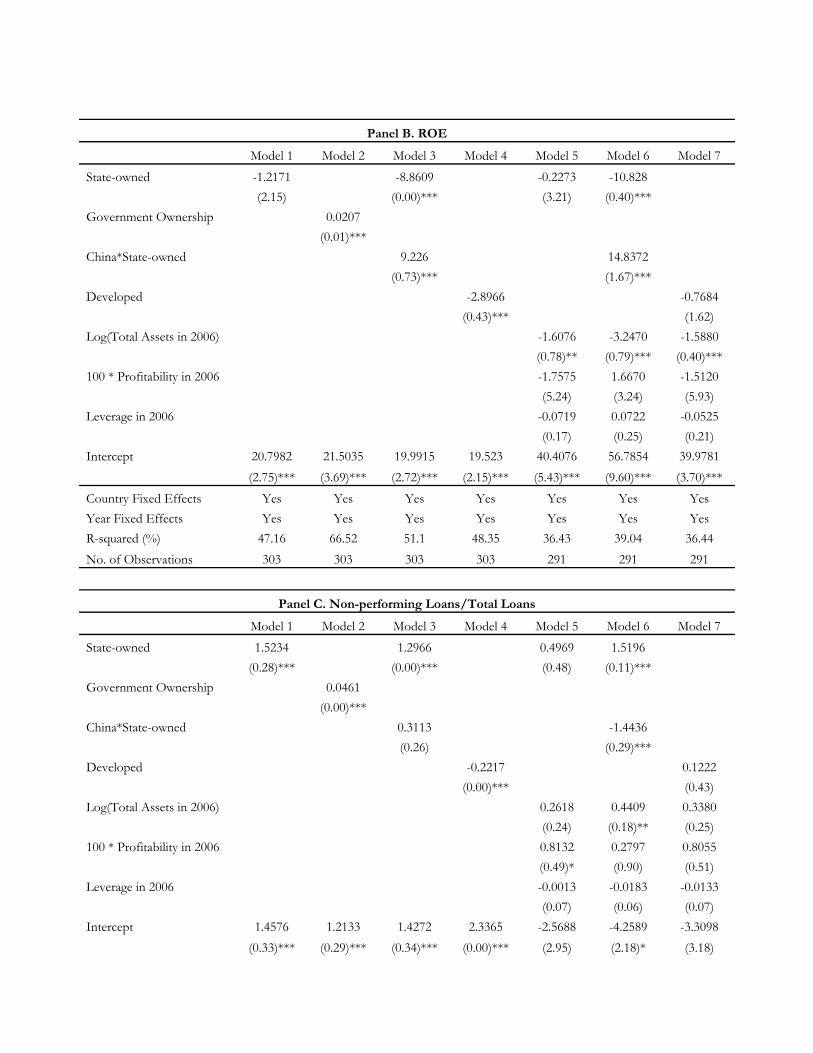
initial controls (Model 7). We obtain similar results on ROE in Panel B. In particular, the coefficient
in Model 6 indicates that ROE of state-owned banks in China is 4% higher (significant at 1%) than
that of all the non-state banks from emerging and developed markets. Given the sample mean of
14.4% and standard deviation of 11.6% (Table 6, Panel A), this effect is also economically
significant.
Panel C reports for NPLs (dependent variable is NPL/total loans). Models 1 through 3
indicate that state-owned banks, including the five state-owned banks from China, have more NPLs
than non-state banks. However, once we control for the initial conditions state-owned banks from
China actually have less NPLs than non-state banks (0.076% lower NPL ratio), while other state-
owned banks have more NPLs than non-state banks (Model 6). We also find that banks from
developed markets have higher NPLs than banks (state and non-state banks) from emerging markets;
once again, this effect loses significance after controlling for initial conditions (Model 7). Finally,
Panel D reports the results for monthly excess stock returns. After controlling for the initial
conditions, the stock returns of Chinese state-owned banks are 26.7% higher than those of the non-
state banks (Model 6, significant at 1%). On the other hand, banks from developed markets have
19
much lower returns than banks from emerging markets (marginally significant, Model 7).
III.2 Comparisons of Banks’ Risk-taking Activities
Results from Panels A through D of Table 8 above demonstrate that the largest state-owned
banks from China have performed well relative to other large banks from both emerging and
developed markets over the period 2006-2011. One caveat of these results is that they may be
driven by the fact that state-owned banks behaved ‘cautiously’ in the sense that they did not take
any risk and this strategy worked well during the period of global crisis and uncertainty. We
examine this hypothesis next. To measure risk-taking activities, we follow recent work, and in
particular, Beltratti and Stulz (2010), and Minton, Taillard and Williamson (2011) to construct two
measures: a balance sheet measure and a market-based measure.
Regulators monitor and control banks’ risk raking activities by imposing capital
requirements and restrictions on investments. A frequently used measure is the Tier-1 capital ratio,
defined to be the ratio of Tier-1 capital (a large component is equity capital) to risk-adjusted assets,
and we obtain annual data from Bloomberg. Higher Tier-1 ratios imply that a bank sets aside more
capital as reserves and lends/invests less in risky loans and projects, and therefore the bank is ‘safer’
in the sense that the additional ‘buffer’ reduces the likelihood of the bank running into financial
distress. Panel A of Table 9 shows that both the mean and median Tier 1 capital ratio for the whole
sample is above 9% for the sample period (2006-2011). From Panel B, Table 9, we can see that as a
group, the average Tier 1 capital ratio of the five largest Chinese state-owned banks is not
significantly different from that of the other banks from emerging markets (state and non-state-
owned) from emerging markets. In fact, these state-owned Chinese banks do not show any
difference in Tier-1 ratio in any year of the sample period from the non-state or state-owned banks
from emerging markets (not reported). We do find that banks from developed markets have lower
20
Tier-1 ratios than banks (state and non-state) from emerging markets over the sample period (the
difference is significant at 10% level), and these differences are the most pronounced in 2006 and
2007. These results suggest that large banks in developed countries were taking excessive risks as
compared with their counterparts in the developing world prior to the near collapse of the financial
system in 2008.
One limitation with the Tier-1 capital ratio to measure risk-taking activities is that banks
from emerging markets typically have more difficulties to raise equity capital than the banks from
the developed markets, and as a result they typically maintain lower levels of Tier-1 capital ratio
than their counterparts from developed markets. Therefore, we adopt another measure for risk-
taking that is based on stock returns. Specifically, this market-based measure is the annualized
standard deviation of daily stock returns, with a higher standard deviation interpreted as higher
degrees of risk-taking activities by the banks (perceived by market participants). From Panel B of
Table 10, we can see that state-owned banks from China still do not show any significant difference
from other banks from emerging markets using the market-based measure over the sample period,
and no difference is observed in any of the years (not reported). All the banks from emerging
markets, as a group, take less risk during the entire period of 2006-2011 than large banks from
developed markets (the difference is again significant at 10% in Panel B). In year-by-year
comparisons (not reported), banks from the developing world have much lower standard deviation
than those from the developed world in the sub-period of 2008-2011, but the reverse is true before
the global crisis (2006 and 2007).
Table 11 verifies whether univariate comparisons in Tables 9 and 10 still hold in
multivariate regressions. The regression models are similar to those in Table 8 with the dependent
variable Tier-1 capital ratio (Panel A) and annualized standard deviation of daily stock returns
(Panel B). Confirming the result in Table 9, Model 6 in Panel A shows that there is no difference in
21
Tier-1 ratio between the state-owned banks from China and other banks after controlling for banks’
initial conditions. Tier-1 ratios of banks from developed markets are 2% lower than those from
emerging markets (Model 7, significant at 1%), a stronger result than the difference in means in
Table 9. From Panel B, state ownership has no effect on the standard deviation of stock returns
(Models 1 and 2), and when initial conditions are controlled for the largest state-owned Chinese
banks actually have higher standard deviation than non-state banks (Model 6), although the
magnitude of the difference is small.
Overall, results from Tables 9-11 show that the state-owned banks from China do not
illustrate less risk-taking incentives than banks from other emerging markets, using either the
balance sheet or market-based measure. Combined with results on the operating and stock
performance, we can conclude that the superior performance of these Chinese state-owned banks is
not driven by lack of risk taking over the period of 2006-2011.
III.3 Discussion
We have described the “Chinese model” of privatizing state-owned banks—a process that
includes a series of reforms to improve the efficiency of the banks and listing them in foreign (and
domestic) stock exchanges with the government retaining the majority ownership with foreign
institutional investors holding minority stakes. We have shown that this privatization model has
been successful in improving profitability and reducing NPLs of the banks. We have also shown
that these publicly listed banks do take risks similar to non-state banks from other emerging markets
and developed markets. Based on these results, we advocate that such a model of reforming and
privatizing large financial institutions can be considered in other emerging economies.
Government ownership of banks has adverse effects—for example, inefficiencies resulted
from poor or lack of incentives and ‘tunneling’ by insiders and politically connected borrowers.
However, the Chinese experience indicates that one way these adverse effects can be substantially
22
reduced is to convert state-owned banks to publicly listed companies in domestic and/or foreign
exchanges. One of the lasting lessons from the 2007-2009 crisis is how to manage risk-taking by
(leveraged) large financial institutions. The government, as the controlling shareholder of large
financial institutions, can better impose and enforce non-profit goals such as systemic stability and
continued lending during recessions and crisis periods (even if continued lending generates some
losses in the short-run) than private entities. This assessment is more likely to hold in developing
countries, characterized by underdeveloped markets, an imperfect regulatory environment and lack
of sophisticated institutional investors who can monitor large financial institutions.
Another advantage of a government bank in environments with frequent shocks and crises is
liquidity provision by the government. In efficient markets this would be provided by the private
sector (such as Warren Buffet’s investments in Goldman Sachs and GE in 2008 and his current
investment in Bank of America). However, as we learned from the 2007-2009 crisis, markets and
private sectors failed to provide sufficient liquidity and the government (through the Federal
Reserve and Treasury Department) acted as ‘lender of last resort.’ In developing markets the role of
private investors and institutions in liquidity provision is limited, so it is perhaps more natural to
have the government-owned banks participate in liquidity provision, which could help avoid panics
in the system upon negative shocks.
Overall, there is a tradeoff in having some large, listed financial institutions ultimately
owned by the government: the cost is lost efficiency during normal periods while the benefits come
from more financial stability and reduced adverse impacts during crisis periods. In environments
with underdeveloped markets and institutions and frequent shocks and crises, we argue that
government and government-appointed officials are perhaps the only force that can reign in
excessive risk-taking of large financial institutions; as long as these banks are sufficiently
competitive as compared to privately owned banks in the country, majority government ownership
23
should not stifle risk-taking completely. Given the enormous costs of bailing out the large financial
institutions in the US and Europe during the recent crises, we believe the Chinese model should be
given much more consideration in other developing countries.
How to establish a banking sector with a mixture of state-owned and privately owned banks?
This is a legitimate question because some countries differ from China in that they do not have
many existing state-owned banks or a history of nationalizing banks. In this regard, the four state-
owned banks that we examined in our sample have very different background and paths to state
ownership. While Sberbank of Russia operates in a country that transitioned from a socialist
economy with a rich history of state-owned enterprises, Bank Negara of Indonesia was designated
as the central bank at its inception and takes on various functions of a commercial bank, similar to
the path of the Big Four banks in China. On the other hand, the Standard Bank and First Rand Bank,
both of South Africa, started out or at one time were foreign owned, but later on the foreign
investors sold off their ownership stakes to domestic investors including the state.13 In addition, as
observed during the crisis period, the governments of developed and developing countries can
obtain majority equity stakes of large banks in exchange for a capital injection, or acquire an entire
financial institution in danger of collapsing. Another question is whether there is an optimal mix of
state and private banks given their differences and relative strengths. We leave this question to
further research.
IV. Conclusions
In this paper we examine the privatization process of the Industrial and Commercial Bank of
China (ICBC) and its successful IPOs in both the Hong Kong and Shanghai Stock Exchanges. As
13 There are other state-owned banks that are not listed and thus not in our sample. One example is Banco Estado of Chile, which has been owned by the state for more than a century. In addition to being one of the largest and most successful commercial banks in Chile, the bank has contributed to nation-building through its social and national goals.
24
the largest bank in the world in terms of market capitalization, ICBC’s largest shareholder is the
Chinese government while foreign institutional investors hold minority ownership stakes and they
also enter business relationships with the bank. Listing previously state-owned financial institutions
in exchanges outside Mainland China with a similar ownership structure represents how the
government (partially) privatizes the financial intermediation sector. The largest five state-owned
and listed Chinese banks, as a group, have significantly outperformed large non-state-owned banks
from other emerging economies before and during the 2007-2009 crisis. Moreover, the superior
performance is not due to less risk-taking by these state-owned banks—in fact, we find no
difference in risk-taking activities by these banks and other non-state banks from emerging markets
using either a balance sheet or a market-based measure.
Based on our analyses, we conclude that the ‘Chinese model’ of privatizing large financial
institutions has been highly successful for China. We also advocate that similar models should be
considered in other emerging countries, because it provides a balance between effective monitoring
and maintaining the competitiveness of these institutions in the market place. With perverse
incentives, ‘too big to fail’ institutions from developed countries took on excessive risks and their
downfall triggered the most severe financial economic crisis since the Great Depression. A fierce
debate remains on how to monitor and restrain these large institutions without excessive regulations.
Appropriate monitoring of large financial institutions is of particular importance in emerging
economies since the banking sector plays a more important role in supporting economic growth
than financial markets in most countries. But this task can be a tall order in a developing world
characterized by lack of sophisticated institutional investors and underdeveloped markets and
institutions. It is under these conditions that we believe the Chinese model of managing large
institutions can be particularly valuable.
25
References
Acharya, Viral, Thomas Cooley, Matthew Richardson and Ingo Walter, 2010. Regulating Wall Street: The Dodd-Frank Act and the New Architecture of Global Finance, Wiley.
Allen, Franklin, Jun Qian, and Meijun Qian, 2005, Law, finance and economic growth in China, Journal of Financial Economics 77, 57-116.
Allen, Franklin, Jun Qian, and Meijun Qian, 2008. China’s financial system: past, present and future, Ch. 14 in China’s Great Economic Transformation, Loren Brandt and Thomas Rawski eds., Cambridge Univ. Press.
Allen, Franklin, Jun Qian, Chenying Zhang and Mengxin Zhao, 2011. China’s Financial System: Opportunities and Challenges, forthcoming in the NBER book Capitalizing China, Randall Morck and Joseph Fan eds., University of Chicago Press.
Allen, Franklin, Jun Qian, and Mengxin Zhao, 2011. The Initial Public Offering of The Industrial and Commercial Bank of China, forthcoming in The Frontier State of Economics: IEA XVI World Congress, Vol. 4, The Chinese Economy, Masahiko Aoki, editor.
Bailey, Warren, Wei Huang, and Zhishu Yang 2010, Bank loans with Chinese characteristics: Some evidence on inside debt in a state-controlled banking system, Journal of Financial and Quantitative Analysis, forthcoming.
Beltratti, Andrea and René M. Stulz, 2010, The credit crisis around the globe: Why did some banks perform better? Unpublished working Paper, Dice Center WP 2010-05, The Ohio State University.
Berger, Allen N., Iftekhar Hasan and Mingming Zhou, 2009, Bank ownership and efficiency in China: What will happen in the world’s largest nation? Journal of Banking and Finance 33, 113-130.
Bonin, John P., Iftekhar Hasan, and Paul Wachtel, 2005a, Bank performance, efficiency and ownership in transition countries, Journal of Banking and Finance 29, 31-53.
Bonin, John P., Iftekhar Hasan, and Paul Wachtel, 2005b, Privatization matters: Bank efficiency in transition countries, Journal of Banking and Finance 29, 2155-2178.
Brown, Craig O., and I. Serdar Dinc, 2005, The politics of bank failures: Evidence from emerging markets, Quarterly Journal of Economics 120, 1413-1444.
China Banking Regulation Commission (CBRC), 2005, Chinese banking sector’s reform and opening, and new progress of regulations.
Craig Doidge, G. Andrew Karolyi, and René M. Stulz, 2007, Why do countries matter so much for corporate governance? Journal of Financial Economics 86, 1-39.
Coffee, John, 1999. The future as history: the prospects for global convergence in corporate governance and its implications, Northwestern University Law Review 93, 641-708.
Coffee, John, 2002. Racing towards the top? The impact of cross-listings and stock market competition on international corporate governance, Columbia Law Review 102, 1757-1831.
26
Dinc, I. Serdar, 2005, Politicians and banks: Political influences on government-owned banks in emerging markets, Journal of Financial Economics 77, 453-479.
Dinc, I. Serdar, and Nandini Gupta, 2011. The decision to privatize: Finance and politics, Journal of Finance 66, 241-269.
Doidge, Craig, Andrew Karolyi, and René Stulz, 2004. Why are foreign firms listed in the US worth more? Journal of Financial Economics 71, 205-238.
Gupta, Nandini, 2005, Partial privatization and firm performance, Journal of Finance 60, 987-1015.
Johnson, Simon, and James Kwak, 2011. 13 Bankers: The Wall Street Takeover and the Next Financial Meltdown, Random House.
La Porta, Rafael, Florencio Lopez-De-Silanes, and Andrei Shleifer, 1999, Corporate ownership around the world, Journal of Finance 54, 471-517.
La Porta, Rafael, Florencio Lopez-De-Silanes, and Andrei Shleifer, 2002, Government ownership of banks, Journal of Finance 57, 265-301.
Laeven, Luc, and Ross Levine, 2009, Bank governance, regulation and risk raking, Journal of Financial Economics 93, 259-275.
Levine, Ross, 2002. Bank-based or market-based financial systems: which is better? Journal of Financial Intermediation 11, 1-30.
Megginson, William, and Jeffry Netter, 2001. From state to market: A survey of empirical studies on privatization, Journal of Economic Literature 39, 321-389.
Megginson, William, 2005. The economics of bank privatization, Journal of Banking and Finance 29, 1931-1980.
Minton, Bernadette A., Jerome P.A. Taillard, and Rohan Williamson, 2011. Do independence and financial expertise of the board matter for risk taking and performance? Working paper, Boston College.
Qian, Jun and Philip Strahan, 2007. How do laws and institutions shape financial Contracts? The case of bank loans, Journal of Finance 62, 2803-2834.
Qian, Jun, Philip Strahan, and Zhishu Yang, 2011. The impact of incentives and communication costs on information production: Evidence from bank lending, working paper, Boston College.
Reese, William, and Michael Weisbach, 2002. Protection of minority shareholder interests, cross-listings in the US and subsequent equity offerings, Journal of Financial Economics 66, 65-104.
Sapienza, Paola, 2004, The effects of government ownership in bank lending, Journal of Financial Economics 72, 357-384.
Shleifer, Andrei, and Robert W. Vishny, 1986, Large shareholders and corporate control, Journal of Political Economy 94, 461-488.
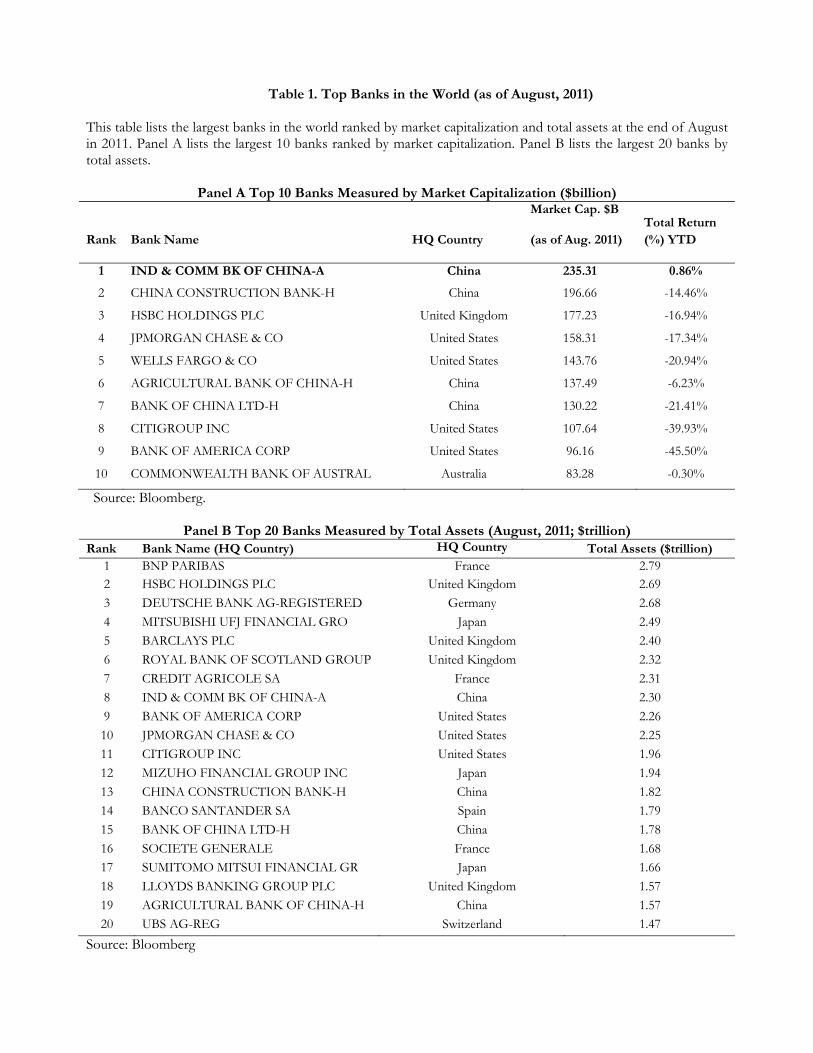
Table 1. Top Banks in the World (as of August, 2011)
This table lists the largest banks in the world ranked by market capitalization and total assets at the end of August in 2011. Panel A lists the largest 10 banks ranked by market capitalization. Panel B lists the largest 20 banks by total assets.
Panel A Top 10 Banks Measured by Market Capitalization ($billion)
Rank Bank Name HQ Country
Market Cap. $B
(as of Aug. 2011) Total Return (%) YTD
1 IND & COMM BK OF CHINA-A China 235.31 0.86%
2 CHINA CONSTRUCTION BANK-H China 196.66 -14.46%
3 HSBC HOLDINGS PLC United Kingdom 177.23 -16.94%
4 JPMORGAN CHASE & CO United States 158.31 -17.34%
5 WELLS FARGO & CO United States 143.76 -20.94%
6 AGRICULTURAL BANK OF CHINA-H China 137.49 -6.23%
7 BANK OF CHINA LTD-H China 130.22 -21.41%
8 CITIGROUP INC United States 107.64 -39.93%
9 BANK OF AMERICA CORP United States 96.16 -45.50%
10 COMMONWEALTH BANK OF AUSTRAL Australia 83.28 -0.30%
Source: Bloomberg.
Panel B Top 20 Banks Measured by Total Assets (August, 2011; $trillion) Rank Bank Name (HQ Country) HQ Country Total Assets ($trillion)
1 BNP PARIBAS France 2.792 HSBC HOLDINGS PLC United Kingdom 2.69
3 DEUTSCHE BANK AG-REGISTERED Germany 2.68
4 MITSUBISHI UFJ FINANCIAL GRO Japan 2.49
5 BARCLAYS PLC United Kingdom 2.40
6 ROYAL BANK OF SCOTLAND GROUP United Kingdom 2.32
7 CREDIT AGRICOLE SA France 2.31
8 IND & COMM BK OF CHINA-A China 2.30
9 BANK OF AMERICA CORP United States 2.26
10 JPMORGAN CHASE & CO United States 2.25
11 CITIGROUP INC United States 1.96
12 MIZUHO FINANCIAL GROUP INC Japan 1.94
13 CHINA CONSTRUCTION BANK-H China 1.82
14 BANCO SANTANDER SA Spain 1.79
15 BANK OF CHINA LTD-H China 1.78
16 SOCIETE GENERALE France 1.68
17 SUMITOMO MITSUI FINANCIAL GR Japan 1.66
18 LLOYDS BANKING GROUP PLC United Kingdom 1.57
19 AGRICULTURAL BANK OF CHINA-H China 1.57
20 UBS AG-REG Switzerland 1.47
Source: Bloomberg
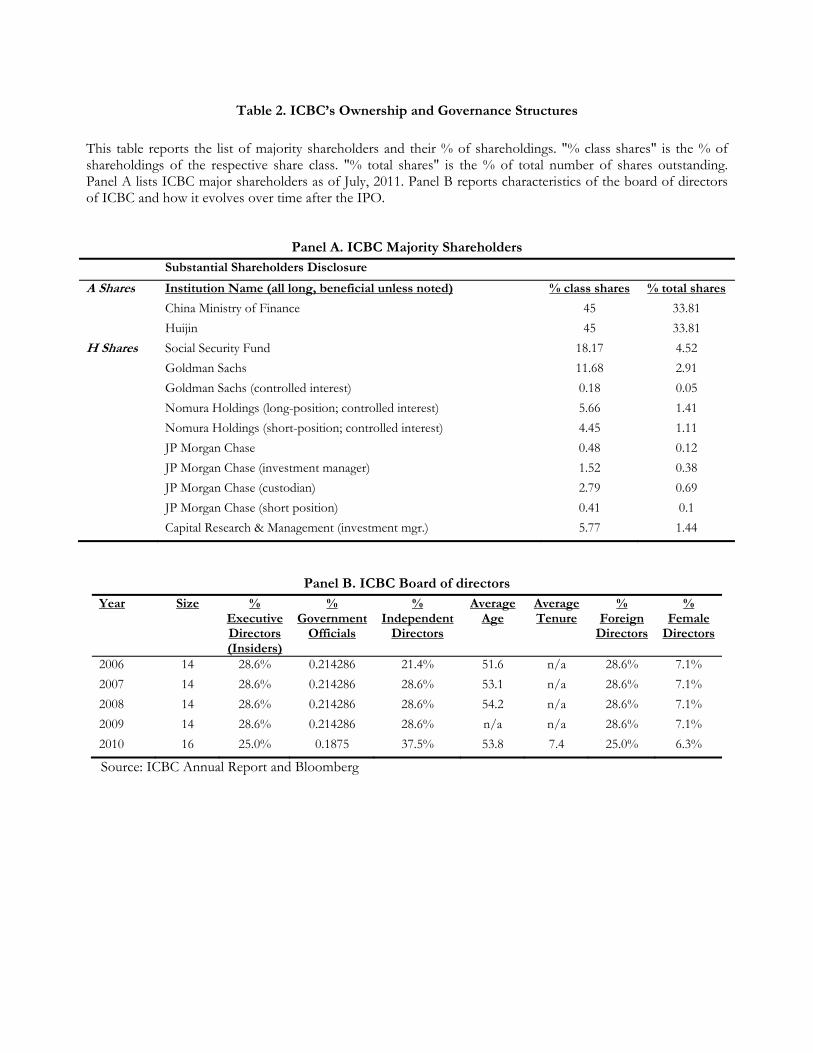
Table 2. ICBC’s Ownership and Governance Structures
This table reports the list of majority shareholders and their % of shareholdings. "% class shares" is the % of shareholdings of the respective share class. "% total shares" is the % of total number of shares outstanding. Panel A lists ICBC major shareholders as of July, 2011. Panel B reports characteristics of the board of directors of ICBC and how it evolves over time after the IPO.
Panel A. ICBC Majority Shareholders Substantial Shareholders Disclosure
A Shares Institution Name (all long, beneficial unless noted) % class shares % total shares
China Ministry of Finance 45 33.81
Huijin 45 33.81
H Shares Social Security Fund 18.17 4.52
Goldman Sachs 11.68 2.91
Goldman Sachs (controlled interest) 0.18 0.05
Nomura Holdings (long-position; controlled interest) 5.66 1.41
Nomura Holdings (short-position; controlled interest) 4.45 1.11
JP Morgan Chase 0.48 0.12
JP Morgan Chase (investment manager) 1.52 0.38
JP Morgan Chase (custodian) 2.79 0.69
JP Morgan Chase (short position) 0.41 0.1
Capital Research & Management (investment mgr.) 5.77 1.44
Panel B. ICBC Board of directors Year Size %
Executive Directors (Insiders)
% Government
Officials
% Independent
Directors
Average Age
Average Tenure
% Foreign
Directors
% Female
Directors
2006 14 28.6% 0.214286 21.4% 51.6 n/a 28.6% 7.1%
2007 14 28.6% 0.214286 28.6% 53.1 n/a 28.6% 7.1%
2008 14 28.6% 0.214286 28.6% 54.2 n/a 28.6% 7.1%
2009 14 28.6% 0.214286 28.6% n/a n/a 28.6% 7.1%
2010 16 25.0% 0.1875 37.5% 53.8 7.4 25.0% 6.3%
Source: ICBC Annual Report and Bloomberg

Table 3. IPOs of State-owned Banks in China
This table presents information on the IPOs of three of the Big Four banks and that of Bank of Communications (BComm). BOC, ICBC and ABC were listed in both the HKSE (HK dollar) and SHSE (RMB), while PCBC and BComm only listed shares on the HKSE. First day (first week) return is percentage return of closing price of first day (fifth trading day) over offer price. Foreign ownership indicates size of ownership stakes of foreign institutions and investors at the date of IPOs.
Panel A Performance of Chinese Banks’ IPOs ICBC BOC PCBC BComm ABC*
HKSE SHSE HKSE SHSE HKSE HKSE HKSE SHSE
(HK$) (RMB) (HK$) (RMB) (HK$) (HK$) (HK$) (RMB)
IPO Date 10/27/06 10/27/06 6/1/06 7/5/06 10/27/06 6/23/05 7/15/10 7/16/10
Offer Price 3.07 3.12 2.95 3.08 2.35 2.5 3.2 2.68
Proceeds 124.95B 46.64B 82.86B 20.00B 59.94B 14.64B 93.8B 68.5B
1st Day Return 14.66% 5.13% 14.41% 22.73% 0.00% 13.00% 2.20% 1% 1st Week Return 16.94% 4.81% 19.49% 19.16% -1.06% 13.00% 9.10% 1.90%
Foreign Ownership 7.28% -- 14.40% -- 14.39% 18.33% 40.80% --
Source: IPO prospectuses submitted to SHSE and HKSE; SHSE and HKSE. *: In USD, ABC raised $22.1 billion from its IPO, beating the record of $21.9 billion from ICBC’s IPO. However in terms of RMB, ICBC still holds the record of largest IPO since the RMB has appreciated significantly since 2006.
Panel B. ICBC Operating performance post IPO Year Total Assets Total Profit Net Profit ROA ROE NPL/Loans NPL/Assets
2006 7,509,118 71,521 49,336 0.66% 10.47% 5.47% 1.75%
2007 8,684,288 115,114 81,990 0.94% 15.06% 2.57% 1.29%
2008 9,757,654 145,301 111,151 1.14% 18.31% 2.13% 1.07%
2009 11,785,053 167,248 129,350 1.10% 19.05% 1.39% 0.75%
2010 13,417,887 166,324 127,795 0.95% 16.83% 1.00% 0.54%
Source: ICBC Annual Reports
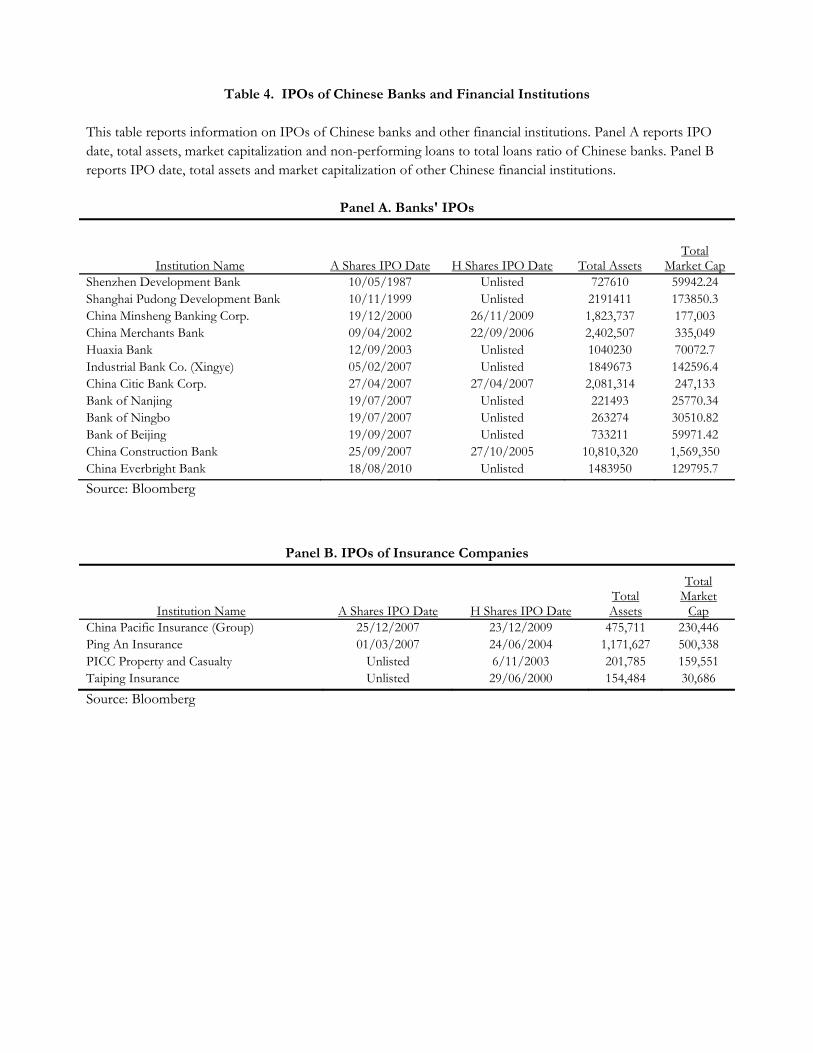
Table 4. IPOs of Chinese Banks and Financial Institutions This table reports information on IPOs of Chinese banks and other financial institutions. Panel A reports IPO date, total assets, market capitalization and non-performing loans to total loans ratio of Chinese banks. Panel B reports IPO date, total assets and market capitalization of other Chinese financial institutions.
Panel A. Banks' IPOs
Institution Name A Shares IPO Date H Shares IPO Date Total Assets Total
Market Cap Shenzhen Development Bank 10/05/1987 Unlisted 727610 59942.24Shanghai Pudong Development Bank 10/11/1999 Unlisted 2191411 173850.3China Minsheng Banking Corp. 19/12/2000 26/11/2009 1,823,737 177,003China Merchants Bank 09/04/2002 22/09/2006 2,402,507 335,049Huaxia Bank 12/09/2003 Unlisted 1040230 70072.7Industrial Bank Co. (Xingye) 05/02/2007 Unlisted 1849673 142596.4China Citic Bank Corp. 27/04/2007 27/04/2007 2,081,314 247,133Bank of Nanjing 19/07/2007 Unlisted 221493 25770.34Bank of Ningbo 19/07/2007 Unlisted 263274 30510.82Bank of Beijing 19/09/2007 Unlisted 733211 59971.42China Construction Bank 25/09/2007 27/10/2005 10,810,320 1,569,350China Everbright Bank 18/08/2010 Unlisted 1483950 129795.7
Source: Bloomberg
Panel B. IPOs of Insurance Companies
Institution Name A Shares IPO Date H Shares IPO Date Total Assets
Total Market
Cap China Pacific Insurance (Group) 25/12/2007 23/12/2009 475,711 230,446Ping An Insurance 01/03/2007 24/06/2004 1,171,627 500,338PICC Property and Casualty Unlisted 6/11/2003 201,785 159,551Taiping Insurance Unlisted 29/06/2000 154,484 30,686
Source: Bloomberg
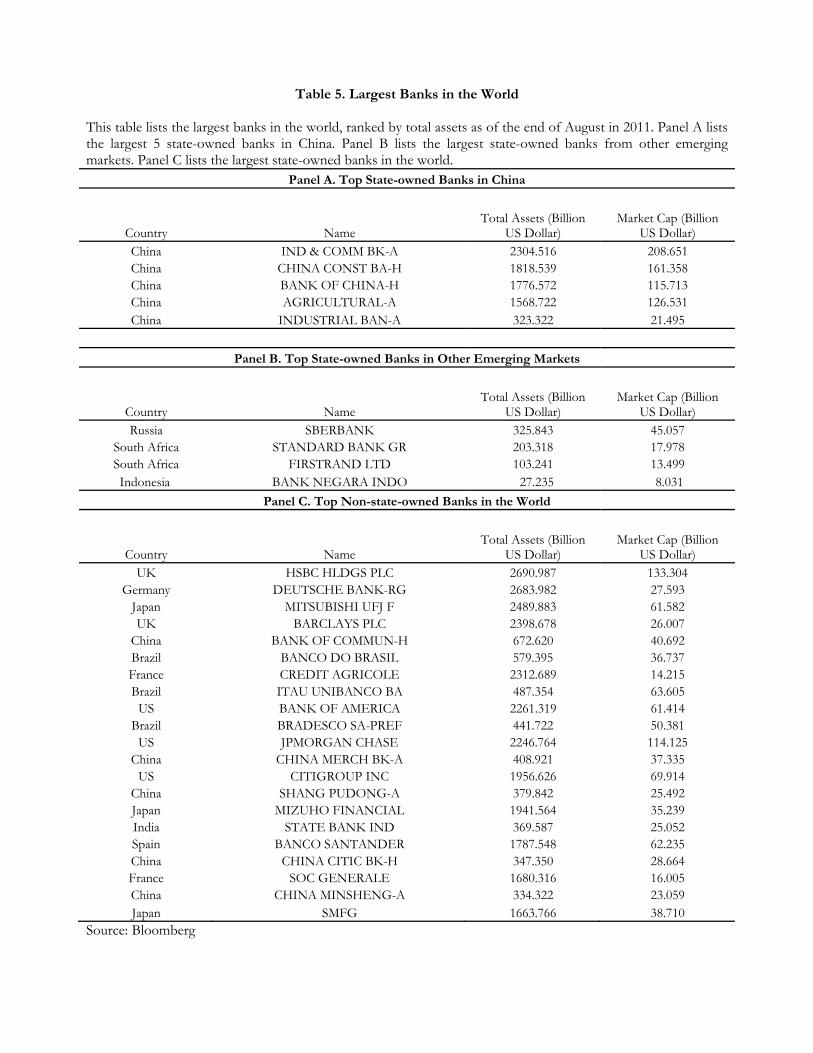
Table 5. Largest Banks in the World
This table lists the largest banks in the world, ranked by total assets as of the end of August in 2011. Panel A lists the largest 5 state-owned banks in China. Panel B lists the largest state-owned banks from other emerging markets. Panel C lists the largest state-owned banks in the world.
Panel A. Top State-owned Banks in China
Country Name Total Assets (Billion
US Dollar) Market Cap (Billion
US Dollar) China IND & COMM BK-A 2304.516 208.651 China CHINA CONST BA-H 1818.539 161.358 China BANK OF CHINA-H 1776.572 115.713 China AGRICULTURAL-A 1568.722 126.531 China INDUSTRIAL BAN-A 323.322 21.495
Panel B. Top State-owned Banks in Other Emerging Markets
Country Name Total Assets (Billion
US Dollar) Market Cap (Billion
US Dollar) Russia SBERBANK 325.843 45.057
South Africa STANDARD BANK GR 203.318 17.978 South Africa FIRSTRAND LTD 103.241 13.499
Indonesia BANK NEGARA INDO 27.235 8.031
Panel C. Top Non-state-owned Banks in the World
Country Name Total Assets (Billion
US Dollar) Market Cap (Billion
US Dollar) UK HSBC HLDGS PLC 2690.987 133.304
Germany DEUTSCHE BANK-RG 2683.982 27.593 Japan MITSUBISHI UFJ F 2489.883 61.582 UK BARCLAYS PLC 2398.678 26.007
China BANK OF COMMUN-H 672.620 40.692 Brazil BANCO DO BRASIL 579.395 36.737 France CREDIT AGRICOLE 2312.689 14.215 Brazil ITAU UNIBANCO BA 487.354 63.605
US BANK OF AMERICA 2261.319 61.414 Brazil BRADESCO SA-PREF 441.722 50.381
US JPMORGAN CHASE 2246.764 114.125 China CHINA MERCH BK-A 408.921 37.335
US CITIGROUP INC 1956.626 69.914 China SHANG PUDONG-A 379.842 25.492 Japan MIZUHO FINANCIAL 1941.564 35.239 India STATE BANK IND 369.587 25.052 Spain BANCO SANTANDER 1787.548 62.235 China CHINA CITIC BK-H 347.350 28.664 France SOC GENERALE 1680.316 16.005 China CHINA MINSHENG-A 334.322 23.059 Japan SMFG 1663.766 38.710
Source: Bloomberg

Table 6. Summary Statistics of Operating Performance for Top Banks
This table reports comparison of operating performance of top banks in the world from 2006 to the first half of 2011. Banks are ranked by total assets at the end of August, 2011. Banks with government ownership not less than 30 percent are named as state-owned banks. Panel A reports summary statistics of operating performance of all top 30 banks (15 from emerging markets and 15 from developed markets). Panel B compares operating performance of the top 5 state-owned banks from China and that of other banks from emerging markets. Panel B also compares operating performance of top banks from emerging markets and that of banks from developed banks. All values are in terms of percentage. ***, **, * represent 1%, 5% and 10% significance levels, respectively. See Table 5 for the list of banks.
Panel A. Summary Statistics of Operating Performance of Top Banks in the World
Mean Median StDev N
ROA (%) 0.802 0.814 0.706 180
ROE (%) 14.421 16.250 11.618 180
Non-Performing Loans/Total Loans (%) 2.453 1.985 2.538 180
Panel B. Comparison of Operating Performance
State-owned Banks from China Other Banks from Emerging Markets
Mean Median StDev N Mean Median StDev N Difference
ROA (%) 1.074 1.108 0.174 30 1.380 1.125 0.680 60 -0.306***
ROE (%) 19.682 20.155 4.513 30 21.163 20.197 6.785 60 -1.481
Non-Performing Loans/Total Loans (%) 2.868 2.131 4.528 30 1.950 1.563 1.555 60 0.918
All Banks from Emerging Markets All Banks from Developed Markets
Mean Median StDev N Mean Median StDev N Difference
ROA (%) 1.288 1.125 0.592 90 0.348 0.360 0.459 90 0.940***
ROE (%) 20.731 20.176 6.215 90 8.597 10.651 12.409 90 12.133***
Non-Performing Loans/Total Loans (%) 2.308 1.639 3.073 90 2.604 2.289 1.844 90 -0.296 Source: Bloomberg
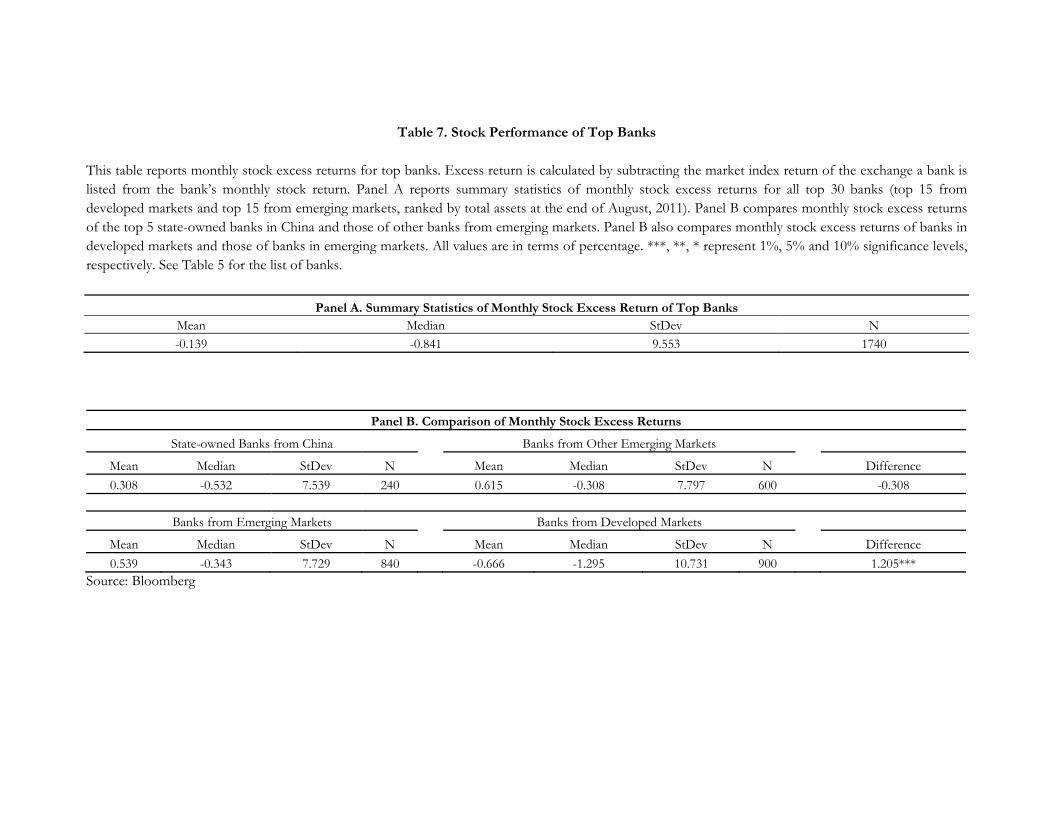
Table 7. Stock Performance of Top Banks
This table reports monthly stock excess returns for top banks. Excess return is calculated by subtracting the market index return of the exchange a bank is listed from the bank’s monthly stock return. Panel A reports summary statistics of monthly stock excess returns for all top 30 banks (top 15 from developed markets and top 15 from emerging markets, ranked by total assets at the end of August, 2011). Panel B compares monthly stock excess returns of the top 5 state-owned banks in China and those of other banks from emerging markets. Panel B also compares monthly stock excess returns of banks in developed markets and those of banks in emerging markets. All values are in terms of percentage. ***, **, * represent 1%, 5% and 10% significance levels, respectively. See Table 5 for the list of banks.
Panel A. Summary Statistics of Monthly Stock Excess Return of Top Banks Mean Median StDev N -0.139 -0.841 9.553 1740
Panel B. Comparison of Monthly Stock Excess Returns
State-owned Banks from China Banks from Other Emerging Markets
Mean Median StDev N Mean Median StDev N Difference
0.308 -0.532 7.539 240 0.615 -0.308 7.797 600 -0.308
Banks from Emerging Markets Banks from Developed Markets
Mean Median StDev N Mean Median StDev N Difference
0.539 -0.343 7.729 840 -0.666 -1.295 10.731 900 1.205*** Source: Bloomberg
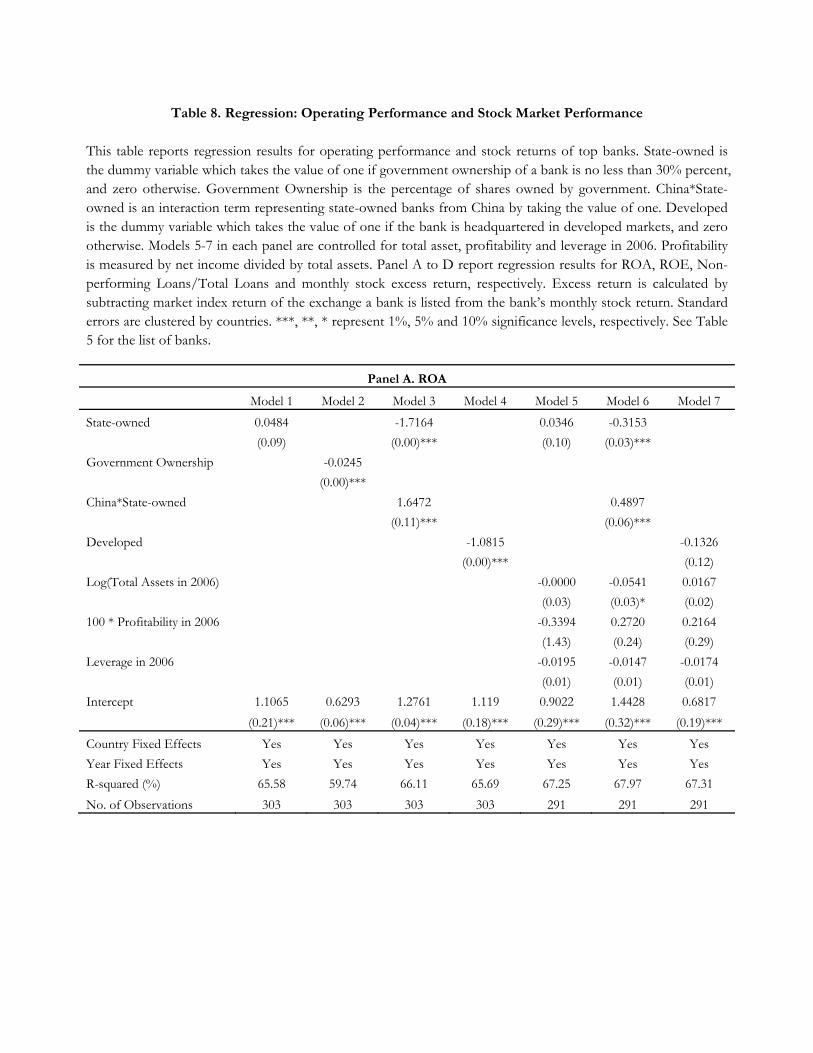
Table 8. Regression: Operating Performance and Stock Market Performance
This table reports regression results for operating performance and stock returns of top banks. State-owned is the dummy variable which takes the value of one if government ownership of a bank is no less than 30% percent, and zero otherwise. Government Ownership is the percentage of shares owned by government. China*State-owned is an interaction term representing state-owned banks from China by taking the value of one. Developed is the dummy variable which takes the value of one if the bank is headquartered in developed markets, and zero otherwise. Models 5-7 in each panel are controlled for total asset, profitability and leverage in 2006. Profitability is measured by net income divided by total assets. Panel A to D report regression results for ROA, ROE, Non-performing Loans/Total Loans and monthly stock excess return, respectively. Excess return is calculated by subtracting market index return of the exchange a bank is listed from the bank’s monthly stock return. Standard errors are clustered by countries. ***, **, * represent 1%, 5% and 10% significance levels, respectively. See Table 5 for the list of banks.
Panel A. ROA
Model 1 Model 2 Model 3 Model 4 Model 5 Model 6 Model 7
State-owned 0.0484 -1.7164 0.0346 -0.3153
(0.09) (0.00)*** (0.10) (0.03)***
Government Ownership -0.0245
(0.00)***
China*State-owned 1.6472 0.4897
(0.11)*** (0.06)***
Developed -1.0815 -0.1326
(0.00)*** (0.12)
Log(Total Assets in 2006) -0.0000 -0.0541 0.0167
(0.03) (0.03)* (0.02)
100 * Profitability in 2006 -0.3394 0.2720 0.2164
(1.43) (0.24) (0.29)
Leverage in 2006 -0.0195 -0.0147 -0.0174
(0.01) (0.01) (0.01)
Intercept 1.1065 0.6293 1.2761 1.119 0.9022 1.4428 0.6817
(0.21)*** (0.06)*** (0.04)*** (0.18)*** (0.29)*** (0.32)*** (0.19)***
Country Fixed Effects Yes Yes Yes Yes Yes Yes Yes
Year Fixed Effects Yes Yes Yes Yes Yes Yes Yes
R-squared (%) 65.58 59.74 66.11 65.69 67.25 67.97 67.31
No. of Observations 303 303 303 303 291 291 291
Panel B. ROE
Model 1 Model 2 Model 3 Model 4 Model 5 Model 6 Model 7
State-owned -1.2171 -8.8609 -0.2273 -10.828
(2.15) (0.00)*** (3.21) (0.40)***
Government Ownership 0.0207
(0.01)***
China*State-owned 9.226 14.8372
(0.73)*** (1.67)***
Developed -2.8966 -0.7684
(0.43)*** (1.62)
Log(Total Assets in 2006) -1.6076 -3.2470 -1.5880
(0.78)** (0.79)*** (0.40)***
100 * Profitability in 2006 -1.7575 1.6670 -1.5120
(5.24) (3.24) (5.93)
Leverage in 2006 -0.0719 0.0722 -0.0525
(0.17) (0.25) (0.21)
Intercept 20.7982 21.5035 19.9915 19.523 40.4076 56.7854 39.9781
(2.75)*** (3.69)*** (2.72)*** (2.15)*** (5.43)*** (9.60)*** (3.70)***
Country Fixed Effects Yes Yes Yes Yes Yes Yes Yes
Year Fixed Effects Yes Yes Yes Yes Yes Yes Yes
R-squared (%) 47.16 66.52 51.1 48.35 36.43 39.04 36.44
No. of Observations 303 303 303 303 291 291 291
Panel C. Non-performing Loans/Total Loans
Model 1 Model 2 Model 3 Model 4 Model 5 Model 6 Model 7
State-owned 1.5234 1.2966 0.4969 1.5196
(0.28)*** (0.00)*** (0.48) (0.11)***
Government Ownership 0.0461
(0.00)***
China*State-owned 0.3113 -1.4436
(0.26) (0.29)***
Developed -0.2217 0.1222
(0.00)*** (0.43)
Log(Total Assets in 2006) 0.2618 0.4409 0.3380
(0.24) (0.18)** (0.25)
100 * Profitability in 2006 0.8132 0.2797 0.8055
(0.49)* (0.90) (0.51)
Leverage in 2006 -0.0013 -0.0183 -0.0133
(0.07) (0.06) (0.07)
Intercept 1.4576 1.2133 1.4272 2.3365 -2.5688 -4.2589 -3.3098
(0.33)*** (0.29)*** (0.34)*** (0.00)*** (2.95) (2.18)* (3.18)

Country Fixed Effects Yes Yes Yes Yes Yes Yes Yes
Year Fixed Effects Yes Yes Yes Yes Yes Yes Yes
R-squared (%) 16.56 30.91 16.59 11.35 41.69 43.97 52.66
No. of Observations 225 225 225 225 217 217 217
Panel D. Monthly Stock Excess Return
Model 1 Model 2 Model 3 Model 4 Model 5 Model 6 Model 7
State-owned -0.4790 -1.7164 -0.5124 -1.8865
(0.43) (0.00)*** (0.47) (0.20)***
Government Ownership -0.0245
(0.00)***
China*State-owned 1.6472 2.1539
(0.11)*** (0.43)***
Developed -1.0815 -0.6028
(0.00)*** (0.33)*
Log(Total Assets in 2006) 0.1157 -0.2067 0.0223
(0.19) (0.20) (0.13)
100 * Profitability in 2006 -0.3394 0.5972 0.2884
(1.43) (1.35) (1.55)
Leverage in 2006 -0.0430 -0.0075 -0.0101
(0.03) (0.03) (0.03)
Intercept 0.3398 0.3231 0.1773 0.7888 -0.7819 2.3437 -0.1476
(0.59) -0.42 -0.46 -0.51 (1.66) (1.88) (0.58)
Year fixed Effects Yes Yes Yes Yes Yes Yes Yes
Country Fixed Effects Yes Yes Yes Yes Yes Yes Yes
R-squared (%) 1.5 1.51 1.56 1.41 1.57 1.64 1.47
No. of Observations 3760 3760 3894 3760 3557 3557 3691 Source: Bloomberg
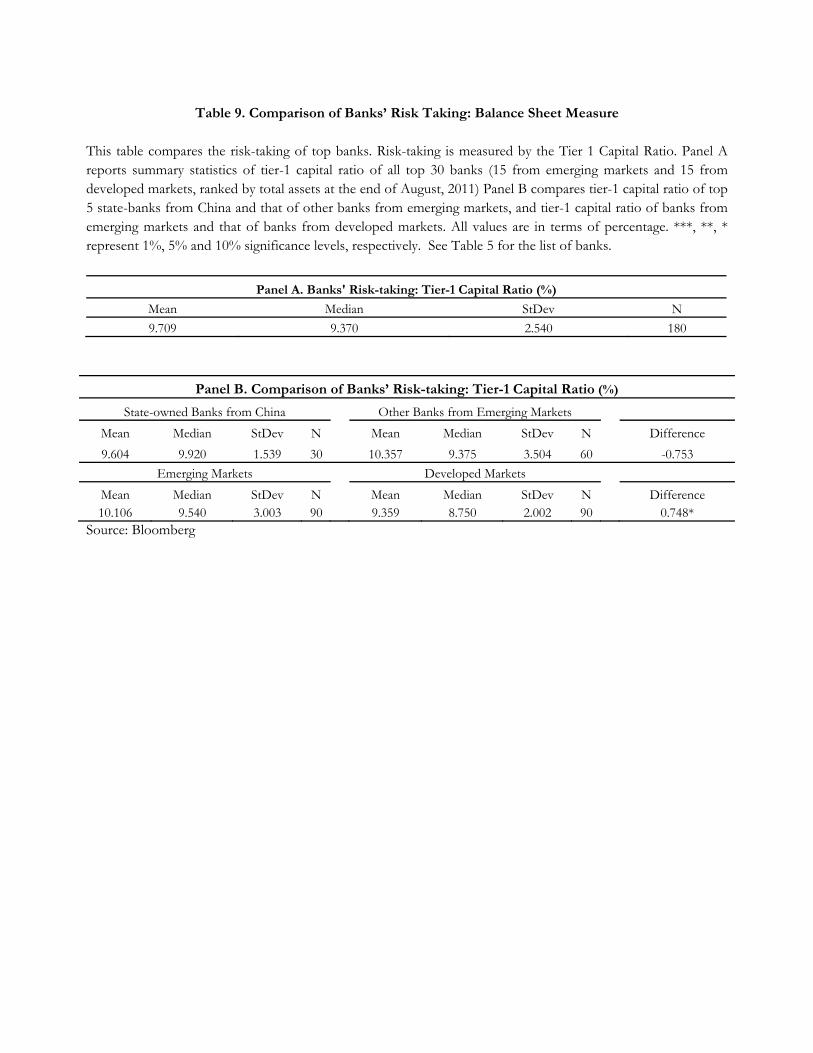
Table 9. Comparison of Banks’ Risk Taking: Balance Sheet Measure
This table compares the risk-taking of top banks. Risk-taking is measured by the Tier 1 Capital Ratio. Panel A reports summary statistics of tier-1 capital ratio of all top 30 banks (15 from emerging markets and 15 from developed markets, ranked by total assets at the end of August, 2011) Panel B compares tier-1 capital ratio of top 5 state-banks from China and that of other banks from emerging markets, and tier-1 capital ratio of banks from emerging markets and that of banks from developed markets. All values are in terms of percentage. ***, **, * represent 1%, 5% and 10% significance levels, respectively. See Table 5 for the list of banks.
Panel A. Banks' Risk-taking: Tier-1 Capital Ratio (%)
Mean Median StDev N
9.709 9.370 2.540 180
Panel B. Comparison of Banks’ Risk-taking: Tier-1 Capital Ratio (%)
State-owned Banks from China Other Banks from Emerging Markets
Mean Median StDev N Mean Median StDev N Difference
9.604 9.920 1.539 30 10.357 9.375 3.504 60 -0.753
Emerging Markets Developed Markets
Mean Median StDev N Mean Median StDev N Difference 10.106 9.540 3.003 90 9.359 8.750 2.002 90 0.748*
Source: Bloomberg
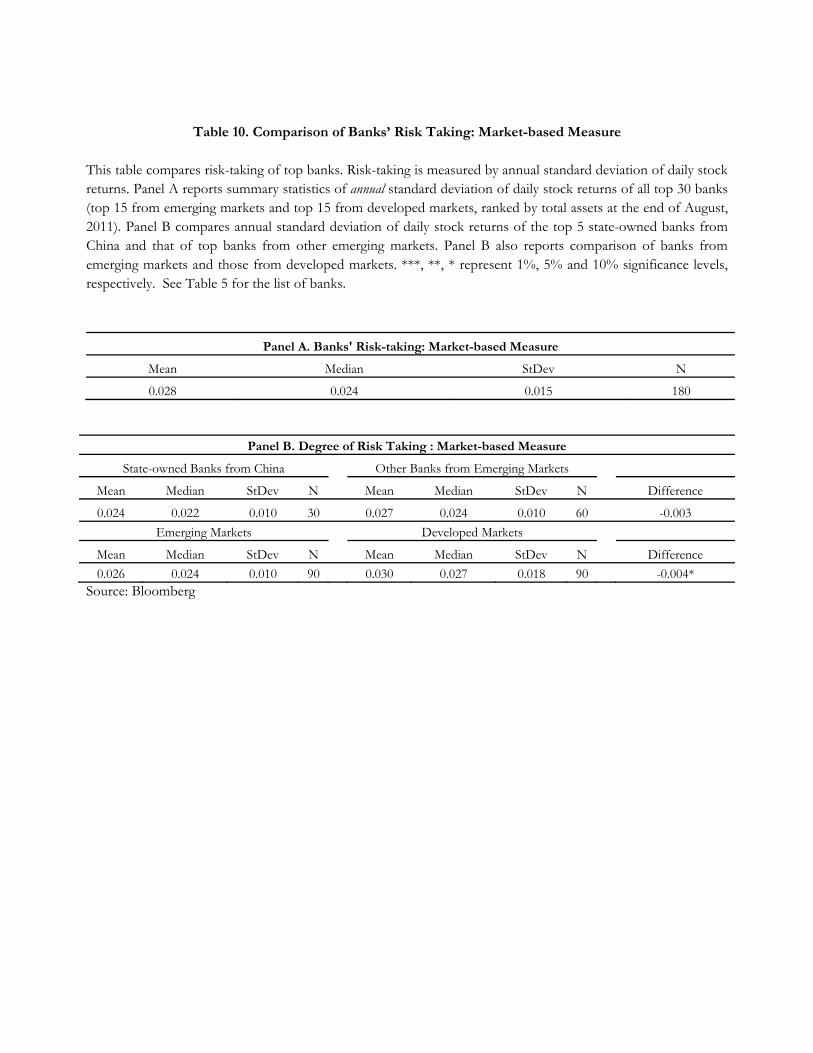
Table 10. Comparison of Banks’ Risk Taking: Market-based Measure
This table compares risk-taking of top banks. Risk-taking is measured by annual standard deviation of daily stock returns. Panel A reports summary statistics of annual standard deviation of daily stock returns of all top 30 banks (top 15 from emerging markets and top 15 from developed markets, ranked by total assets at the end of August, 2011). Panel B compares annual standard deviation of daily stock returns of the top 5 state-owned banks from China and that of top banks from other emerging markets. Panel B also reports comparison of banks from emerging markets and those from developed markets. ***, **, * represent 1%, 5% and 10% significance levels, respectively. See Table 5 for the list of banks.
Panel A. Banks' Risk-taking: Market-based Measure
Mean Median StDev N
0.028 0.024 0.015 180
Panel B. Degree of Risk Taking : Market-based Measure
State-owned Banks from China Other Banks from Emerging Markets
Mean Median StDev N Mean Median StDev N Difference
0.024 0.022 0.010 30 0.027 0.024 0.010 60 -0.003
Emerging Markets Developed Markets
Mean Median StDev N Mean Median StDev N Difference
0.026 0.024 0.010 90 0.030 0.027 0.018 90 -0.004* Source: Bloomberg
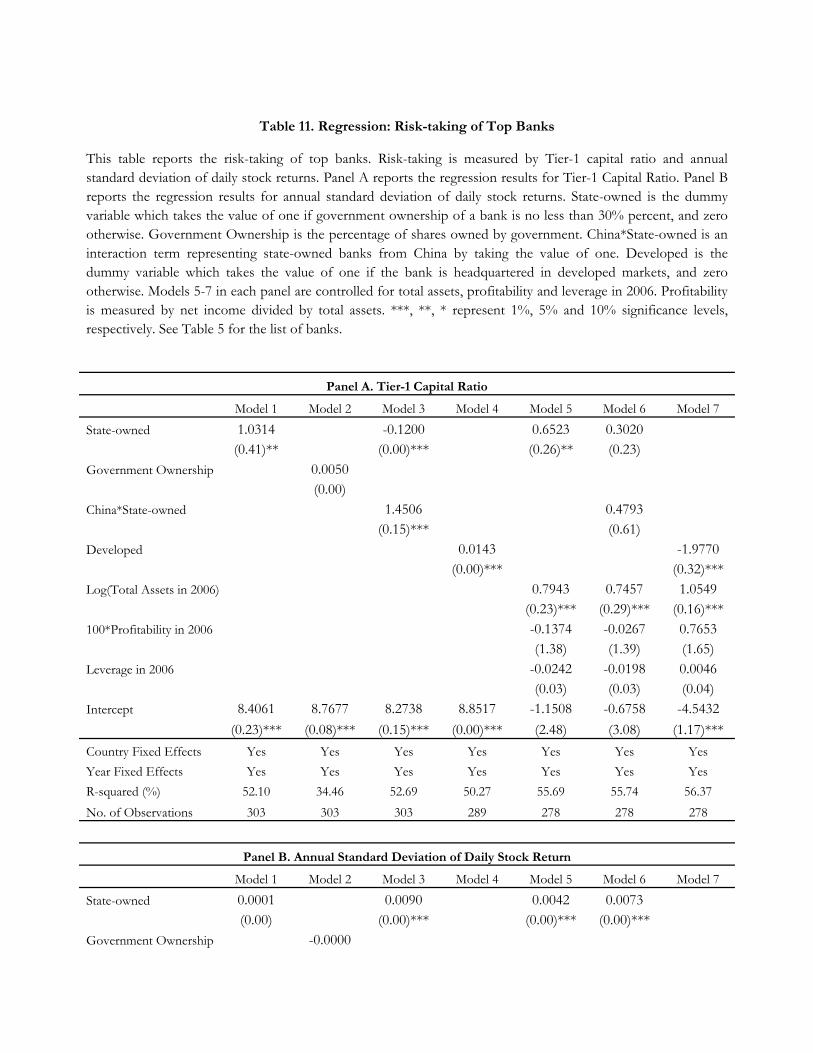
Table 11. Regression: Risk-taking of Top Banks
This table reports the risk-taking of top banks. Risk-taking is measured by Tier-1 capital ratio and annual standard deviation of daily stock returns. Panel A reports the regression results for Tier-1 Capital Ratio. Panel B reports the regression results for annual standard deviation of daily stock returns. State-owned is the dummy variable which takes the value of one if government ownership of a bank is no less than 30% percent, and zero otherwise. Government Ownership is the percentage of shares owned by government. China*State-owned is an interaction term representing state-owned banks from China by taking the value of one. Developed is the dummy variable which takes the value of one if the bank is headquartered in developed markets, and zero otherwise. Models 5-7 in each panel are controlled for total assets, profitability and leverage in 2006. Profitability is measured by net income divided by total assets. ***, **, * represent 1%, 5% and 10% significance levels, respectively. See Table 5 for the list of banks.
Panel A. Tier-1 Capital Ratio
Model 1 Model 2 Model 3 Model 4 Model 5 Model 6 Model 7
State-owned 1.0314 -0.1200 0.6523 0.3020 (0.41)** (0.00)*** (0.26)** (0.23)
Government Ownership 0.0050 (0.00)
China*State-owned 1.4506 0.4793 (0.15)*** (0.61)
Developed 0.0143 -1.9770 (0.00)*** (0.32)***
Log(Total Assets in 2006) 0.7943 0.7457 1.0549 (0.23)*** (0.29)*** (0.16)***
100*Profitability in 2006 -0.1374 -0.0267 0.7653 (1.38) (1.39) (1.65)
Leverage in 2006 -0.0242 -0.0198 0.0046 (0.03) (0.03) (0.04)
Intercept 8.4061 8.7677 8.2738 8.8517 -1.1508 -0.6758 -4.5432
(0.23)*** (0.08)*** (0.15)*** (0.00)*** (2.48) (3.08) (1.17)***
Country Fixed Effects Yes Yes Yes Yes Yes Yes Yes
Year Fixed Effects Yes Yes Yes Yes Yes Yes Yes
R-squared (%) 52.10 34.46 52.69 50.27 55.69 55.74 56.37
No. of Observations 303 303 303 289 278 278 278
Panel B. Annual Standard Deviation of Daily Stock Return
Model 1 Model 2 Model 3 Model 4 Model 5 Model 6 Model 7
State-owned 0.0001 0.0090 0.0042 0.0073 (0.00) (0.00)*** (0.00)*** (0.00)***
Government Ownership -0.0000
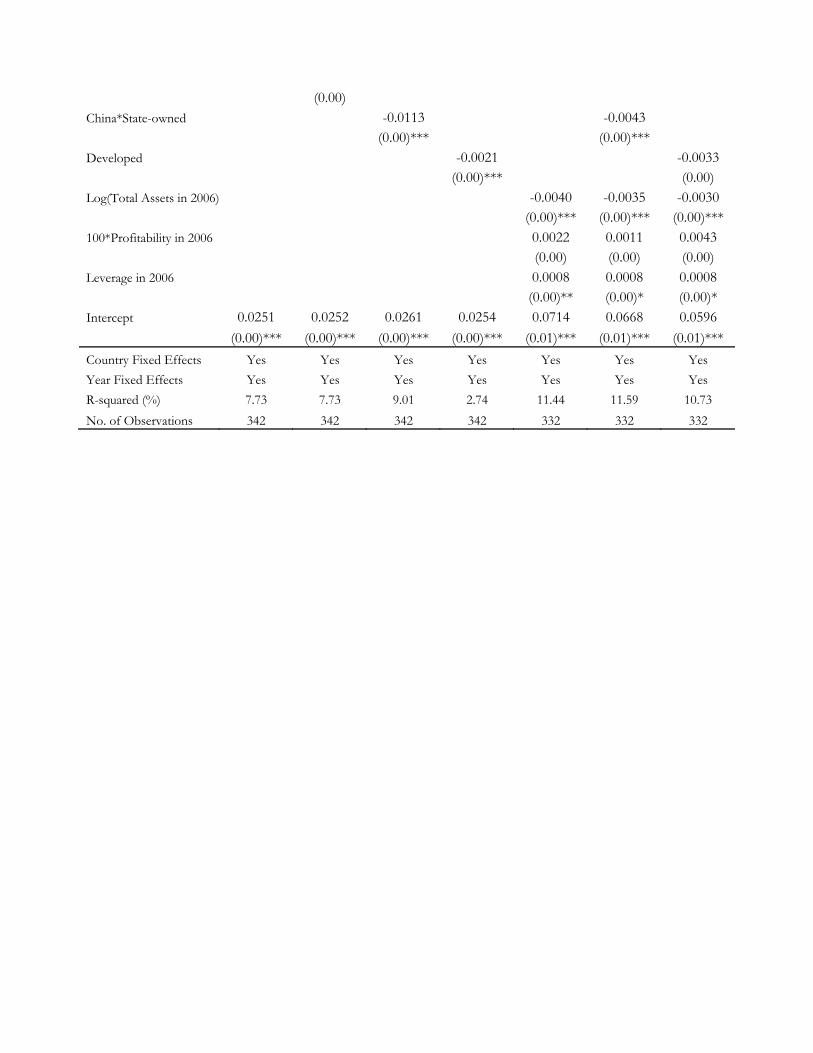
(0.00) China*State-owned -0.0113 -0.0043
(0.00)*** (0.00)*** Developed -0.0021 -0.0033
(0.00)*** (0.00) Log(Total Assets in 2006) -0.0040 -0.0035 -0.0030
(0.00)*** (0.00)*** (0.00)*** 100*Profitability in 2006 0.0022 0.0011 0.0043
(0.00) (0.00) (0.00) Leverage in 2006 0.0008 0.0008 0.0008
(0.00)** (0.00)* (0.00)* Intercept 0.0251 0.0252 0.0261 0.0254 0.0714 0.0668 0.0596
(0.00)*** (0.00)*** (0.00)*** (0.00)*** (0.01)*** (0.01)*** (0.01)***
Country Fixed Effects Yes Yes Yes Yes Yes Yes Yes
Year Fixed Effects Yes Yes Yes Yes Yes Yes Yes
R-squared (%) 7.73 7.73 9.01 2.74 11.44 11.59 10.73
No. of Observations 342 342 342 342 332 332 332
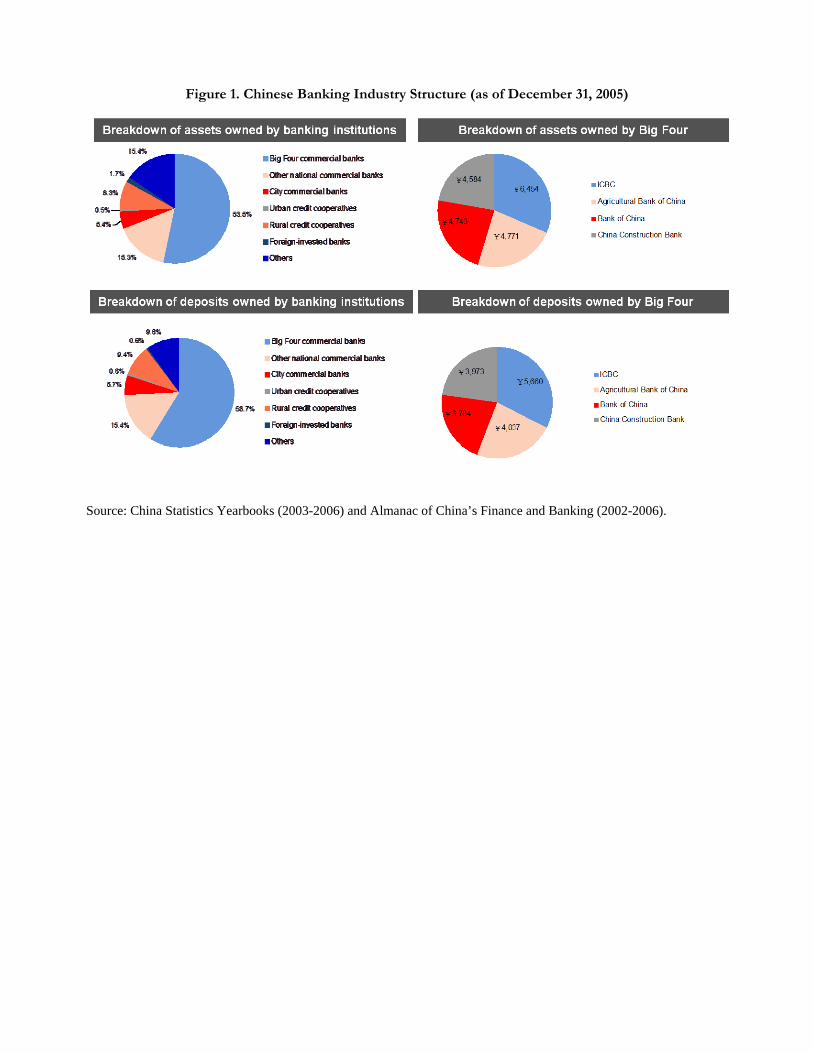
Figure 1. Chinese Banking Industry Structure (as of December 31, 2005)
Source: China Statistics Yearbooks (2003-2006) and Almanac of China’s Finance and Banking (2002-2006).
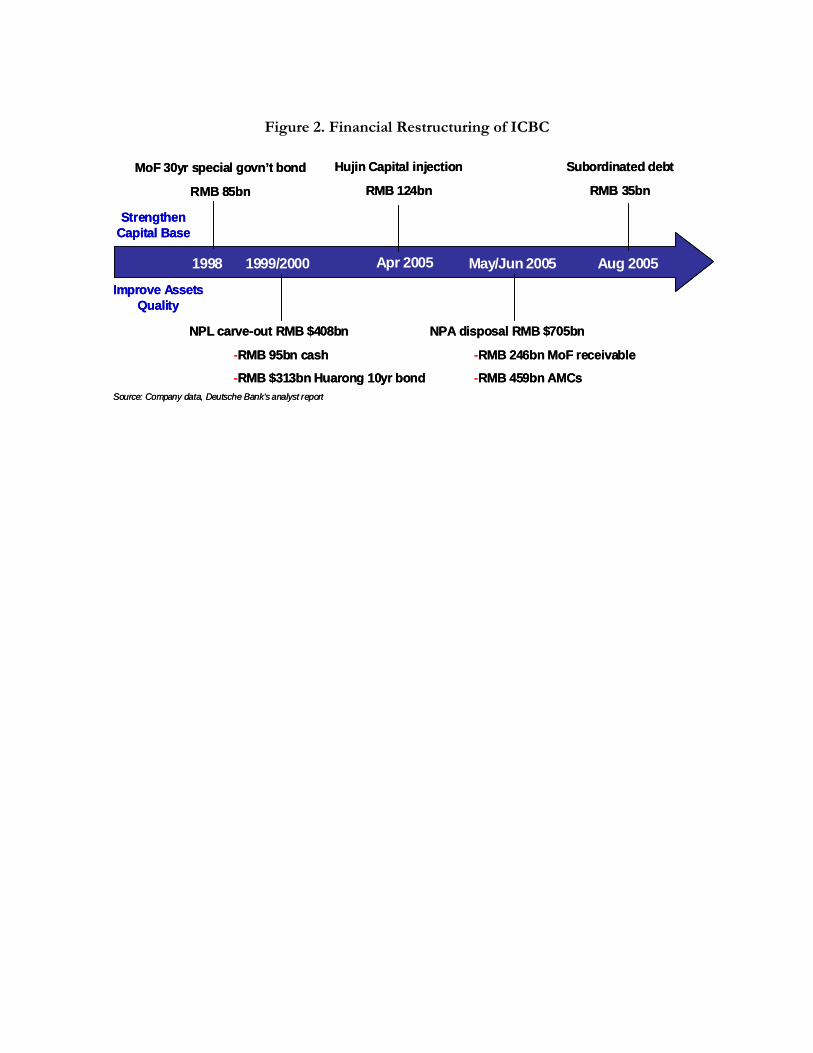
Figure 2. Financial Restructuring of ICBC
1998
MoF 30yr special govn’t bond
RMB 85bn
1999/2000 Apr 2005 May/Jun 2005 Aug 2005
Strengthen Capital Base
Improve Assets Quality
Hujin Capital injection
RMB 124bn
Subordinated debt
RMB 35bn
NPL carve-out RMB $408bn
-RMB 95bn cash
-RMB $313bn Huarong 10yr bond
NPA disposal RMB $705bn
-RMB 246bn MoF receivable
-RMB 459bn AMCsSource: Company data, Deutsche Bank’s analyst report
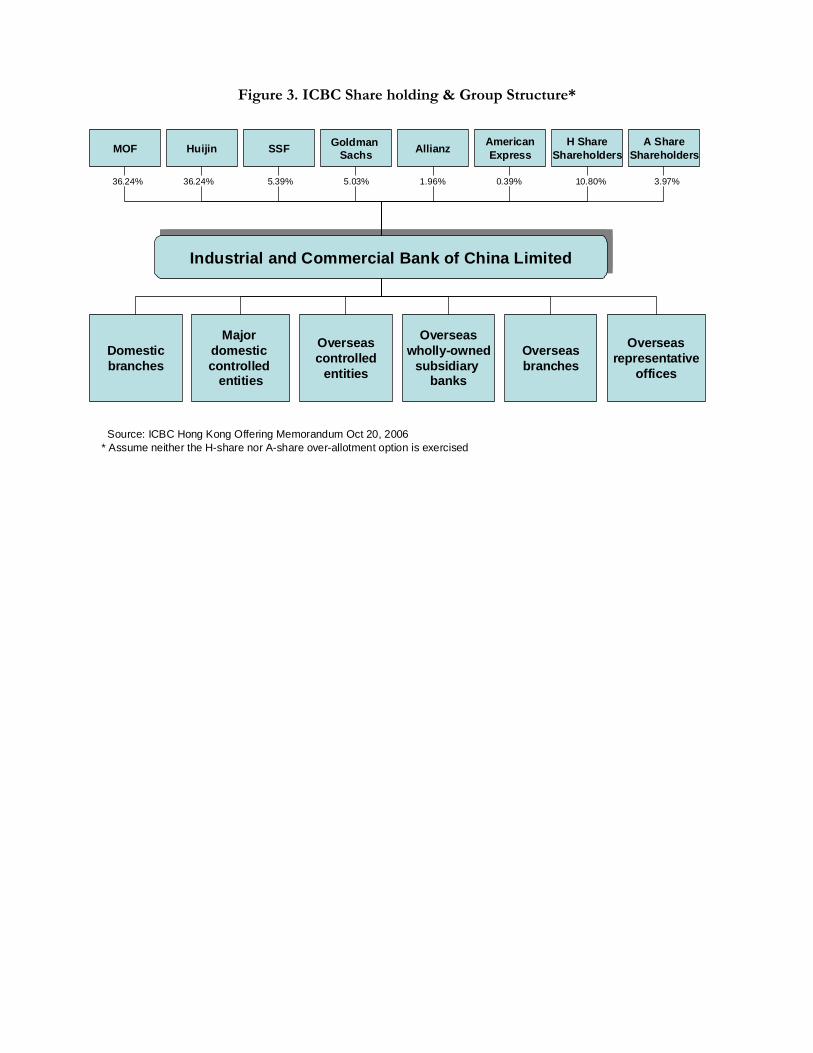
Figure 3. ICBC Share holding & Group Structure*
MOF Huijin SSFGoldman
SachsAllianz
AmericanExpress
H ShareShareholders
A ShareShareholders
Industrial and Commercial Bank of China LimitedIndustrial and Commercial Bank of China Limited
Source: ICBC Hong Kong Offering Memorandum Oct 20, 2006* Assume neither the H-share nor A-share over-allotment option is exercised
36.24% 36.24% 5.39% 5.03% 1.96% 0.39% 10.80% 3.97%
Domesticbranches
Major domestic controlled
entities
Overseascontrolled
entities
Overseaswholly-owned
subsidiary banks
Overseasbranches
Overseasrepresentative
offices