the irish sports monitor - esri · pdf filethe irish sports monitor second annual report, 2008...
TRANSCRIPT
1
The IrIsh sporTs MonITor
Second AnnuAl RepoRt, 2008
pete lunn, Richard layte
the economic and Social Research Institute (eSRI)

2
3
Summary of Findings 4
Part One: Introduction 6
1. The Second Wave of the ISM 7
Part Two: What Changed in 2008? 12
2. Activity in 2008 133. Sport in Recession 164. The Impact on Social Participation 205. Which Sports are Being Played Less? 236. Changing Patterns of Social Participation 287. Participation and Unemployment 31
Part Three: Ireland’s Sporting Geography 34
8. Playing by County and Region 359. Regional Participation Differences for the Top 10 Sports 39
Part Four: Participation and Disability 43
10. Sport, Health and Disability 44
Part Five: Implications of the 2008 ISM 47
11. How Might Policy Respond? 48
References 51
Appendices 52
Appendix – The ISM Questionnaire 53
Contents

4
Summary of FindingsActivity in 2008
• 32% of the population could be classified “just active” in 2008, with modest falls in the proportion “highly” or “fairly” active and in the proportion classified as “sedentary”
• Active participation in sport fell significantly between 2007 and 2008, from 32.9% to 30.8%
• This fall was somewhat compensated for by more people walking and cycling for transport
Sport in Recession
• The available evidence strongly suggests that the fall in the numbers playing sport was the result of the recession
• The relationship between income and playing sport strengthened, but the effect was compensated for by some people having more free time
• Individual sports, which tend to be more expensive, were the activities most affected
The Impact on Social Participation
• Headline rates of volunteering (7.8%) and club membership (32.4%) held up in 2008, but attendance at sporting events fell significantly (16.7 to 15.0%)
• Men took on more of the volunteering associated with their children’s sport, with women doing less
• The relationship between club membership and income strengthened – the less well-off become much less likely to be club members than the better off
• Those living in isolated locations had the largest falls in the likelihood of volunteering or attending sporting events
Which Sports are Being Played Less?
• Personal exercise activity (gym, exercise classes etc.) declined significantly and is no longer the most common sporting activity, which is once again swimming
• Among men, individual sports and soccer declined significantly, while only rugby increased participation
• Among women, participation in all popular individual sports declined, while participation in all team sports increased
Changing Patterns of Social Participation
• The GAA remains the predominant organisation for volunteering, although volunteering associated with team sports fell marginally in 2008
• At least one in every seven members of a gym (or health/fitness club) in 2007 gave up their membership in 2008
• Lower gym membership and a rise in female GAA members made GAA membership the most common form of club membership again, as it was in 2003

5
• Combining free and ticketed events across all levels, attendance at sporting fixtures has fallen for team sports, especially Gaelic football
Participation and Unemployment
• There was an increase in participation rates among the unemployed for playing, volunteering and membership, but not for attendance
• This pattern reflects people initially maintaining their sporting habits after leaving employment and perhaps increasing participation with additional free time
• But the marginal fall in attendance suggests that cost may ultimately matter and those unemployed for a longer period will find it hard to maintain participation
Playing by County and Region
• People in Dun Laoghaire-Rathdown (in particular), Waterford and Louth are more likely to play sport, while people in Dublin City, Offaly and Westmeath (in particular) are less likely to play
• People in the Midlands region are less likely to play sport, because while the region has the highest proportion playing team sports, it has a far lower proportion playing individual sports
Regional Participation Differences for the Top 10 Sports
• There is very considerable regional variation in the specific sporting activities undertaken
• Personal exercise, golf and Gaelic games display particularly striking patterns of participation across the regions
• Some well-known sporting strongholds can be seen, e.g. Munster rugby
Sport, Health and Disability
• Approximately 15% of adults have a long-term health problem, the majority of whom say it prevents them from taking part in sport
• The effect of such health problems is greater among young adults and the over 65s, but narrows in middle-age
• People with long-term health problems who play sport are more likely to swim or play golf and very unlikely to play team sports
• Social participation is also lower among this group, although the participation gap is much narrower for attendance at events
How Might Policy Respond?
• Considering the directly measureable impact on quality of life implied by the fall in active participation, the wisdom of disproportionate cuts in the sport budget is highly questionable
• The widening socio-economic gap in sport strengthens the case for prioritising expenditure programmes most likely to increase grassroots participation, especially among low income groups
• Cost is a barrier to increased participation and there is therefore a leadership role for policy-makers in promoting affordable sporting opportunities, especially for the newly unemployed

6
Part One:
Introduction
7
1. The Second Wave of the ISM
BackgroundThe Irish Sports Monitor (ISM) is an ongoing telephone survey of participation in sport and physical exercise in Ireland. It is based on regular interviews with adults aged 16 and over, beginning in 2007 and continuing throughout 2008 and 2009. The survey is primarily designed to track levels of participation in sport, both for the population as a whole and various subpopulations of interest.
The definition of “sport” adopted is broad and is taken from the Irish Sports Council Act of 1999. It covers all kinds of recreational exercise activities, such as swimming, jogging and going to the gym, as well as traditional field games like soccer and Gaelic games. Recreational walking is analysed separately.
As well as tracking participation, the ISM is also gradually accumulating a large number of survey responses and thus providing a rich data source, permitting research questions to be addressed that were beyond the scope of previous participation surveys based on smaller samples.
This report focuses on the second wave of data collection, undertaken in 2008. It begins by making a comparison of the 2008 results with the baseline results for 2007, which were described in Lunn, Layte and Watson (2009). During these first two years of the ISM’s operation, Ireland went through a period of dramatic economic change as it entered a very deep recession. The impact of these economic events features strongly throughout most of the report because, as the analysis to be presented shows, the recession has had an important impact on sport and exercise activity.
The comparison of the results for 2008 with those of the previous year accounts for around two-thirds of the quantitative analysis to be presented. The remaining third consists of original analyses made possible by the accumulation of data. Combining the responses for 2007 and 2008 gives a total sample of 16,596 adults. We employ this large sample to examine the geographic distribution of sporting activity in more detail than has been possible previously. We also make use of the fact that the sample contains sufficient numbers of people with a disability to allow a separate analysis of the relationship between disability and participation in sport.
The findings should be viewed in the context of what has become a substantial body of quantitative research based on nationally representative surveys in Ireland (see Lunn, 2007b, for a summary of findings). Fahey, Layte and Gannon (2004) were the first to analyse active participation using a large-scale national survey. Delaney and Fahey (2005) extended this analysis to cover social participation and to assess the economic benefits of sport. Fahey, Delaney and Gannon (2005) provided extensive findings specific to schoolchildren’s sport. Lunn (2007a) undertook an exploration of the strong relationship between participation in sport and social disadvantage. Lastly, Lunn and Layte (2008) used recall data to reconstruct the recent history of Irish sport and hence to uncover trends in participation over recent generations and across the life-course. Comparisons with each of these previous quantitative analyses are made at various points throughout the chapters that follow. An additional data-source referred to is the published tables of the Quarterly National Household Survey (QNHS) module on sport and physical exercise (Central Statistics Office, 2007), which is the only other survey of sport and exercise in Ireland to have employed such a large representative sample.
The findings also arise in a policy context. Participation in sport and recreational exercise is increasingly seen, both in Ireland and internationally, as making an important contribution to health and to social capital. Thus, the role of sports policy in promoting physical activity and social capital is receiving greater attention than previously. Evidence in support of this trend is reviewed in Delaney and Fahey (2005) and an evaluation of how Ireland’s sports policy mechanisms relate to the twin goals of improving health and social capital can be found in Lunn (2008).
8
Monitoring Participation Over TimePrevious work has found significant changes in sporting participation in Ireland over the long-term, i.e. three to four decades (Lunn and Layte, 2008). The data reveal that the current generation of young adults does significantly more regular sport and exercise than their parent’s generation did as young adults. This increase is primarily down to a rise in participation in individual sports, as distinct from traditional team sports. In particular, there has been rapid growth over the last 20 years in the proportion of the population that undertakes personal exercise activities (going to the gym, exercise classes, exercise routines in the home etc.) Note that these findings do not necessarily mean that the present generation of young adults in Ireland is more physically active than its predecessors, since the definition of participation in sport that we adopt does not include walking (for transport or recreation), physical activity in the workplace, cycling for transport, or the large range of less common physical activities that would not be considered sport or recreational exercise. Rather, the data suggest that if there has been a decline in physical activity, then it is not due to people engaging less in sport and recreational exercise.
The ISM is designed to monitor changes in participation in sport and physical exercise over a period of years. International experience suggests that participation rates tend to change only relatively slowly. A rate of change in the level of adult participation of one percentage-point per year is considered relatively rapid (Carter, 2005), although some countries (e.g. Finland and Canada) have managed to sustain increases of this size over many years, resulting in substantially increased participation across the adult population.
Given that changes in participation rates are generally gradual, the ISM questionnaire was designed to maximise the sensitivity of comparisons from year to year (see Lunn et al., 2009, for discussions of the trade-offs involved). It employs a one-week “reference period” (i.e. respondents are asked about activities undertaken only within the previous seven days), records the type of activity undertaken using an open-ended question format, and obtains information about the frequency, duration, effort and context associated with participation in each of up to three activities. (The full questionnaire is supplied in the Appendix.) The questionnaire thus aims to maximise the chances of accurate recall and to permit a strict definition of participation to be applied. The goal is to minimise measurement error over a large sample size, thereby prioritising sensitivity and allowing significant changes in participation levels to be detected over relatively short time periods. Nevertheless, because of the slow pace of change in participation experienced in other countries, it was not initially anticipated that significant changes in sporting activity would be likely to be identified within the first two years of operation.
We live, however, in unusual times. Since late 2007, the Irish economy has experienced a contraction the extent of which is unprecedented in modern times. Although links between socio-economic status and sporting activity are well-documented (e.g. Lunn, 2007), little is known, in Ireland or internationally, about the sensitivity of sporting activity to fluctuations in the wider economy. Lunn et al. (2009) raised the possibility that the economic downturn might have been responsible for a decline in activity in the final quarter of 2007. In the chapters that follow, we provide various breakdowns of activity in 2008 by social group, income and employment status, which strongly suggest that the dramatic economic turnaround we have seen in the past two years has indeed had a significant impact on participation in sport and physical exercise.
Possible Links Between the Recession and ParticipationWe consider two main routes by which the recession is likely to have had an impact on sporting activity. In the first instance, recessions cause loss of disposable income and are therefore usually associated with declines in consumer spending. Sport is not free. Indeed, many sport and exercise activities require membership or pay-per-use fees for access to facilities, as well as expenditure on equipment, clothing and transport (Delaney and Fahey, 2005). Given this, it is a reasonable presumption that declining incomes will result in some people deciding to cease activities, perhaps especially activities involving larger expenditure (e.g. gym and golf club memberships).
The higher unemployment, lower participation in the labour force and reduced working hours associated with recessions also results in many people spending less time working. Research has shown that the main barrier to involvement in sport and exercise, at least as cited by those who do not participate, is lack of time (Fahey et al., 2004; Lunn, 2008). Thus, it is possible that greater amounts of free time will result in more participation in sport and exercise. On the other hand, it is also established that the unemployed, at least during periods of low and stable unemployment, are less likely to participate (Lunn, 2007). The overall impact of changes in employment
9
status on participation is likely, therefore, to reflect a balance between the positive influence of more free time and the negative influence of unemployment. This balance is likely to change over time, as those who have recently lost jobs during a rapid rise in unemployment may behave very differently from those who are unemployed for longer durations.
Another possible route through which the recession may affect participation in sport is via migration. At the time of writing, however, little is known about how the recession is altering migratory patterns. Moreover, the degree to which such changes might have affected participation in 2008 is probably slight. They may be of greater relevance to participation in 2009 and, hence, to the next annual report of the ISM.
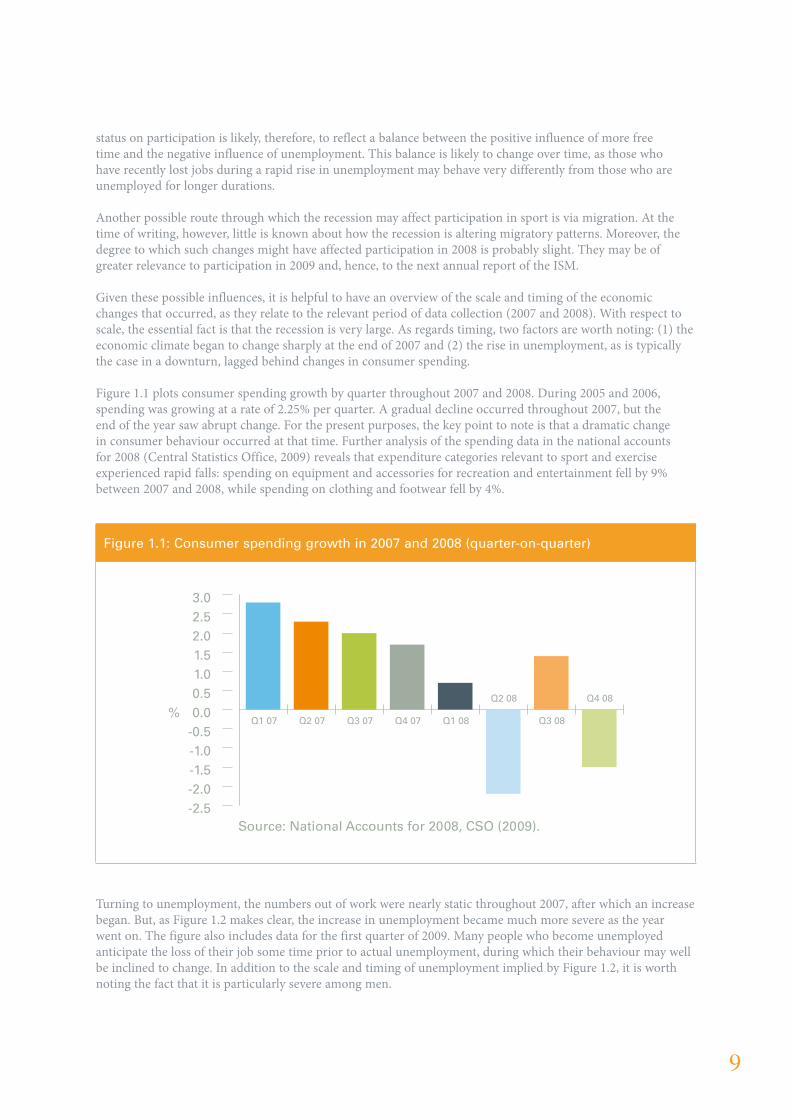
Given these possible influences, it is helpful to have an overview of the scale and timing of the economic changes that occurred, as they relate to the relevant period of data collection (2007 and 2008). With respect to scale, the essential fact is that the recession is very large. As regards timing, two factors are worth noting: (1) the economic climate began to change sharply at the end of 2007 and (2) the rise in unemployment, as is typically the case in a downturn, lagged behind changes in consumer spending.
Figure 1.1 plots consumer spending growth by quarter throughout 2007 and 2008. During 2005 and 2006, spending was growing at a rate of 2.25% per quarter. A gradual decline occurred throughout 2007, but the end of the year saw abrupt change. For the present purposes, the key point to note is that a dramatic change in consumer behaviour occurred at that time. Further analysis of the spending data in the national accounts for 2008 (Central Statistics Office, 2009) reveals that expenditure categories relevant to sport and exercise experienced rapid falls: spending on equipment and accessories for recreation and entertainment fell by 9% between 2007 and 2008, while spending on clothing and footwear fell by 4%.
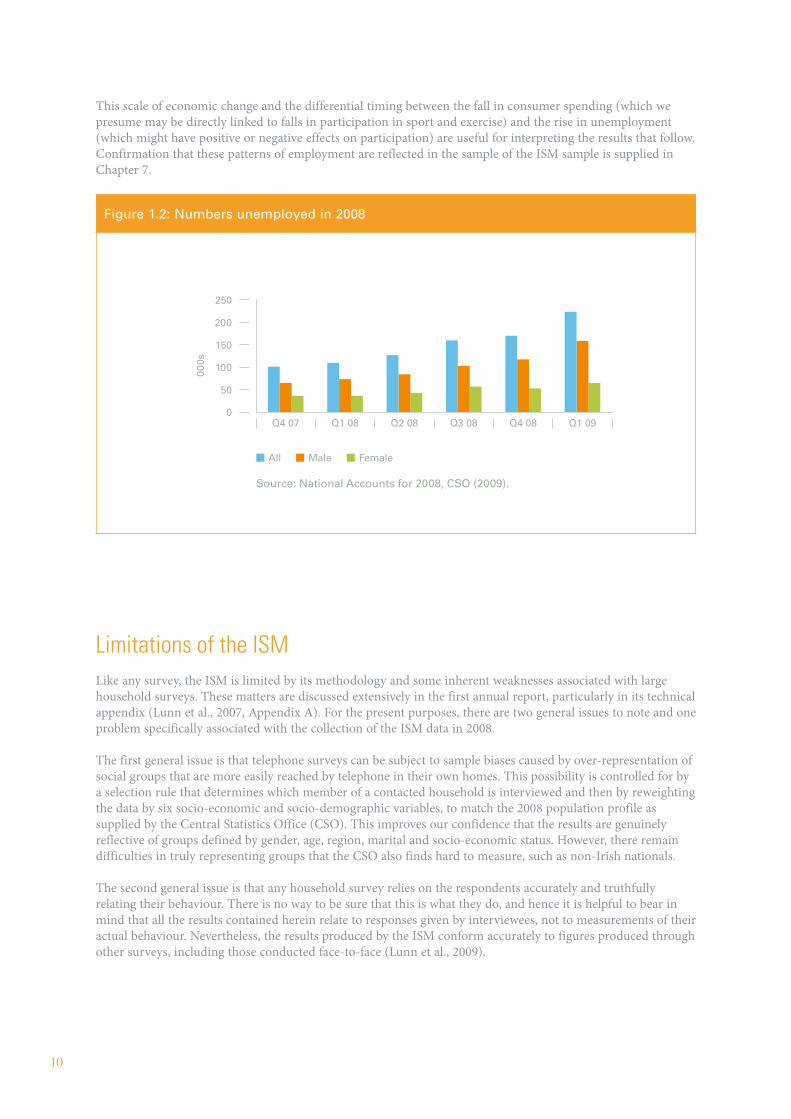
Turning to unemployment, the numbers out of work were nearly static throughout 2007, after which an increase began. But, as Figure 1.2 makes clear, the increase in unemployment became much more severe as the year went on. The figure also includes data for the first quarter of 2009. Many people who become unemployed anticipate the loss of their job some time prior to actual unemployment, during which their behaviour may well be inclined to change. In addition to the scale and timing of unemployment implied by Figure 1.2, it is worth noting the fact that it is particularly severe among men.
Figure 1.1: Consumer spending growth in 2007 and 2008 (quarter-on-quarter)
-2.5-2.0-1.5-1.0-0.50.0%
Source: National Accounts for 2008, CSO (2009).
0.51.01.52.02.53.0
Q4 08
Q3 08
Q2 08
Q1 08Q4 07Q3 07Q2 07Q1 07
10
This scale of economic change and the differential timing between the fall in consumer spending (which we presume may be directly linked to falls in participation in sport and exercise) and the rise in unemployment (which might have positive or negative effects on participation) are useful for interpreting the results that follow. Confirmation that these patterns of employment are reflected in the sample of the ISM sample is supplied in Chapter 7.
Limitations of the ISMLike any survey, the ISM is limited by its methodology and some inherent weaknesses associated with large household surveys. These matters are discussed extensively in the first annual report, particularly in its technical appendix (Lunn et al., 2007, Appendix A). For the present purposes, there are two general issues to note and one problem specifically associated with the collection of the ISM data in 2008.
The first general issue is that telephone surveys can be subject to sample biases caused by over-representation of social groups that are more easily reached by telephone in their own homes. This possibility is controlled for by a selection rule that determines which member of a contacted household is interviewed and then by reweighting the data by six socio-economic and socio-demographic variables, to match the 2008 population profile as supplied by the Central Statistics Office (CSO). This improves our confidence that the results are genuinely reflective of groups defined by gender, age, region, marital and socio-economic status. However, there remain difficulties in truly representing groups that the CSO also finds hard to measure, such as non-Irish nationals.
The second general issue is that any household survey relies on the respondents accurately and truthfully relating their behaviour. There is no way to be sure that this is what they do, and hence it is helpful to bear in mind that all the results contained herein relate to responses given by interviewees, not to measurements of their actual behaviour. Nevertheless, the results produced by the ISM conform accurately to figures produced through other surveys, including those conducted face-to-face (Lunn et al., 2009).
Figure 1.2: Numbers unemployed in 2008
All
000s
Male Female
0
50
100
150
200
250
Q1 09Q4 08Q3 08Q2 08Q1 08Q4 07
Source: National Accounts for 2008, CSO (2009).
11
Lastly, a specific issue arose during 2008 concerning data collection for the ISM. The Survey Unit of the ESRI, which had collected all of the data from the inception of the ISM in 2007, was closed at the end of April 2008. Initially, it was hoped that data collection could be taken on by an experienced market research company. However, in the event, the data collected were not of sufficient quality to be properly comparable with what had been collected up until that time, especially in relation to the survey response rate (the proportion of households contacted that agrees to do the survey). Eventually, the strategy had to be abandoned and the data collection was transferred to a group of experienced interviewers under the direct supervision of the ESRI, after which the quality of the data returned to the original standard. All data collected between May and July 2008 had to be discarded.
There are two relevant consequences. First, the sample-size for 2008 is 6,829, which is smaller than the annual target of 9,200 and the 2007 sample of 9,767. Although this sample is nevertheless large by the standard of social surveys, it somewhat limits the degree to which the statistical significance of relationships can be established. Second, and more importantly, the loss of data is specific to a particular time of year. Because sporting activity is itself seasonal, this has the potential to introduce biases. We have tested and control for these biases by reweighting the data and by ensuring that comparisons between 2007 and 2008 are robust to seasonal effects; that is, they apply when matching periods of 2007 and 2008 are compared that do not include the months of May, June and July. Nevertheless, the problem has a bearing on what we report, primarily because it does not allow detailed and consistent tracking of levels by month or by quarter across 2008. Fortunately, at least from this perspective, the changes that have occurred in the present environment are of sufficient magnitude that we are not short of striking and robust findings to report.

12
Part Two:
What Changed in 2008?
13
2. Activity in 2008
Summary• 32% of the population could be classified “just active” in 2008, with modest falls in the proportion “highly”
or “fairly” active and in the proportion classified as “sedentary”
• Active participation in sport fell significantly between 2007 and 2008, from 32.9% to 30.8%
• This fall was somewhat compensated for by more people walking and cycling for transport
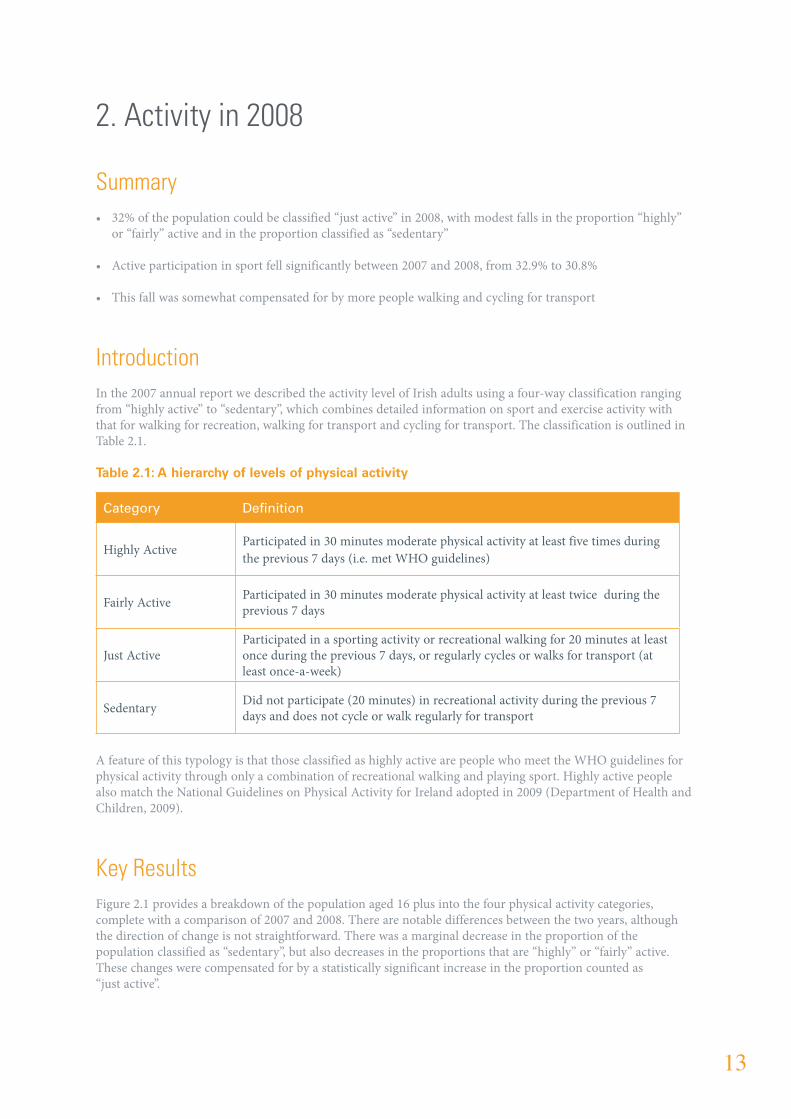
IntroductionIn the 2007 annual report we described the activity level of Irish adults using a four-way classification ranging from “highly active” to “sedentary”, which combines detailed information on sport and exercise activity with that for walking for recreation, walking for transport and cycling for transport. The classification is outlined in Table 2.1.
Table 2.1: A hierarchy of levels of physical activity
A feature of this typology is that those classified as highly active are people who meet the WHO guidelines for physical activity through only a combination of recreational walking and playing sport. Highly active people also match the National Guidelines on Physical Activity for Ireland adopted in 2009 (Department of Health and Children, 2009).
Key ResultsFigure 2.1 provides a breakdown of the population aged 16 plus into the four physical activity categories, complete with a comparison of 2007 and 2008. There are notable differences between the two years, although the direction of change is not straightforward. There was a marginal decrease in the proportion of the population classified as “sedentary”, but also decreases in the proportions that are “highly” or “fairly” active. These changes were compensated for by a statistically significant increase in the proportion counted as “just active”.
Category Definition
Highly Active Participated in 30 minutes moderate physical activity at least five times during the previous 7 days (i.e. met WHO guidelines)
Fairly Active Participated in 30 minutes moderate physical activity at least twice during the previous 7 days
Just ActiveParticipated in a sporting activity or recreational walking for 20 minutes at least once during the previous 7 days, or regularly cycles or walks for transport (at least once-a-week)
Sedentary Did not participate (20 minutes) in recreational activity during the previous 7 days and does not cycle or walk regularly for transport

14
Although these changes represent a statistically significant change in the proportions as classified, the headline figures in fact disguise a greater degree of behaviour change between 2007 and 2008.1 The proportion of people who played sport fell significantly, while the numbers walking for recreation fell marginally.2 Yet these falls were compensated for by the fact that there were significant increases in the numbers of people walking and cycling for transport. We now look at these activities separately.
The above four-way classification employs a duration threshold for activity of 30 minutes, i.e. an activity must last 30 minutes or more to be counted. This threshold is chosen for comparison with WHO guidelines. For consistency with previous Irish measures of participation, however, we use a threshold of 20 minutes duration for the analysis of playing sport and recreational walking. The extent of the falls in activity between 2007 and 2008 are as follows:
In 2008, the proportion of Irish adults who participated in sport (excluding walking) for at least 20 minutes during the previous 7 days was as follows
Players: 30.8% (32.9%)The figure in brackets is for 2007. This drop in activity is statistically significant.
In 2007, the proportion of Irish adults who participated in recreational walking for at least 20 minutes during the 7 days prior to the survey was as follows.
Walkers: 57.5% (58.1%)The figure in brackets is for 2007. This drop is not statistically significant.
The fall in playing sport is statistically significant (p = 0.004, i.e. there is only a 4 in 1,000 chance that a fall of this size could have been observed by chance). It is also important from a policy perspective: it equates to one in every 16 participants giving up sport, at a time when the explicit aim of policy is to increase participation. The fall in the proportion walking for recreation is not statistically significant.
1 Most figures presented in this report are proportions given in percentage form. For adults aged 16 and over in Ireland in 2008, 1% corresponds to approximately 33,000 individuals.
2 Throughout this report, when we describe a change as “significant”, it implies that the effect in question is statistically significant.
Figure 2.1: Population classified by levels of recreational physical activity, 2007 and 20081
Highly Active 23.3% Sedentary 17.7%
Just Active 32.0%Fairly Active 27.0%
Highly Active 23.9% Sedentary 18.2%
Just Active 29.8%Fairly Active 28.2%
2008 2007
15
With both playing sport and recreational walking declining, it might be expected that the amount of sedentarism would have risen (c.f. Figure 2.1). That it did not is due to a quite striking rise in the proportion of people walking and cycling for transport. The ISM questionnaire asks whether people engage in walking and cycling for transport “regularly”, which is defined as at least once a week. The relevant proportions rose from 41% to 50% for walking and 10 to 14% for cycling, between 2007 and 2008. Trying to explain these changes in transport choices is beyond the scope of the present report. Indeed, it is beyond the scope of the data, since sufficient information on commuting and transport choices is not available from the ISM questionnaire (although it is possible to check whether the increase is concentrated among particular demographic groups, which it is not.) Perhaps the most obvious candidate explanation for this pattern is economic change: both lower income and increased time might lead more people to walk and cycle. Furthermore, it is possible that part of the increase is due to some of the people who ceased playing sport deciding to substitute different kinds of physical activity into their daily routines. These are, however, merely hypotheses.
The 2007 ISM Annual Report contained a chapter dedicated to recreational walking, which included an examination of duration and frequency of weekly walks and the social background characteristics associated with walking. This analysis revealed that recreational walking is more common in the summer months, that people average 2.3 walks a week, that women walk more than men, especially at younger ages, and that men in couples are more likely to take recreational walks. A preliminary analysis of the 2008 data revealed little change in this pattern of recreational walking between 2007 and 2008. Given this, and the changes that were quickly apparent in the data for active participation in sport, we decided not to include a separate analysis of walking in this present report. The analysis contained in the 2007 report remains essentially unchanged.
DiscussionThe changes in activity in just a single year documented in this chapter are surprising in magnitude. As outlined in Chapter 1, participation in sport tends to change only slowly over time and yet the ISM has recorded substantial and significant changes in its first year of operation. It remains possible that the fall in participation recorded here is due to statistical variation associated with the survey method, but this is highly unlikely. (Indeed, it is more unlikely still given the distinct patterns among subgroups of the population revealed in the subsequent chapters.)
From a policy perspective, the fall in the headline rate of participation is obviously disappointing. But it is important to realise that the extent of social and economic change in Ireland during the period in question was very great. In an extensive discussion on the potential for policymakers to affect the level of participation in sport and exercise, Fahey et al. (2004) pointed out that many of the social and economic forces concerned were beyond the control of policy and that there was therefore only limited scope for policy to be influential. The comparison of participation rates for 2007 and 2008 arguably represents a verification of this position.
Nevertheless, the fall in participation is likely to have important consequences for the health and wellbeing of those who no longer actively participate in sport. (For review and references concerning the link between sport and health, in the Irish context, see Fahey et al., 2004; Delaney and Fahey, 2005; Lunn, 2007; Lunn and Layte, 2008). Moreover, even if it is the case that policy can do little to prevent large social and economic changes having an impact, a better understanding of how that impact arises is of benefit, if we wish to design policies to lessen that impact or to recover from it. Hence, the next step is to look at more detailed evidence regarding how and why participation in sport fell in 2008.
16
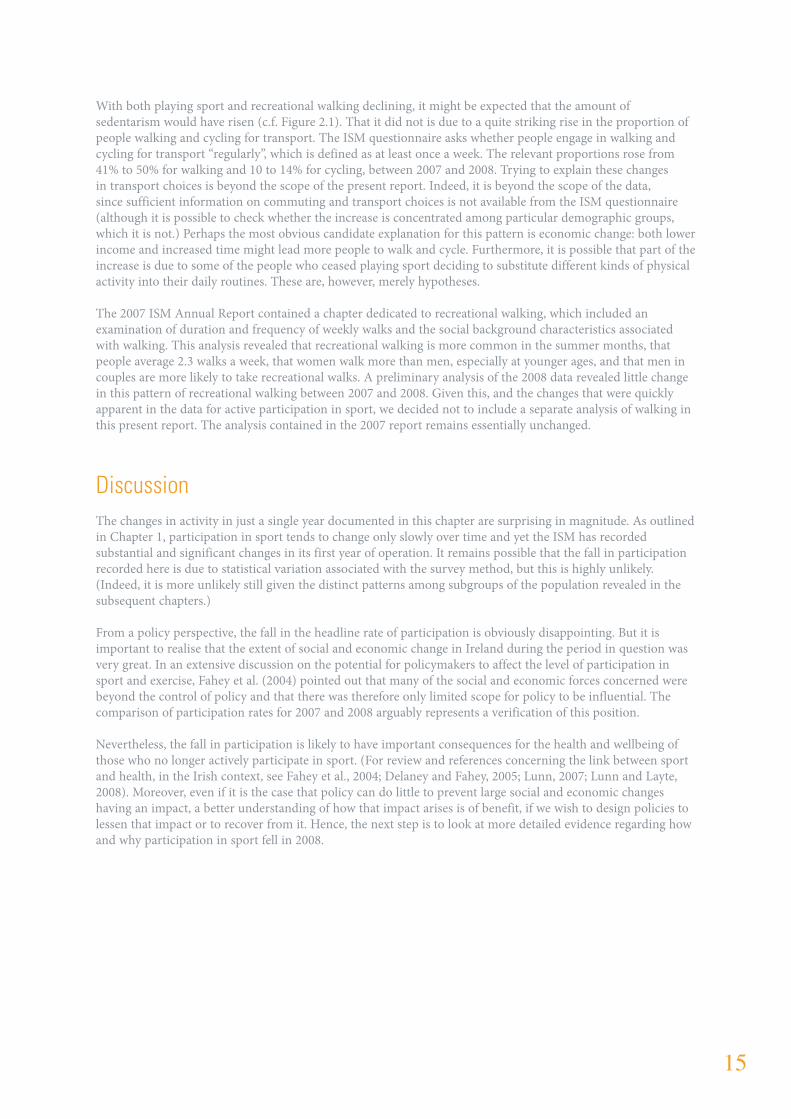
3. Sport in Recession
Summary• The available evidence strongly suggests that the fall in the numbers playing sport was the result of the recession
• The relationship between income and playing sport strengthened, but the effect was compensated for by some people having more free time
• Individual sports, which tend to be more expensive, were the activities hit
IntroductionTo understand some of the forces that lie behind the fall in active participation requires more detailed analysis of changes in participation among subgroups in the population. Although the recession is (quite reasonably) the prime suspect for any notable social change occurring during the period, it is of course possible that other forces were at work. This chapter looks at the timing of the fall in participation, the background characteristics associated with it and presents an initial breakdown of the type of sports affected. Its primary aim is to determine whether the recession was responsible for the change in observed participation.
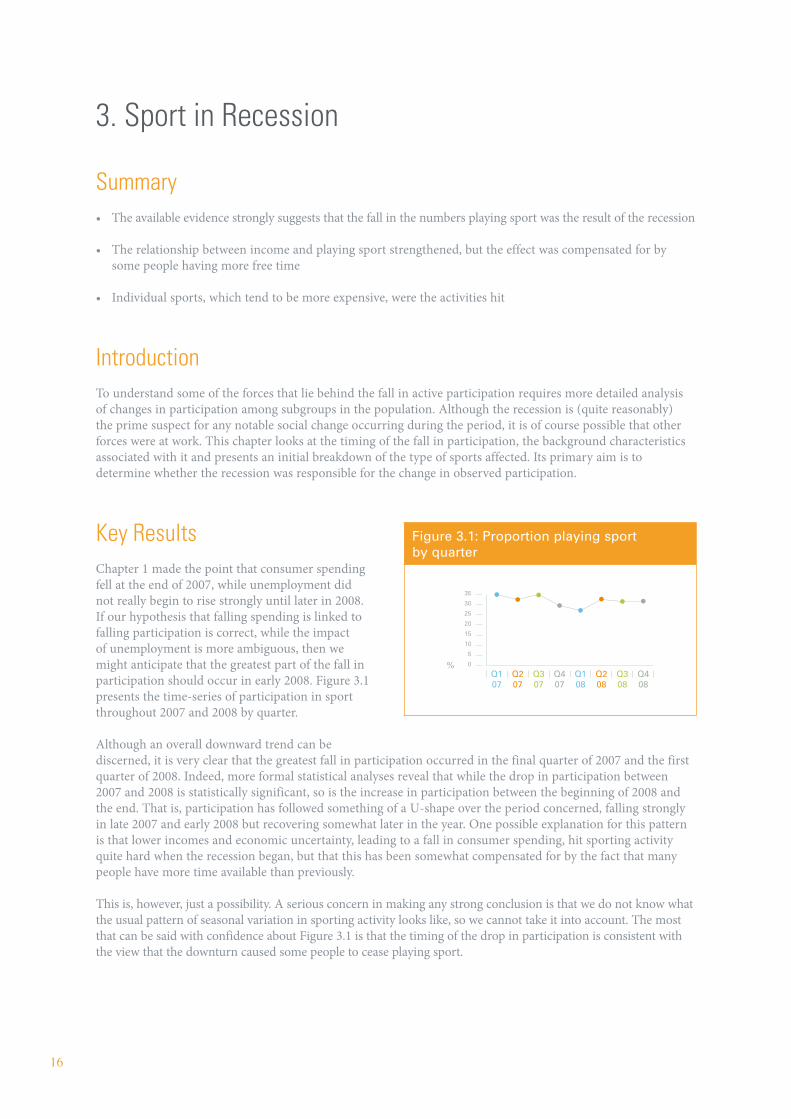
Key ResultsChapter 1 made the point that consumer spending fell at the end of 2007, while unemployment did not really begin to rise strongly until later in 2008. If our hypothesis that falling spending is linked to falling participation is correct, while the impact of unemployment is more ambiguous, then we might anticipate that the greatest part of the fall in participation should occur in early 2008. Figure 3.1 presents the time-series of participation in sport throughout 2007 and 2008 by quarter.
Although an overall downward trend can be discerned, it is very clear that the greatest fall in participation occurred in the final quarter of 2007 and the first quarter of 2008. Indeed, more formal statistical analyses reveal that while the drop in participation between 2007 and 2008 is statistically significant, so is the increase in participation between the beginning of 2008 and the end. That is, participation has followed something of a U-shape over the period concerned, falling strongly in late 2007 and early 2008 but recovering somewhat later in the year. One possible explanation for this pattern is that lower incomes and economic uncertainty, leading to a fall in consumer spending, hit sporting activity quite hard when the recession began, but that this has been somewhat compensated for by the fact that many people have more time available than previously.
This is, however, just a possibility. A serious concern in making any strong conclusion is that we do not know what the usual pattern of seasonal variation in sporting activity looks like, so we cannot take it into account. The most that can be said with confidence about Figure 3.1 is that the timing of the drop in participation is consistent with the view that the downturn caused some people to cease playing sport.
Figure 3.1: Proportion playing sport by quarter
%
30
35
25
20
15
10
5
0
Q408
Q308
Q208
Q108
Q407
Q307
Q207
Q107
17
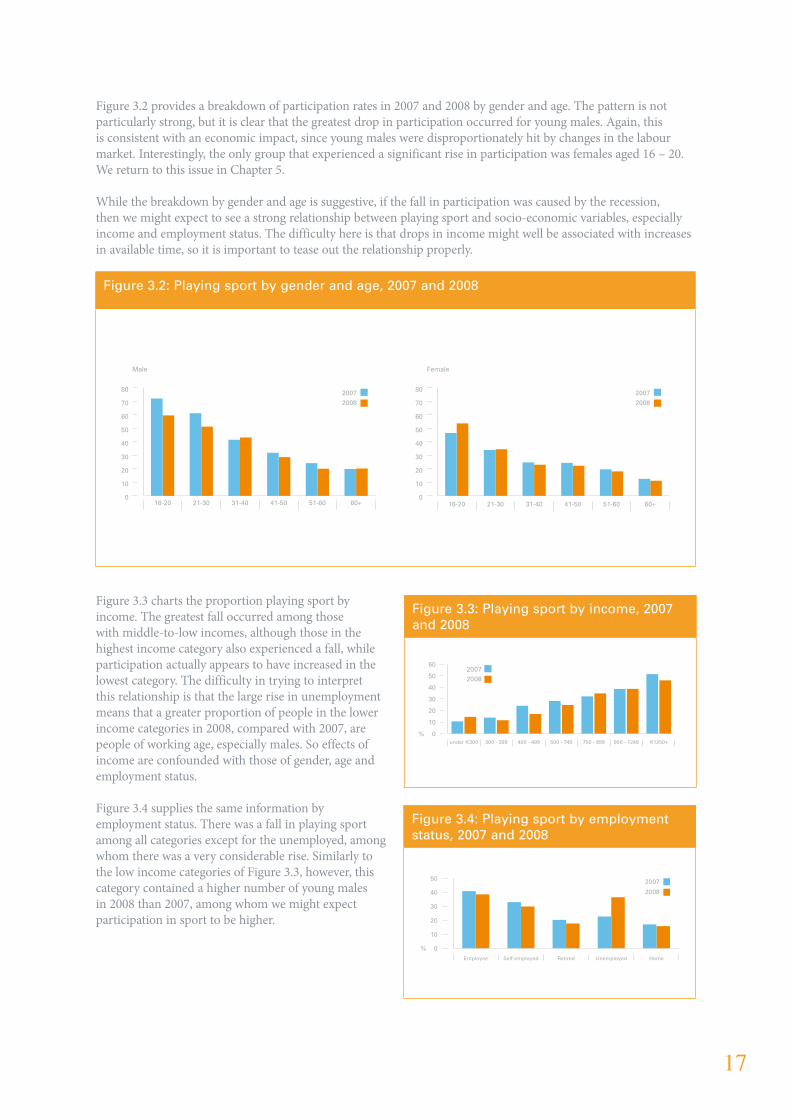
Figure 3.2 provides a breakdown of participation rates in 2007 and 2008 by gender and age. The pattern is not particularly strong, but it is clear that the greatest drop in participation occurred for young males. Again, this is consistent with an economic impact, since young males were disproportionately hit by changes in the labour market. Interestingly, the only group that experienced a significant rise in participation was females aged 16 – 20. We return to this issue in Chapter 5.
While the breakdown by gender and age is suggestive, if the fall in participation was caused by the recession, then we might expect to see a strong relationship between playing sport and socio-economic variables, especially income and employment status. The difficulty here is that drops in income might well be associated with increases in available time, so it is important to tease out the relationship properly.
Figure 3.3 charts the proportion playing sport by income. The greatest fall occurred among those with middle-to-low incomes, although those in the highest income category also experienced a fall, while participation actually appears to have increased in the lowest category. The difficulty in trying to interpret this relationship is that the large rise in unemployment means that a greater proportion of people in the lower income categories in 2008, compared with 2007, are people of working age, especially males. So effects of income are confounded with those of gender, age and employment status.
Figure 3.4 supplies the same information by employment status. There was a fall in playing sport among all categories except for the unemployed, among whom there was a very considerable rise. Similarly to the low income categories of Figure 3.3, however, this category contained a higher number of young males in 2008 than 2007, among whom we might expect participation in sport to be higher.
Figure 3.4: Playing sport by employment status, 2007 and 2008
0%
10
20
30
40
50 2007
2008
HomeUnemployedRetiredSelf-employedEmployee
Figure 3.3: Playing sport by income, 2007 and 2008
20082007
0%
10
20
30
40
50
60
€1250+900 - 1249750 - 899500 - 749400 - 499300 - 399under €300
Figure 3.2: Playing sport by gender and age, 2007 and 2008
2008
2007
2008
2007
000s
Male Female
0
10
20
30
40
50
60
70
80
60+51-6041-5031-4021-3016-200
10
20
30
40
50
60
70
80
60+51-6041-5031-4021-3016-20
18
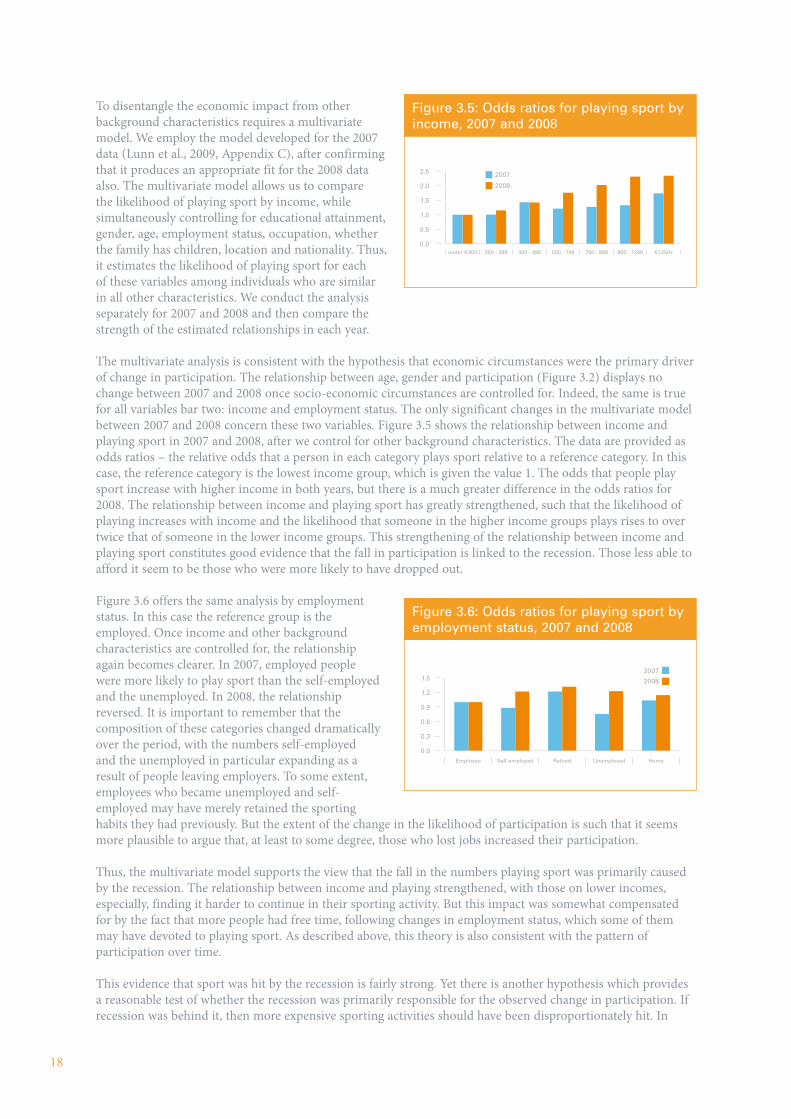
To disentangle the economic impact from other background characteristics requires a multivariate model. We employ the model developed for the 2007 data (Lunn et al., 2009, Appendix C), after confirming that it produces an appropriate fit for the 2008 data also. The multivariate model allows us to compare the likelihood of playing sport by income, while simultaneously controlling for educational attainment, gender, age, employment status, occupation, whether the family has children, location and nationality. Thus, it estimates the likelihood of playing sport for each of these variables among individuals who are similar in all other characteristics. We conduct the analysis separately for 2007 and 2008 and then compare the strength of the estimated relationships in each year.
The multivariate analysis is consistent with the hypothesis that economic circumstances were the primary driver of change in participation. The relationship between age, gender and participation (Figure 3.2) displays no change between 2007 and 2008 once socio-economic circumstances are controlled for. Indeed, the same is true for all variables bar two: income and employment status. The only significant changes in the multivariate model between 2007 and 2008 concern these two variables. Figure 3.5 shows the relationship between income and playing sport in 2007 and 2008, after we control for other background characteristics. The data are provided as odds ratios – the relative odds that a person in each category plays sport relative to a reference category. In this case, the reference category is the lowest income group, which is given the value 1. The odds that people play sport increase with higher income in both years, but there is a much greater difference in the odds ratios for 2008. The relationship between income and playing sport has greatly strengthened, such that the likelihood of playing increases with income and the likelihood that someone in the higher income groups plays rises to over twice that of someone in the lower income groups. This strengthening of the relationship between income and playing sport constitutes good evidence that the fall in participation is linked to the recession. Those less able to afford it seem to be those who were more likely to have dropped out.
Figure 3.6 offers the same analysis by employment status. In this case the reference group is the employed. Once income and other background characteristics are controlled for, the relationship again becomes clearer. In 2007, employed people were more likely to play sport than the self-employed and the unemployed. In 2008, the relationship reversed. It is important to remember that the composition of these categories changed dramatically over the period, with the numbers self-employed and the unemployed in particular expanding as a result of people leaving employers. To some extent, employees who became unemployed and self-employed may have merely retained the sporting habits they had previously. But the extent of the change in the likelihood of participation is such that it seems more plausible to argue that, at least to some degree, those who lost jobs increased their participation.
Thus, the multivariate model supports the view that the fall in the numbers playing sport was primarily caused by the recession. The relationship between income and playing strengthened, with those on lower incomes, especially, finding it harder to continue in their sporting activity. But this impact was somewhat compensated for by the fact that more people had free time, following changes in employment status, which some of them may have devoted to playing sport. As described above, this theory is also consistent with the pattern of participation over time.
This evidence that sport was hit by the recession is fairly strong. Yet there is another hypothesis which provides a reasonable test of whether the recession was primarily responsible for the observed change in participation. If recession was behind it, then more expensive sporting activities should have been disproportionately hit. In
Figure 3.5: Odds ratios for playing sport by income, 2007 and 2008
0.0
0.5
1.0
1.5
2.0
2.5 2007
2008
€1250+900 - 1249750 - 899500 - 749400 - 499300 - 399under €300
Figure 3.6: Odds ratios for playing sport by employment status, 2007 and 2008
0.0
0.3
0.6
0.9
1.2
1.52007
2008
HomeUnemployedRetiredSelf-employedEmployee
19
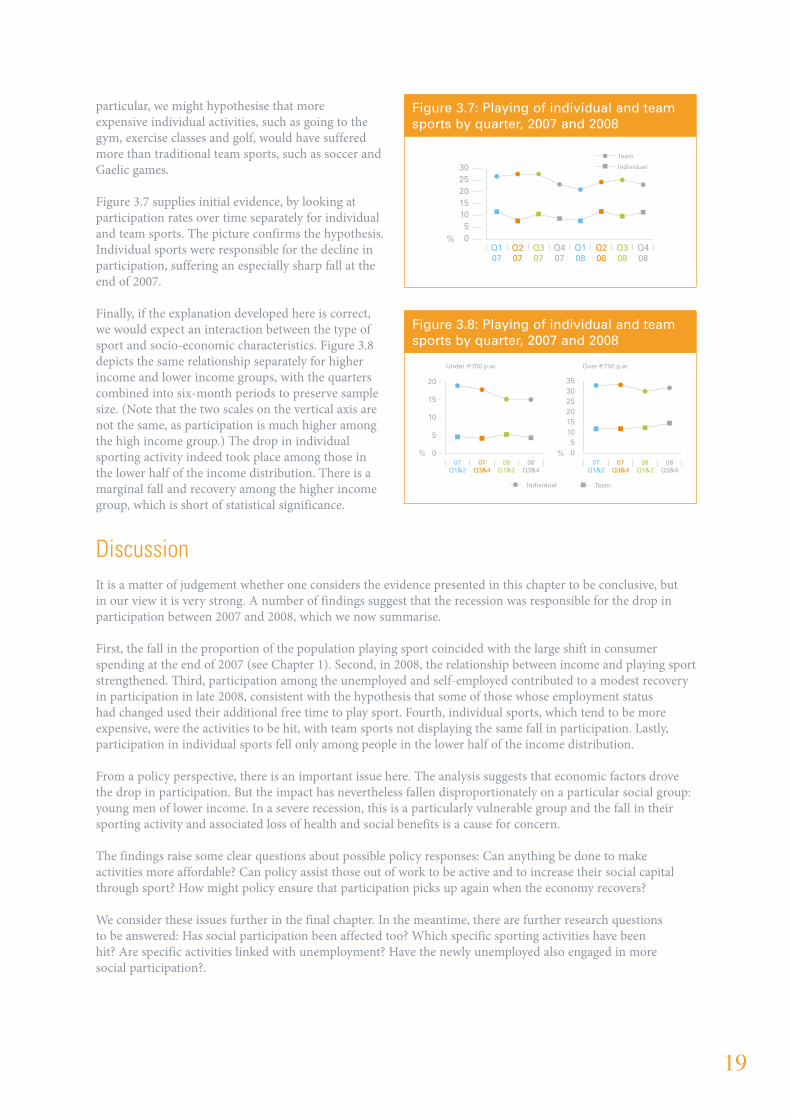
particular, we might hypothesise that more expensive individual activities, such as going to the gym, exercise classes and golf, would have suffered more than traditional team sports, such as soccer and Gaelic games.
Figure 3.7 supplies initial evidence, by looking at participation rates over time separately for individual and team sports. The picture confirms the hypothesis. Individual sports were responsible for the decline in participation, suffering an especially sharp fall at the end of 2007.
Finally, if the explanation developed here is correct, we would expect an interaction between the type of sport and socio-economic characteristics. Figure 3.8 depicts the same relationship separately for higher income and lower income groups, with the quarters combined into six-month periods to preserve sample size. (Note that the two scales on the vertical axis are not the same, as participation is much higher among the high income group.) The drop in individual sporting activity indeed took place among those in the lower half of the income distribution. There is a marginal fall and recovery among the higher income group, which is short of statistical significance.
DiscussionIt is a matter of judgement whether one considers the evidence presented in this chapter to be conclusive, but in our view it is very strong. A number of findings suggest that the recession was responsible for the drop in participation between 2007 and 2008, which we now summarise.
First, the fall in the proportion of the population playing sport coincided with the large shift in consumer spending at the end of 2007 (see Chapter 1). Second, in 2008, the relationship between income and playing sport strengthened. Third, participation among the unemployed and self-employed contributed to a modest recovery in participation in late 2008, consistent with the hypothesis that some of those whose employment status had changed used their additional free time to play sport. Fourth, individual sports, which tend to be more expensive, were the activities to be hit, with team sports not displaying the same fall in participation. Lastly, participation in individual sports fell only among people in the lower half of the income distribution.
From a policy perspective, there is an important issue here. The analysis suggests that economic factors drove the drop in participation. But the impact has nevertheless fallen disproportionately on a particular social group: young men of lower income. In a severe recession, this is a particularly vulnerable group and the fall in their sporting activity and associated loss of health and social benefits is a cause for concern.
The findings raise some clear questions about possible policy responses: Can anything be done to make activities more affordable? Can policy assist those out of work to be active and to increase their social capital through sport? How might policy ensure that participation picks up again when the economy recovers?
We consider these issues further in the final chapter. In the meantime, there are further research questions to be answered: Has social participation been affected too? Which specific sporting activities have been hit? Are specific activities linked with unemployment? Have the newly unemployed also engaged in more social participation?.
Figure 3.7: Playing of individual and team sports by quarter, 2007 and 2008
5%
1015202530
0
Team
Individual
Q408
Q308
Q208
Q108
Q407
Q307
Q207
Q107
Figure 3.8: Playing of individual and team sports by quarter, 2007 and 2008
0
5
10
15
20
Individual
Under €750 p.w.
Team
08Q3&4
08Q1&2
07Q3&4
07Q1&2
%
Over €750 p.w.
10
%
1520253035
50
08Q3&4
08Q1&2
07Q3&4
07Q1&2

20
4. The Impact on Social Participation
Summary• Headline rates of volunteering (7.8%) and club membership (32.4%) held up in 2008, but attendance at
sporting events fell significantly (16.7 to 15.0%)
• Men took on more of the volunteering associated with their children’s sport, with women doing less
• The relationship between club membership and income strengthened – the less well-off became much less likely to be club members than the better off
• Those living in isolated locations had the largest falls in the likelihood of volunteering or attending sporting events
IntroductionWhile the primary concern of policy is to increase active participation in sport and exercise, aiming to capture both the health and social benefits of sporting activity, it is important also to consider social participation. We look at three forms of social participation: volunteering for sport, membership of sports clubs and attendance at sporting events.
Key ResultsFigure 4.1 provides headline levels of volunteering, membership and attendance in 2007 and 2008. There was a marginal decrease in volunteering in 2008, a marginal increase in membership and a greater decrease in attendance. Only the last of these changes was statistically significant (p = 0.005). Some press reports have suggested that the amount of volunteering in Ireland has increased during the recession. This may or may not be true, but we can find no evidence for it (at least by the end of 2008) with respect to volunteering for sport, which is the most common form of voluntary activity (NESF, 2003).
On the face of it, social participation appears to have undergone less change than physical participation, although the fall of 1.7 percentage points amounts to one in every ten spectators in 2007 no longer attending in 2008. Considering active participation and all three forms of social participation together, 50.2% of the population had some kind of involvement in sport during the previous seven days in 2007, compared with 48.0% in 2008.
However, while the headline rates of social participation did not change greatly, a more detailed analysis reveals that there were changes in the relationships between the different forms of social participation and different social groups. We will consider each form of participation in turn. The results shown are those that prove to be significant when multivariate models are constructed, using the same methodology as applied in the previous chapter and described more fully in Lunn et al. (2009). In addition to the results reported in this chapter, we also examined effects of employment status on each form of social participation, which are described separately in Chapter 7.
Figure 4.1: Volunteering, membership and attendance in 2007 and 2008
0%
5
10
15
20
25
30
35
200820072008200720082007
Volunteer AttendeeMember
8.2 7.8
31.5 32.4
16.7 15.0
21
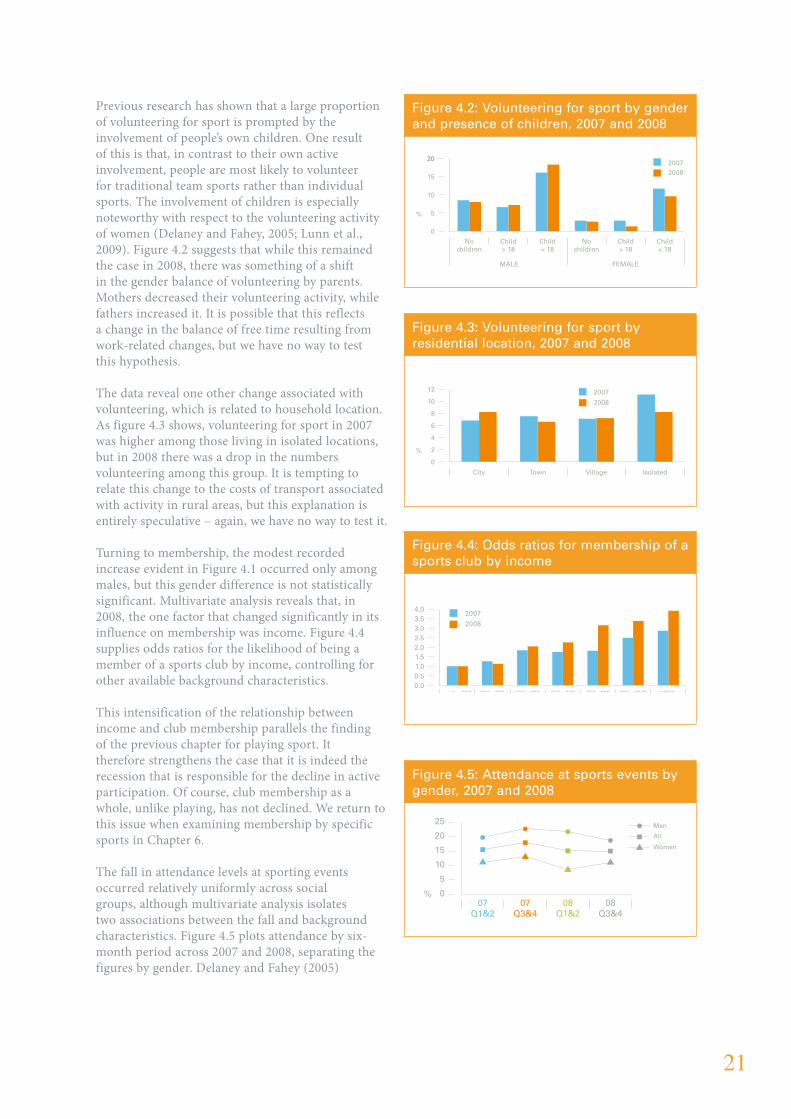
Previous research has shown that a large proportion of volunteering for sport is prompted by the involvement of people’s own children. One result of this is that, in contrast to their own active involvement, people are most likely to volunteer for traditional team sports rather than individual sports. The involvement of children is especially noteworthy with respect to the volunteering activity of women (Delaney and Fahey, 2005; Lunn et al., 2009). Figure 4.2 suggests that while this remained the case in 2008, there was something of a shift in the gender balance of volunteering by parents. Mothers decreased their volunteering activity, while fathers increased it. It is possible that this reflects a change in the balance of free time resulting from work-related changes, but we have no way to test this hypothesis.
The data reveal one other change associated with volunteering, which is related to household location. As figure 4.3 shows, volunteering for sport in 2007 was higher among those living in isolated locations, but in 2008 there was a drop in the numbers volunteering among this group. It is tempting to relate this change to the costs of transport associated with activity in rural areas, but this explanation is entirely speculative – again, we have no way to test it.
Turning to membership, the modest recorded increase evident in Figure 4.1 occurred only among males, but this gender difference is not statistically significant. Multivariate analysis reveals that, in 2008, the one factor that changed significantly in its influence on membership was income. Figure 4.4 supplies odds ratios for the likelihood of being a member of a sports club by income, controlling for other available background characteristics.
This intensification of the relationship between income and club membership parallels the finding of the previous chapter for playing sport. It therefore strengthens the case that it is indeed the recession that is responsible for the decline in active participation. Of course, club membership as a whole, unlike playing, has not declined. We return to this issue when examining membership by specific sports in Chapter 6.
The fall in attendance levels at sporting events occurred relatively uniformly across social groups, although multivariate analysis isolates two associations between the fall and background characteristics. Figure 4.5 plots attendance by six-month period across 2007 and 2008, separating the figures by gender. Delaney and Fahey (2005)
Figure 4.4: Odds ratios for membership of a sports club by income
0.00.51.01.52.02.53.03.54.0
€1250+900 - 1249750 - 899500 - 749400 - 499300 - 399under 300
2007
2008
Figure 4.2: Volunteering for sport by gender and presence of children, 2007 and 2008
0
5
10
15
2020072008
Child< 18
Child> 18
Nochildren
Child< 18
Child> 18
Nochildren
MALE FEMALE
20
%
Figure 4.5: Attendance at sports events by gender, 2007 and 2008
5
%
10
15
20
25
0
Women
Men
All
08Q3&4
08Q1&2
07Q3&4
07Q1&2
Figure 4.3: Volunteering for sport by residential location, 2007 and 2008
0
2
4
6
8
10
12
IsolatedVillageTownCity
2007
2008
%
22
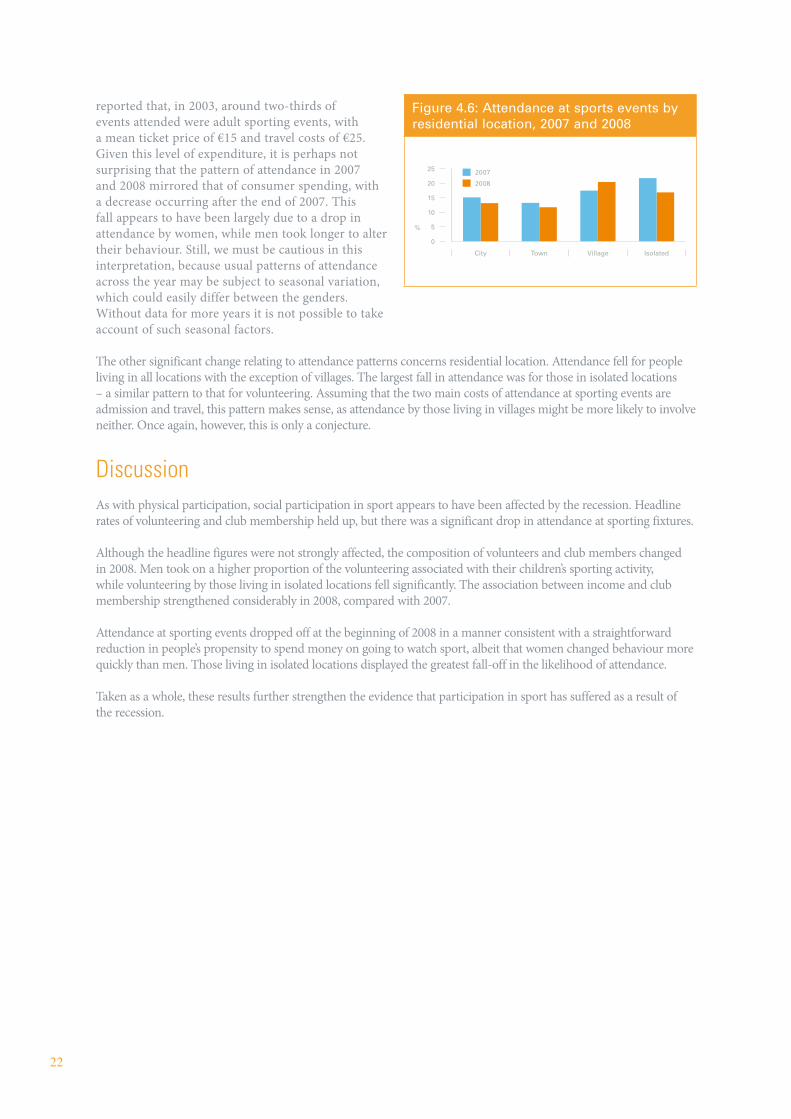
reported that, in 2003, around two-thirds of events attended were adult sporting events, with a mean ticket price of €15 and travel costs of €25. Given this level of expenditure, it is perhaps not surprising that the pattern of attendance in 2007 and 2008 mirrored that of consumer spending, with a decrease occurring after the end of 2007. This fall appears to have been largely due to a drop in attendance by women, while men took longer to alter their behaviour. Still, we must be cautious in this interpretation, because usual patterns of attendance across the year may be subject to seasonal variation, which could easily differ between the genders. Without data for more years it is not possible to take account of such seasonal factors.
The other significant change relating to attendance patterns concerns residential location. Attendance fell for people living in all locations with the exception of villages. The largest fall in attendance was for those in isolated locations – a similar pattern to that for volunteering. Assuming that the two main costs of attendance at sporting events are admission and travel, this pattern makes sense, as attendance by those living in villages might be more likely to involve neither. Once again, however, this is only a conjecture.
DiscussionAs with physical participation, social participation in sport appears to have been affected by the recession. Headline rates of volunteering and club membership held up, but there was a significant drop in attendance at sporting fixtures.
Although the headline figures were not strongly affected, the composition of volunteers and club members changed in 2008. Men took on a higher proportion of the volunteering associated with their children’s sporting activity, while volunteering by those living in isolated locations fell significantly. The association between income and club membership strengthened considerably in 2008, compared with 2007.
Attendance at sporting events dropped off at the beginning of 2008 in a manner consistent with a straightforward reduction in people’s propensity to spend money on going to watch sport, albeit that women changed behaviour more quickly than men. Those living in isolated locations displayed the greatest fall-off in the likelihood of attendance.
Taken as a whole, these results further strengthen the evidence that participation in sport has suffered as a result of the recession.
Figure 4.6: Attendance at sports events by residential location, 2007 and 2008
0
5
10
15
20
25
2008
2007
IsolatedVillageTownCity
%

23
5. Which Sports are Being Played Less?
Summary• Personal exercise activity (gym, exercise classes etc.) declined significantly and is no longer the most
common sporting activity, which is once again swimming
• Among men, individual sports and soccer declined significantly, while only rugby increased participation
• Among women, participation in all popular individual sports declined, while participation in all team sports increased
IntroductionDifferent sporting activities cost different amounts to play. Chapter 2 revealed that individual sports have suffered the largest decline in active participation in 2008, compared with 2007. This is in keeping with the observation that club membership and other expenses associated with popular individual sports, such as going to the gym and golf, are much higher than expenses associated with traditional team sports. This chapter explores these matters further, by looking at changes in participation rates at the level of specific sporting activities.
Key ResultsActive participation rates for the most popular ten sports are given in Figure 5.1 (top panel), for both 2007 and 2008, together with the percentage point change between years (bottom panel). The activities are: personal exercise, swimming, soccer, golf, jogging, cycling, Gaelic football, dancing, hurling/camogie and rugby.
Figure 5.1: Playing by specific sporting activity, 2007 and 2008
012345678 2007
Change 2007 - 08
2008
RugHurDanG FtCycJogGolfSocExeSwim
-2.0-1.5-1.0-0.50.00.51.0
6.7
-1.60-0.61 -0.70 -0.61 -0.28 -0.64 -0.05 -0.78
0.57 0.58
6.15.7
5.24.6
2.8
1.92.3
1.1
1.8 1.5
7.3
5.95.2
3.12.5 2.3
1.91.3
0.9%
% p
oin
ts
24
The most eye-catching change is a sharp and statistically significant fall in the level of participation in personal exercise activities. Indeed, this is the only change for a single specific activity in Figure 5.1 that is itself statistically significant. It is socially significant too. Personal exercise activities have grown consistently and strongly in popularity in Ireland over a 20 year period, from a relatively low base in the mid-1980s (Lunn and Layte, 2008), to become the sporting activity with the highest participation rate by 2007. Their place at the top of the list has proved to be short-lived; however, as swimming has once again become the most common activity, as it was in 2003.
While none of the other changes for specific activities is statistically significant, there is a general pattern that is, which is consistent with Figure 3.6 above: participation fell in every one of the top individual sports. The picture for the most common team sports is more mixed.
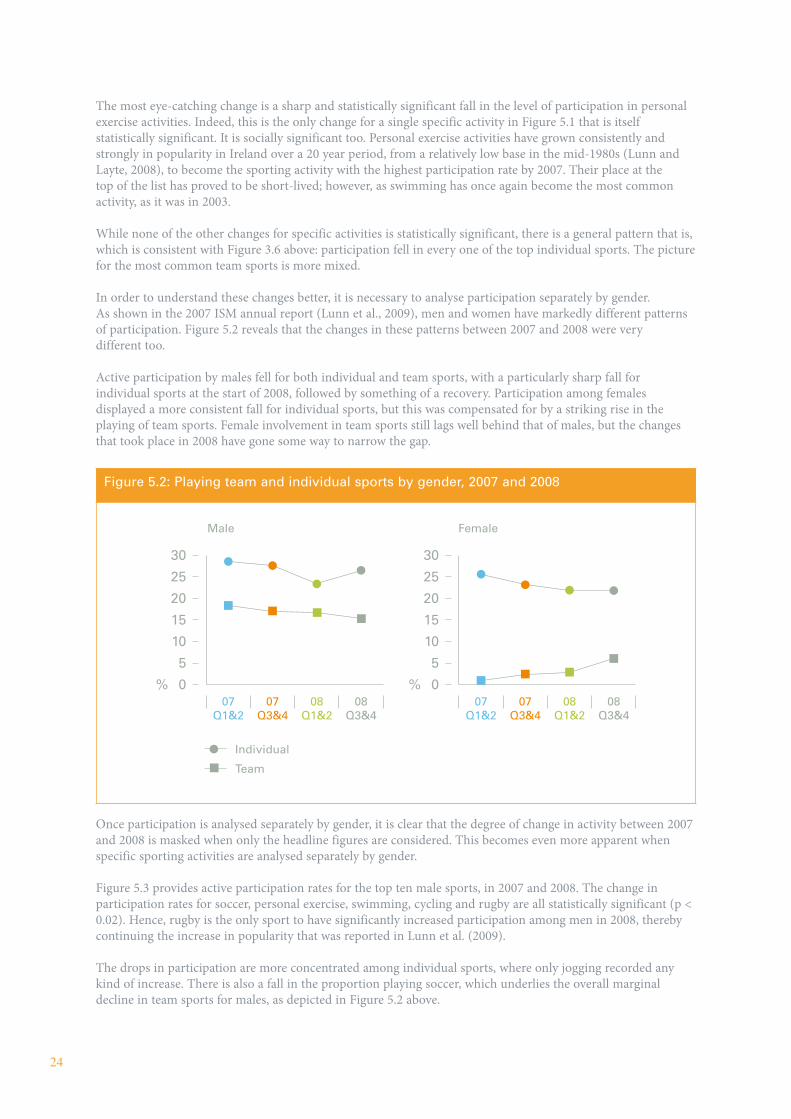
In order to understand these changes better, it is necessary to analyse participation separately by gender. As shown in the 2007 ISM annual report (Lunn et al., 2009), men and women have markedly different patterns of participation. Figure 5.2 reveals that the changes in these patterns between 2007 and 2008 were very different too.
Active participation by males fell for both individual and team sports, with a particularly sharp fall for individual sports at the start of 2008, followed by something of a recovery. Participation among females displayed a more consistent fall for individual sports, but this was compensated for by a striking rise in the playing of team sports. Female involvement in team sports still lags well behind that of males, but the changes that took place in 2008 have gone some way to narrow the gap.
Once participation is analysed separately by gender, it is clear that the degree of change in activity between 2007 and 2008 is masked when only the headline figures are considered. This becomes even more apparent when specific sporting activities are analysed separately by gender.
Figure 5.3 provides active participation rates for the top ten male sports, in 2007 and 2008. The change in participation rates for soccer, personal exercise, swimming, cycling and rugby are all statistically significant (p < 0.02). Hence, rugby is the only sport to have significantly increased participation among men in 2008, thereby continuing the increase in popularity that was reported in Lunn et al. (2009).
The drops in participation are more concentrated among individual sports, where only jogging recorded any kind of increase. There is also a fall in the proportion playing soccer, which underlies the overall marginal decline in team sports for males, as depicted in Figure 5.2 above.
Figure 5.2: Playing team and individual sports by gender, 2007 and 2008
0
5
10
15
20
25
30
Individual
Team
08Q3&4
08Q1&2
07Q3&4
07Q1&2
0% %
5
10
15
20
25
30
08Q3&4
08Q1&2
07Q3&4
07Q1&2
Male Female
25
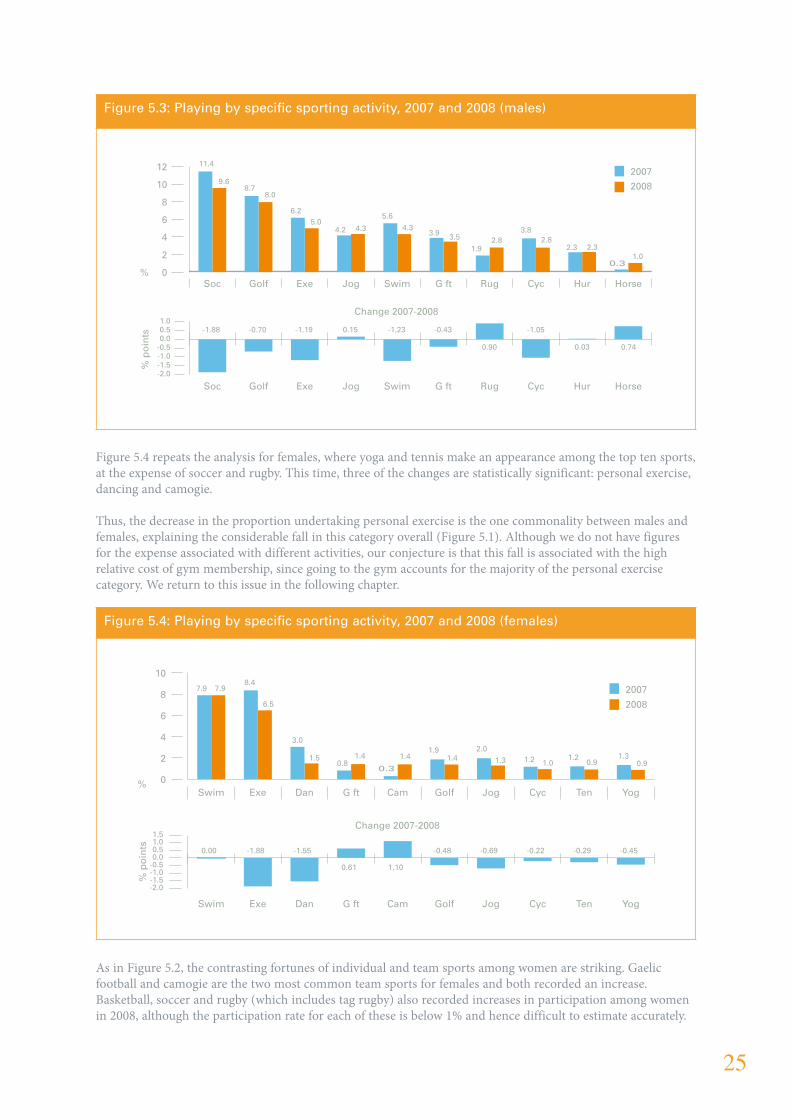
Figure 5.4 repeats the analysis for females, where yoga and tennis make an appearance among the top ten sports, at the expense of soccer and rugby. This time, three of the changes are statistically significant: personal exercise, dancing and camogie.
Thus, the decrease in the proportion undertaking personal exercise is the one commonality between males and females, explaining the considerable fall in this category overall (Figure 5.1). Although we do not have figures for the expense associated with different activities, our conjecture is that this fall is associated with the high relative cost of gym membership, since going to the gym accounts for the majority of the personal exercise category. We return to this issue in the following chapter.
As in Figure 5.2, the contrasting fortunes of individual and team sports among women are striking. Gaelic football and camogie are the two most common team sports for females and both recorded an increase. Basketball, soccer and rugby (which includes tag rugby) also recorded increases in participation among women in 2008, although the participation rate for each of these is below 1% and hence difficult to estimate accurately.
Figure 5.3: Playing by specific sporting activity, 2007 and 2008 (males)
-2.0-1.5-1.0-0.50.00.51.0
0%
2
4
6
8
10
12 2007
2008
HorseHurCycRugG ftSwimJogExeGolfSoc
HorseHurCycRugG ftSwim
Change 2007-2008
JogExeGolfSoc
-1.88 -0.70 -1.19 0.15 -1.23 -0.43
0.90
-1.05
0.03 0.74
% p
oin
ts
11.4
8.7
6.2
4.2
5.6
3.9
1.9
3.8
2.3
0.3
9.6
8.0
5.04.3 4.3
3.5 2.8 2.82.3
1.0
Figure 5.4: Playing by specific sporting activity, 2007 and 2008 (females)
0
2
4
6
8
10
YogTenCycJogGolfCamG ftDanExeSwim
YogTenCycJogGolfCamG ftDanExeSwim
-2.0-1.5-1.0-0.50.00.51.01.5
0.00 -1.88 -1.55
0.61 1.10
-0.48 -0.69 -0.22 -0.29 -0.45
7.98.4
3.0
0.80.3
1.9 2.01.2 1.2 1.3
7.9
6.5
1.5 1.4 1.4 1.4 1.3 1.0 0.9 0.9
2007
2008
%
% p
oin
ts
Change 2007-2008

26
We know from life-course analysis of sporting activity that people tend to substitute individual activities for team activities as they get older and, furthermore, that females tend to do this at an earlier age than males, dropping out from team sport in large numbers from their mid-teens onwards (Lunn and Layte, 2008). One possibility, then, is that between 2007 and 2008 young women delayed this transition, perhaps for reasons of expense associated with gyms, exercise and dance classes, or other forms of exercise that in previous years they have switched to.
Because the playing of team sports is so concentrated among young adult women, it is possible to produce a crude but nevertheless insightful test of this hypothesis, by looking at playing team sport by individual year of age among women aged 16 – 21. The data are fairly noisy, because the sample sizes for individual years of age are low, but the pattern is discernable and is presented in Figure 5.5. The left-hand panel provides the proportions of women of each age who played a team sport in the previous seven days, for 2007 and 2008. The right-hand panel adjusts the data by assuming that women did not change their sporting habits in the intervening year, that is, by simply adding one year to the age of the women in 2007
What is quite striking about this image is that the assumption that women delayed dropping out of team sport (either in favour of an alternative individual sport, or otherwise) accounts for a sizeable amount of the difference in participation in team sports by young women between 2007 and 2008 – it brings the data closer into line. But it only accounts for about half of the overall difference. In other words, part of the story seems to be that young women delayed dropping out from team sport relative to previous years, but at least an equivalent part of the story is that women in this age group increased participation in team sports between 2007 and 2008.
It is very difficult to say what was behind this change. It might be contended that the data merely reflect growing popularity of team sports among young women, but this explanation ignores the fact that the increased participation in team sports coincides with declines in participation in individual sports, suggesting that while the change could be partly to do with preferences, it very likely reflects a degree of necessity.
Early adulthood is usually a period of many transitions: leaving school, perhaps going to college, joining the labour force, leaving home or relocating. It may be that the current economic climate has reduced the likelihood of some of these transitions and that this has contributed to something of a reversal in previous sporting trends. It will be interesting to see whether this pattern continues in 2009
Figure 5.5: Female participation in team sport, 2007 and 2008
0%
10
20
30
40
50
2008
2007
21201918171621201918
Standard comparison 2007 data with one year added
1716

27
DiscussionPersonal exercise is no longer the most prevalent sporting activity, having fallen among both men and women between 2007 and 2008. Swimming has returned to the top of the list of most common sporting activities.
Among men, only rugby saw an increase in participation, with participation in individual sports and soccer declining. Women, meanwhile, participated less in individual sports but more in team sports in 2008. Indeed, were it not for the increased female participation in team sports, they too would have recorded a statistically significant decline. Despite all these changes, however, individual sports remain by far the most popular type of activity overall, because they appeal right across the age spectrum rather than primarily to young adults.
Combining these patterns with the preceding analysis in Chapters 3 and 4, it appears very likely that economic forces have played a role in determining the type of activities undertaken. Individual sports, especially going to the gym, taking exercise classes or playing golf are expensive in comparison to other activities. Given that the recession has continued and perhaps worsened since the end of 2008, there is a chance that these trends, or something similar, will continue in 2009.
28
6. Changing Patterns of Social Participation
Summary• The GAA remains the predominant organisation for volunteering, although volunteering associated with
team sports fell marginally in 2008
• At least one in every seven members of a gym (or health/fitness club) in 2007 gave up their membership in 2008
• Lower gym membership and a rise in female GAA members made GAA membership the most common form of club membership once again
• For team sports, attendance at matches has fallen, especially for Gaelic football
IntroductionGiven the changes in levels of playing for different sporting activities, it would seem quite likely that social participation in different activities may also have been strongly affected in 2008. This chapter examines the issue, taking each form of social participation in turn.
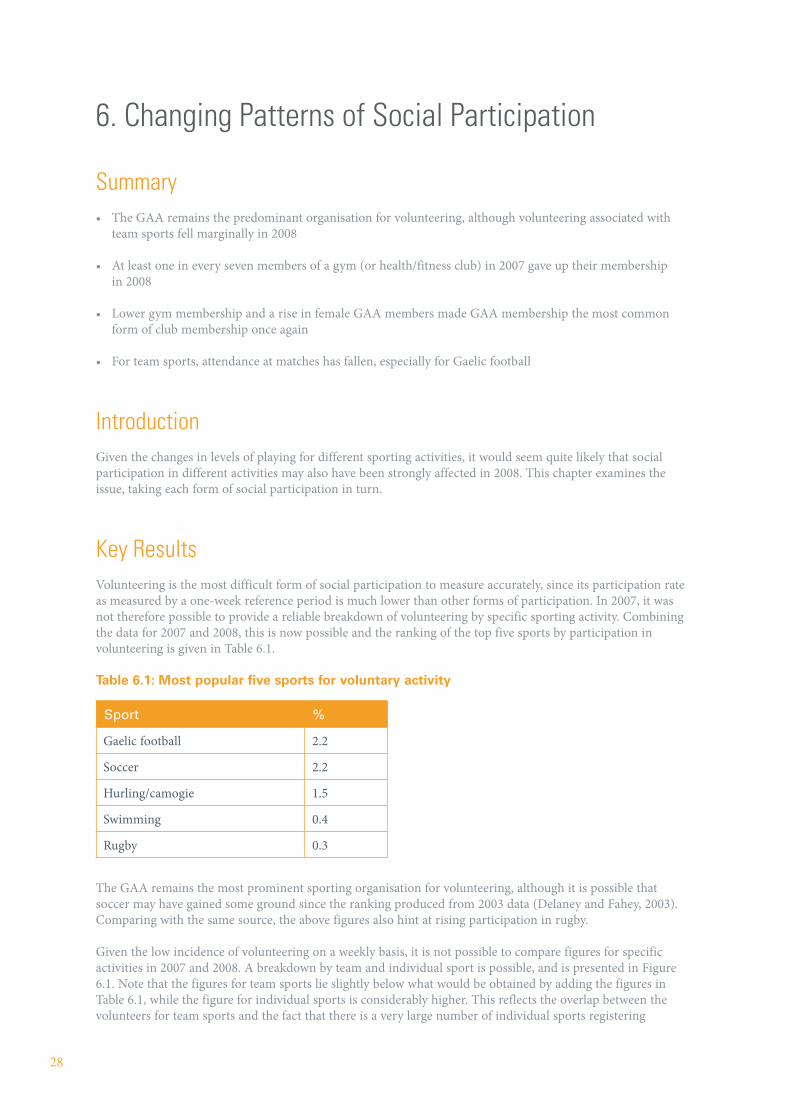
Key ResultsVolunteering is the most difficult form of social participation to measure accurately, since its participation rate as measured by a one-week reference period is much lower than other forms of participation. In 2007, it was not therefore possible to provide a reliable breakdown of volunteering by specific sporting activity. Combining the data for 2007 and 2008, this is now possible and the ranking of the top five sports by participation in volunteering is given in Table 6.1.
Table 6.1: Most popular five sports for voluntary activity
Sport %
Gaelic football 2.2
Soccer 2.2
Hurling/camogie 1.5
Swimming 0.4
Rugby 0.3
The GAA remains the most prominent sporting organisation for volunteering, although it is possible that soccer may have gained some ground since the ranking produced from 2003 data (Delaney and Fahey, 2003). Comparing with the same source, the above figures also hint at rising participation in rugby.
Given the low incidence of volunteering on a weekly basis, it is not possible to compare figures for specific activities in 2007 and 2008. A breakdown by team and individual sport is possible, and is presented in Figure 6.1. Note that the figures for team sports lie slightly below what would be obtained by adding the figures in Table 6.1, while the figure for individual sports is considerably higher. This reflects the overlap between the volunteers for team sports and the fact that there is a very large number of individual sports registering

29
low volunteering rates, which when summated produce the numbers in Figure 6.1.The fall in volunteering associated with team sports is marginally statistically significant (p = 0.08).
Turning to club membership, participation rates for the top seven sports are charted in Figure 6.2. The changes in membership for personal exercise, GAA, soccer and rugby are all statistically significant. Of these, it is again the personal exercise category that is most telling. Memberships in this category are of gyms or health/fitness centres. In a single year, the data suggests that at least one in every seven individuals who was a member of such a club in 2007 was no longer a member in 2008 – a dramatic fall.
This fall, combined with an increase in members of GAA clubs, has resulted in GAA membership once again becoming the most common form of sports club membership Ireland, as it was in 2003.
Similarly to the breakdowns for playing sport, it is necessary to break the data down further, by gender, in order to gain sufficient insight into the forces driving the membership rates. Figure 6.3 provides the rates for males. Two additional aspects of this chart are noteworthy. First, the rise of rugby is again apparent. Second, the membership figures for soccer seem at odds with the figures for playing. There was a rise in membership, but a fall in playing (Figure 5.3, above).
At first sight this pattern appears odd, but further analysis can make some sense of it. Many of the additional members of soccer clubs in 2008 were older members, suggesting that their membership is primarily about spectating rather than playing. In 2007, just under 70% of soccer club members had played the game in the previous week, whereas in 2008 this figure had fallen to under 60%. The pattern may therefore reflect the fact that while some younger men who actively participated have ceased involvement, there are more older men with free time on their hands who wish to spend some of it watching soccer matches or socialising at the soccer club.
The equivalent breakdown of membership for women is provided in Figure 6.4, for the six most common forms of membership. As well as the large fall in members of gyms and health/fitness clubs, there is a significant rise in GAA members. This finding parallels the increased playing by young women of team sports and the related decline in individual sports, as highlighted in the previous chapter. Comparing Figures 6.3 and 6.4 shows that the increase in GAA membership between 2007 and 2008 is, in fact, an entirely female phenomenon. It also shows that, just as with playing, membership rates associated with team sport have generally done very much better than those associated with individual sports
Figure 6.1: Volunteering by type of sport, 2007 and 2008
0%12345678
2008200720082007
Team Individual
6.35.6
2.4 2.5
Figure 6.2: Club membership by type of sport, 2007 and 2008
0%
2
4
6
8
10
2008
2007
TennisSwimmingRugbySoccerGolfExerciseGAA
8.5
9.8
5.8
4.2
1.5 1.91.2
9.58.4
5.6 5.4
2.1 1.91.0
Figure 6.3: Club membership by type of sport, 2007 and 2008 (males)
0%
3
6
9
12
15
2008
2007
MixSwimmingRugbyExerciseGolfSoccerGAA
7.99.5
7.9
2.81.4
0.7
9.9 9.3
7.1
3.9
1.71.0
14.0 14.0
Figure 6.4: Club membership by type of sport, 2007 and 2008 (females)
2008
2007
0%
2
4
6
8
10
12
TennisBadmintonGolfSwimmingGAAExercise
11.6
3.22.3 2.1
0.31.4
9.7
5.1
2.1 1.91.0 1.0
30
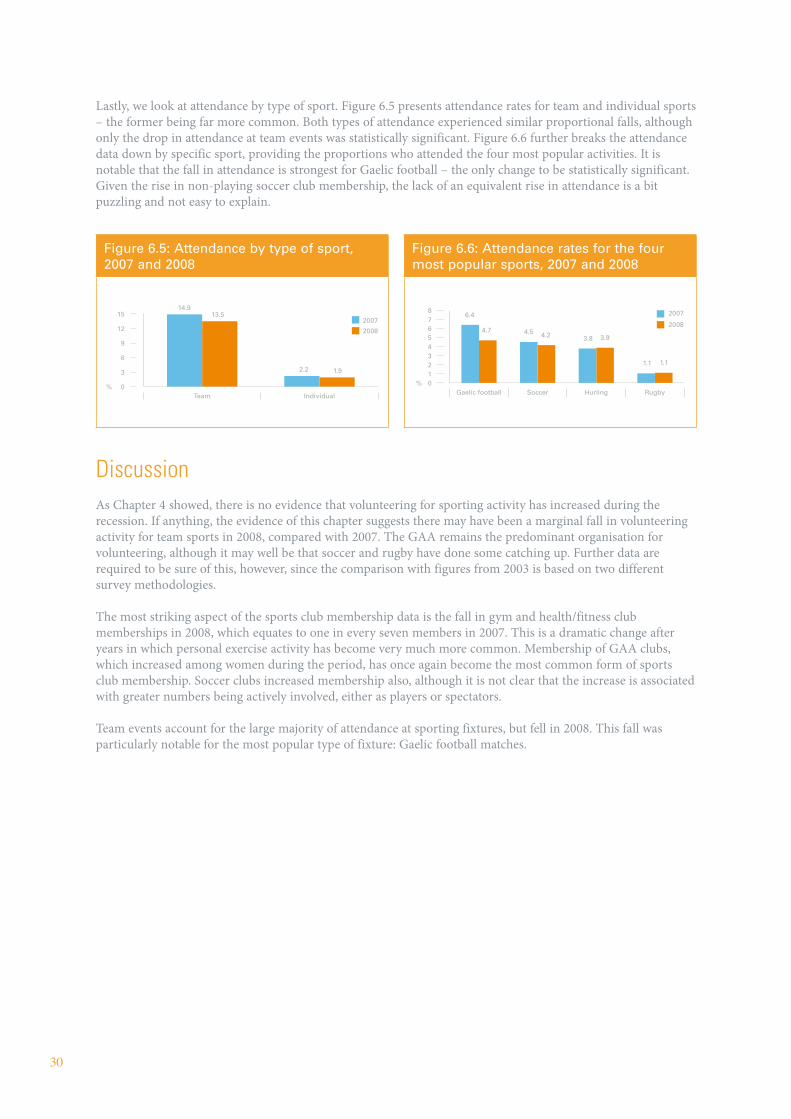
Lastly, we look at attendance by type of sport. Figure 6.5 presents attendance rates for team and individual sports – the former being far more common. Both types of attendance experienced similar proportional falls, although only the drop in attendance at team events was statistically significant. Figure 6.6 further breaks the attendance data down by specific sport, providing the proportions who attended the four most popular activities. It is notable that the fall in attendance is strongest for Gaelic football – the only change to be statistically significant. Given the rise in non-playing soccer club membership, the lack of an equivalent rise in attendance is a bit puzzling and not easy to explain.
DiscussionAs Chapter 4 showed, there is no evidence that volunteering for sporting activity has increased during the recession. If anything, the evidence of this chapter suggests there may have been a marginal fall in volunteering activity for team sports in 2008, compared with 2007. The GAA remains the predominant organisation for volunteering, although it may well be that soccer and rugby have done some catching up. Further data are required to be sure of this, however, since the comparison with figures from 2003 is based on two different survey methodologies.
The most striking aspect of the sports club membership data is the fall in gym and health/fitness club memberships in 2008, which equates to one in every seven members in 2007. This is a dramatic change after years in which personal exercise activity has become very much more common. Membership of GAA clubs, which increased among women during the period, has once again become the most common form of sports club membership. Soccer clubs increased membership also, although it is not clear that the increase is associated with greater numbers being actively involved, either as players or spectators.
Team events account for the large majority of attendance at sporting fixtures, but fell in 2008. This fall was particularly notable for the most popular type of fixture: Gaelic football matches.
Figure 6.5: Attendance by type of sport, 2007 and 2008
0%
3
6
9
12
15
2008
2007
IndividualTeam
14.9
2.2
13.5
1.9
Figure 6.6: Attendance rates for the four most popular sports, 2007 and 2008
0%12345678
2008
2007
RugbyHurlingSoccerGaelic football
6.4
4.53.8
1.1
4.74.2 3.9
1.1

31
7. Participation and Unemployment
Summary• There was an increase in participation rates among the unemployed for playing, volunteering and
membership, but not for attendance
• This pattern reflects people initially maintaining their sporting habits after leaving employment and perhaps increasing participation with additional free time
• But the marginal fall in attendance suggests that cost may ultimately matter and those unemployed for a longer period will find it hard to maintain participation
IntroductionChapter 3 showed that after controlling for income, there were significant changes in the effects of employment status on playing sport between 2007 and 2008. Those in self-employment and, especially, unemployment were more likely to play sport in 2008. This chapter takes a more detailed look at the role of unemployment on all forms of participation.
Initially, on becoming unemployed, an individual is quite likely to carry on their sporting habits from their time in employment. Thus, to a large extent the increased participation among the unemployed in a period of rapidly increasing unemployment merely reflects a change in the composition of the unemployed, rather than any change in individual behaviour. Those made newly unemployed may be more inclined to participate in sport, on account of having additional free time. The extent of the participation jump evident in Figures 3.4 and 3.6 above indicates this may indeed be a factor.
In the longer term, however, experience of unemployment may lead to a reduction in participation. This may occur because of a reduction in the level of resources available to the individual to fund participation, but research also shows that long term unemployment can bring with it a progressive rupturing of social attachments that can lead to withdrawal across a range of areas (Paugam 1996). Previous findings would suggest that the unemployed generally have lower rates of participation.
Unemployment may also impact on the kind of sports played. For example, gyms or swimming pools are likely to require memberships for continued use whereas others such as running require little more than an adequate pair of shoes and some running clothes. This may mean that individuals transfer between sports as their circumstances change.
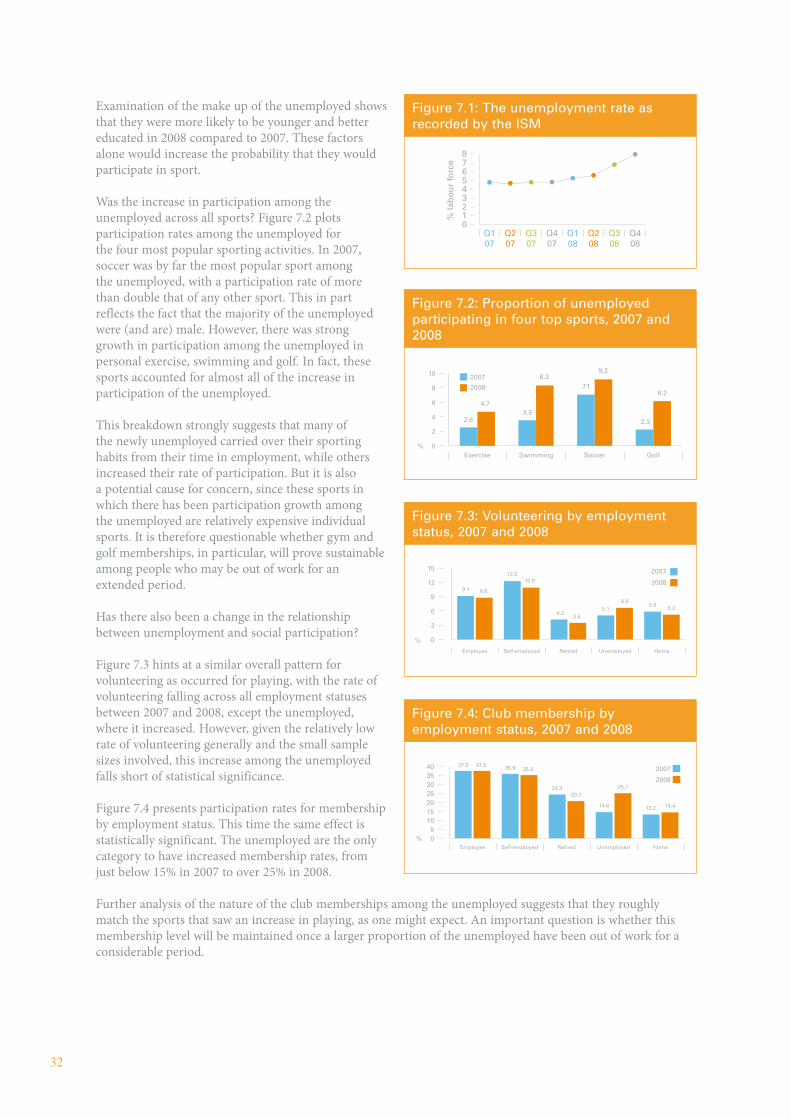
Key ResultsBefore looking in more detail, it is important to determine that the unemployed are adequately represented in the ISM, which after all is not explicitly designed to measure unemployment. Figure 7.1 plots the unemployment rate by quarter for 2007 and 2008, as measured by the ISM. The sharp rise recorded in the official figures is also evident in the ISM and, indeed, the precise figures throughout are a very close match to official CSO figures, according to which the unemployment rate reached 8% by the end of 2008.
32
Examination of the make up of the unemployed shows that they were more likely to be younger and better educated in 2008 compared to 2007. These factors alone would increase the probability that they would participate in sport.
Was the increase in participation among the unemployed across all sports? Figure 7.2 plots participation rates among the unemployed for the four most popular sporting activities. In 2007, soccer was by far the most popular sport among the unemployed, with a participation rate of more than double that of any other sport. This in part reflects the fact that the majority of the unemployed were (and are) male. However, there was strong growth in participation among the unemployed in personal exercise, swimming and golf. In fact, these sports accounted for almost all of the increase in participation of the unemployed.
This breakdown strongly suggests that many of the newly unemployed carried over their sporting habits from their time in employment, while others increased their rate of participation. But it is also a potential cause for concern, since these sports in which there has been participation growth among the unemployed are relatively expensive individual sports. It is therefore questionable whether gym and golf memberships, in particular, will prove sustainable among people who may be out of work for an extended period.
Has there also been a change in the relationship between unemployment and social participation?
Figure 7.3 hints at a similar overall pattern for volunteering as occurred for playing, with the rate of volunteering falling across all employment statuses between 2007 and 2008, except the unemployed, where it increased. However, given the relatively low rate of volunteering generally and the small sample sizes involved, this increase among the unemployed falls short of statistical significance.
Figure 7.4 presents participation rates for membership by employment status. This time the same effect is statistically significant. The unemployed are the only category to have increased membership rates, from just below 15% in 2007 to over 25% in 2008.
Further analysis of the nature of the club memberships among the unemployed suggests that they roughly match the sports that saw an increase in playing, as one might expect. An important question is whether this membership level will be maintained once a larger proportion of the unemployed have been out of work for a considerable period.
Figure 7.3: Volunteering by employment status, 2007 and 2008
%
2007
2008
0
3
6
9
12
15
HomeUnemployedRetiredSelf-employedEmployee
9.1
12.3
4.25.1
5.9
8.8
10.9
3.5
6.65.2
Figure 7.1: The unemployment rate as recorded by the ISM
Figure 7.2: Proportion of unemployed participating in four top sports, 2007 and 2008
0%
2
4
6
8
10 2007
2008
GolfSoccerSwimmingExercise
2.63.5
7.1
2.3
4.7
8.39.2
6.2
% la
bo
ur
forc
e
012345678
Q408
Q308
Q208
Q108
Q407
Q307
Q207
Q107
Figure 7.4: Club membership by employment status, 2007 and 2008
2007
2008
0%5
10152025303540
HomeUnemployedRetiredSelf-employedEmployee
37.5 35.9
24.3
14.6 13.2
37.535.2
20.725.1
14.4
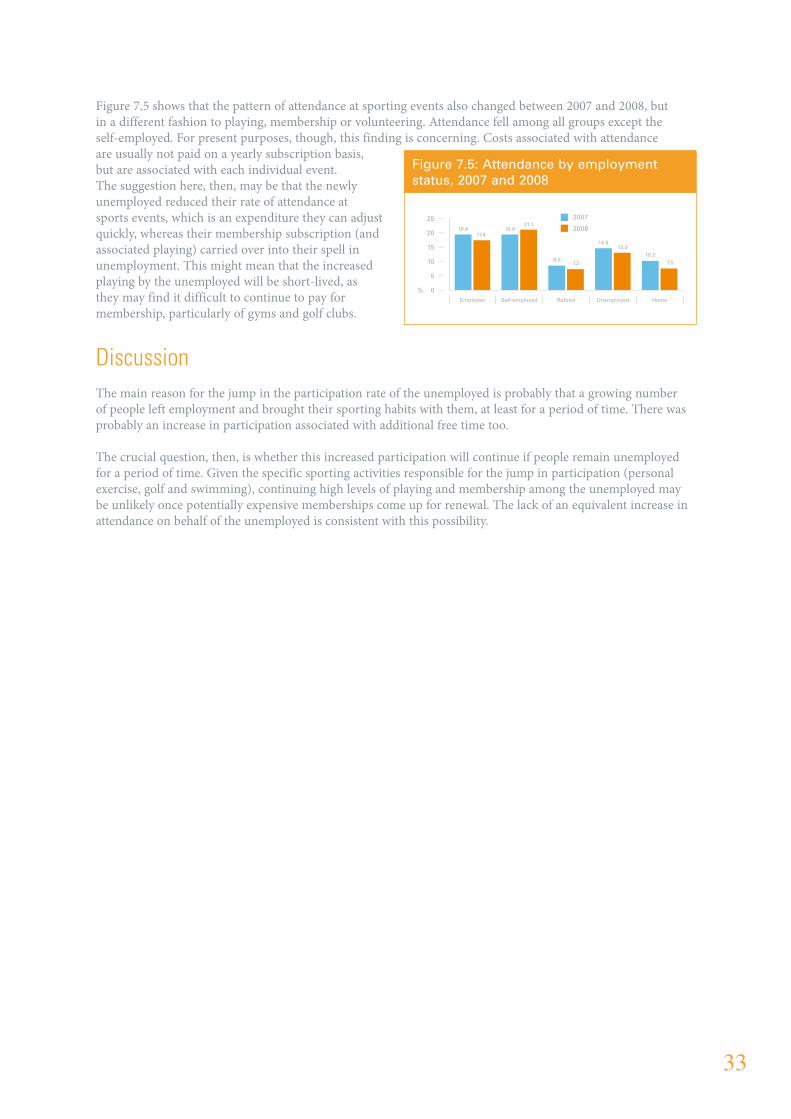
33
Figure 7.5 shows that the pattern of attendance at sporting events also changed between 2007 and 2008, but in a different fashion to playing, membership or volunteering. Attendance fell among all groups except the self-employed. For present purposes, though, this finding is concerning. Costs associated with attendance are usually not paid on a yearly subscription basis, but are associated with each individual event. The suggestion here, then, may be that the newly unemployed reduced their rate of attendance at sports events, which is an expenditure they can adjust quickly, whereas their membership subscription (and associated playing) carried over into their spell in unemployment. This might mean that the increased playing by the unemployed will be short-lived, as they may find it difficult to continue to pay for membership, particularly of gyms and golf clubs.
DiscussionThe main reason for the jump in the participation rate of the unemployed is probably that a growing number of people left employment and brought their sporting habits with them, at least for a period of time. There was probably an increase in participation associated with additional free time too.
The crucial question, then, is whether this increased participation will continue if people remain unemployed for a period of time. Given the specific sporting activities responsible for the jump in participation (personal exercise, golf and swimming), continuing high levels of playing and membership among the unemployed may be unlikely once potentially expensive memberships come up for renewal. The lack of an equivalent increase in attendance on behalf of the unemployed is consistent with this possibility.
Figure 7.5: Attendance by employment status, 2007 and 2008
2008
2007
0%
5
10
15
20
25
HomeUnemployedRetiredSelf-employedEmployee
19.4 19.4
8.5
14.6
10.2
17.4
21.1
7.3
13.0
7.5

34
Part Three:
Ireland’s Sporting Geography

35
8. Playing by County and Region
Summary• People in Dun Laoghaire-Rathdown (in particular), Waterford and Louth are more likely to play sport, while
people in Dublin City, Offaly and Westmeath (in particular) are less likely to play
• People in the Midlands region are less likely to play sport, because while the region has the highest proportion playing team sports, it has a far lower proportion playing individual sports
IntroductionThe ISM has sufficient sample size to compare levels of participation across counties and regions, but the sample is not large enough to allow accurate comparison of participation in 2007 with that in 2008 separately by county or region. In part this is because the population is so heavily concentrated in the Dublin region that even a large representative national sample will include insufficient observations for many counties and indeed some regions. Nevertheless, the increase in the accumulated sample between 2007 and 2008, from 9,767 to 16,596, does permit a refinement of the analysis presented on the basis of the 2007 data alone (Lunn et al., 2009). Specifically, we update the participation by county analysis, based on the larger sample covering both 2007 and 2008, and we also present an analysis by region that involves a breakdown by type of sport.
Key ResultsWe have chosen not to present raw participation rates by county, because the demographic structure and socio-economic characteristics of different counties vary so much that the comparison is misleading. Given the strong impact on the likelihood that people play sport of education, socio-economic status and age, as well as other background characteristics, a poor county with an older population and no large third-level institutions cannot possibly be expected to match the participation rate of a rich county with a young population, where a high proportion attends college or university.
Instead, we repeat the method of multivariate analysis described in Lunn et al. (2009), where we estimate the influence of county of residence on the likelihood that an individual plays sport, while simultaneously controlling for educational attainment, gender, age, income, employment status, occupation, marital status, presence of children, car ownership, residential location and nationality.
Figure 8.1 gives estimated odds ratios for the 30 local authority areas identified in the ISM survey, as they relate to the likelihood of having played sport in the previous seven days.3 The counties are labelled using the abbreviations used on car registration plates. The reference county is Cavan, which has the median influence on participation as measured by this method and takes the value 1.
3 That is, the 26 counties, with Dublin split into its four local authority areas and Tipperary North differentiated from Tipperary South.

36
The results are unsurprisingly similar to those presented in Lunn et al. (2009), although there are some differences. In fact, the majority of counties are so close together by this measure that the odds ratios for 20 of them only vary between 0.92 and 1.24. In the previous report we highlighted counties with particularly low or high participation, employing a statistical significance level of 10% relative to the median 10 counties. With 30 counties, it is obviously likely that a few would have been identified as high or low participation counties by chance. On this occasion, with the larger sample, we employ a more rigorous significance level of 5%. By this more strict criterion, living in Dublin City, Offaly and (especially) Westmeath continued to have a significantly negative influence on participation, while living in Dun Laoghaire-Rathdown continued to have a strong positive influence. Indeed, when the analysis is carried out separately for 2007 and 2008, in both years Dun Laoghaire-Rathdown comes out with the highest odds ratio and Westmeath the lowest. Still, with the larger sample and stricter criterion there are some changes from the 2007 analysis. Mayo, while still above average, slips back into the pack somewhat, while Waterford and Louth come into the reckoning for positive influence on participation.
These results are indicative of the variation in participation by county, but it is important not to read too much into them. Verification of the results once a still larger sample has accumulated, and once participation by county can be compared across datasets, is required before we can draw definitive conclusions.
A more robust analysis is now possible by region, however. The regions we employ correspond to the European Union’s “Nuts 3” classification, whereby Ireland is divided into eight regions. Table 8.1 lists the regions, the counties each contains, the population as determined by Census 2006 and the sample size for each region once the 2007 and 2008 ISM are combined. These samples still do not allow comparison of participation rates in subsequent years, but they do allow a much more definitive analysis across regions.
Table 8.1: The “Nuts 3” regions, counties therein, population and associated ISM sample
Border Dublin Mideast Midlands Midwest Southeast Southwest West
CavanDonegalLeitrimLouthMonaghanSligo
Dublin CityDun Laoghaire-RathdownFingalS. Dublin
KildareMeathWicklow
LaoisLongfordOffalyWestmeath
ClareLimerickN. Tipperary
CarlowKilkennyS. TipperaryWaterfordWexford
CorkKerry
GalwayMayoRoscommon
468,375 1,187,176 475,360 251,664 361,028 460,838 621,130 414,277
1,856 4,406 1,616 797 1,517 2,060 2,497 1,771
Figure 8.1: Estimated odds ratios for the likelihood of playing sport by county
Od
ds
rati
oO
dd
s ra
tio
0.0
0.5
1.0
1.5
2.0
CNCCED(S)KKKEGMORNMNDLWWLHWDD(DLR)
0.0
0.5
1.0
1.5
2.0
WMLMOYLDCWKYD(CC)D(F)MHWXTNLKLSTSSO
1.69
1.37 1.33 1.24 1.18 1.16 1.13 1.13 1.12 1.12 1.11 1.06 1.02 1.02 1.00
1.00 0.99 0.98 0.97 0.96 0.96 0.93 0.92 0.84 0.84 0.82 0.75 0.670.54
0.26
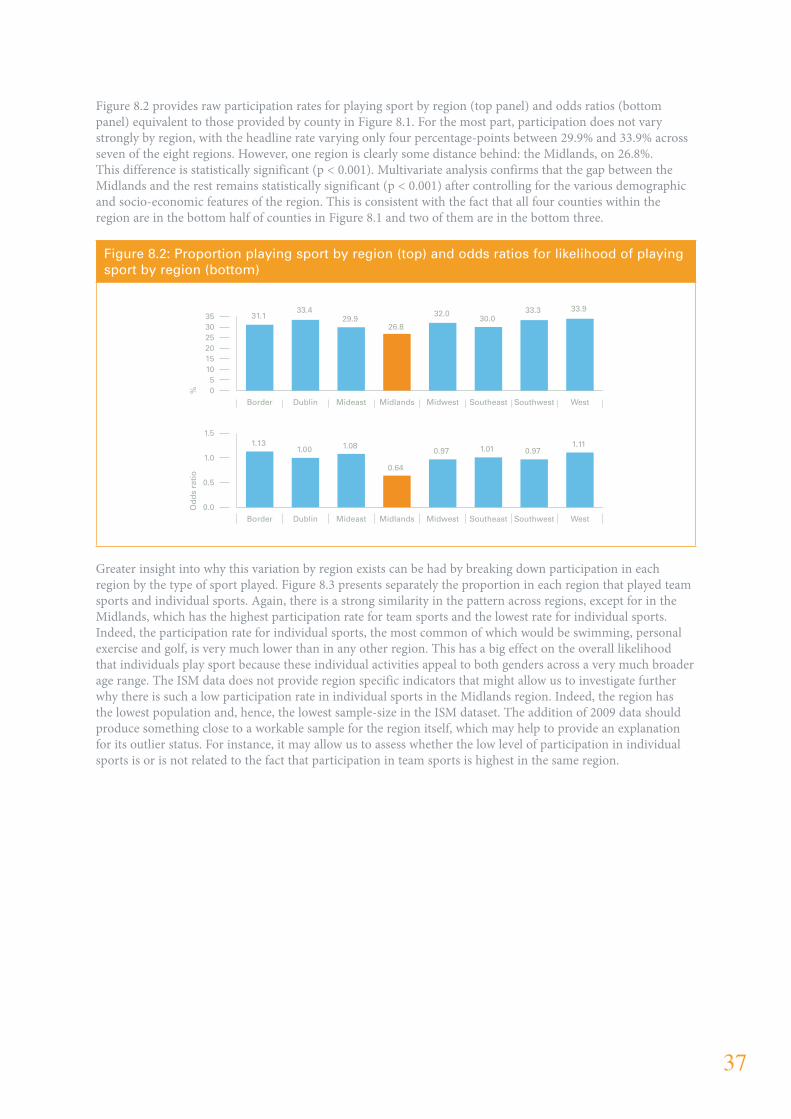
37
Figure 8.2 provides raw participation rates for playing sport by region (top panel) and odds ratios (bottom panel) equivalent to those provided by county in Figure 8.1. For the most part, participation does not vary strongly by region, with the headline rate varying only four percentage-points between 29.9% and 33.9% across seven of the eight regions. However, one region is clearly some distance behind: the Midlands, on 26.8%. This difference is statistically significant (p < 0.001). Multivariate analysis confirms that the gap between the Midlands and the rest remains statistically significant (p < 0.001) after controlling for the various demographic and socio-economic features of the region. This is consistent with the fact that all four counties within the region are in the bottom half of counties in Figure 8.1 and two of them are in the bottom three.
Greater insight into why this variation by region exists can be had by breaking down participation in each region by the type of sport played. Figure 8.3 presents separately the proportion in each region that played team sports and individual sports. Again, there is a strong similarity in the pattern across regions, except for in the Midlands, which has the highest participation rate for team sports and the lowest rate for individual sports. Indeed, the participation rate for individual sports, the most common of which would be swimming, personal exercise and golf, is very much lower than in any other region. This has a big effect on the overall likelihood that individuals play sport because these individual activities appeal to both genders across a very much broader age range. The ISM data does not provide region specific indicators that might allow us to investigate further why there is such a low participation rate in individual sports in the Midlands region. Indeed, the region has the lowest population and, hence, the lowest sample-size in the ISM dataset. The addition of 2009 data should produce something close to a workable sample for the region itself, which may help to provide an explanation for its outlier status. For instance, it may allow us to assess whether the low level of participation in individual sports is or is not related to the fact that participation in team sports is highest in the same region.
Figure 8.2: Proportion playing sport by region (top) and odds ratios for likelihood of playing sport by region (bottom)
05
101520253035
WestSouthwestSoutheastMidwestMidlandsMideastDublinBorder
0.0
0.5
1.0
1.5
WestSouthwestSoutheastMidwestMidlandsMideastDublinBorder
Od
ds
rati
o%
31.133.4
29.926.8
32.030.0
33.3 33.9
1.131.00 1.08
0.64
0.97 1.01 0.971.11

38
DiscussionDespite the relatively large sample size of the ISM, the degree to which geographic variation in playing sport can be investigated is limited. Nevertheless, noteworthy findings can be obtained by comparing participation across counties and regions, if not within counties and regions over time.
In 2007 and 2008, people living in Dun Laoghaire-Rathdown had a substantially and significantly higher likelihood of playing sport than people living elsewhere in the country. Positive effects were also evident for counties Waterford and Louth. Those living in Westmeath had a substantially and significantly reduced likelihood of playing sport. Negative effects of living in Offaly and Dublin City were also identified. Some caution is appropriate in interpreting these results, as the samples and criteria employed are such that any one county may have a somewhat higher or lower level of participation than the ISM has recorded, although the strong performance of Dun Laoghaire-Rathdown and the weak performance of Westmeath are clearly more robust findings, given their strength and replication in both 2007 and 2008.
The Midlands region, consisting of counties Laois, Longford, Offaly and Westmeath, has considerably lower active participation in sport than the rest of the country. Interestingly, it has the highest participation in team sports, but very much lower participation in individual sports. The availability of 2009 data will create a more workable sample specific to the region that should allow greater insight into why participation takes a different form in the Midlands.
Figure 8.3: Proportion playing team and individual sports by region
0%
5
10
15
20
25
30
Team
Individual
WestSouthwestSoutheastMidwestMidlandsMideastDublinBorder
8.7 8.3 9.3
12.9
9.7 10.8 11.7 11.5
25.527.7
23.0
16.1
26.023.1 23.6
26.5

39
9. Regional Participation Differences for the Top 10 Sports
Summary• There is very considerable regional variation in the specific sporting activities undertaken
• Personal exercise, golf and Gaelic games display particularly striking patterns of participation across the regions
• Some well-known sporting strongholds can be seen, e.g. Munster rugby
IntroductionThe regional sample sizes for the combined 2007 and 2008 data vary from 797 in the Midlands region to 4,406 in Dublin (see Table 8.1 above), with all regions other the Midlands having a sample in excess of 1,500. These samples are large enough to provide indicative breakdowns of activity for the most popular 10 sports by region, which is the purpose of this chapter.
Key ResultsThe ten charts below provide participation rates by region for each of the ten most popular sports. Note that the precise participation rates are likely to be considerably less accurate than the national rates provided above for specific activities based on the sample as a whole. The following is a rule of thumb for interpreting the charts: for the Midlands region, with the smallest sample, the reported rates are likely to be accurate to within approximately ±1.5 percentage points; the rates for Dublin are likely to be accurate to within approximately ±0.7 percentage points; the rates for the other regions somewhere in between.4
We have chosen to present the data as variation across the eight regions, for each activity, in the participation rate (the proportion of people, expressed as a percentage, who played the sport within the previous seven days). Two other options for presenting the data were considered. First, it is possible to rank the ten activities by participation rate for each of the eight regions, as we have done nationally. This approach might be misleading, however, since the members of the list of the ten most popular activities is unlikely to be constant across the regions. An approximate ranking for each region can of course be obtained by comparing figures across Figures 9.1 – 9.10 below. The second alternative option would be to provide a breakdown of the players of each sport by region, i.e. to present the proportion of players of each sport that live in each of the eight regions. This picture might also be misleading, because Dublin has a population almost twice the size of any other region and over four-and-a-half times the size of the Midlands. If the research question of interest is “what is the likelihood that someone living in region X plays sport Y?”, then the participation rate by region is the best statistic.
A key point to note, then, is that the results do not necessarily indicate what might be termed “sporting strongholds”, because the size of the population needs to be borne in mind. For instance, the results show that participation in hurling/camogie is 3.5% in the Midlands and 3.4% in the Southeast, despite the fact that notable hurling counties such as Kilkenny are in the latter region. The data imply that the likelihood that an individual plays hurling/camogie is similar in the Midlands and the Southeast. But once population is taken into account (Table 8.1), the relevant estimates equate to just over 8,800 hurlers in the Midlands and almost 15,700 in the Southeast.
4 This, in fact, is an approximation of two standard errors for a participation rate of 5% based on the sample sizes for the regions. The standard error is somewhat bigger for higher rates like 8% and somewhat smaller for lower rates like 2%. Given the large number of rates presented and the amount of variation by region, we felt it best to stick with a rule of thumb such as that described.

40
Since the data from 2007 and 2008 are combined in this analysis, the activities are presented in order of popularity across both years, which are provided in the first column of each of the charts, rather than the most up-to-date participation rates for 2008 (given above in Figure 5.1). Turning to the most popular activity by this measure, there is a great deal of regional variation in the participation rates for personal exercise, with the Border, Midwest and Southwest regions having significantly higher participation and the Midlands very low participation.
The pattern of swimming is strikingly similar to that for personal exercise, although swimming is particular popular in the West.
Soccer produces a very different pattern, being most popular in the Southeast and Midlands, where personal exercise and swimming have relatively low participation.
Golf is significantly more prevalent in the Mideast, Southeast and Dublin. As a rough characterisation, golf appears to be about twice as popular in Leinster as in the rest of the country.
Participation in jogging is more uniformly distributed by region. (Note the change of scale from 0 – 10% for the four most popular sport, to 0 – 5% for the remaining six).
Figure 9.2: Active participation in swimming by region
0%
2
4
6
8
10
WestSouthwestSoutheastMidwestMidlandsMideastDublinBorderAll
6.47.4
5.7
4.3 4.2
8.8
4.5
7.88.8
Figure 9.3: Active participation in soccer by region
5.5 5.35.7
5.2
0%12345678
WestSouthwestSoutheastMidwestMidlandsMideastDublinBorderAll
7.3
3.4
7.7
6.2
5.0
Figure 9.1: Active participation in personal exercise by region
0%
2
4
6
8
10
WestSouthwestSoutheastMidwestMidlandsMideastDublinBorderAll
6.5
8.5
6.25.5
2.2
8.5
4.7
9.1
5.5
Figure 9.4: Active participation in golf by region
0%12345678
WestSouthwestSoutheastMidwestMidlandsMideastDublinBorderAll
4.9
3.5
6.2
7.4
3.7 3.4
6.9
2.9
4.4
Figure 9.5: Active participation in jogging by region
0%
1
2
3
4
5
WestSouthwestSoutheastMidwestMidlandsMideastDublinBorderAll
2.9 2.8 2.8
3.93.7
2.11.8
2.8
4.2

41
Gaelic football is particularly strong in the Midlands and Border region, but the most notable finding here is the very much lower participation rate in Dublin, at less than 1%. Given that almost 30% of the national population is in Dublin, this has a marked impact on the overall participation rate, which is much higher throughout the rest of the country.
Participation in cycling is relatively evenly distributed, albeit high in the Midwest and low in the Mideast.
Hurling/camogie displays more regional variation than any other sport. Participation in the Dublin and Border regions is very low, at less than 0.5%, but the game is much more popular in the Midlands, Southeast and Midwest.
There is little variation in dancing by region, although it is more popular in the Border, Midwest and West.
The traditional strength of Munster rugby can be seen by its relative popularity in the Midwest and Southwest but, like other team sports, it also has relatively high participation in the Midlands.
Figure 9.6: Active participation in Gaelic football by region
0%
1
2
3
4
5
WestSouthwestSoutheastMidwestMidlandsMideastDublinBorderAll
2.3
3.6
0.7
3.1
4.3
2.12.4
2.8 2.9
Figure 9.7: Active participation in cycling by region
0%
1
2
3
4
5
WestSouthwestSoutheastMidwestMidlandsMideastDublinBorderAll
2.21.9
2.7
1.1
1.7
3.5
2.0 1.9 1.7
Figure 9.8: Active participation in hurling/camogie by region
WestSouthwestSoutheastMidwestMidlandsMideastDublinBorderAll
1.6
0.4 0.4
1.4
3.5
2.8
3.4
1.3
2.1
0%
1
2
3
4
5
Figure 9.9: Active participation in dancing by region
WestSouthwestSoutheastMidwest
1.5
2.5
1.2
1.8
1.0
2.2
1.3 1.1
2.1
MidlandsMideastDublinBorderAll
0%
1
2
3
4
5
Figure 9.10: Active participation in rugby by region
WestSouthwestSoutheastMidwestMidlandsMideastDublinBorderAll
1.20.6
0.90.6
2.2 2.2
0.8
1.8
1.1
0%
1
2
3
4
5

42
DiscussionFor the most popular sporting activities, the extent of regional variation in active participation is extensive, perhaps surprisingly so. This information may be useful for the national governing bodies of sports and others involved in resourcing decisions.
Yet the snapshot of variation in activity provided above is nevertheless limited. Put simply, it is not clear what is driving the differences. Where participation in a particular sport is low in a given region, this may indicate untapped interest, such that improved organisation, marketing and opportunities to participate would increase involvement. On the other hand, some of the variation may be caused by differences in people’s preferences and tastes for sporting activities, perhaps reflecting the different traditions, identities and histories of regions, or even their geography and climate. To the extent that this is the case, efforts to increase participation may produce lower returns.
As the sample of the ISM builds, it may become possible to investigate in more detail what is driving the regional variation in the popularity of sports.
43
Part Four:
Participation and Disability

44
10. Sport, Health and Disability
Summary• Approximately 15% of adults have a long-term health problem, the majority of whom say it prevents them
from taking part in sport
• The effect of such health problems is greater among young adults and the over 65s, but narrows in middle-age
• People with long-term health problems who play sport are more likely to swim or play golf and very unlikely to play team sports
• Social participation is also lower among this group, although the participation gap is much narrower for attendance at events
IntroductionAlthough taking part in sport or physical exercise need not demand hard physical effort and agility, physical mobility will play a role. Those with a disability or a long-term or recurrent illness may find themselves unable to participate. Causation may not necessarily run in this direction, however. Lack of participation can be a factor in poorer health, often through weight gain and its consequences, such as Type 2 diabetes, but also through the loss of mobility that a sedentary lifestyle brings. Illness may also intervene in social participation, particularly if mobility is an issue. In this chapter we examine how health problems and disability interact with the different forms of participation in sport.
Key ResultsThe analysis is primarily based on a self-report question (Appendix, question C1), which asks whether respondents have any long-term illness, health problem or disability that limits daily activities or work. A further question asks those who respond “yes” whether the problem prevents them from taking part in sport and exercise. It is important to note, therefore, that we have no detail as to the nature of the health problem concerned, beyond the fact that the respondent reports that it limits their daily activity.
Overall, 15% of individuals who took part in the ISM survey in 2007 and 2008 reported that they did have such a health problem, while 12% (i.e. the large majority of the 15%) said they had a health problem that prevented their taking part in sport. This provides a sample of over 2,500 people with a long-term health problem, which we make extensive use of in this chapter.
As Figure 10.1 shows, the proportion of the population with a long-term health problem increases strongly with age to 38% of those aged over 65. Nevertheless, there are a non-negligible proportion of people with a long-term health problem among younger age groups.
Figure 10.1: Proportion with a long-term health problem by age
0%5
10152025303540
All66+56 - 6546 - 5536 - 4526 - 3516 - 25
3.05.7
11.6
18.9
28.2
38.4
14.9

45
A great deal of research both in Ireland and elsewhere has shown that those with a lower income, education or occupational class position also have worse health status. This is also true for individuals who took part in the ISM. If we employ multivariate analysis to control for age and gender, Figure 10.2 shows that those with lower levels of income have a much higher probability of having a long-term health problem. People in the highest income category have 85% lower odds of having such a problem than those in the lowest income group.
Previous research has shown that level of education and income are both strongly related to the probability of playing sport. Thus, those with a long-term health problem are not only less likely to participate on health grounds but are also less likely to participate by virtue of their lower incomes. Multivariate analysis suggests that both of these effects are powerful (Lunn et al., 2009).
Turning to playing sport, Figure 10.3 shows that having a long-term illness clearly impacts on playing, although this impact varies with age. The participation gap between those with and without a long-term health problem narrows somewhat in middle age, although it may widen a little again among those over 65. It is possible that this pattern with age reflects the type of health problem most likely to be encountered at each age, but we do not have the relevant information to test this hypothesis. Another possibility is that the especially sharp decline in the participation rate that occurs between the two youngest age groups is a reflection of how difficult it is for those with a long-term health problem to continue active participation in sport and physical exercise once they leave full-time education.
Among those with a long term health problem who do participate, the pattern of sports played is markedly different from the sports played by healthy people. Table 10.1 presents the top ten sports for people with a long-term health problem. Swimming and golf are the dominant activities, while team sports hardly feature at all.
Table 10.1: Most popular ten sports among those with a long-term health problem with participation rates
Sport %
Swimming 4.2Golf 3.2
Personal exercise 2.0Dancing 1.4Cycling 1.2Tennis 0.6Jogging 0.5Soccer 0.4
Gaelic football 0.3Yoga 0.3
Figure 10.2: Odds ratios for having a long-term health problem by income
0.0
Od
ds
rati
o
0.2
0.4
0.6
0.8
1.0
€1250+900 - 1249750 - 899500 - 749400 - 499300 - 399under €300
1.00 1.00
0.68
0.43
0.290.22
0.14
Figure 10.3: Proportion playing sport by age and presence of a long-term health problem
0%
10
20
30
40
50
60
Health problem
No health problem
All66+56 - 6546 - 5536 - 4526 - 3516 - 25
54
38
3125 23
16
3534
14 16 14 149
13
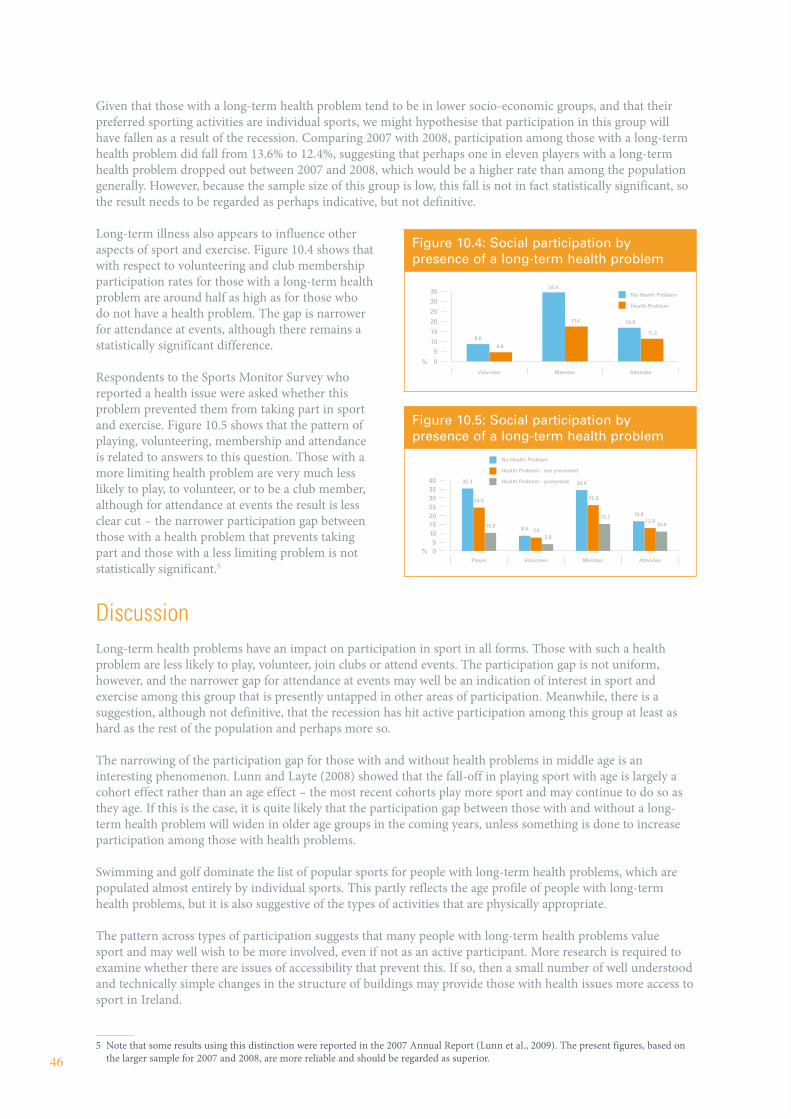
46
Given that those with a long-term health problem tend to be in lower socio-economic groups, and that their preferred sporting activities are individual sports, we might hypothesise that participation in this group will have fallen as a result of the recession. Comparing 2007 with 2008, participation among those with a long-term health problem did fall from 13.6% to 12.4%, suggesting that perhaps one in eleven players with a long-term health problem dropped out between 2007 and 2008, which would be a higher rate than among the population generally. However, because the sample size of this group is low, this fall is not in fact statistically significant, so the result needs to be regarded as perhaps indicative, but not definitive.
Long-term illness also appears to influence other aspects of sport and exercise. Figure 10.4 shows that with respect to volunteering and club membership participation rates for those with a long-term health problem are around half as high as for those who do not have a health problem. The gap is narrower for attendance at events, although there remains a statistically significant difference.
Respondents to the Sports Monitor Survey who reported a health issue were asked whether this problem prevented them from taking part in sport and exercise. Figure 10.5 shows that the pattern of playing, volunteering, membership and attendance is related to answers to this question. Those with a more limiting health problem are very much less likely to play, to volunteer, or to be a club member, although for attendance at events the result is less clear cut – the narrower participation gap between those with a health problem that prevents taking part and those with a less limiting problem is not statistically significant.5
DiscussionLong-term health problems have an impact on participation in sport in all forms. Those with such a health problem are less likely to play, volunteer, join clubs or attend events. The participation gap is not uniform, however, and the narrower gap for attendance at events may well be an indication of interest in sport and exercise among this group that is presently untapped in other areas of participation. Meanwhile, there is a suggestion, although not definitive, that the recession has hit active participation among this group at least as hard as the rest of the population and perhaps more so.
The narrowing of the participation gap for those with and without health problems in middle age is an interesting phenomenon. Lunn and Layte (2008) showed that the fall-off in playing sport with age is largely a cohort effect rather than an age effect – the most recent cohorts play more sport and may continue to do so as they age. If this is the case, it is quite likely that the participation gap between those with and without a long-term health problem will widen in older age groups in the coming years, unless something is done to increase participation among those with health problems.
Swimming and golf dominate the list of popular sports for people with long-term health problems, which are populated almost entirely by individual sports. This partly reflects the age profile of people with long-term health problems, but it is also suggestive of the types of activities that are physically appropriate.
The pattern across types of participation suggests that many people with long-term health problems value sport and may well wish to be more involved, even if not as an active participant. More research is required to examine whether there are issues of accessibility that prevent this. If so, then a small number of well understood and technically simple changes in the structure of buildings may provide those with health issues more access to sport in Ireland.
5 Note that some results using this distinction were reported in the 2007 Annual Report (Lunn et al., 2009). The present figures, based on the larger sample for 2007 and 2008, are more reliable and should be regarded as superior.
Figure 10.4: Social participation by presence of a long-term health problem
0%
5
10
15
20
25
30
35
Health Problem
No Health Problem
AttendeeMemberVolunteer
8.6
34.4
16.8
4.6
17.4
11.3
Figure 10.5: Social participation by presence of a long-term health problem
0%5
10152025303540 Health Problem - prevented
Health Problem - not prevented
No Health Problem
AttendeeMemberVolunteerPlayer
35.3
8.6
34.4
16.8
24.5
7.5
25.9
12.910.2
3.8
15.210.9

47
Part Five
Implications of the 2008 ISM

48
11. How Might Policy Respond?
Summary• Considering the directly measureable impact on quality of life implied by the fall in active participation, the
wisdom of disproportionate cuts in the sport budget is highly questionable
• The widening socio-economic gap in sport strengthens the case for prioritising expenditure programmes most likely to increase grassroots participation, especially among low income groups
• Cost is a barrier to increased participation and there is therefore a leadership role for policy-makers in promoting affordable sporting opportunities, especially for the newly unemployed
IntroductionThe evidence offered by the 2008 ISM suggests that the economic change that has swept through Ireland since 2007 has had a definite and measureable impact on the likelihood that people participate in sport. In the face of such strong economic forces, it would, clearly, be inappropriate to conclude that the decline in active participation in 2008 represents a failure of sports policy. Our analysis shows that incomes and employment status have been the key factors in the decline, both of which are obviously beyond the scope of organisations promoting sport and physical activity. That stated, an understanding of how such economic forces have operated and continue to operate can assist sports policy in generating a well-designed response, which might support participation and, perhaps, increase it again. In this final chapter, we highlight some policy implications of the analysis presented.
The Sport BudgetIn July 2009, the report of the Special Group on Public Service Numbers and Expenditure Programmes (“An Bord Snip Nua”) proposed a cut of €17.7 million in the budget of the Irish Sports Council (31% of the 2008 outturn and 34% of the 2009 estimate). This proposed cut is on top of the cessation of funding under the Sports Capital Programme, which provided grants in excess of €50 million per year in recent years for the construction and upgrading of sports facilities.
The scale of the unprecedented challenge facing Ireland’s public finances is not to be underestimated. Few, if any, serious commentators argue for no cuts in public expenditure in 2010 and beyond. However, the scale of actual and proposed reductions in public funding for sport is very much greater than those proposed in the large majority of other areas of public expenditure – sport has been disproportionately targeted for cuts. The justification for this approach, meanwhile, is unstated.
There is now a large evidence base to support the view that participation in sport delivers health and social benefits (Fahey et al., 2004; Lunn, 2008). The evidence in this report shows that the recession has already resulted in a measureable fall in participation. We estimate that one in every sixteen players of sport in 2007 had ceased their participation in 2008. Thus, a consequential amount of the associated health and social benefits may have already been lost.
Given the current economic climate, the extent to which public investment through sports policy can counteract these effects is, of course, not known. Furthermore, evidence suggests that to maximise returns in terms of health and social benefits, a greater proportion of the public investment in sport should be directed towards programmes that encourage grassroots participation (i.e. programmes designed to attract new participants) and towards those mechanisms and activities known to be more likely to increase participation (Lunn, 2008).
49
Yet, if cuts are implemented on the scale proposed, it is very difficult to see how any kind of effective policy response to the current fall in participation can be delivered. The worry must be that the proposal for disproportionate cuts in the sport budget is based on an outdated view of sport as a leisure activity, or even a social luxury. The evidence suggests, instead, that sport makes a valuable contribution to quality of life. The decline in sporting activity recorded here represents a direct impact of the present recession on quality of life, while the proposal for such severe cuts in funding for sport amounts to acceptance of that impact and is likely to increase it. On the basis of evidence, therefore, the wisdom of cuts in the sport budget on the scale proposed is highly questionable.
The Socio-Economics of SportThe 2008 ISM reveals that the recession has led to an increase in the impact of socio-economic status on participation in sport; a relationship that was already very strong (Lunn, 2007). As the recession bit, those in the lower income categories became even less likely to play sport than those in higher categories and, similarly, even less likely to be members of sports clubs. Hence, sport’s socio-economic gap widened in 2008.
The argument for concentrating efforts to increase participation in sport on the more disadvantaged is strong, on the basis of both efficiency and equity. The majority of non-participants and, especially, interested non-participants have relatively low educational attainment and income. People in these socio-economic groups are deprived of sporting opportunities relative to their better-off counterparts, who tend to enjoy the sporting benefits of attendance at third-level colleges, followed by greater contact with workplace colleagues who participate in sport and exercise (Lunn, 2007; Lunn and Layte, 2008). Thus, by targeting the greater untapped interest in lower socio-economic groups, participation programmes that seek to counterbalance these forces are both more likely to succeed in raising participation and, straightforwardly, fairer.
Lunn (2007) discusses a range of policy mechanisms for addressing the socio-economic gap in sport. Given the widening of this gap, these issues have become more urgent. In particular, the evidence suggests that many people in lower socio-economic groups drop out from sport as young adults, especially after leaving school or entering the workplace. The evidence in this report shows that economic conditions have led to significant numbers of people in lower income groups giving up sport. The majority of these people are young men. There is a real danger that these people will be denied the health and social benefits of playing sport, not only during this recession, but well into the future.
The silver-lining of this cloud is that a proportion of the many people who were made unemployed in 2008 appear to have responded by increasing their participation in sport. This short-term impact is in contrast to the longer-term impact of unemployment on participation. Research in Ireland and elsewhere shows that in normal times the unemployed tend to participate less (Lunn, 2007). So the clear challenge for sports policy is to sustain the increased participation among the newly unemployed, helping them to continue to participate once some of the longer-term effects of unemployment bite.
If there are to be cuts in public expenditure on sport, therefore, there is a strong argument for prioritising programmes that are most likely to support or increase grassroots participation, particularly among lower income groups. The potential returns to specific relevant programmes are evaluated in Lunn (2008).
Untapped Demand for SportThe abrupt change in participation patterns recorded in 2008 has a clear implication regarding untapped demand: there are now many people whose previous behaviour suggests they would like to engage in gym sessions, exercise classes, swimming and golf, but no longer feel able to do so. The evidence linking income to reduced participation suggests that the primary problem is cost. Hence, the question arises as to whether policy can do anything to reduce the cost of participation in these activities.
50
One possibility is to encourage sports clubs and leisure businesses to offer reduced membership fees or pay-per-use charges to younger adults and/or those who are not in work. If such a policy were to be pursued, it should not be limited to the sports most affected, because there is evidence that people may be substituting team sports for individual activities. Hence, reducing the cost of participation for the young and unemployed may be of benefit across the sporting spectrum, including in GAA, soccer and rugby clubs.
Since it is not feasible to force organisations to offer discounts to younger adults or those who are out of work, there is an important leadership role here for policy-makers in explaining the importance of this approach. Many of the providers of sporting opportunities in the areas that have seen the greatest participation declines are for-profit private companies and it may therefore require that such leadership extends to relationships with relevant businesses.
Looking Forward to 2009As stated in Chapter 1, participation in sport tends to change only slowly, at least in normal times. It was not anticipated that the ISM would record such large changes in participation in its first two years of operation. Although strong patterns have been revealed in this second wave of data, a number of research questions have also been raised that cannot be answered until the 2009 data become available. Will declining incomes continue to hit participation in sport? Will newly unemployed people continue to display increased involvement? Will these changes have a lasting effect on the balance of participation between specific sporting activities? The advantage of a system of monitoring like the ISM is that such questions can be answered within a time-frame that has the potential to inform a policy response.
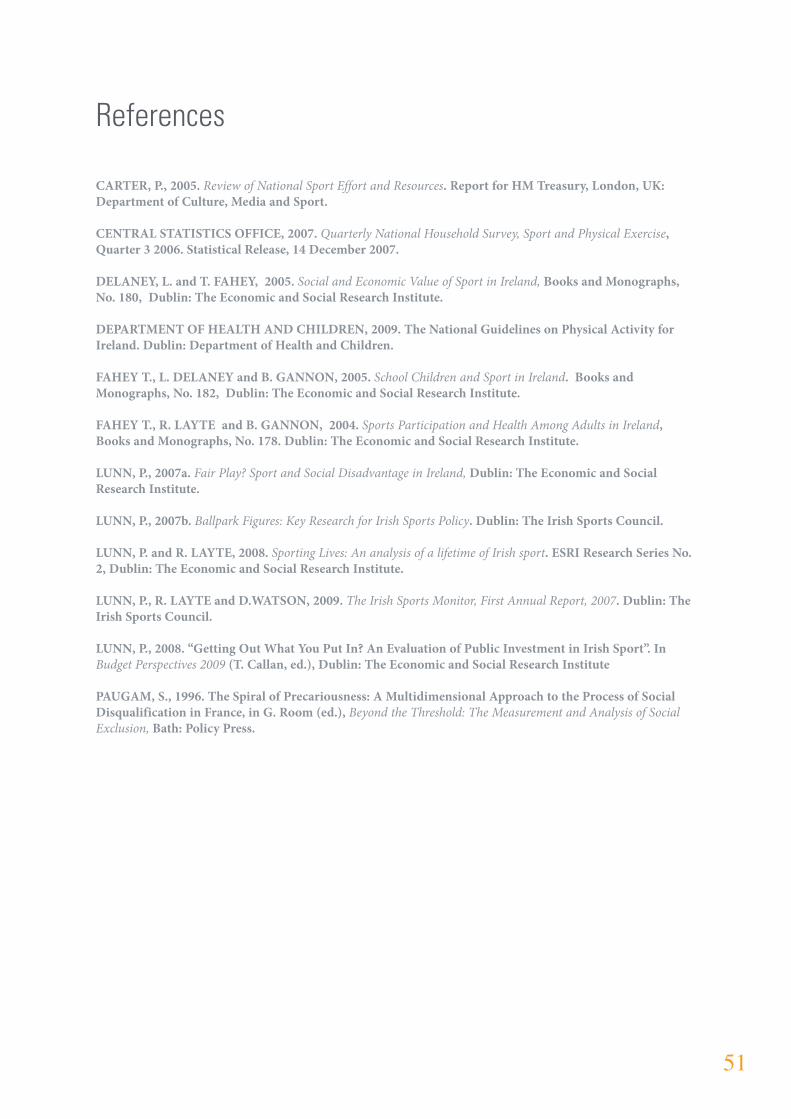
51
References
CARTER, P., 2005. Review of National Sport Effort and Resources. Report for HM Treasury, London, UK: Department of Culture, Media and Sport.
CENTRAL STATISTICS OFFICE, 2007. Quarterly National Household Survey, Sport and Physical Exercise, Quarter 3 2006. Statistical Release, 14 December 2007.
DELANEY, L. and T. FAHEY, 2005. Social and Economic Value of Sport in Ireland, Books and Monographs, No. 180, Dublin: The Economic and Social Research Institute.
DEPARTMENT OF HEALTH AND CHILDREN, 2009. The National Guidelines on Physical Activity for Ireland. Dublin: Department of Health and Children.
FAHEY T., L. DELANEY and B. GANNON, 2005. School Children and Sport in Ireland. Books and Monographs, No. 182, Dublin: The Economic and Social Research Institute.
FAHEY T., R. LAYTE and B. GANNON, 2004. Sports Participation and Health Among Adults in Ireland, Books and Monographs, No. 178. Dublin: The Economic and Social Research Institute.
LUNN, P., 2007a. Fair Play? Sport and Social Disadvantage in Ireland, Dublin: The Economic and Social Research Institute.
LUNN, P., 2007b. Ballpark Figures: Key Research for Irish Sports Policy. Dublin: The Irish Sports Council.
LUNN, P. and R. LAYTE, 2008. Sporting Lives: An analysis of a lifetime of Irish sport. ESRI Research Series No. 2, Dublin: The Economic and Social Research Institute.
LUNN, P., R. LAYTE and D.WATSON, 2009. The Irish Sports Monitor, First Annual Report, 2007. Dublin: The Irish Sports Council.
LUNN, P., 2008. “Getting Out What You Put In? An Evaluation of Public Investment in Irish Sport”. In Budget Perspectives 2009 (T. Callan, ed.), Dublin: The Economic and Social Research Institute
PAUGAM, S., 1996. The Spiral of Precariousness: A Multidimensional Approach to the Process of Social Disqualification in France, in G. Room (ed.), Beyond the Threshold: The Measurement and Analysis of Social Exclusion, Bath: Policy Press.

52
Appendices
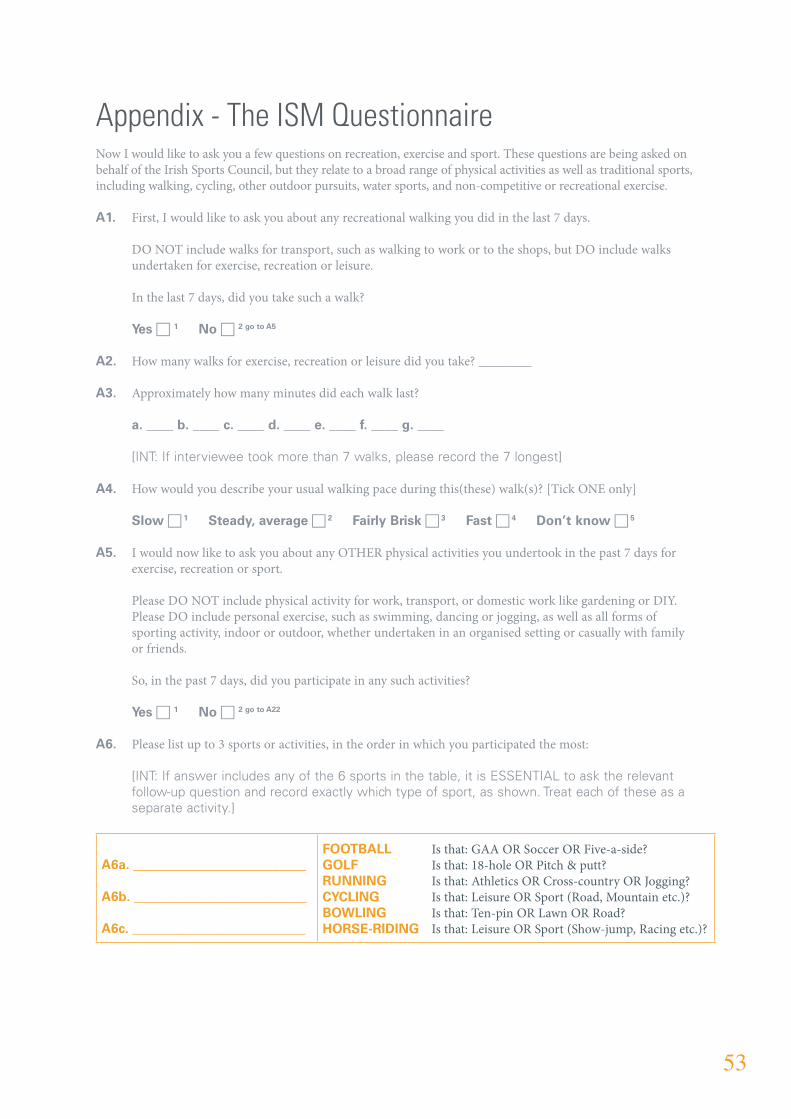
53
Appendix - The ISM QuestionnaireNow I would like to ask you a few questions on recreation, exercise and sport. These questions are being asked on behalf of the Irish Sports Council, but they relate to a broad range of physical activities as well as traditional sports, including walking, cycling, other outdoor pursuits, water sports, and non-competitive or recreational exercise.
A1. First, I would like to ask you about any recreational walking you did in the last 7 days.
DO NOT include walks for transport, such as walking to work or to the shops, but DO include walks undertaken for exercise, recreation or leisure.
In the last 7 days, did you take such a walk?
Yes c 1 No c 2 go to A5
A2. How many walks for exercise, recreation or leisure did you take? ________
A3. Approximately how many minutes did each walk last?
a. ____ b. ____ c. ____ d. ____ e. ____ f. ____ g. ____
[INT: If interviewee took more than 7 walks, please record the 7 longest]
A4. How would you describe your usual walking pace during this(these) walk(s)? [Tick ONE only]
Slow c 1 Steady, average c 2 Fairly Brisk c 3 Fast c 4 Don’t know c 5
A5. I would now like to ask you about any OTHER physical activities you undertook in the past 7 days for exercise, recreation or sport.
Please DO NOT include physical activity for work, transport, or domestic work like gardening or DIY. Please DO include personal exercise, such as swimming, dancing or jogging, as well as all forms of sporting activity, indoor or outdoor, whether undertaken in an organised setting or casually with family or friends.
So, in the past 7 days, did you participate in any such activities?
Yes c 1 No c 2 go to A22
A6. Please list up to 3 sports or activities, in the order in which you participated the most:
[INT: If answer includes any of the 6 sports in the table, it is ESSENTIAL to ask the relevant follow-up question and record exactly which type of sport, as shown. Treat each of these as a separate activity.]
A6a. __________________________
A6b. __________________________
A6c. __________________________
FOOTBALL Is that: GAA OR Soccer OR Five-a-side?GOLF Is that: 18-hole OR Pitch & putt?RUNNING Is that: Athletics OR Cross-country OR Jogging?CYCLING Is that: Leisure OR Sport (Road, Mountain etc.)?BOWLING Is that: Ten-pin OR Lawn OR Road?HORSE-RIDING Is that: Leisure OR Sport (Show-jump, Racing etc.)?

54
I’d like to ask you a short series of questions about each activity, starting with the first
[INT: prompt activity A6a]
A7. On how many of the last 7 days did you take part? __________
A8. For how long did you take part? Consider a usual session if you took part more than once. _______ minutes
A9. Was the effort enough to raise your breathing rate? Yes c 1 No c 2
A10. Was the effort enough for you to be out of breath or sweat? Yes c 1 No c 2
A11. In what context did the activity take place? [Tick all that apply]
Organised training/ coaching/lesson
c 1
Organised competition
c 2
Casually with family or friends
c 3
On own
c 4
Other
c 5
[INT: If no second activity (A6b) go to A22, else go to A12]
I’d like to ask you the same series of questions about the second activity… [INT: prompt activity A6b]
A12. On how many of the last 7 days did you take part? __________
A13. For how long did you take part? Consider a usual session if you took part more than once. _________ minutes
A14. Was the effort enough to raise your breathing rate? Yes…… 1 No……… 2
A15. Was the effort enough for you to be out of breath or sweat? Yes…… 1 No……… 2
A16. In what context did the activity take place? [Tick all that apply]
Organised training/ coaching/lesson
c 1
Organised competition
c 2
Casually with family or friends
c 3
On own
c 4
Other
c 5
[INT: If no third activity (A6c) go to A22, else go to A17]
I’d like to ask you the same series of questions about the third activity
[INT: prompt activity A6c]
A17. On how many of the last 7 days did you take part? __________
A18. For how long did you take part? Consider a usual session if you took part more than once. _________ minutes
A19. Was the effort enough to raise your breathing rate? Yes…… 1 No……… 2
A20. Was the effort enough for you to be out of breath or sweat? Yes…… 1 No……… 2
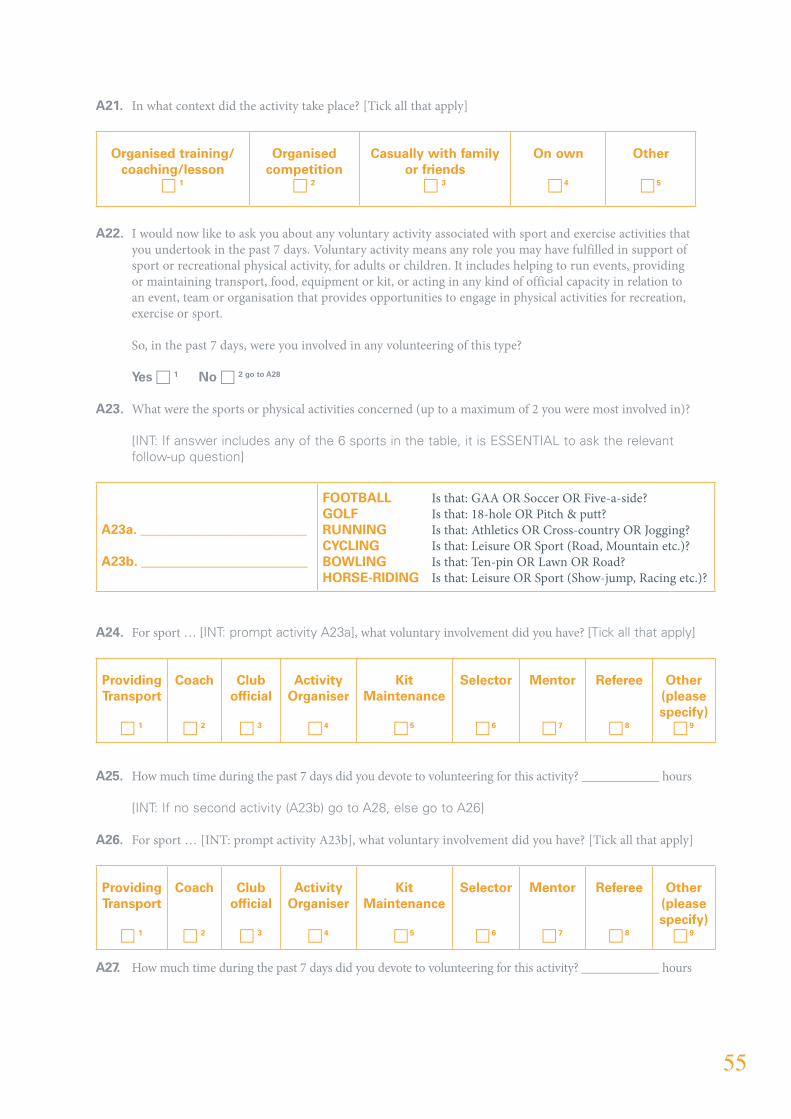
55
A21. In what context did the activity take place? [Tick all that apply]
Organised training/ coaching/lesson
c 1
Organised competition
c 2
Casually with family or friends
c 3
On own
c 4
Other
c 5
A22. I would now like to ask you about any voluntary activity associated with sport and exercise activities that you undertook in the past 7 days. Voluntary activity means any role you may have fulfilled in support of sport or recreational physical activity, for adults or children. It includes helping to run events, providing or maintaining transport, food, equipment or kit, or acting in any kind of official capacity in relation to an event, team or organisation that provides opportunities to engage in physical activities for recreation, exercise or sport.
So, in the past 7 days, were you involved in any volunteering of this type?
Yes c 1 No c 2 go to A28
A23. What were the sports or physical activities concerned (up to a maximum of 2 you were most involved in)?
[INT: If answer includes any of the 6 sports in the table, it is ESSENTIAL to ask the relevant follow-up question]
A23a. _________________________
A23b. _________________________
FOOTBALL Is that: GAA OR Soccer OR Five-a-side?GOLF Is that: 18-hole OR Pitch & putt?RUNNING Is that: Athletics OR Cross-country OR Jogging?CYCLING Is that: Leisure OR Sport (Road, Mountain etc.)?BOWLING Is that: Ten-pin OR Lawn OR Road?HORSE-RIDING Is that: Leisure OR Sport (Show-jump, Racing etc.)?
A24. For sport … [INT: prompt activity A23a], what voluntary involvement did you have? [Tick all that apply]
Providing Transport
c 1
Coach
c 2
Club official
c 3
Activity Organiser
c 4
Kit Maintenance
c 5
Selector
c 6
Mentor
c 7
Referee
c 8
Other (please specify)
c 9
A25. How much time during the past 7 days did you devote to volunteering for this activity? ____________ hours
[INT: If no second activity (A23b) go to A28, else go to A26]
A26. For sport … [INT: prompt activity A23b], what voluntary involvement did you have? [Tick all that apply]
Providing Transport
c 1
Coach
c 2
Club official
c 3
Activity Organiser
c 4
Kit Maintenance
c 5
Selector
c 6
Mentor
c 7
Referee
c 8
Other (please specify)
c 9
A27. How much time during the past 7 days did you devote to volunteering for this activity? ____________ hours

56
A28 Are you a member of any kind of sports club? Include clubs for traditional sports, but also walking, cycling or swimming clubs, fitness centres, gyms or other organisations that provide opportunities to engage in physical activity for recreation, exercise or sport?
Yes c 1 No c 2 go to A31
A29. How many are you a member of? __________
A30. What are the sports or physical activities concerned (up to a maximum of 3 you are most involved in)?
[INT: If answer includes any of the 6 sports in the table, it is ESSENTIAL to ask the relevant follow-up question]
A30a.______________________
A30b.______________________
A30c. ______________________
FOOTBALL Is that: GAA OR Soccer OR Five-a-side?GOLF Is that: 18-hole OR Pitch & putt?RUNNING Is that: Athletics OR Cross-country OR Jogging?CYCLING Is that: Leisure OR Sport (Road, Mountain etc.)?BOWLING Is that: Ten-pin OR Lawn OR Road?HORSE-RIDING Is that: Leisure OR Sport (Show-jump, Racing etc.)?
A31. Given the broad definition of sporting activities we have been using, have you attended any fixtures or events in the past 7 days, either children’s or adult events, as a spectator or supporter, rather than as an active participant?
Yes c 1 No c 2 go to A34
A32. How many events did you attend? __________
A33. What were the sports or physical activities concerned (up to a maximum of 3 most recent events)?
[INT: If answer includes any of the 6 sports in the table, it is ESSENTIAL to ask the relevant follow-up question]
A33a. ______________________
A33b. ______________________
A33c. ______________________
FOOTBALL Is that: GAA OR Soccer OR Five-a-side?GOLF Is that: 18-hole OR Pitch & putt?RUNNING Is that: Athletics OR Cross-country OR Jogging?CYCLING Is that: Leisure OR Sport (Road, Mountain etc.)?BOWLING Is that: Ten-pin OR Lawn OR Road?HORSE-RIDING Is that: Leisure OR Sport (Show-jump, Racing etc.)?
A34. Apart from during PE lessons, did you play regular sport at school? Yes c 1 No c 2
A35. When you were at school, did your parents play any kind of sport regularly? [Tick ONE only]
Yes, both c 1 Yes, father only c 2 Yes, mother only c 3 No c 4 Don’t Know c 5
A36. Do you undertake any regular walks of over 15 minutes for transport, such as walking to work, walking children to school etc.? By regular I mean at least once-a-week. Yes c 1 No c 2
A37. Do you cycle regularly as a form of transport? By regular I again mean once-a-week. Yes c 1 No c 2
**** Section B (Flexible Module) Inserted Here ****

57
Finally, I would like to ask you a few more background questions.
C1. Do you have any long-term illness, health problem or disability that limits your daily activities or work?
Yes c 1 No c 2
C2. Does this prevent you from taking part in sport and exercise? Yes c 1 No c 2
C3. Do you have any children? Yes c 1 No c 2 go to C6
C4. How many children do you have? ________
C5. What age is your youngest child? ________
C6. Does your household have a car? Yes c 1 No c 2
C7. Which of the following best describes where you live? [Tick ONE only]
In a city c 1 In a town c 2 In a village c 3 Isolated location c 4 Don’t Know c 5
C8. Which county do you live in? ______________ [INT: If TIPPERARY, specify North or South]
[INT: If DUBLIN go to C9, else got to C10]
C9. Which of the following is your local authority?
Dublin City c 1 Dun Laoghaire-Rathdown c 2 Fingal c 3 South Dublin c 4
C10. What nationality are you? If joint nationality, please state both nationalities _______________________
[INT: Check Q22 in Consumer Survey – Is respondent the main earner in the household?] Yes c 1 go to C11 No c 1 go to C13
C11. Do you supervise or manage anyone in your job?
Yes c 1 go to C12 No c 1 go to END
C12. Do you supervise or manage… Less than 25 people c 1 25 or more people c 2
These last two questions refer to the main earner in your household.
C13. Does he/she supervise or manage anyone in their job? Yes c 1 go to C14 No c 1 go to END
C14. Do he/she supervise or manage? Less than 25 people c 1 25 or more people c 2
THANK YOU VERY MUCH FOR TAKING THE TIME TO TAKE PART IN THIS SURVEY
INT: Gender of respondent: ________ Time interview ended ___ ___ : ___ ___ (24-hour clock)

58

59
60
design_ww
w.red
do
g.ie
Top Floor, Block A,West End Office Park,Blanchardstown, Dublin 15
T: +353 (0)1 860 8800F: +353 (0)1 860 8880E: [email protected]
www.irishsportscouncil.ie