the isa 700 auditor’s report and the audit expectation gap … ms final incl... · this is a...
TRANSCRIPT
This is a postprint of
The ISA 700 Auditor’s Report and the Audit Expectation Gap – Do AdditionalExplanations Matter?
Gold, A.H., Pott, C., Gronewold, U.
International Journal of Auditing, 16(3), 286-307
Published version: http://dx.doi.org/10.1111/j.1099-1123.2012.00452.x
Link VU-DARE: http://hdl.handle.net/1871/41064
(Article begins on next page)

The ISA 700 Auditor’s Report and the Audit Expectation Gap –
Do Explanations Matter?
Anna Gold*
VU University Amsterdam
Ulfert Gronewold
Universität Potsdam
Christiane Pott
Westfälische Wilhelms-Universität Münster
* Corresponding author. Department of Accountancy (PGO); Faculty of Economics
and Business Administration; VU University Amsterdam; De Boelelaan 1105; NL-
1081 HV Amsterdam; The Netherlands; Tel: +31 20 59 82592
This project is part of the Auditing Standards Board and International Auditing and Assurance
Standards Board sponsored research on “Unqualified Auditor‟s Report Communications.” We are
grateful for the opportunity to be part of this research initiative and appreciate the funding and research support provided. We thank Douglas Prawitt, Mark Taylor, Stuart Turley and participants at the 5th
EARNet Symposium 2009 in Valencia (where this paper won the Best Paper Award), as well as
members of the Auditing Standards Board and members of the International Auditing and Assurance
Standards Board for valuable comments, the Institute of German Auditors (IDW), two Big 4 audit
firms, the Society of Investment Professionals in Germany (DVFA), and the London School of
Economics for research support. Finally, we thank Evelien Smits for her programming assistance and
translation work. All remaining errors are our own.

The ISA 700 Auditor’s Report and the Audit Expectation Gap –
Do Explanations Matter?
ABSTRACT: In this paper we test the effectiveness of explanations as mandated by
the revised ISA 700 auditor‟s report in reducing the audit expectation gap. German
auditors and financial statement users participated in an experiment where they read a
summary of a firm‟s financial statements and an auditor‟s report, the latter of which
we manipulated as being the auditor‟s report including the explanations as mandated
by ISA 700 versus a mere audit opinion-only version. We elicited participants‟
perceptions about auditor versus management responsibilities and financial statement
reliability.
We find strong evidence for a persistent expectation gap with respect to the
auditor‟s responsibilities. Meanwhile, auditors and users reach a reasonable belief
consensus regarding management‟s responsibilities and financial statement reliability.
Most notably, explanations of the ISA 700 auditor‟s report do not result in a smaller
expectation gap. Our findings suggest that the mere audit opinion may signal
sufficient relevant information to users.
Key words: Audit expectation gap, auditors, financial statement users, financial
analysts, students, auditor‟s report, responsibility perceptions, reliability perceptions.
SUMMARY: In response to repeated observations of an audit expectation gap
between financial statement users and the audit profession, the International
Accounting and Assurance Standards Board (IAASB) released a revision of the
International Standard on Auditing (ISA) 700, the standard on the auditor‟s report,
which is effective for reports dated on or after December 31st, 2006. The revision was
undertaken in order to improve users‟ understanding of an audit and to align users‟
expectations with the actual responsibilities of the auditor and management as well as
the reliability of audited financial statements (IFAC, 2008). This revision of ISA 700
primarily featured the inclusion in the report of explanations of auditor versus
management responsibilities and of the nature, scope, and procedures of the audit.
This raises the question whether such explanations do in fact result in any smaller
expectation gap than when no further explanations are offered in the report. Hence,

the purpose of this paper is (1) to determine the current state of the expectation gap
under the revised ISA 700 auditor‟s report, and (2) to test whether the presence versus
absence of explanations in the auditor‟s report as mandated by the revised ISA 700
results in a smaller expectation gap.
We report the results of an experiment in which experienced German auditors
and financial statement users (i.e., financial analysts and business students) read a
brief company description, a summary of the firm‟s financial statements, and an
auditor‟s report, the latter of which we manipulated as being either the auditor‟s report
including the explanations as mandated by the revised ISA 700 or a mere audit
opinion-only version. Participants then responded to questions related to the perceived
responsibility of the auditor versus management for the financial statements and
questions about the reliability of the audited financial statements.
We find strong evidence for a persistent audit expectation gap between
auditors and financial statement users under the revised ISA 700 auditor‟s report with
respect to the auditor‟s responsibilities. Meanwhile, auditors and users reach a
reasonable belief consensus regarding management‟s responsibilities and financial
statement reliability. Most notably, the explanations of the ISA 700 auditor‟s report of
auditor versus management responsibilities and of the nature, scope, and procedures
of the audit do not result in a smaller expectation gap. Our findings suggest that the
mere audit opinion may already signal sufficient relevant information to financial
statement users.
Overall, while the fact that an audit expectation gap still exists under the new
ISA 700 auditor‟s report is in line with our expectations, it is disconcerting that the
rather detailed explanations of auditor versus management responsibilities do not
favourably affect the gap. This observation may indicate that the explanations would
need to be formulated more explicitly and clearly, or even that users‟ perceptions are
simply not malleable by additional information and explanations in the auditor‟s
report.
1
The ISA 700 Auditor’s Report and the Audit Expectation Gap –
Do Explanations Matter?
1. INTRODUCTION
The issuance of an unqualified audit opinion implies that the auditor believes that the
financial statements give a true and fair view in accordance with the applicable
financial reporting framework (IFAC, 2008). Prior research demonstrates that
financial statement users (such as bankers, investors, and financial analysts) often
associate an absolute level of assurance when they read such messages, potentially
resulting in naïve or unreasonable expectations (e.g., Epstein & Geiger, 1994).
However, in reality, the auditor merely provides a reasonable level of assurance (e.g.,
Hasan et al., 2005), as inherent audit limitations prevent the auditor from achieving
absolute assurance (Gay et al., 1998). Furthermore, financial statement users
(henceforth called „users‟) often assume audits to have a broader scope than they
actually have. For example, users may erroneously associate audits with an approval
of management adequacy, a guarantee of the absence of fraud, and a recommendation
to invest in the respective firm (Frank et al., 2001). Prior studies (e.g., Bailey et al.,
1983; Nair & Rittenberg, 1987; Anderson et al., 1998) have also found that users
attribute disproportionate responsibility toward auditors, whereas in reality,
management (rather than the auditor) is primarily responsible for the adequacy of the
financial statements. These and other differences between what users expect from the
auditor and what the auditor actually provides have become known as the audit
expectation gap.1
In response to this problem, the International Accounting and Assurance
Standards Board (IAASB) released a revision of the International Standard on
Auditing (ISA) 700, the standard on the auditor‟s report, which is effective for reports
dated on or after December 31st, 2006. With this revision, the IAASB mandates a new
wording for the auditor‟s report that includes explicit explanations of the
responsibilities of management and the auditor and of the nature, scope, and
procedures of the audit (IAASB, 2004). The first objective of our study is to
empirically assess the current state of the expectation gap in Germany given the
1 For conceptual inquiry into the expectation gap see Dennis (2010b); for a critical debate on the effectiveness of the audit function given the presence of an expectation gap see Humphrey and Owen
(2000).

2
revised ISA 700 auditor‟s report. To this end, users (financial analysts as sophisticated
users and business students as unsophisticated users) and experienced auditors were
asked to read an unqualified ISA 700 auditor‟s report in its revised form and to
respond to questions about the responsibilities of the auditor and management and the
reliability of the audited financial statements.
The revised ISA 700 requires the auditor‟s report to provide explicit
explanations of the auditor‟s versus management‟s responsibilities, along with an
explanation of the nature, scope, and procedures of the audit. The revision was
undertaken in order to improve users‟ understanding of an audit and to align users‟
expectations with the actual responsibilities of the auditor and management as well as
the reliability of audited financial statements (IFAC, 2008).2 This recent revision of
ISA 700 raises the question whether financial statement users pay attention to such
explanations and whether these explanations do in fact result in a smaller audit
expectation gap as compared to the absence of such explanations in the report. Prior
research partly suggests that specific wording in the auditor‟s report may lead to a
better understanding of the scope, nature and significance of audit procedures (e.g.,
Bailey et al., 1983; Manson & Zaman, 2001; Chong & Pflugrath, 2008), but there is
also evidence suggesting only moderate, undesired, or even no effect at all (e.g.,
Humphrey et al. 1992; Brown et al. 1993; Monroe & Woodliff 1994; Kneer et al.
1996; Schelluch 1996; Chong & Pflugrath 2008; Humphrey et al. 2009). Hence, the
second purpose of the current study is to provide empirical evidence on whether the
presence of explanations in the auditor‟s report as mandated by the revised ISA 700
results in a smaller expectation gap as compared to the absence of such explanations
in the report. We use the “strongest” experimental manipulation possible, which
compares perceptions formed on the basis of the complete auditor‟s report that
includes the explanations as mandated by the revised ISA 700 on the one hand versus
a version without any further explanations (i.e., an opinion-only version) on the other.
A reduced gap in expectations on the basis of the complete auditor‟s report would
indicate a positive effect of the presence of explanations that accompany the audit
2 All European Union (EU) member states are required to replace their existing national auditor‟s
reports with the new format as soon as the European Commission adopts an international auditing standard that covers the same subject matter as a national standard (European Parliament and Council,
2006). In Germany, the implementation of the ISA 700 into IDW PS 400 is currently being undertaken.
For the purposes of this study, the unpublished draft version of the German translation of the ISA 700
was used, which was kindly provided by the Institute of German Auditors (IDW).
3
opinion in the revised ISA 700 auditor‟s report. In contrast, an unchanged gap would
indicate that the explanations beyond the audit opinion are ineffective, possibly
suggesting that the mere audit opinion might signal sufficient relevant information to
users.
The results of our experiment among experienced German auditors and users
with varying levels of sophistication provide strong evidence for a persistent audit
expectation gap under the revised ISA 700 auditor‟s report in some areas (auditors‟
responsibilities), while auditors and users reach a reasonable belief consensus with
respect to other areas (management‟s responsibilities and financial statement
reliability). Notably, the explanations of the ISA 700 auditor‟s report do not have an
effect on the gap between auditors‟ and users‟ expectations and perceptions.
Our findings are important for at least the following reasons. First, to our
knowledge, this is the first study to investigate the expectation gap under the revised
ISA 700 in a European country. Prior expectation gap research has largely focused on
Anglo-Saxon countries such as the US, UK, New Zealand, and Australia (e.g., Gay et
al., 1997; 1998; Dewing & Russell, 2002; Kirk, 2006; Chong & Pflugrath, 2008) and
Asian countries such as Singapore, China, Bangladesh, and Lebanon (e.g., Best et al.,
2001; Lin & Chen, 2004; Sidani, 2007; Siddiqui et al., 2009).3 Second, we inquired
among a substantial range of different groups dealing with financial statements and
audit opinions, including experienced auditors, financial analysts as sophisticated
users, and business students as unsophisticated or “naïve” users. This approach
allowed us to capture the impact of different levels of user expertise and, thus, to
investigate the expectation gap in a differentiated way. Third, in light of rather mixed
prior evidence, our findings provide insight into whether financial statement users pay
attention to explicit explanations of auditor versus management responsibilities and of
the nature, scope, and procedures of the audit included in the report, and whether the
presence (versus absence) of such explanations results in a smaller expectation gap.
To our knowledge, we are the first to investigate such an effect based on the revised
ISA 700.
3 Spanish evidence on the usefulness of the auditor‟s report to make investment and lending decisions is provided by Duréndez Gómez-Guillamón (2003). Instead of investigating the persistence of the audit
expectation gap after an unqualified auditor‟s report, he compares the effect of different audit opinions
(i.e., clean, qualified, adverse or disclaimer).
4
This paper is organized as follows. The next section reviews the literature and
develops our hypotheses. Section 3 describes the research method, the results are
presented in section 4, and section 5 provides a summary and discussion of the results.
2. DEVELOPMENT OF HYPOTHESES AND RESEARCH QUESTIONS
2.1 Persistence of the audit expectation gap (H1)
One of the first studies on the expectation gap was conducted by Libby (1979), who
investigated bankers‟ and auditors‟ perceptions of the message communicated by the
auditor‟s report. Libby found that the perceptions of both groups were relatively
similar to the intended communication. In contrast, Nair & Rittenberg (1987)
observed that bankers placed greater responsibility for the completeness and accuracy
of the financial statements on auditors and less responsibility on management than
CPAs did. Houghton (1987) compared shareholders‟ and accountants‟ perceptions of
the phrase “true and fair view” and found significant differences between the two
groups.
Lowe (1994) was the first researcher to compare perception differences
between auditors and judges. Lowe found a large divergence in perceptions regarding
their expectations of the auditing profession. Similarly, Frank et al. (2001) compared
auditors‟, accounting students‟, and jurors‟ attitudes toward the accounting profession.
A large difference in perceptions existed between auditors and jurors, whereas
accounting student responses were very similar to auditor responses. Despite efforts
by the accounting profession to explicitly differentiate management‟s responsibilities
for the financial statements from the auditor‟s role in expressing an opinion, jurors
ascribed greater responsibility to auditors. Studying perceptions related to various
dimensions of the attest function, McEnroe & Martens (2001) found that investors
had higher expectations for various facets and assurances of the audit, compared to
auditors. Reckers et al. (2007) examined the attitudes of judges, law students, MBA
students, and auditors toward the public accounting profession over time and found
that auditors‟ attitudes were more favourable than those of the other three groups.
More recently, Butler et al. (2010) investigated auditors‟ and investors‟ perceptions of
the intended meanings of key terms used to define auditors‟ responsibilities. They
found differences between auditors and investors, indicating an expectation gap.
Non-US evidence also suggests the existence of an expectation gap. For
example, Best et al. (2001) found evidence of a wide audit expectation gap among
5
auditors, bankers, and investors in Singapore concerning several areas of auditor
responsibility. Comparing perceptions of accountants, corporate finance directors,
investments analysts, bank lending officers, and financial journalists from the UK,
Humphrey et al. (1993) demonstrated the existence of an expectation gap in a variety
of aspects, in the nature of the audit function and the perceived performance of
auditors. Research from Australia and New Zealand also supports these findings
(Porter, 1993; Gay et al., 1997; 1998). A somewhat different research approach was
used by Öhman et al. (2006) in a study of Swedish auditors‟ practices. They found
that auditors devoted more resources to areas that were easily verified and fewer
resources to areas perceived to be of importance to primary stakeholders.
In conclusion, the expectation gap appears to be a persistent phenomenon
across time and national borders, despite several institutional changes implemented
over the last several decades. Given these findings, we expect that the likelihood of
the revised ISA 700 auditor‟s report to narrow the expectation gap will be rather
limited. Therefore, we hypothesize that users will still ascribe relatively more
responsibility to the auditor as compared to auditors themselves, even when they are
exposed to the revised version of an unqualified ISA 700 report. While auditors are
knowledgeable about their actual role of merely providing assurance on financial
statements for which management is primarily responsible, prior research confirms
that users may have unrealistic expectations about the auditor‟s task and
responsibilities relative to the responsibilities of management. Therefore, we expect
that users‟ responsibility ascriptions toward management will be relatively lower
compared to the responsibility ascriptions of auditors. Furthermore, because auditors
as compared to users are better aware of the inherent limitations of an audit and an
unqualified auditor‟s report, we expect that they ascribe less reliability to audited
financial statements than do users.
H1a: Users (i.e., students and financial analysts) of financial statements with
an unqualified ISA 700 auditor‟s report ascribe relatively more responsibility
for the financial statements to the auditor than auditors do.
H1b: Users (i.e., students and financial analysts) of financial statements with
an unqualified ISA 700 auditor‟s report ascribe relatively less responsibility
for the financial statements to management than auditors do.

6
H1c: Users (i.e., students and financial analysts) of financial statements with
an unqualified ISA 700 auditor‟s report ascribe relatively more reliability to
the underlying financial statements than auditors do.
2.2 Effect of users’ sophistication on the audit expectation gap (H2)
Prior literature on the auditor‟s report has involved participants with different
sophistication (i.e., experience and knowledge levels) in the area of financial reporting
(e.g., bankers, jurors, and students). Overall, research has found that more
knowledgeable users place less responsibility on auditors than less knowledgeable
users. These results indicate differences in the size of the expectation gap, depending
on the experience and knowledge of potential users (e.g., Bailey et al., 1983;
Humphrey et al., 1993; Manson & Zaman, 2001). Similarly, Monroe & Woodliff
(1993) studied the influence of education on the expectation gap. They surveyed
auditors and undergraduate students, who were either uneducated or educated in
auditing. There were fewer differences between the auditors and the educated students
in comparison to the uneducated students, suggesting an education effect on the
expectation gap. Similarly, Gay et al. (1997) reported that users with considerable
business experience had more moderate expectations of auditors‟ responsibilities and
perceptions that were closer to those of the auditing profession when compared to less
experienced users. In contrast, Gramling et al. (1996) found no evidence of an
education effect (completion of an undergraduate auditing course) on the audit
expectation gap between students and auditors.
Another set of studies measured the effect of knowledge or education on the
audit expectation gap by means of experimental manipulation, e.g., by offering extra
educational materials to a subsample of users. Such reading material helped educating
Malaysian users and corrected some misconceptions related to the audit expectation
gap (Fadzly & Ahmad, 2004). Similarly, evidence from Bangladesh suggests that
audit education significantly reduces the audit expectation gap as it relates to financial
statement reliability (Siddiqui et al., 2009).
Because most prior research finds experience and knowledge effects on the
size of the expectation gap, we divided our sample of financial statement users into
financial analysts and students, in order to control for this effect and determine
whether it holds for the revised ISA 700 auditor‟s report. Financial analysts are
specialized in financial statement analysis and company data interpretations. Given
7
their comprehensive practical experience with audited financial statements, they
should at least have a moderately sophisticated knowledge of the implications of an
auditor‟s report. Students were chosen to represent the individual unsophisticated
investor, who has less practical experience with financial statements and auditor‟s
reports. We selected students from business and economics programs, who have not
specialized in the area of auditing, because they are somewhat familiar with financial
statements but do not have detailed formal knowledge about auditing and auditor‟s
reports (as should be the case with typical unsophisticated investors in real-world
markets). Our second hypothesis is stated in three parts as follows:
H2a: The difference in perceptions of the unqualified ISA 700 auditor‟s
report between unsophisticated users (students) and auditors is relatively
greater compared to the difference between sophisticated users (financial
analysts) and auditors regarding the extent to which responsibility for the
financial statements is ascribed to the auditor.
H2b: The difference in perceptions of the unqualified ISA 700 auditor‟s
report between unsophisticated users (students) and auditors is relatively
greater compared to the difference between sophisticated users (financial
analysts) and auditors regarding the extent to which responsibility for the
financial statements is ascribed to management.
H2c: The difference in perceptions of the unqualified ISA 700 auditor‟s
report between unsophisticated users (students) and auditors is relatively
greater compared to the difference between sophisticated users (financial
analysts) and auditors regarding the extent to which reliability is ascribed to
audited financial statements.
2.3 Effect of explanations on the audit expectation gap (RQ1)
Prior research has examined the effect of wording differences in the auditor‟s report
on the expectation gap. While one stream of research explores the alterations in
readers‟ perceptions after a revision of the relevant auditor‟s report standard (e.g.,
Bailey et al., 1983), a second stream addresses the effect of different types of
auditor‟s reports on readers‟ perceptions (e.g., Holt & Moizer, 1990). A third stream
investigates the impact of additional information provided to the reader, such as
8
comparing longer versus shorter auditor‟s reports (e.g., Miller et al., 1993; Humphrey
et al., 1992; 2009).
Early research by Bailey et al. (1983) showed that the American Institute of
Certified Public Accountants‟ (AICPA) proposed wording changes shifted readers‟
perceptions of the responsibility for financial statements from the auditor toward
management in the desired way. Similarly, the new Statement on Auditing Standards
(SAS) no. 58 auditor‟s report led to an increase in understandability regarding the
purposes of the audit and the responsibility of management for the financial
statements (Kelly & Mohrweis, 1989). Miller et al. (1993) compared bank loan
officers‟ perceptions of a new auditor‟s report based on SAS no. 58 and found that
loan officers who read the new auditor‟s report were better able to identify the
responsibilities assumed for the financial statements by both management and the
auditors compared to loan officers who read the old auditor‟s report.
In the early 1990s, the Australian Accounting Research Foundation (AARF)
proposed a new wording for their standard auditor‟s report with the issuance of the
Statement of Auditing Practice (AUP) no. 3, which followed the US example of SAS
no. 58. Monroe & Woodliff (1994) investigated the effect of the proposed wording
changes by surveying auditors and various types of users. After establishing the
existence of the gap under the old form of the auditor‟s report, the researchers found
that the new version eliminated some of the differences in perceptions (e.g., regarding
the auditor‟s responsibilities), but also created new differences, especially in areas not
mentioned in the auditor‟s report (e.g., fraud prevention). Kneer et al. (1996)
confirmed that the language of the auditor‟s report can influence users‟ perceptions of
auditors‟ responsibilities and that the improved language in SAS no. 58 “achieved
modest success in this regard” (p. 25).
In the UK, Holt & Moizer (1990) studied the auditor‟s report by investigating
the extent to which auditors and sophisticated users distinguished between various
reports. Their results indicated disagreement between the two groups concerning the
unqualified auditor‟s report. This disagreement was related to both the meaning of the
unqualified auditor‟s report and the interpretation of the qualifications used by
auditors. In particular, users perceived going-concern qualifications to be more
serious than did auditors. Miller et al. (1993) found that bankers considered a longer
report to be more useful and understandable as compared to a short-form report.
Similarly, the purpose of Hatherly et al.‟s study (1991) was to disentangle whether
9
different meanings were attached to a complete versus short-form unqualified
auditor‟s report (using a UK derivative of the SAS no. 58 standard auditor‟s report).
Only a complete auditor‟s report changed readers‟ perceptions. This is consistent with
Schelluch (1996), who found that the expectation gap regarding auditor
responsibilities was diminished with the introduction of a complete auditor‟s report.
However, a complete report did not reduce the expectation gap regarding perceptions
of financial statement reliability. Innes et al. (1997) concluded that an expanded SAS
600 report would allow the audit profession to enhance its status without any change
in actual audit activities or auditor accountability. Similarly, Koh & Woo (1998)
observed a better understanding of the scope, nature, and significance of the audit
with a complete report.
In contrast, recent Australian evidence showed that more detailed descriptions
of the respective responsibilities did not result in a reduction of the expectation gap,
whereas placing the audit opinion at the beginning of the report appeared to have
some beneficial consequences on users‟ perceptions (Chong & Pflugrath 2008).
Similarly, Brown et al. (1993) found that an expansion of the auditor‟s report actually
increased the number of differences perceived by users.
Humphrey et al. (1992) suggest that auditor‟s report changes are a way to
ensure the audit expectation gap debate is framed in terms of improving the
understanding of users rather than a consideration of what the role of the audit should
be or to provide more information on the nature and quality of audit performance.
Instead of detailing considerations and findings regarding the enterprise as specific
outcomes of the particular audit, standard setters had moved towards longer-form
audit reports, where the dominant emphasis was on providing information on
generalized audit responsibilities. Similarly, Humphrey et al. (2009) conclude that the
auditor‟s report contains general, standardized statements on the role and limitations
of the audit, but little information about the specific work undertaken and the findings
obtained by auditors. These findings call into question whether including such
generalized statements or explanations in auditor‟s reports in addition to the audit
opinion may convey any additional value or relevant information for users.
In conclusion, several prior studies suggest that the presence of explanations in
an auditor‟s report may lead to a better understanding of the responsibilities of
management and auditors, as well as the nature, scope, and procedures of an audit
among users. However, there are also contrasting findings, which suggest that the
10
effect of such explanations may be rather small, dysfunctional, or even absent. These
findings raise some general doubts about the possibility to affect users‟ perceptions by
providing explanations in the auditor‟s report. Given that previous findings in this
respect are mixed, we posit a research question rather than a directional hypothesis to
examine whether the presence of the explanations in the ISA 700 auditor‟s report
results in a smaller expectation gap (which could be the case if users pay attention to
these explanations and if this leads to a shift of their perceptions toward those of
auditors) as compared to the absence of such explanations, i.e. when a short-form
opinion-only report is used. The research question is stated in the following three
parts:
RQ1a: Does the presence versus absence of the explanations in the
unqualified ISA 700 auditor‟s report result in a smaller difference in
perceptions between auditors and financial statement users regarding the
extent to which responsibility for the financial statements is ascribed to the
auditor?
RQ1b: Does the presence versus absence of the explanations in the
unqualified ISA 700 auditor‟s report result in a smaller difference in
perceptions between auditors and financial statement users regarding the
extent to which responsibility for the financial statements is ascribed to
management?
RQ1c: Does the presence versus absence of the explanations in the
unqualified ISA 700 auditor‟s report result in a smaller difference in
perceptions between auditors and financial statement users regarding the
extent to which reliability is ascribed to financial statements?
3. RESEARCH METHOD
3.1 Research design and participants
We conducted a full-factorial two (complete unqualified ISA 700 auditor‟s report and
an unqualified opinion-only version of this report) by three (auditors, financial
analysts, and students) between-subjects experiment with participants from Germany.
Participating auditors came from one German Big 4 audit firm. Part of the contact
details of financial analysts was received from the Bloomberg database. Additional
financial analysts were approached through the German Society of Investment

11
Professionals (DVFA). Finally, students at the Ruhr University Bochum and the
University of Münster participated in the study.
3.2 Measurement of the audit expectation gap
The primary dependent variables measuring the overall audit expectation gap are
multiple-item constructs adopted from instruments used in prior research (Best et al.,
2001; Gay et al., 1997; Monroe & Woodliff, 1993; Miller et al., 1993; Hatherley et
al., 1991; Holt & Moizer, 1990; Frank et al., 2001; Kelly & Mohrweis, 1989), which
assess: 1) the extent to which participants ascribe responsibility for the financial
statements toward the auditor (auditor responsibility), 2) the extent to which
participants ascribe responsibility for the financial statements toward management
(management responsibility), and 3) the extent to which participants ascribe reliability
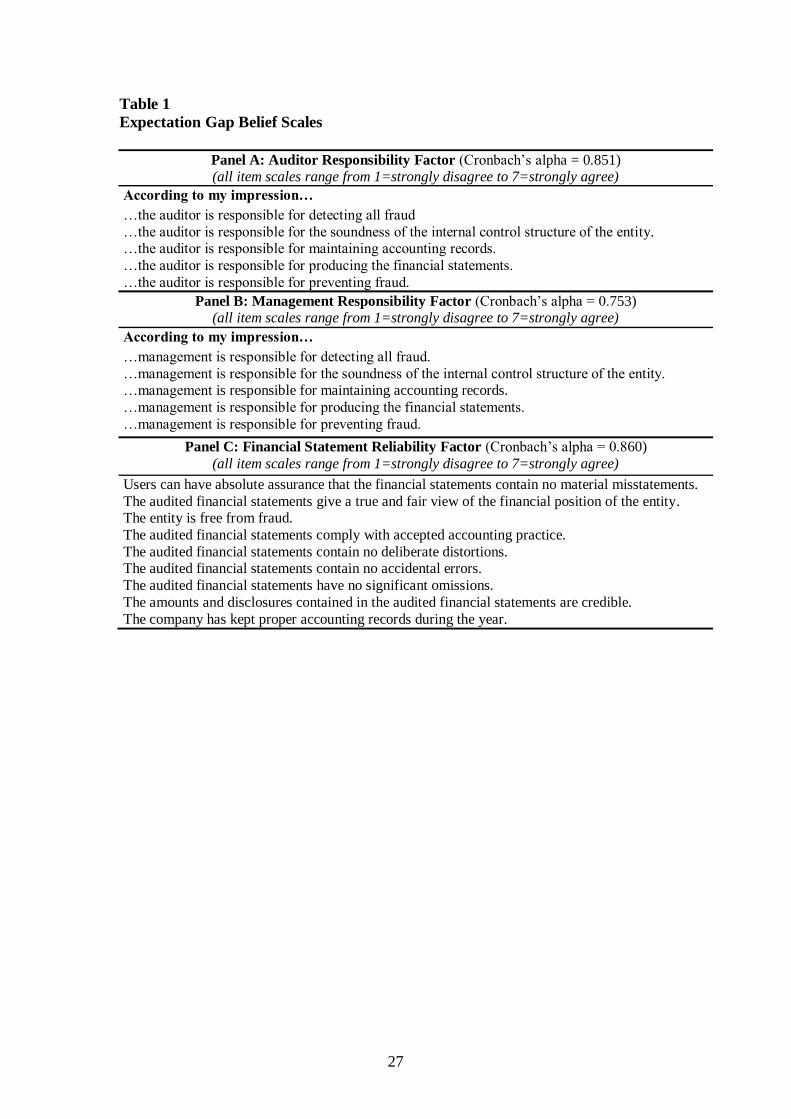
to the audited financial statements (reliability). Table 1 illustrates our expectation gap
belief scales and items.
<<<Insert Table 1 about here>>>
3.3 Experimental procedure and manipulations
The experiment was conducted as a web-based survey. Participants received an
invitation email that provided a link to the survey. The survey was designed with the
online survey software Globalpark. This software allows the random distribution of
two experimental treatments (complete unqualified ISA 700 auditor‟s report with
explanations versus unqualified audit opinion-only version of this report without
explanations) between participants. The survey was provided in German and
translated into English for reproduction in the Appendix.
All participants were asked to read a short description of a (fictitious) stock-
listed company, followed by summarized financial statement information from two
consecutive years. Following this firm-specific information, all participants were
shown the auditor‟s report on the financial statements. In the “opinion-only”
condition, participants only read the auditor‟s opinion, whereas the “complete
auditor‟s report” condition disclosed the complete text of the ISA 700 auditor‟s report
(including the opinion). Hence, the difference between the two conditions was the
presence versus absence of the first part of the text of the ISA 700 auditor‟s report,
which contains the explanations of the auditor‟s (vis-à-vis management‟s)
responsibilities and the nature, scope, and procedures of the audit. We use this
12
relatively strong manipulation in order to address the doubts regarding the
effectiveness of including explanations in the auditor‟s report, which we base on the
mixed findings in prior research. If the gap between auditors and users remains
unchanged using a complete ISA 700 auditor‟s report as compared to a mere opinion-
only version, this would be evidence of the ineffectiveness of ISA 700‟s explanations
beyond the audit opinion.4
Following the case description, participants responded to several sets of
questions relating to the three expectation gap constructs (see Table 1). Within each
set, the order of questions was randomized, and the questions were followed by
manipulation checks and demographic questions.5
4. RESULTS
4.1 Sample demographics
Auditors
We contacted approximately 1,450 Big Four auditors, and a total of 163 auditors
participated in the experiment (11.24% response rate). The average auditor was 42.1
years old and had 14.8 years of public accounting experience. Of the sample of
auditors, 127 (77.9%) were male. There were 29 partners, three directors, 37 senior
managers, 85 managers, and nine senior staff auditors. We asked all participants from
4 We considered a variety of alternative design choices, including the possibility of using the pre-ISA 700 report instead of the short-form, opinion-only version. We concluded that this possibility was less
appropriate for two important reasons. First, with such an approach it would have been impossible to
accurately attribute any effects to the specific underlying drivers, since we would have concurrently
varied many different factors (because the revision of ISA 700 involved quite a number of different wording changes within the explanations section of the auditor‟s report), but not the presence/absence
of explanations as such that we are interested in (and which is a clear-cut factor). Second, as outlined in
the literature review, prior research evidence is mixed, suggesting that the effects of explanations may
be rather small, dysfunctional, or even entirely absent. We wished to address this possibility in our
research design. If the pre-ISA 700 report had been used as the control condition, finding no effect of
the new report would not be informative, because this could be attributed to lack of statistical power.
Should, however, no effect be observed with our current design (which also features explicit
encouragement of participants to thoroughly read the provided auditor‟s report and control for
participants‟ reading intensity), we believe this would be strong evidence for a lack of effectiveness of
the explanations, because the same (differences in) expectations would be achieved without any
additional information beyond the mere audit opinion. Hence, our design choice allows for more
informative findings in the case of observing no effects. 5 After participants moved from one set of questions to a subsequent set, they could not go back and
change their previous answers. This was important to ensure that answers to the dependent variables
could not subsequently be changed after having read the manipulation check questions. In addition,
participants could not go back to the previous page of the auditor‟s report after they were presented with the questions. In this way, we ensured that participants reported their true perceptions after having
been exposed to the auditor‟s report. Otherwise, they would have been able to match their answers to
the detailed explanations contained in the auditor‟s report, which they might have re-read after
knowing the questions.
13
the different groups to rate which reputation level they believe the audit profession
holds. On a scale ranging from 1 (low) to 7 (high), auditors perceived the audit
profession to hold a fairly high reputation level (μ=5.45).
Financial analysts
A total of 868 financial analysts were contacted directly, and 105 financial analysts
participated in the study (7.14% response rate among the directly contacted analysts).6
The average financial analyst was 38.2 years old and had 13 years of work
experience. Of the financial analysts, 96 (91.4%) were male. There were 32 security
analysts, 17 portfolio managers, three fixed-income security analysts, four fixed-
income portfolio managers, six directors of research, four chief investment officers,
and 37 analysts with other functions. On a scale ranging from 1 (low) to 7 (high),
financial analysts held relatively high levels of experience with financial reports
(μ=5.11) and knowledge about financial reporting (μ=4.76), while their knowledge
about auditing was rather moderate (μ=3.32). Finally, analysts perceived the audit
profession to hold a reputation level slightly above the mid-point of the scale
(μ=3.68).
Students
Out of 706 students from two German universities, 202 responded to our experimental
survey and participated in the study (28.61% response rate). The average student was
24.1 years old and had 0.6 years of general work experience. Of the students, 143
(70.8%) were male. On a scale ranging from 1 (low) to 7 (high), students had
moderate overall experience with financial reports (μ=3.56) and knowledge of
financial reporting (μ=4.24). Knowledge about auditing was moderate as well
(μ=3.37). Finally, students perceived the audit profession to hold a relatively high
reputation level (μ=4.87).
4.2 Manipulation checks
To verify the effectiveness of the manipulation of the presence versus absence of the
explanations in the auditor‟s report (i.e., complete auditor‟s report versus opinion-
only), we asked participants two questions after they had completed the experimental
survey. First, participants were asked about the extent to which they agreed with the
6 The number of financial analysts contacted via the German Society of Investment Professionals (DVFA) is unknown to us.
14
statement “The auditor‟s report provided in the case materials explicitly described the
respective responsibilities of management and auditors.” (scale from 1=strongly
disagree to 7=strongly agree). The overall mean response was 4.81 for the „complete
report‟ treatment and 2.20 for the „opinion-only‟ treatment. The means are
significantly different (p<0.01), indicating successful manipulation. The manipulation
check was also successful when conducted separately for each individual user group
(i.e., auditors, financial analysts, and students) (largest p=0.000).
Second, participants were asked about the extent to which they agreed with the
statement “The auditor‟s report provided in the materials explicitly described the
scope and principles of the auditor‟s work.” (scale from 1=strongly disagree to
7=strongly agree). The overall mean response was 4.52 for the „complete report‟
treatment and 2.77 for the „opinion-only‟ treatment. The means are significantly
different (p<0.01), indicating successful manipulation. The manipulation check was
also successful when conducted separately for each individual user group (largest
p=0.01).
4.3 Preliminary testing
As previously described, we measured three dimensions of the expectation gap, two
of which assess the perceived responsibility for financial reporting (i.e., the
management responsibility and auditor responsibility dimensions), while the other
gauges the perceived reliability of the audited financial statements. An exploratory
factor analysis using all raw items as input variables was performed to verify whether
our three underlying theoretical constructs were empirically reproduced as separate
factors. This analysis indeed supports the existence of three stable constructs:7 1) the
responsibility of the auditor for the financial reporting (auditor responsibility), 2) the
responsibility of management for the financial reporting (management responsibility),
and 3) the reliability of the audited financial statements (reliability). Reliability
analyses reveal high Cronbach‟s alphas (0.85 for auditor responsibility, 0.78 for
management responsibility, and 0.86 for financial statement reliability), indicating
that all factors measure the underlying construct with a high degree of consistency.
Consequently, we tested our hypotheses on the basis of average indices of each of the
three constructs, rather than using the individual items.
7 This outcome is robust using either principal components analysis with varimax rotation that assumes uncorrelated factors or maximum-likelihood analysis with promax rotation, which allows the factors to
be correlated.
15
Furthermore, to reduce the overall experimental error, we included the
following covariates in our data analyses (i.e., ANCOVAs and post-hoc mean
comparisons): 1) age, 2) gender, 3) self-reported reading intensity of the financial
statements, 4) self-reported reading intensity of the auditor‟s report, and 5) perceived
audit profession reputation.8, 9
Even though not all measured variables are associated
with each of the three dependent constructs (see footnote 9) we include them as
covariates consistently across all analyses to control as much as possible for the
potential demographic variability in our responses. Footnotes to the upcoming
analyses indicate whether exclusion of the covariates modifies the results. As shown,
when this is the case, the main reported results are more conservative than the
footnoted results.
4.4 Hypotheses H1 and H2
H1 predicts that auditors‟ and financial statement users‟ perceptions about the ISA
700 auditor‟s report will differ significantly in terms of three dimensions: 1) the
responsibility ascribed to auditors (H1a), 2) the responsibility ascribed to management
(H1b), and 3) the reliability ascribed to the audited financial statements (H1c). H2
suggests that all three differences will be relatively greater between students and
auditors as compared to financial analysts and auditors. Table 2, 3, and 4 provide
adjusted means (Panel A), ANCOVAs (Panel B), and post-hoc mean comparisons
(Panel C) for tests of H1a-c and H2a-c.
For tests of H1 and H2, we used only those observations that were provided by
respondents in the treatment condition of the „complete auditor‟s report,‟ thus
8 We did not include experience-related variables as potential covariates, because we largely control for these attributes by splitting the sample into auditors, financial analysts, and students. 9 First, age is positively correlated with perceived management responsibility and negatively associated with perceived auditor responsibility and financial statement reliability (all p’s<0.01). Second, gender
is significantly associated with perceived management responsibility (p<0.01), such that men‟s mean
perception rating is higher (6.63) than women‟s mean rating (6.41). Third, we asked participants how
intensively they read the financial statements (1=did not read them/skipped them; 2=scanned them/read
them diagonally; 3=read them fairly thoroughly (word by word/number by number); and 4=read them
very thoroughly (e.g., several times/tried to memorize)). This measure is not correlated with any of the
three dependent variables. Fourth, using the same scale, we asked participants how intensively they
read the auditor‟s report. This measure is positively correlated with the dependent measure of perceived
management responsibility and negatively correlated with perceived auditor responsibility (both
p’s<0.05). Finally, we asked participants about their perceived audit profession reputation on a 7-point scale (ranging from 1=low to 7=high). This measure is negatively correlated with perceived auditor
responsibility (p<0.01), positively correlated with perceived management responsibility (p<0.01), and
negatively correlated with perceived financial statement reliability (p<0.05); hence we control for it in
all upcoming analyses.

16
omitting the „opinion-only‟ data.10
The reasoning behind this design choice is that H1
and H2 relate to differences in perceptions regarding the report as prescribed by ISA
700 (i.e., the complete report including the explanations). Upcoming tests of RQ1 (see
Tables 5, 6, and 7) will incorporate all the responses, i.e. including the data from
participants in the treatment condition of the „opinion-only‟ version of the report.
Auditor responsibility (H1a and H2a)
We conducted an ANCOVA with „group‟ (auditor, financial analyst, and student) as
the independent variable and the „auditor responsibility‟ index as the dependent
variable (see Table 2, Panel B). There is a significant difference between user groups
regarding the responsibility ascribed to auditors (p<0.001). Post-hoc mean
comparisons (see Table 2, Panel C) reveal that the auditors‟ mean responsibility rating
of 1.58 is significantly lower than the mean responsibility ratings of both financial
analysts (4.13) and students (3.99) (p<0.001).11,12
These findings clearly support H1a,
such that users ascribe greater responsibility for the financial statements to auditors, in
comparison to auditors themselves. Further, the difference in ascribed auditor
responsibility between students and auditors (Δ=2.41) is statistically equivalent to the
difference between financial analysts and auditors (Δ=2.55) (difference-in-difference
not significant; t-statistic=0.50; p=0.31; one-tailed).13
As such, the results are not
consistent with H2a, which predicted that students‟ ratings would differ more from
auditors‟ ratings than those of financial analysts.
<<<Insert Table 2 about here>>>
Management responsibility (H1b and H2b)
Next, we conducted an ANCOVA with „group‟ as the independent variable and the
„management responsibility‟ index as the dependent variable (see Table 3, Panel B).
There is a significant difference between user groups regarding the responsibility
ascribed to management (p<0.01). Post-hoc mean comparisons reveal that the
10 As a result, the number of observations for testing H1 and H2 is 124 for auditors, 39 for financial analysts, and 57 for students. 11 There is no significant difference between the mean ratings provided by financial analysts and students (p=0.63). 12 Results are equivalent when omitting covariates from the ANCOVA model and post-hoc analyses. 13 When omitting covariates from the difference-in-difference analysis (hence, employing raw means rather than adjusted means), the difference between auditors and students (Δ=2.41) is significantly
smaller than the difference between auditors and financial analysts (Δ=2.74; t-statistic=1.83; p=0.03;
one-tailed), but since the difference is rather trivial and is only observed in the ANOVA model without
the control variables, we do not discuss it at further length.
17
auditors‟ mean responsibility rating of 6.76 is not significantly different from the
mean responsibility rating of financial analysts (6.68; p=0.516) but is significantly
higher than students‟ mean rating (6.29; p<0.01). The difference between the mean
responsibility rating of financial analysts and students is also significant (p<0.01).14
These findings partially support H1b in that students (but not financial analysts)
ascribe lower responsibility to management, in comparison to auditors. The difference
in ascribed management responsibility between students and auditors (Δ=0.47) is
significantly greater than the difference between financial analysts and auditors
(Δ=0.08; t-statistic=3.01; p=0.00; one-tailed).15
<<<Insert Table 3 about here>>>
Financial Statement Reliability (H1c and H2c)
To test Hypotheses H1c and H2c, we conducted an ANCOVA with „group‟ as the
independent variable and the „financial statement reliability‟ index as the dependent
variable (see Table 4, Panel B). There is a marginally significant effect of user group
on financial statement reliability (p<0.10). Post-hoc mean comparisons (see Panel C)
show that the auditors‟ mean financial statement reliability rating of 3.89 is
marginally lower than the mean reliability rating provided by students (4.51; p<0.10)
but is not significantly different from financial analysts‟ mean reliability rating (3.92;
p=0.922). These findings partially support H1c, such that students (but not financial
analysts) ascribe greater reliability to audited financial statements than do auditors.
Again, the results also support H2c, because the difference in perceived financial
statement reliability between students and auditors (Δ=0.62) is significantly greater
than the difference between financial analysts and auditors (Δ=0.03; t-statistic=2.10;
p=0.02; one-tailed).16
4.5 Research question 1: Effect of explanations
RQ1 examines whether the presence (versus absence) of explanations in the
unqualified ISA 700 auditor‟s report reduces the difference in perceptions between
14 Results are equivalent when omitting covariates from the ANCOVA model and post-hoc analyses, with the exception that the difference between auditors and financial analysts is then also marginally
significant (p<0.10). 15 Results are equivalent when omitting covariates from the difference-in-difference analysis. 16 Results are equivalent when omitting covariates from the ANCOVA model, the post-hoc comparisons, and the difference-in-difference analysis, with the exception that the significance levels
for the group main effect (p<0.01) and the difference between auditor and student ratings (p<0.05) are
greater.

18
auditors and users in terms of responsibility ascribed to the auditor (RQ1a),
responsibility ascribed to management (RQ1b), and reliability ascribed to the audited
financial statements (RQ1c). Again, we conducted different ANCOVAs, one for each
dimension of the expectation gap. However, this time, we added the „opinion-only‟
data and included the auditor‟s report type (complete report [i.e. with explanations]
versus opinion-only report [i.e. without explanations]) as a second factor in each
model. Tables 5, 6, and 7 present means (adjusted for covariates) and ANCOVAs for
tests of RQ1.
Auditor responsibility
We conducted an ANCOVA with „group‟ (auditor versus financial analyst versus
student) and „auditor‟s report type‟ (complete report versus opinion-only) as the
independent variables and the „auditor responsibility‟ index as the dependent variable.
Table 5 presents the adjusted means per treatment condition (Panel A) and the
ANCOVA results (Panel B). As shown in Panel B, neither the main effect of the
auditor‟s report type (p=0.765) nor the interaction effect between group and auditor‟s
report type (p=0.446) on auditor responsibility ratings are significant. However, non-
tabulated simple mean comparisons of the significant group effect (p=0.000) reveal
that auditors‟ (adjusted) mean „auditor responsibility‟ rating (1.74) remains
significantly lower than both financial analysts‟ (4.10) and students‟ mean rating
(3.93), also when including the „opinion-only‟ treatment data in the study sample
(both p‟s<0.001).17
In conclusion, our results suggest that the presence (versus
absence) of explanations in the ISA 700 auditor‟s report does not affect the gap in
perceptions between auditors and users regarding the auditor‟s responsibility.
<<<Insert Table 5 about here>>>
Management responsibility
Next, we conducted an ANCOVA with „group‟ and „auditor‟s report type‟ as the
independent variables and the „management responsibility‟ index as the dependent
variable. Table 6 presents the adjusted means per treatment condition (Panel A) and
the ANCOVA results (Panel B). Again, the only significant effect is the main effect of
group (p<0.001), such that auditors rank the level of management‟s responsibility
marginally higher (6.87) than financial analysts (6.75; p<0.10) and significantly
17 Results are equivalent when omitting covariates from the ANCOVA model.

19
higher than students (6.26; p<0.001) do. The main effect of the report type and the
interaction effect are both insignificant.18
In conclusion, our results suggest that the
presence (versus absence) of explanations in the ISA 700 auditor‟s report does not
affect the gap in perceptions between auditors and users regarding the management‟s
responsibility.
<<<Insert Table 6 about here>>>
Financial statement reliability
To examine RQ1c, we conducted an ANCOVA with „group‟ and „auditor‟s report
type‟ as the independent variables and the „financial statement reliability‟ index as the
dependent variable. Table 7 reports the adjusted means per treatment condition (Panel
A) and the ANCOVA results (Panel B). Neither the two main effects nor the
interaction effect are significant (smallest p=0.346). Hence, the presence (versus
absence) of the explanations in the ISA 700 auditor‟s report does not bring users‟
reliability ratings closer to the auditors‟ ratings.19
<<<Insert Table 7 about here>>>
At least to the extent that auditor perceptions can be used as a “benchmark”
for normative perceptions of management and auditor responsibilities and financial
statement reliability, our results do not suggest that the presence of the ISA 700
explanations of management‟s and auditor‟s respective responsibilities and of the
nature, scope, and procedures of the audit in the complete auditor‟s report affects the
expectation gap. In contrast, we find a similar gap in perceptions when the complete
report with its detailed explanations is provided as when a report with the mere audit
opinion is provided.
5. DISCUSSION AND CONCLUSIONS
Over 70 jurisdictions around the world have adopted the ISAs, and several additional
implementations are pending, most notably in the EU and China. These developments
reinforce the need for further empirical evidence on international users‟ perceptions of
ISA 700, which is one of the most important standards with respect to enhancing
18 Results are equivalent when omitting covariates from the ANCOVA model, except that the difference between auditors and financial analysts is greater (p<0.05). 19 When omitting covariates from the ANCOVA model, the group main effect turns significant (p=0.001), and non-tabulated mean comparisons reveal that students‟ unadjusted mean (4.31) is
significantly greater than both auditors‟ unadjusted mean (4.02; p<0.05) and financial analysts‟
unadjusted mean (3.77; p<0.001).

20
investors‟ confidence in financial reporting. Given permanent revisions of current
standards to address changing investor needs, empirical evidence on user perceptions
is a crucial means of providing insight into possible needs and directions for standard
revisions. Because individual jurisdictions plan to adopt and build on the existing ISA
700, such as the EU or national standard-setters, high-quality standards are an
important condition for consistency and standard-setting transparency.
Prior research has repeatedly indicated the existence of an expectation gap
between auditors (who are knowledgeable about the purpose and implications of an
audit) and users regarding the reliability of audited financial statements and the
respective responsibilities that managers and auditors assume. This phenomenon has
been demonstrated across time and national borders, and even despite various
institutional changes to narrow the gap. Indeed, the revised ISA 700 auditor‟s report
represents one such attempt. Hence, this study was conducted to empirically assess
the current state of the expectation gap under the revised ISA 700 by inquiring a
sample of German auditors and financial statement users.
Consistent with our prediction, we found that users ascribed far greater
responsibility for the financial statements to auditors (well above the midpoint of the
scale) as compared to auditors, who ascribed almost no responsibility to their own
profession. Although we expected a greater gap between auditors and students when
compared to the gap between auditors and analysts, the results are not significant in
this regard. These findings are in line with recent US literature on the audit
expectation gap, where Reckers et al. (2007) found that auditors‟ attitudes toward the
public accounting profession were more favourable than those of judges, law students,
and MBA students, and where Butler et al. (2010) identified important differences
between auditors‟ and investors‟ perceptions of the intended meanings of key terms
used to define auditors‟ responsibilities.
Considering the assessment of management‟s responsibility, we observed a
gap between auditors and users, which was driven by a somewhat lower rating by the
group of less experienced financial statement users (students). However, it is
important to note that all three groups assigned a relatively high level of responsibility
(all means greater than 6 on a 7-point scale) to management, indicating a clear
narrowing of the expectation gap in this regard as compared to prior research. Finally,
with respect to perceived financial statement reliability, all three groups provided a
moderately high ranking (around 4 on a 7-point scale), though students rated

21
reliability somewhat higher than auditors and analysts. Again, we conclude that the
gap in this dimension is relatively minor.
These findings suggest that the audit expectation gap persists but appears to be
largely driven by discrepant expectations between auditors and users regarding the
formal responsibilities and abilities of the auditor. However, the gap is smaller with
regard to management responsibilities and the perceived reliability of audited
financial statements.
We further investigated the effect of the explanations provided in the ISA 700
auditor‟s report by comparing user perceptions based on the complete report that
contained these explanations versus an opinion-only version that did not. This
approach allowed us to test whether or not the presence of the explanations mandated
by the revised ISA 700 would lead to an alignment of users‟ perceptions toward those
of auditors. Our results suggest that despite the underlying objective of the revised
ISA 700 auditor‟s report, the presence of the (quite extensive) ISA 700 explanations
does not affect the expectation gap.
This study has some limitations that should be acknowledged. First, a
maintained assumption is that auditors‟ perceptions can be considered a benchmark
for the normative responsibilities and financial statement reliability. Though auditors
are likely to have self-interest and may also respond strategically to questions
regarding their own responsibilities, we suggest that it is plausible to assume that
auditors are the best profession available to use as a benchmark in this regard, due to
their in-depth knowledge of the audit process. Indeed, this is a maintained assumption
in most prior empirical research on the audit expectation gap. Second, our study is
limited to comparing the perceptions of auditors, financial analysts, and students, and
we acknowledge that there may be other stakeholders whose perceptions are also
important to consider.20
Finally, to judge whether there has been a true change in
perceptions, some might argue that the pre-ISA 700 auditor‟s report would be a more
suitable alternative condition than our opinion-only version of the ISA 700 auditor‟s
report that excludes all explanations. However, as discussed extensively in footnote 4,
this alternative design would have involved severe problems and losing the particular
benefits of our design choice.
20 See e.g. Ruhnke et al. (2010) for survey based evidence on general expectations regarding the auditor‟s work of some additional stakeholder groups in Germany, including university professors,
business press journalists, or bank officers.
22
Overall, while the fact that an audit expectation gap still exists under the new
ISA 700 auditor‟s report is in line with our expectations, it is disconcerting that the
(quite detailed) explanations of auditor versus management responsibilities and of the
nature, scope, and procedures of the audit do not favourably affect the gap. This
observation may indicate that the explanations would need to be formulated more
explicitly and clearly, or even that user‟ perceptions are not malleable by additional
explanations in the auditor‟s report. The latter concern is also supported by a recent
qualitative study by Mock et al. (2011), which similarly suggests that financial
statement users only consider the actual audit opinion (as long as it is unqualified) as
the relevant signal but that they disregard the long text of the report and the
explanations included beyond the opinion itself. This may suggest that wording
changes are not the solution needed to overcome the expectation gap, possibly
because users‟ expectations are determined by rather stable preconceptions.21
At this
stage, however, any specific recommendations are speculative and require further
research for validation.
21 For a general discussion on the clarity of audit standards see Dennis (2010a).

23
REFERENCES
Anderson, B., Maletta M. & Wright, A. (1998), „Perceptions of auditor responsibility:
Views of the judiciary and the profession‟, International Journal of Auditing,
Vol. 2, No. 3, pp. 215-232.
Bailey, K. E., Bylinski, J. H. & Shield, M. D. (1983), „Effects of auditor‟s report
wording changes on the perceived message‟, Journal of Accounting Research,
Vol. 21, No. 2, pp. 355-370.
Best, P., Bucky, S. & Tan, C. (2001). „Evidence of the audit expectation gap in
Singapore‟, Managerial Auditing Journal, Vol. 16, No. 3, pp. 134-144.
Brown, T., Hatherly, D. & Innes, J. (1993), „The review report: An empirical
investigation., Accounting and Business Research, Vol. 24, No. 93, pp. 11-18.
Butler, S. A., Ward, B. & Zimbelman, M. F. (2010), „An exploration of differences in
auditors‟ and users‟ perceptions of key terms used to define auditors‟
responsibilities‟, International Journal of Accounting, Auditing and
Performance Evaluation, Vol. 6, No. 1, pp. 80-107.
Chong, K.-M. & Pflugrath, G. (2008), „Do different auditor‟s report formats affect
shareholders‟ and auditors‟ perceptions?‟, International Journal of Auditing,
Vol. 12, No. 3, pp. 221-241.
Dennis, I. (2010a), „What do you expect? A reconfiguration of the audit expectation
gap‟, International Journal of Auditing, Vol. 14, No. 2, pp. 130-146.
Dennis, I. (2010b), „Clarity begins at home: An examination of the conceptual
underpinnings of the IAASB‟s Clarity Project‟, International Journal of
Auditing, Vol. 14, No. 3, pp. 294-319.
Dewing, I. P. & Russell, P. O. (2002), „UK fund managers, audit regulation and the
new accountancy foundation: Towards a narrowing of the audit expectation
gap‟, Managerial Auditing Journal, Vol. 17, No. 9, pp. 537-545.
Duréndez Gómez-Guillamón, A. D. (2003), „The usefulness of the auditor‟s report in
investment and financing decisions‟, Managerial Auditing Journal, Vol. 18,
No. 6/7, pp. 549-559.
Epstein, M. J., & Geiger, M. A. (1994), „Investor views of audit assurance: Recent
evidence of the expectation gap‟, Journal of Accountancy, Vol. 177, No. 1, pp.
60-66.
European Parliament and Council (2006), „Directive 2006/43/EC of the European
Parliament and of the Council of 17 May 2006 on statutory audits of annual
accounts and consolidated accounts, amending Council Directive 78/660/EEC
and 83/349/EEC and repealing Council Directive 84/253/EEC‟, European
Commission website,
http://ec.europa.eu/internal_market/auditing/directives/index_en.htm, accessed
26 April 2011.
Fadzly, M. N. & Ahmad, Z. (2004), „Audit expectation gap: The case of Malaysia‟,
Managerial Auditing Journal, Vol. 19, No. 7, pp. 897-915.
Frank, K. E., Lowe, D. J. & Smith, J.K. (2001), „The expectation gap: Perceptual
differences between auditors, jurors and students‟, Managerial Auditing
Journal, Vol. 16, No. 3, pp. 145-149.

24
Gay, G., Schelluch, P. & Reid, I. (1997), „Users‟ perceptions of the auditing
responsibilities for the prevention, detection and reporting of fraud, other
illegal acts and errors‟, Australian Accounting Review, Vol. 7, No. 13, pp. 51-
61.
Gay, G., Schelluch, P. & Baines, A. (1998), „Perceptions of messages conveyed by
review and auditor‟s reports‟, Accounting, Auditing & Accountability Journal,
Vol. 11, No. 4, pp. 472-494.
Gramling, A. A., Schatzberg, J.W. & Wallace W. A. (1996), „The role of
undergraduate auditing coursework in reducing the expectation gap‟, Issues in
Accounting Education, Vol. 11, No. 1, pp. 131-160.
Hasan, M., Maijoor, S., Mock, T. J., Roebuck, P., Simnett, R. & Vanstraelen, A.
(2005), „The different types of assurance services and levels of assurance
provided‟, International Journal of Auditing, Vol. 9, No. 2, pp. 91-102.
Hatherly, D., Innes, J. & Brown, T. (1991), „The expanded auditor‟s report: An
empirical investigation‟, Accounting and Business Research, Vol. 21, No. 84,
pp. 311-319.
Holt, G., & Moizer, P. (1990), „The meaning of auditor‟s reports‟, Accounting and
Business Research, Vol. 20, No. 78, pp. 111-121.
Houghton, K. A. (1987), „True and fair view: An empirical study of connotative
meaning‟, Accounting, Organizations and Society, Vol. 12, No. 2, pp. 143-
152.
Humphrey, C., Loft, A. & Woods, M. (2009), „The global audit profession and the
international financial architecture: Understanding regulatory relationships at a
time of financial crisis‟, Accounting, Organizations and Society, Vol. 34, No.
6-7, pp. 810-825.
Humphrey, C., Moizer, P. & Turley, S. (1992), „The audit expectation gap: Plus ça
change, plus c‟est la même chose?‟, Critical Perspectives in Accounting, Vol.
3, No. 2, pp. 137-161.
Humphrey, C., Moizer, P. & Turley, S. (1993), „The audit expectation gap in Britain:
An empirical investigation‟, Accounting and Business Research, Vol. 23, No.
91A, pp. 395-411.
Humphrey, C. & Owen, D. (2000), „Debating the „power‟ of audit‟, International
Journal of Auditing, Vol. 4, No. 1, pp. 29-50.
Innes, J., Brown, T. & Hatherly, D. (1997), „The expanded auditor‟s report – A
research study within the development of SAS 600‟, Accounting, Auditing and
Accountability Journal, Vol. 10, No. 5, pp. 702-717.
International Auditing and Assurance Standards Board (IAASB) (2004), „Project
History: The Independent Auditor‟s Report on a Complete Set of General
Purpose Financial Statements – Completed.‟ IFAC website,
http://www.ifac.org/IAASB/ProjectHistory.php?ProjID=0013, accessed 10
September 2010.
International Federation of Accountants (IFAC) (2008), „International Standard on
Auditing (ISA) 700: The independent auditor‟s report on a complete set of
general purpose financial statements‟, Handbook of International Auditing,
Assurance, and Ethics Pronouncements. 2008 Edition, Part I, New York, NY:
IFAC, pp. 561-579.

25
Kelly, A. S. & Mohrweis, L. C. (1989), „Bankers‟ and investors‟ perceptions of the
auditor‟s role in financial statement reporting: The impact of SAS No. 58‟,
Auditing: A Journal of Practice & Theory, Vol. 9, No. 1, pp. 87-97.
Kirk, N. E. (2006), „Perceptions of the true and fair view concept: An empirical
investigation‟, ABACUS, Vol. 42, No. 2, pp. 205-235.
Kneer, D. C., Reckers, P. M. J. & Jennings, M. M. (1996), „An empirical examination
of the influence of the „new‟ US auditor‟s report and fraud red-flags on
perceptions of auditor culpability‟, Managerial Auditing Journal, Vol. 11, No.
6, pp. 18-30.
Koh, H. C. & Woo, E. (1998), „The expectation gap in auditing‟, Managerial Auditing
Journal, Vol. 13, No. 3, pp. 147-154.
Libby, R. (1979), „Bankers‟ and auditors‟ perceptions of the message communicated
by the auditor‟s report‟, Journal of Accounting Research, Vol. 17, No. 1, pp.
99-122.
Lin, Z.J. & Chen, F. (2004), „An empirical study of the audit “expectation gap” in the
People‟s Republic of China‟, International Journal of Auditing, Vol. 8, pp. 93-
115.
Lowe, D. (1994), „The expectation gap in the legal system: perception differences
between auditors and judges‟, Journal of Applied Business Research, Vol. 10,
pp. 39-44.
Manson, S. & Zaman, M. (2001), „Auditor communication in an evolving
environment: Going beyond SAS 600 auditor‟s report on financial statements‟,
British Accounting Review, Vol. 33, No. 2, pp. 113-136.
McEnroe, J. & Martens, S. C. (2001), „Auditors‟ and investors‟ perceptions of the
„expectation gap‟‟, Accounting Horizons, Vol. 15, No. 4, pp. 345-358.
Miller, J. R., Reed, S. A. & Strawser, R. H. (1993), „Bank loan officers‟ perceptions
of the new auditor‟s report‟, Accounting Horizons, Vol. 7, No. 1, pp. 39-52.
Mock, T. J., Turner, J. L., Gray, G. L., & Coram, P. J. (2011), „The unqualified
auditor‟s report: A study of user perceptions, effects on user decisions and
decision processes, and directions for future research‟, forthcoming in
Accounting Horizons.
Monroe, G. S. & Woodliff, D. R. (1993), „The effect of education on the audit
expectation gap‟, Accounting and Finance, Vol. 33, No. 1, pp. 61-78.
Monroe, G .S., & Woodliff, D. R. (1994), „An empirical investigation of the audit
expectation gap: Australian evidence‟, Accounting and Finance, Vol. 34, No.
1, pp. 47-74.
Nair, R. D. & Rittenberg, L. E. (1987), „Messages perceived from audit, review, and
compilation reports: Extension to more diverse groups‟, Auditing: A Journal
of Practice, Vol. 7, No. 1, pp. 15-38.
Öhman, P., Häckner, E., Jansson, A. M. & Tschudi, F. (2006), „Swedish auditors‟
view of auditing: Doing things right versus doing the right things‟, European
Accounting Review, Vol. 15, No. 1, pp. 89-114.
Porter, B. (1993), „An empirical study of the audit expectation-performance gap‟,
Accounting and Business Research, Vol. 24, No. 93, pp. 49-68.
Reckers, P. M. J., Jennings, M., Lowe, D. J. & Pany, K. (2007), „Judges‟ attitudes
toward the public accounting profession‟, European Accounting Review, Vol.
16, No. 3, pp. 625-645.

26
Ruhnke, K., Schmiele, C. & Schwind, J. (2010), „Die Erwartungslücke als
permanentes Phänomen der Abschlussprüfung: Definitionsansatz, empirische
Untersuchung und Schlussfolgerungen‟, Zeitschrift für betriebswirtschaftliche
Forschung, Vol. 62, No. 4, pp. 394-421.
Schelluch, P. (1996), „Long form audit-report messages: Further implications of the
audit expectation gap‟, Accounting Research Journal, Vol. 9, No. 1, pp. 48-55.
Sidani, Y. M. (2007), „The audit expectation gap: Evidence from Lebanon‟,
Managerial Auditing Journal, Vol. 22, No. 3, pp. 288-302.
Siddiqui, J., Nasreen, T. & Choudhury-Lena, A. (2009), „The audit expectations gap
and the role of audit education: the case on an emerging economy‟,
Managerial Auditing Journal, Vol. 24, No. 6, pp. 564-583.
27
Table 1
Expectation Gap Belief Scales
Panel A: Auditor Responsibility Factor (Cronbach‟s alpha = 0.851) (all item scales range from 1=strongly disagree to 7=strongly agree)
According to my impression…
…the auditor is responsible for detecting all fraud
…the auditor is responsible for the soundness of the internal control structure of the entity. …the auditor is responsible for maintaining accounting records.
…the auditor is responsible for producing the financial statements.
…the auditor is responsible for preventing fraud.
Panel B: Management Responsibility Factor (Cronbach‟s alpha = 0.753) (all item scales range from 1=strongly disagree to 7=strongly agree)
According to my impression…
…management is responsible for detecting all fraud.
…management is responsible for the soundness of the internal control structure of the entity. …management is responsible for maintaining accounting records.
…management is responsible for producing the financial statements.
…management is responsible for preventing fraud.
Panel C: Financial Statement Reliability Factor (Cronbach‟s alpha = 0.860)
(all item scales range from 1=strongly disagree to 7=strongly agree)
Users can have absolute assurance that the financial statements contain no material misstatements.
The audited financial statements give a true and fair view of the financial position of the entity. The entity is free from fraud.
The audited financial statements comply with accepted accounting practice.
The audited financial statements contain no deliberate distortions. The audited financial statements contain no accidental errors.
The audited financial statements have no significant omissions.
The amounts and disclosures contained in the audited financial statements are credible.
The company has kept proper accounting records during the year.

28
Table 2
Test of H1a and H2a (Auditor Responsibility Index)
Panel A: Adjusted Means for Auditor Responsibility Index
Group Mean S.E. N
Auditor 1.58 0.19 71
Financial Analyst 4.13 0.19 47
Student 3.99 0.17 95
Panel B: ANCOVA Results for Auditor Responsibility Index
Source
Type III Sum
of Squares df
Mean
Square
F-
Value
p-
value
Corrected Model 323.61 7 46.23 33.92 0.000
Group 149.02 2 74.51 54.66 0.000
Covariates:
Age 0.00 1 0.00 0.00 0.99
Gender 0.54 1 0.54 0.40 0.528
Self-reported reading
intensity of financial
statements 0.79 1 0.79 0.58 0.446
Self-reported reading
intensity of auditor‟s
report 5.65 1 5.65 4.15 0.043
Perceived audit
profession reputation 7.02 1 7.02 5.15 0.024
Error 279.44 205 1.36
Panel C: Post-hoc Mean Comparisons (Least Significant Difference)
S.E.
p-
value
Auditor vs. Financial Analyst 0.25 0.000
Auditor vs. Student 0.31 0.000
Financial Analyst vs. Student 0.28 0.626
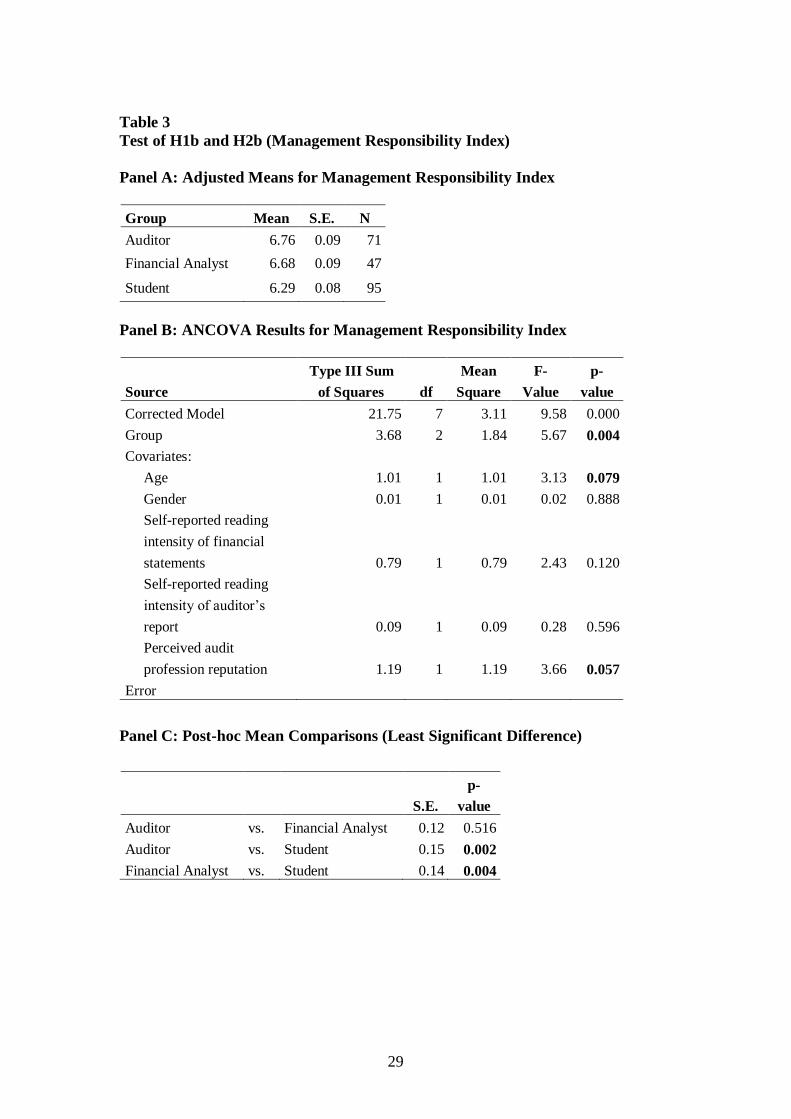
29
Table 3
Test of H1b and H2b (Management Responsibility Index)
Panel A: Adjusted Means for Management Responsibility Index
Group Mean S.E. N
Auditor 6.76 0.09 71
Financial Analyst 6.68 0.09 47
Student 6.29 0.08 95
Panel B: ANCOVA Results for Management Responsibility Index
Source
Type III Sum
of Squares df
Mean
Square
F-
Value
p-
value
Corrected Model 21.75 7 3.11 9.58 0.000
Group 3.68 2 1.84 5.67 0.004
Covariates:
Age 1.01 1 1.01 3.13 0.079
Gender 0.01 1 0.01 0.02 0.888
Self-reported reading
intensity of financial
statements 0.79 1 0.79 2.43 0.120
Self-reported reading
intensity of auditor‟s
report 0.09 1 0.09 0.28 0.596
Perceived audit
profession reputation 1.19 1 1.19 3.66 0.057
Error
Panel C: Post-hoc Mean Comparisons (Least Significant Difference)
S.E.
p-
value
Auditor vs. Financial Analyst 0.12 0.516
Auditor vs. Student 0.15 0.002
Financial Analyst vs. Student 0.14 0.004

30
Table 4
Test of H1c and H2c (Financial Statement Reliability Index)
Panel A: Adjusted Means for Financial Statement Reliability Index
Group Mean S.E. N
Auditor 3.89 0.20 71
Financial Analyst 3.92 0.20 47
Student 4.51 0.18 95
Panel B: ANCOVA Results for Financial Statement Reliability Index
Source
Type III Sum
of Squares df
Mean
Square
F-
Value
p-
value
Corrected Model 28.69 7 4.10 2.80 0.008
Group 6.98 2 3.49 2.38 0.095
Covariates:
Age 0.23 1 0.23 0.16 0.692
Gender 6.99 1 6.99 4.77 0.030
Self-reported reading
intensity of financial
statements 3.30 1 3.30 2.25 0.135
Self-reported reading
intensity of auditor‟s
report 0.06 0 0.06 0.04 0.840
Perceived audit
profession reputation 2.20 1 2.20 1.50 0.222
Error 300.70 205 1.47
Panel C: Post-hoc Mean Comparisons (Least Significant Difference)
S.E.
p-
value
Auditor vs. Financial Analyst 0.26 0.922
Auditor vs. Student 0.32 0.059
Financial Analyst vs. Student 0.29 0.043
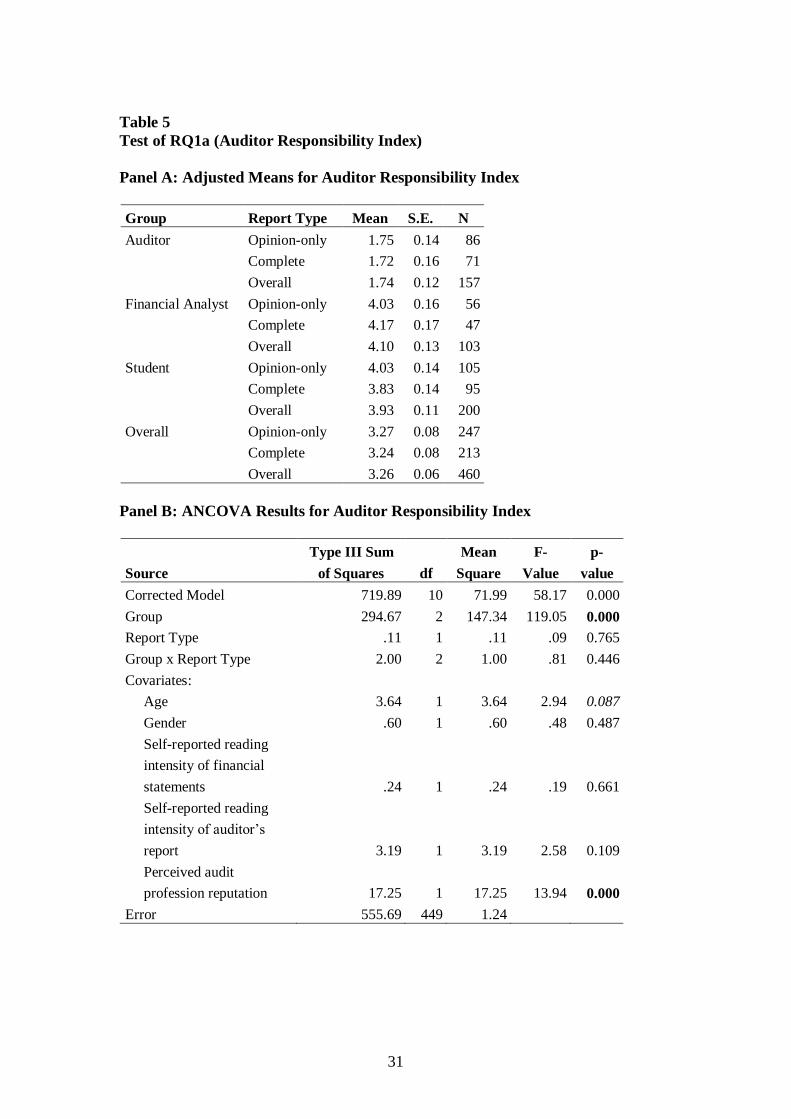
31
Table 5
Test of RQ1a (Auditor Responsibility Index)
Panel A: Adjusted Means for Auditor Responsibility Index
Group Report Type Mean S.E. N
Auditor Opinion-only 1.75 0.14 86
Complete 1.72 0.16 71
Overall 1.74 0.12 157
Financial Analyst Opinion-only 4.03 0.16 56
Complete 4.17 0.17 47
Overall 4.10 0.13 103
Student Opinion-only 4.03 0.14 105
Complete 3.83 0.14 95
Overall 3.93 0.11 200
Overall Opinion-only 3.27 0.08 247
Complete 3.24 0.08 213
Overall 3.26 0.06 460
Panel B: ANCOVA Results for Auditor Responsibility Index
Source
Type III Sum
of Squares df
Mean
Square
F-
Value
p-
value
Corrected Model 719.89 10 71.99 58.17 0.000
Group 294.67 2 147.34 119.05 0.000
Report Type .11 1 .11 .09 0.765
Group x Report Type 2.00 2 1.00 .81 0.446
Covariates:
Age 3.64 1 3.64 2.94 0.087
Gender .60 1 .60 .48 0.487
Self-reported reading
intensity of financial
statements .24 1 .24 .19 0.661
Self-reported reading
intensity of auditor‟s
report 3.19 1 3.19 2.58 0.109
Perceived audit
profession reputation 17.25 1 17.25 13.94 0.000
Error 555.69 449 1.24
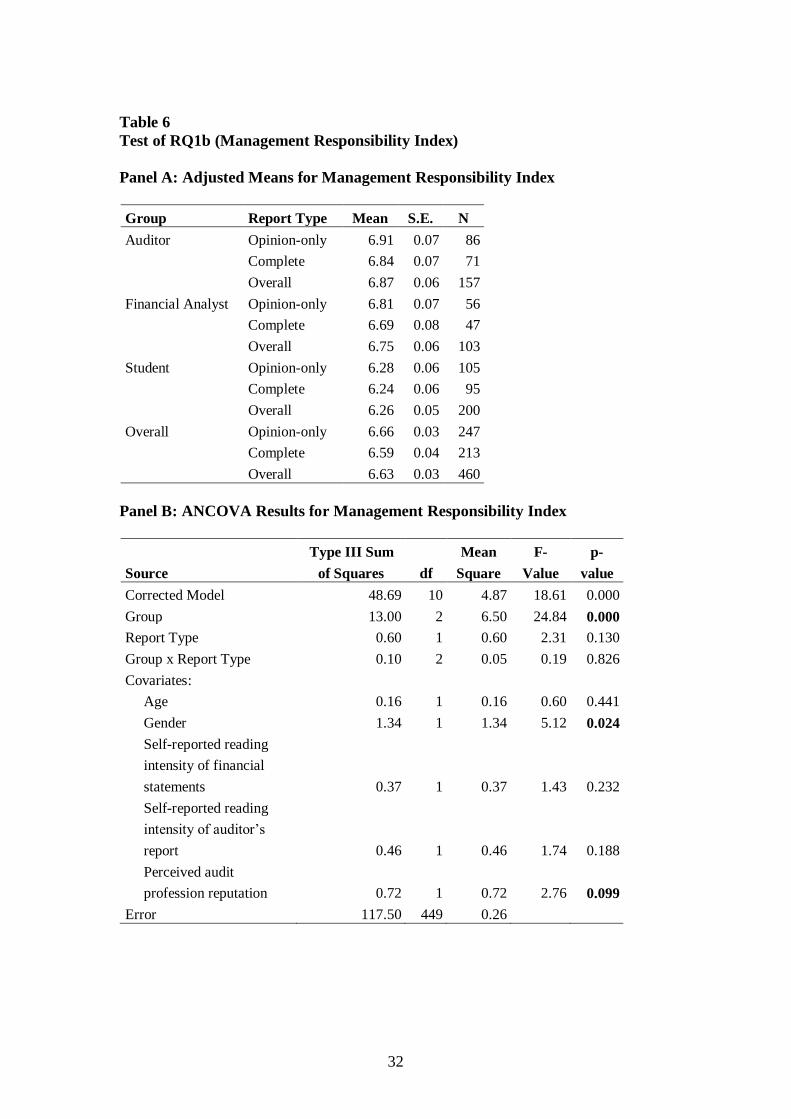
32
Table 6
Test of RQ1b (Management Responsibility Index)
Panel A: Adjusted Means for Management Responsibility Index
Group Report Type Mean S.E. N
Auditor Opinion-only 6.91 0.07 86
Complete 6.84 0.07 71
Overall 6.87 0.06 157
Financial Analyst Opinion-only 6.81 0.07 56
Complete 6.69 0.08 47
Overall 6.75 0.06 103
Student Opinion-only 6.28 0.06 105
Complete 6.24 0.06 95
Overall 6.26 0.05 200
Overall Opinion-only 6.66 0.03 247
Complete 6.59 0.04 213
Overall 6.63 0.03 460
Panel B: ANCOVA Results for Management Responsibility Index
Source
Type III Sum
of Squares df
Mean
Square
F-
Value
p-
value
Corrected Model 48.69 10 4.87 18.61 0.000
Group 13.00 2 6.50 24.84 0.000
Report Type 0.60 1 0.60 2.31 0.130
Group x Report Type 0.10 2 0.05 0.19 0.826
Covariates:
Age 0.16 1 0.16 0.60 0.441
Gender 1.34 1 1.34 5.12 0.024
Self-reported reading
intensity of financial
statements 0.37 1 0.37 1.43 0.232
Self-reported reading
intensity of auditor‟s
report 0.46 1 0.46 1.74 0.188
Perceived audit
profession reputation 0.72 1 0.72 2.76 0.099
Error 117.50 449 0.26

33
Table 7
Test of RQ1c (Financial Statement Reliability Index)
Panel A: Adjusted Means for Financial Statement Reliability Index
Group Report Type Mean S.E. N
Auditor Opinion-only 4.14 0.16 86
Complete 4.07 0.17 71
Overall 4.11 0.13 157
Financial Analyst Opinion-only 3.94 0.18 56
Complete 3.94 0.19 47
Overall 3.94 0.14 103
Student Opinion-only 4.06 0.15 105
Complete 4.35 0.15 95
Overall 4.20 0.12 200
Overall Opinion-only 4.05 0.08 247
Complete 4.12 0.09 213
Overall 4.08 0.06 460
Panel B: ANCOVA Results for Financial Statement Reliability Index
Source
Type III Sum
of Squares df
Mean
Square
F-
Value
p-
value
Corrected Model 33.60 10 3.36 2.23 0.015
Group 2.95 2 1.48 0.98 0.376
Report Type 0.55 1 0.55 0.37 0.546
Group x Report Type 3.20 2 1.60 1.06 0.346
Covariates:
Age 2.89 1 2.89 1.92 0.167
Gender 1.12 1 1.12 0.75 0.388
Self-reported reading
intensity of financial
statements 0.02 1 0.02 0.02 0.902
Self-reported reading
intensity of auditor‟s
report 3.93 1 3.93 2.61 0.107
Perceived audit
profession reputation
Error 676.00 449 1.51
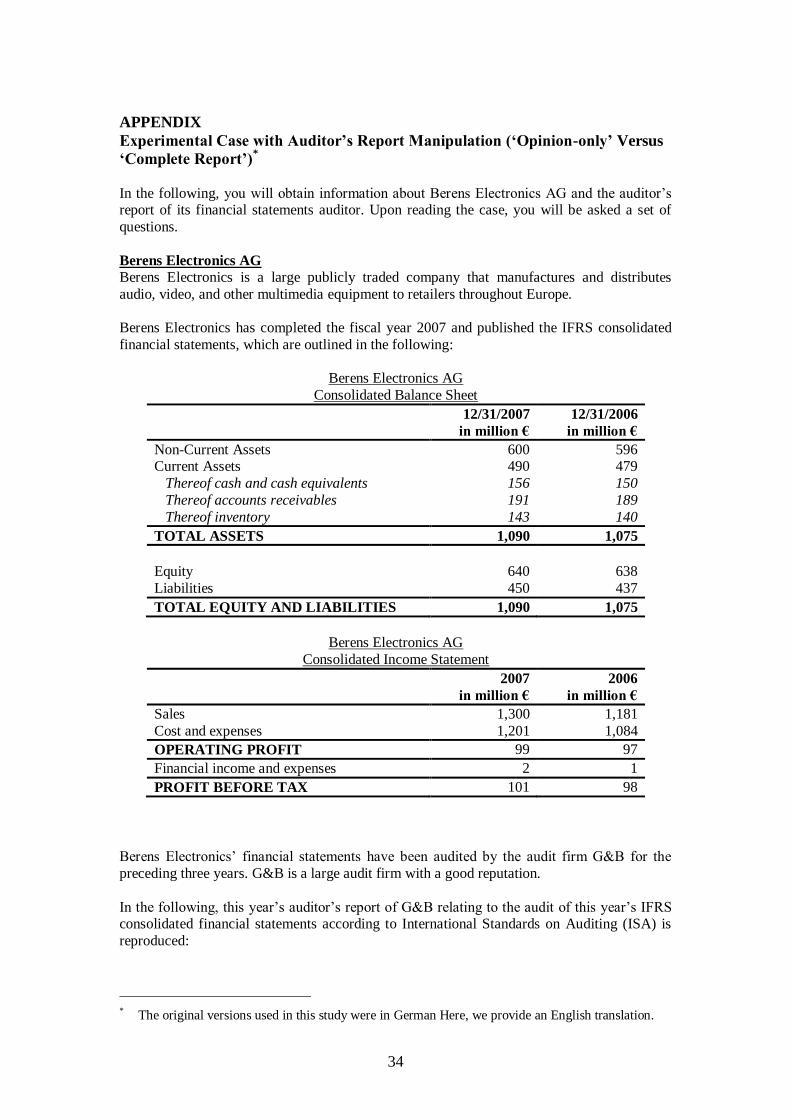
34
APPENDIX
Experimental Case with Auditor’s Report Manipulation (‘Opinion-only’ Versus
‘Complete Report’)*
In the following, you will obtain information about Berens Electronics AG and the auditor‟s report of its financial statements auditor. Upon reading the case, you will be asked a set of
questions.
Berens Electronics AG
Berens Electronics is a large publicly traded company that manufactures and distributes
audio, video, and other multimedia equipment to retailers throughout Europe.
Berens Electronics has completed the fiscal year 2007 and published the IFRS consolidated
financial statements, which are outlined in the following:
Berens Electronics AG
Consolidated Balance Sheet
12/31/2007
in million €
12/31/2006
in million €
Non-Current Assets 600 596 Current Assets 490 479
Thereof cash and cash equivalents 156 150
Thereof accounts receivables 191 189
Thereof inventory 143 140
TOTAL ASSETS 1,090 1,075
Equity 640 638
Liabilities 450 437
TOTAL EQUITY AND LIABILITIES 1,090 1,075
Berens Electronics AG
Consolidated Income Statement
2007
in million €
2006
in million €
Sales 1,300 1,181
Cost and expenses 1,201 1,084
OPERATING PROFIT 99 97
Financial income and expenses 2 1
PROFIT BEFORE TAX 101 98
Berens Electronics‟ financial statements have been audited by the audit firm G&B for the
preceding three years. G&B is a large audit firm with a good reputation.
In the following, this year‟s auditor‟s report of G&B relating to the audit of this year‟s IFRS consolidated financial statements according to International Standards on Auditing (ISA) is
reproduced:
* The original versions used in this study were in German Here, we provide an English translation.
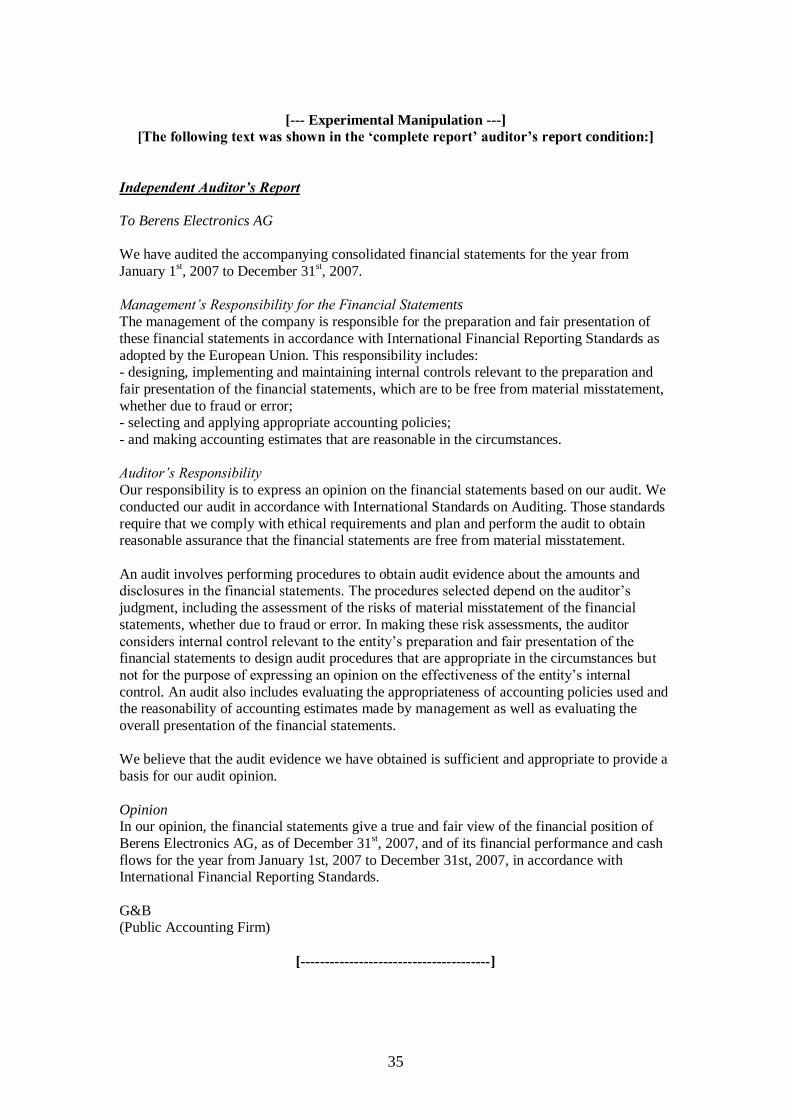
35
[--- Experimental Manipulation ---]
[The following text was shown in the ‘complete report’ auditor’s report condition:]
Independent Auditor’s Report
To Berens Electronics AG
We have audited the accompanying consolidated financial statements for the year from
January 1st, 2007 to December 31
st, 2007.
Management’s Responsibility for the Financial Statements
The management of the company is responsible for the preparation and fair presentation of
these financial statements in accordance with International Financial Reporting Standards as
adopted by the European Union. This responsibility includes: - designing, implementing and maintaining internal controls relevant to the preparation and
fair presentation of the financial statements, which are to be free from material misstatement,
whether due to fraud or error; - selecting and applying appropriate accounting policies;
- and making accounting estimates that are reasonable in the circumstances.
Auditor’s Responsibility
Our responsibility is to express an opinion on the financial statements based on our audit. We
conducted our audit in accordance with International Standards on Auditing. Those standards
require that we comply with ethical requirements and plan and perform the audit to obtain reasonable assurance that the financial statements are free from material misstatement.
An audit involves performing procedures to obtain audit evidence about the amounts and disclosures in the financial statements. The procedures selected depend on the auditor‟s
judgment, including the assessment of the risks of material misstatement of the financial
statements, whether due to fraud or error. In making these risk assessments, the auditor
considers internal control relevant to the entity‟s preparation and fair presentation of the financial statements to design audit procedures that are appropriate in the circumstances but
not for the purpose of expressing an opinion on the effectiveness of the entity‟s internal
control. An audit also includes evaluating the appropriateness of accounting policies used and the reasonability of accounting estimates made by management as well as evaluating the
overall presentation of the financial statements.
We believe that the audit evidence we have obtained is sufficient and appropriate to provide a
basis for our audit opinion.
Opinion In our opinion, the financial statements give a true and fair view of the financial position of
Berens Electronics AG, as of December 31st, 2007, and of its financial performance and cash
flows for the year from January 1st, 2007 to December 31st, 2007, in accordance with International Financial Reporting Standards.
G&B (Public Accounting Firm)
[---------------------------------------]

36
[The following text was shown in the ‘opinion-only’ auditor’s report condition:]
Independent Auditor’s Report
To Berens Electronics AG
We have audited the accompanying consolidated financial statements for the year from January 1
st, 2007 to December 31
st, 2007.
[…]
Opinion
In our opinion, the financial statements give a true and fair view of the financial position of
Berens Electronics AG, as of December 31st, 2007 and of its financial performance and cash
flows for the year from January 1st, 2007 to December 31st, 2007 in accordance with
International Financial Reporting Standards.
G&B
(Public Accounting Firm)
[---------------------------------------]