the jones lang lasalle data centre barometer
TRANSCRIPT

Data Centre Barometer - Spring 2010
The Jones Lang LaSalle Data Centre Barometer
Spring 2010 – Issue 4
Majority of respondents hold an increasingly positive attitude towards industry prospects for the remainder of 2010 and into the first half of 2011
Sentiment towards overall changes in data centre footprints is leaning towards expansion amongst IT services, colocation and corporate occupier respondents
More than 70% of respondents said that they would consider a data centre over 200 km away from an existing facility if there were significant cost advantages.
The majority of respondents expressed their concerns on security issues regarding the future adoption of Cloud Computing
2 On Point • Data Centre Barometer • Spring 2010
The Jones Lang LaSalle Data Centre BarometerWelcome to the 4th Jones Lang LaSalle Data Centre Barometer (DCB), covering the first half of 2010. As with previous editions, this report comprises an independent market survey of the data centre industry's key stakeholders from across Europe, undertaken by data centre consultancy iXConsulting. In this edition iXConsulting have included for the first time, a "Barometer Dynamics" section, a synopsis of the survey responses over the first four editions of DCB.
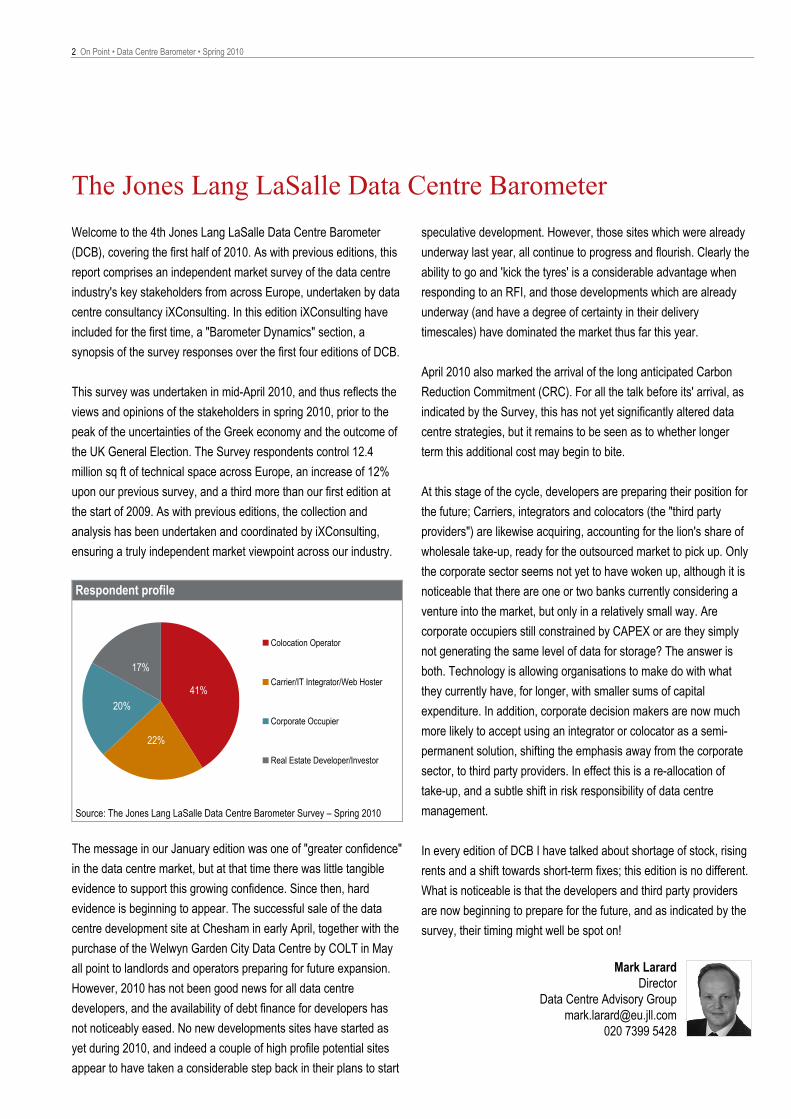
This survey was undertaken in mid-April 2010, and thus reflects the views and opinions of the stakeholders in spring 2010, prior to the peak of the uncertainties of the Greek economy and the outcome of the UK General Election. The Survey respondents control 12.4 million sq ft of technical space across Europe, an increase of 12% upon our previous survey, and a third more than our first edition at the start of 2009. As with previous editions, the collection and analysis has been undertaken and coordinated by iXConsulting, ensuring a truly independent market viewpoint across our industry.
Respondent profile
41%
22%
20%
17%
Colocation Operator
Carrier/IT Integrator/Web Hoster
Corporate Occupier
Real Estate Developer/Investor
Source: The Jones Lang LaSalle Data Centre Barometer Survey – Spring 2010
The message in our January edition was one of "greater confidence" in the data centre market, but at that time there was little tangible evidence to support this growing confidence. Since then, hard evidence is beginning to appear. The successful sale of the data centre development site at Chesham in early April, together with the purchase of the Welwyn Garden City Data Centre by COLT in May all point to landlords and operators preparing for future expansion. However, 2010 has not been good news for all data centre developers, and the availability of debt finance for developers has not noticeably eased. No new developments sites have started as yet during 2010, and indeed a couple of high profile potential sites appear to have taken a considerable step back in their plans to start
speculative development. However, those sites which were already underway last year, all continue to progress and flourish. Clearly the ability to go and 'kick the tyres' is a considerable advantage when responding to an RFI, and those developments which are already underway (and have a degree of certainty in their delivery timescales) have dominated the market thus far this year.
April 2010 also marked the arrival of the long anticipated Carbon Reduction Commitment (CRC). For all the talk before its' arrival, as indicated by the Survey, this has not yet significantly altered data centre strategies, but it remains to be seen as to whether longer term this additional cost may begin to bite.
At this stage of the cycle, developers are preparing their position for the future; Carriers, integrators and colocators (the "third party providers") are likewise acquiring, accounting for the lion's share of wholesale take-up, ready for the outsourced market to pick up. Only the corporate sector seems not yet to have woken up, although it is noticeable that there are one or two banks currently considering a venture into the market, but only in a relatively small way. Are corporate occupiers still constrained by CAPEX or are they simply not generating the same level of data for storage? The answer is both. Technology is allowing organisations to make do with what they currently have, for longer, with smaller sums of capital expenditure. In addition, corporate decision makers are now much more likely to accept using an integrator or colocator as a semi-permanent solution, shifting the emphasis away from the corporate sector, to third party providers. In effect this is a re-allocation of take-up, and a subtle shift in risk responsibility of data centre management.
In every edition of DCB I have talked about shortage of stock, rising rents and a shift towards short-term fixes; this edition is no different. What is noticeable is that the developers and third party providers are now beginning to prepare for the future, and as indicated by the survey, their timing might well be spot on!
Mark Larard Director
Data Centre Advisory Group [email protected]
020 7399 5428

On Point • Data Centre Barometer • Spring 2010 3
Index
Barometer Dynamics – A Year On and Optimism Remains 4
Respondent Analysis 7
Data Centre Opinions 12
Data Centre Location 15
Guest Feature – Critical Environment Management 17
Guest Feature – Letter form America 19
Properties 21
Contacts 22

4 On Point • Data Centre Barometer • Spring 2010
Barometer Dynamics –
A Year On and Optimism Remains
The fourth Jones Lang LaSalle Data Centre Barometer survey (DCB Spring 2010) has seen an increase in the size of the total technical floor space portfolio of our respondents for the third successive occasion. The responses we have considered encompass corporate occupiers, real estate developers/investors, colocation providers and IT service providers from across Europe. In total, respondents controlled data centre portfolios of circa 12.4 million sq ft of technical space.
Total technical floor space portfolio size of DCB Respondents
0
5
10
15
DCB1 March 2009
DCB2 September 2009
DCB3 January 2010
DCB4 May 2010
sq ft
(milli
ons)
Source: The Jones Lang LaSalle Data Centre Barometer Survey – Spring 2010
The Barometer More optimism: The majority of respondents continue to hold a positive attitude regarding the prospects for the industry in 2010 and into the first half of 2011. Despite a slight fall in confidence witnessed in the summer of 2009, the latest survey provides some assurance that the industry believes that it is well placed against a background of general economic recuperation across Europe.
Developers and investors of data centres have unsurprisingly come out as the most assured amongst our professional business sectors, continuing to show confidence that new product will succeed in finding occupiers. With both corporate occupiers and IT service providers and colocation operators corroborating that in their view the market is witnessing a healthy level of demand set against a tight-supply side, this confidence does not appear to be misplaced.
The Data Centre Barometer
DCB1 March 2009
DCB2 September 2009
DCB3 January 2010
DCB4 May 2010
Supply of appropriately fitted space heavily outweighs occupier demand
Supply of appropriately fitted space is increasing as occupier demand reduces
Demand for space matches current supply of appropriately fitted space
Identified demand is increasing as the supply of appropriately fitted space is diminishing
Demand for space heavily outweighs the current supply of appropriately fitted space
Carrier, Integrator and Colocation
Corporate Occupiers
Developers/Investors
DCB1 March 2009
DCB2 September 2009
DCB3 January 2010
DCB4 May 2010
Supply of appropriately fitted space heavily outweighs occupier demand
Supply of appropriately fitted space is increasing as occupier demand reduces
Demand for space matches current supply of appropriately fitted space
Identified demand is increasing as the supply of appropriately fitted space is diminishing
Demand for space heavily outweighs the current supply of appropriately fitted space
Carrier, Integrator and Colocation
Corporate Occupiers
Developers/Investors
Source: The Jones Lang LaSalle Data Centre Barometer Survey – Spring 2010
Notably, IT service providers, hosting companies and colocation operators now show the most positive sentiment towards the market that we have recorded for them over the last year, providing a good yardstick from a group of respondents that buy, build and sell data centre space and who arguably sit at the forefront of the industry experiencing the dynamics of demand from small enterprise to large international corporates.
Market sentiment reflected in changes to data centre footprint Levels of sentiment over the course of the last 12 months can be gauged through analysis of respondent’s forecast of data centre changes over the coming 12 months. Sentiment towards overall changes in data centre footprints is leaning towards expansion amongst our IT services, colocation and corporate occupier respondents over the course of our first four surveys, with a notable dip in confidence seen in the summer of 2009, where a “wait and see” strategy prevailed.
Overall, our latest results show that the proportion of respondents that expect to expand in the next 12 months is running at a “long term” average. Whilst it is worth noting that the proportion reporting an expected down-sizing of ‘in-house’ space is at its highest level, this is still by far the smallest proportion.

On Point • Data Centre Barometer • Spring 2010 5
What are your current expectations for changes to your ‘in house’ data centre area over the coming 12 months?
0%
20%
40%
60%
80%
100%
DCB1 March 2009
DCB2 September 2009
DCB3 January 2010
DCB4 May 2010
Expand Remain same Undecided Downsize
Source: The Jones Lang LaSalle Data Centre Barometer Survey – Spring 2010
The characteristics of changes in “third party” managed data centre space show a larger proportion of respondents expecting to keep portfolio sizes unchanged, although notably there is an increasing proportion of respondents who remain undecided in our latest survey results. Sentiment to expansion appears to have remained relatively stable over the course of the four surveys, as does the proportion of those expecting to downsize their outsourced data centre stock.
What are your current expectations for changes to your ‘third party’ technical data centre area over the coming 12 months?
0%
20%
40%
60%
80%
100%
DCB1 March 2009
DCB2 September 2009
DCB3 January 2010
DCB4 May 2010
Expand Remain same Undecided Downsize Source: The Jones Lang LaSalle Data Centre Barometer Survey – Spring 2010
Drivers of changes in data centre footprint It is not only important to find out about how occupiers are going to change their data centre portfolios, but the reasons behind those changes give important insight into the future behaviour of occupiers.
The reported dominant driver behind changes to data centre take-up of both ‘in house’ and ‘third party’ managed space is, perhaps unsurprisingly, corporate demand; namely business expansion or contraction that results in a need to either take more space, or that leaves space surplus to requirements. And it appears that IT budgets constraints have not had as an important negative effect on activity as was feared against a background of economic restraint, as this factor slipped down the scale of key drivers for changes to both internally and externally managed data centres over the course of the first four surveys.
Drivers of ‘in house’ changes DCB4
May 2010DCB3
January 2010
DCB2 September 2009DCB1
March 2009
0%
10%
20%
30%
40%
50%
60%
70%
DCB1 March 2009
DCB2 September 2009
DCB3 January 2010
DCB4 May 2010
Corporate expansion or contraction Changing power demands and/or costsChanges in available IT budgets Regulatory or legislative driversAvailability of the 'right' data centre product
Source: The Jones Lang LaSalle Data Centre Barometer Survey – Spring 2010
Perhaps more surprising is the relatively low importance reportedly given to both regulatory/legislative pressures and power demand/costs on changes to data centre footprints for both internally and externally managed space. Both these issues have experienced great media attention over the last few years, although are cited at the lower end of importance by our respondents.
Changes in ‘third party’ drivers
DCB4 May 2010
DCB3 January 2010DCB2
September 2009DCB1 March 2009
0%
10%
20%
30%
40%
50%
60%
DCB1 March 2009
DCB2 September 2009
DCB3 January 2010
DCB4 May 2010
Corporate expansion or contraction Changing power demands and/or costsChanges in available IT budgets Regulatory or legislative driversAvailability of the 'right' data centre product
Source: The Jones Lang LaSalle Data Centre Barometer Survey – Spring 2010
6 On Point • Data Centre Barometer • Spring 2010
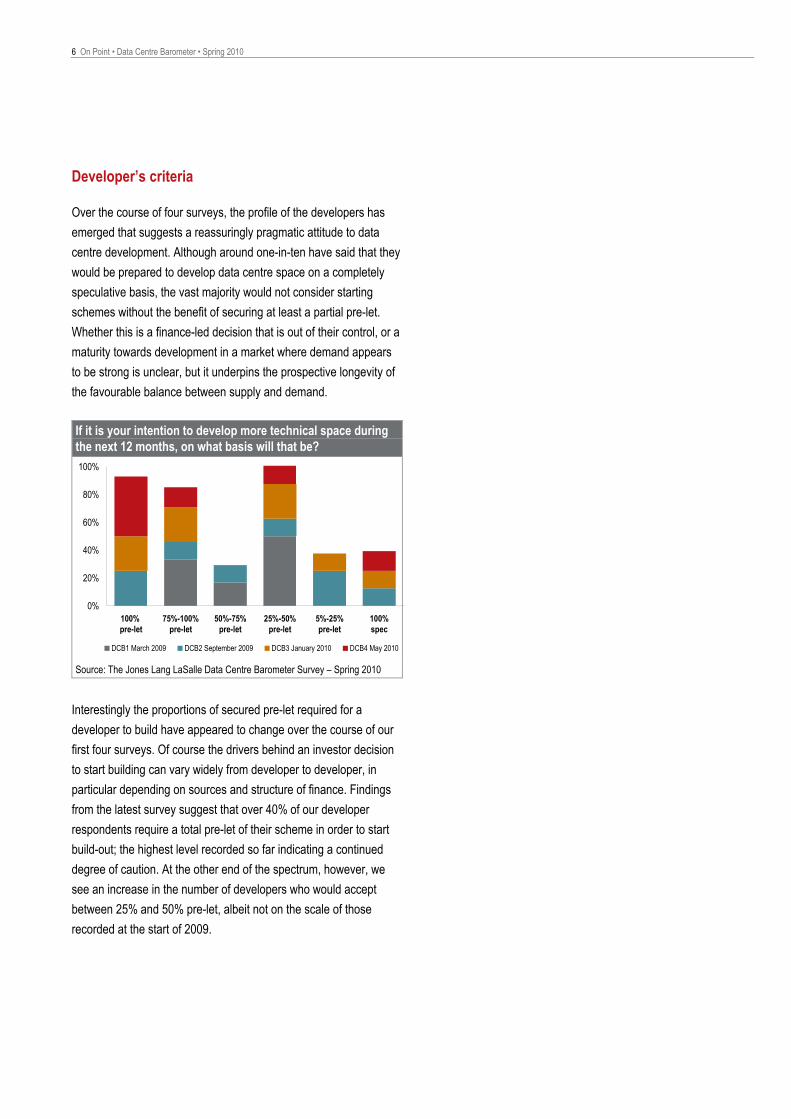
Developer’s criteria Over the course of four surveys, the profile of the developers has emerged that suggests a reassuringly pragmatic attitude to data centre development. Although around one-in-ten have said that they would be prepared to develop data centre space on a completely speculative basis, the vast majority would not consider starting schemes without the benefit of securing at least a partial pre-let. Whether this is a finance-led decision that is out of their control, or a maturity towards development in a market where demand appears to be strong is unclear, but it underpins the prospective longevity of the favourable balance between supply and demand.
If it is your intention to develop more technical space during the next 12 months, on what basis will that be?
0%
20%
40%
60%
80%
100%
100% pre-let
75%-100%pre-let
50%-75%pre-let
25%-50%pre-let
5%-25%pre-let
100%spec
DCB1 March 2009 DCB2 September 2009 DCB3 January 2010 DCB4 May 2010
Source: The Jones Lang LaSalle Data Centre Barometer Survey – Spring 2010
Interestingly the proportions of secured pre-let required for a developer to build have appeared to change over the course of our first four surveys. Of course the drivers behind an investor decision to start building can vary widely from developer to developer, in particular depending on sources and structure of finance. Findings from the latest survey suggest that over 40% of our developer respondents require a total pre-let of their scheme in order to start build-out; the highest level recorded so far indicating a continued degree of caution. At the other end of the spectrum, however, we see an increase in the number of developers who would accept between 25% and 50% pre-let, albeit not on the scale of those recorded at the start of 2009.

On Point • Data Centre Barometer • Spring 2010 7
Respondent Analysis
1. What best describes your view of the European market at present?
prospects for the industry over the second half of 2010 and into the first half of 2011. This provides a good indication that development and occupational activity levels should remain buoyant within the European data centre market.
Analysis of responses to our latest Data Centre Barometer suggest there is a growing feeling of optimism amongst European data centre market practitioners. Whilst the transition from a period of global recession to one of recovery and growth may still appear to be unsteady, indications are that the European data centre market has traded relatively well and that both supply and demand fundamentals remain generally robust.
As has been highlighted in previous surveys, there are slight variances in views across the differing groups of professionals surveyed, which include occupiers, IT Integrators/hosters, colocation operators, developers and investors in European data centres. For example, real estate developers and investor respondents are the most positive in respect of their views on supply and demand. Every member of this group expressed the view that demand exceeds supply, albeit the vast majority - nine out of ten - held the more moderate view that demand is increasing as supply is diminishing rather than the more robust opinion that demand heavily outweighs supply.
Almost three quarters of our survey respondents believe that demand for data centre space outpaces, to some degree, the supply of appropriately fitted space, underpinning a healthy balance between the two, and providing support that the market has shown a maturity against a background of very difficult economic conditions.
This level of growing sentiment echoes the trend identified in our last survey taken at the end of 2009; namely that the majority of respondents continue to hold a more positive attitude regarding the
Meanwhile, colocation operators, IT Integrators and hosters have been identified previously as having the least positive attitude, although continuing to believe overall that the market remains in their favour due to a lack of supply. This trend has continued in the
The Data Centre Barometer Demand for space matches
current supply of appropriately fitted space
Identified demand is increasing as the supply of of appropriately
fitted space is diminishing
Demand for space heavily outweighs thecurrent supply of appropriately fitted space
Supply of appropriately fitted space is increasing as occupier
demand reduces
Supply of appropriately fitted space heavily outweighs occupier
demand
Developers/Investors
Corporate Occupiers
Carrier, Integratorand Colocation
DCB 4 May 2010DCB 3 January 2010
Demand for space matches current supply of appropriately
fitted space
Identified demand is increasing as the supply of of appropriately
fitted space is diminishing
Demand for space heavily outweighs thecurrent supply of appropriately fitted space
Supply of appropriately fitted space is increasing as occupier
demand reduces
Supply of appropriately fitted space heavily outweighs occupier
demand
Developers/Investors
Corporate Occupiers
Carrier, Integratorand Colocation
DCB 4 May 2010DCB 3 January 2010
Source: The Jones Lang LaSalle Data Centre Barometer Survey – Spring 2010
8 On Point • Data Centre Barometer • Spring 2010
latest survey, with two in three reporting that they now perceived demand to ‘heavily’ outweigh supply of stock or that they saw demand increasing as appropriately finished supply diminishes.
In contrast, our corporate occupiers respondents were of the opinion that there is more stock available in the market and thus that the market has moved more in their favour. Just over half believe that landlords are in a strong position with demand currently exceeding supply to some extent, down on the two thirds of respondents who held that view last time around.
2. What proportion of your total European data centre capacity is based ‘in house’ or with a ‘third party’? One trend which has remained fairly consistent since the release of our DCB1 in March 2009 is that colocation operators, IT integrators and web hoster respondents show a preference to manage their own data centre facilities, perhaps viewing this management as a value-add to their service provision, or indeed preferring to ensure total control over the delivery of that service, setting them aside from their competitors. In our latest survey, two thirds indicate that at least 80% of their data centre portfolio was managed ‘in house’, although this does reflect a marginal decline on our last edition taken at the end of 2009.
Corporate occupiers indicate that they too prefer to manage the majority of their data centre footprint themselves, with three-out-of-four managing at least 70% or more, and one in three of these managing their entire data centre footprint with no ‘third party’ service providers engaged. As would be expected, the larger the corporate, the more inclined they are to control the management of their data centre stock. Those in the top quartile by net data centre stock revealed, that they control an average of 85% of their total data centre needs “in house”. Conversely, smaller respondents (as defined by the volume of data centre space) have a higher proportion of data centre space managed by a third party; up to a third on average. This may well reflect the advantage that larger enterprises have to gain from efficiencies of scale in the procurement procedure; or simply it is easier for them to gain access to wholesale data centre build opportunities as well as capital at more beneficial rates.
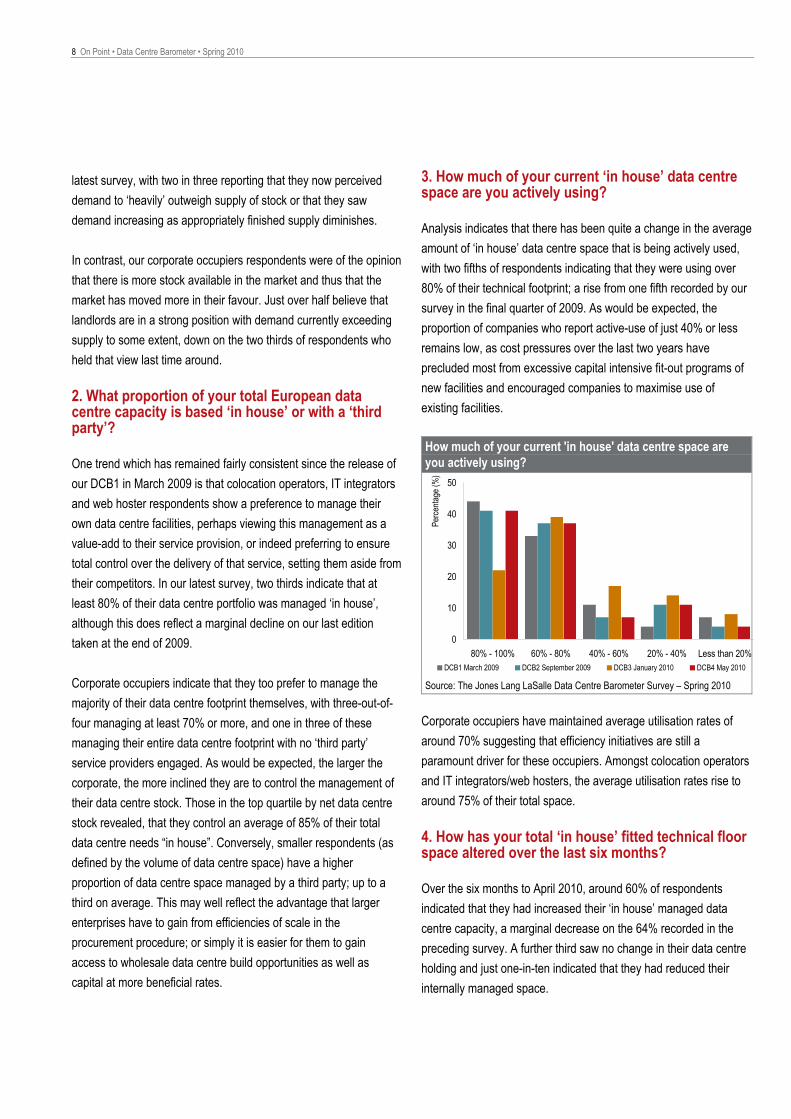
3. How much of your current ‘in house’ data centre space are you actively using? Analysis indicates that there has been quite a change in the average amount of ‘in house’ data centre space that is being actively used, with two fifths of respondents indicating that they were using over 80% of their technical footprint; a rise from one fifth recorded by our survey in the final quarter of 2009. As would be expected, the proportion of companies who report active-use of just 40% or less remains low, as cost pressures over the last two years have precluded most from excessive capital intensive fit-out programs of new facilities and encouraged companies to maximise use of existing facilities.
How much of your current 'in house' data centre space are you actively using?
0
10
20
30
40
50
80% - 100% 60% - 80% 40% - 60% 20% - 40% Less than 20%
Perce
ntage
(%)
DCB1 March 2009 DCB2 September 2009 DCB3 January 2010 DCB4 May 2010 Source: The Jones Lang LaSalle Data Centre Barometer Survey – Spring 2010
Corporate occupiers have maintained average utilisation rates of around 70% suggesting that efficiency initiatives are still a paramount driver for these occupiers. Amongst colocation operators and IT integrators/web hosters, the average utilisation rates rise to around 75% of their total space.
4. How has your total ‘in house’ fitted technical floor space altered over the last six months? Over the six months to April 2010, around 60% of respondents indicated that they had increased their ‘in house’ managed data centre capacity, a marginal decrease on the 64% recorded in the preceding survey. A further third saw no change in their data centre holding and just one-in-ten indicated that they had reduced their internally managed space.

On Point • Data Centre Barometer • Spring 2010 9
Of those who reported an increase in internally managed technical floor space over the past six months, around 60% reported an increase of at least a fifth, a slight decline on the 70% last monitored, whilst one-in-ten more than doubled their ‘in house’ capacity, again a decline on the one-in-five recorded previously.
How has your total 'in house' fitted technical floorspace altered over the last six months?
-5% 0% 5% 10% 15% 20% 25% 30% 35%
> 100%
50%-100%
20%-50%
10%-20%
< 10%
Unchanged
Reduced Expanded Source: The Jones Lang LaSalle Data Centre Barometer Survey – Spring 2010
5. What are your current expectations for changes to your ‘in house’ technical data centre area? The findings of the latest survey reinforce the positive trend identified at the end of 2009. As with that survey, latest evidence from our occupier and operator respondents suggests that three-in-five now expect to expand their internal technical floor space sometime during the coming 12 months, and that the proportion of the expansion split remains constant over the second half of 2010 and the first half of 2011.
Notably, however, the proportion of those expecting to downsize their ‘in house’ data centre floor space over the period has moved up marginally. This may well be as a result of a potential move to an external supplier, reflected in a re-allocation of stock or the employment of greater efficiencies, such as virtualisation, which has resulted in a reduction in the total amount of physical space required.
Another consistent trend is that corporate respondents remain the most circumspect group amongst our respondents with only half expecting to expand their ‘in house’ portfolio over the next 12 months.
What are your current expectations for changes to your ‘in house’ technical data centre area?
0%
20%
40%
60%
80%
Expand Remain same Undecided DownsizeSecond half 2010 First half 2011
Source: The Jones Lang LaSalle Data Centre Barometer Survey – Spring 2010 6. What factors are driving these changes to ‘in house’ technical data centre area? Corporate expansion or contraction was identified as being the single most important factor for driving changes in ‘in house’ floor space over the coming year, a viewpoint that appears consistent for the remainder of 2010 and the first half of 2011. The availability of the right data centre product is cited as the second most popular factor with nearly a fifth of respondents indicating that it was driving changes in internal technical floor space.
What factors are driving these changes to ‘in house’ technical data centre area?
0% 10% 20% 30% 40% 50% 60% 70%
Corporate expansion orcontraction
Changing power demandsand/or costs
Changes in available ITbudgets
Regulatory or legislativedrivers
Availability of the "right" datacentre product
Second half 2010 First half 2011 Source: The Jones Lang LaSalle Data Centre Barometer Survey – Spring 2010

10 On Point • Data Centre Barometer • Spring 2010
Interesting, only a small proportion of respondents identified changing power demands and/or costs as an important factor, continuing the trend noted in previous surveys. This result remains surprising, particularly set against a background of media coverage and legislative frenzy - such as the recent introduction of the Carbon Reduction Commitment which took effect from April 2010 - that has occurred over the last few years with regards to power consumption in general, and the data centre developer/owner’s responsibility. It may be the case that a perceived lack of power (or the predicted need for more power) has still not crystallised into a dominant driver because the industry has succeeded in providing data centre products that so far satisfy the power demands of the occupier. Alternatively, it may be that the market perceives that engineering, building management or IT operating solutions have successfully limited the impact of a rising demand for access to power pushing them into the background, leaving core drivers such as basic internal IT demand in the foreground.
7. What factors are influencing the decision making process for developers and investors with regard to expansion over the next 12 months? What factors are influencing the decision making process for developers and investors with regard to expansion over the next 12 months?
0% 10% 20% 30% 40% 50% 60% 70% 80% 90%
Existing identified demand
Expected demand
Lack of supply
Perceived returns
Diversification of commercialportfolio
Second Half 2010 First Half 2011 Source: The Jones Lang LaSalle Data Centre Barometer Survey – Spring 2010
Over the past 12 months 40% of our developer and investor respondents have expanded their data centre footprints with the remainder seeing little change. Existing and expected demand coupled with a lack of supply were dominating drivers behind developer and investors activity. Notably, four fifths of our respondents identified existing demand as the important factor for their expansion programmes during the rest of 2010 and at least a third identified expected demand will continue to drive expansion during the first 6 months of 2011.
Options such as “diversification of commercial portfolio” and “perceived returns” remain low on the list of a developers/investors’ main drivers, although it is not suggested that either option is not of importance. Returns are undoubtedly the main reason for any real estate investment decision, but as they are a direct function of the demand and supply balance then it is implied in these results. Portfolio diversification - the desire to spread risk across a number of real estate assets to ensure less volatility of returns - is usually important amongst any investor. However the complex nature of data centres as a niche real estate investment class appears to make it too specialist to be seen as a mainstream diversification asset. In addition, the sheer quantum of capital required to purchase an existing data centre investment may raise the bar too high for potential new investors.
8. Has your total ‘third party’ fitted technical floor space altered over the last 6 months? With regard to ‘third party’ managed space, around two thirds of all respondents indicated that they were actively using over 80% of their technical data centre space, an increase on the one-in-two who indicated the same degree of utilisation at the end of 2009. Amongst colocation providers and IT integrator/carriers, this proportion increases to around three quarters reflecting their ongoing need to use externally managed space as efficiently as possible, whilst retaining expansion opportunity for clients with immediate requirements.
How has you total ‘third party’ fitted technical floor space altered over the last 6 months?
12%
8%
72%
4% 4% Expanded 20-50%
Expanded 0-20%
Remained the same
Reduced 0-20%
Reduced 20-60%
Source: The Jones Lang LaSalle Data Centre Barometer Survey – Spring 2010
According to the survey, around seven out of ten respondents have seen no alteration in the volume of outsourced technical floor space over the past 6 months, whilst around a fifth have expanded. With less than one-in-ten reporting a reduction in their holding, the results
On Point • Data Centre Barometer • Spring 2010 11
suggest a rather inactive period amongst our respondents with regard to ‘third party’ managed data centre stock. Significantly, around 60% of those who reported an expansion did so by a fifth or more.
There are differences by sector; two-out-of-three corporate respondents were unchanged in their occupation of ‘third party’ facilities; perhaps not surprising in the face of a lingering recession and perhaps the opportunity to sweat internal data centre assets more effectively. In contrast, companies whose business it is to re-sell data centre space or services are under more pressure to continue their expansion momentum in order to be able to satisfy medium and long term demand. Whilst half of colocation and IT integrator/hosters respondents reported no change in ‘third party’ managed stock, over a third indicated that they had expanded their portfolio.
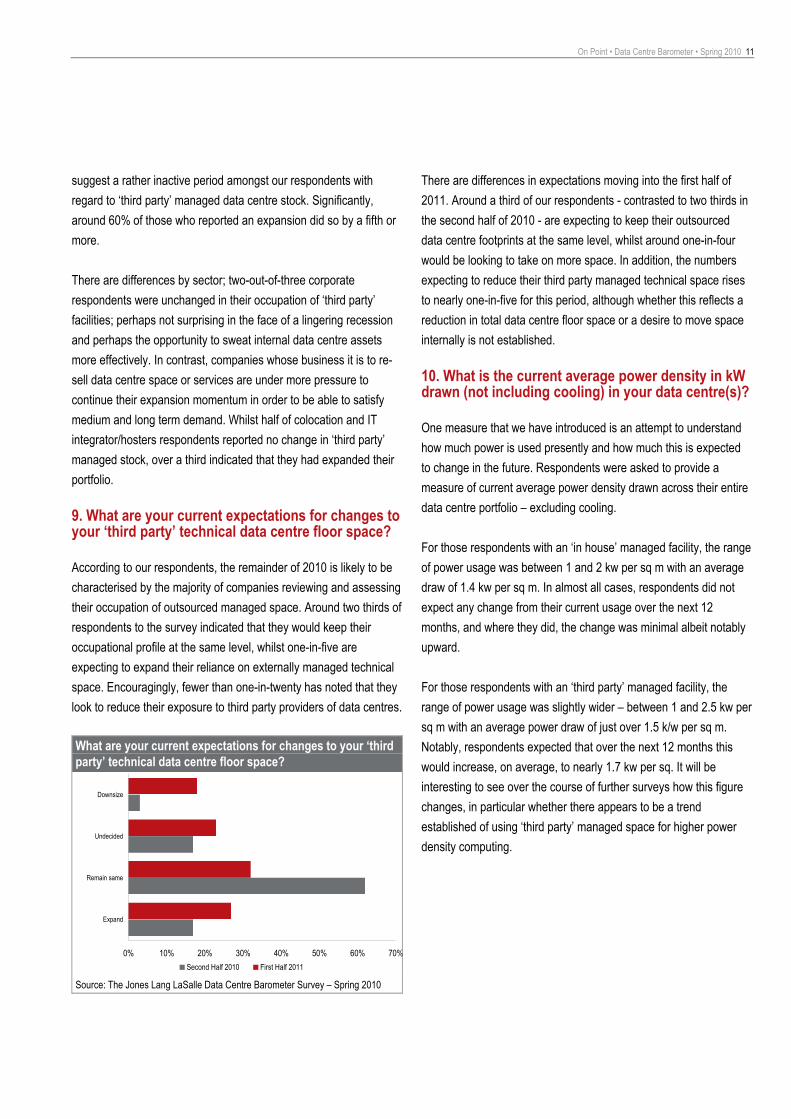
9. What are your current expectations for changes to your ‘third party’ technical data centre floor space? According to our respondents, the remainder of 2010 is likely to be characterised by the majority of companies reviewing and assessing their occupation of outsourced managed space. Around two thirds of respondents to the survey indicated that they would keep their occupational profile at the same level, whilst one-in-five are expecting to expand their reliance on externally managed technical space. Encouragingly, fewer than one-in-twenty has noted that they look to reduce their exposure to third party providers of data centres.
What are your current expectations for changes to your ‘third party’ technical data centre floor space?
0% 10% 20% 30% 40% 50% 60% 70%
Expand
Remain same
Undecided
Downsize
Second Half 2010 First Half 2011 Source: The Jones Lang LaSalle Data Centre Barometer Survey – Spring 2010
There are differences in expectations moving into the first half of 2011. Around a third of our respondents - contrasted to two thirds in the second half of 2010 - are expecting to keep their outsourced data centre footprints at the same level, whilst around one-in-four would be looking to take on more space. In addition, the numbers expecting to reduce their third party managed technical space rises to nearly one-in-five for this period, although whether this reflects a reduction in total data centre floor space or a desire to move space internally is not established.
10. What is the current average power density in kW drawn (not including cooling) in your data centre(s)? One measure that we have introduced is an attempt to understand how much power is used presently and how much this is expected to change in the future. Respondents were asked to provide a measure of current average power density drawn across their entire data centre portfolio – excluding cooling.
For those respondents with an ‘in house’ managed facility, the range of power usage was between 1 and 2 kw per sq m with an average draw of 1.4 kw per sq m. In almost all cases, respondents did not expect any change from their current usage over the next 12 months, and where they did, the change was minimal albeit notably upward.
For those respondents with an ‘third party’ managed facility, the range of power usage was slightly wider – between 1 and 2.5 kw per sq m with an average power draw of just over 1.5 k/w per sq m. Notably, respondents expected that over the next 12 months this would increase, on average, to nearly 1.7 kw per sq. It will be interesting to see over the course of further surveys how this figure changes, in particular whether there appears to be a trend established of using ‘third party’ managed space for higher power density computing.

12 On Point • Data Centre Barometer • Spring 2010
Data Centre Opinions
11. “We find it difficult to quantify the current energy efficiency of our data centre holdings” One-in-four respondents admitted some degree in difficulty in measuring the energy efficiency of their data centres, a drop on the one-in-three measured at the end of 2009. The fact that the proportion of those agreeing with the statement has fallen indicates that data centre owners and occupiers appear to be becoming more comfortable with respect of the information and education on the metrics currently available to them.
The promotion of measurements such as Power Usage Effectiveness (PUE) and Data Centre Infrastructure Efficiency (DCiE) has undoubtedly helped focus developers and operators attention on driving power efficiencies. The adoption of the EU Code of Conduct on Data Centre Efficiency last year (mandatory in many European countries and voluntary in the UK) means that participants have to report energy consumption every year and implement energy efficiency best practice.
We find it difficult to quantify current energy efficiency of our data centre holdings
0% 5% 10% 15% 20% 25% 30% 35%
Strongly Agree
Agree
Neither Agree nor Disagree
Disagree
Strongly Disagree
DCB 3 January 2010 DCB 4 May 2010 Source: The Jones Lang LaSalle Data Centre Barometer Survey – Spring 2010
12. “Cloud computing will reduce the need for more data centre space over the next 12 months” The adoption of Cloud Computing is still not perceived by the majority of respondents as likely to have a major impact on reducing the need for more data centre space over the coming year.
Whilst at least a third of respondents remain undecided, only 10% of those surveyed thought that demand for more data centre space would reduce due to this innovation in delivering data centre services
Cloud Computing will reduce occupiers need for more data centre space over the next 12 months
0% 5% 10% 15% 20% 25% 30% 35% 40% 45% 50%
Strongly Agree
Agree
Neither Agree nor Disagree
Disagree
Strongly Disagree
DCB 3 January 2010 DCB 4 May 2010 Source: The Jones Lang LaSalle Data Centre Barometer Survey – Spring 2010
Those respondents who expressed a positive view on this issue were largely drawn from the service providers – IT Integrators, carriers and colocation operators. In contrast almost all corporate occupiers either expressed a neutral viewpoint or disagreed. Whilst the practitioners would seem to believe that the Cloud presents an opportunity for them, corporate occupiers appear more circumspect to its potential to consolidate data centre real estate.
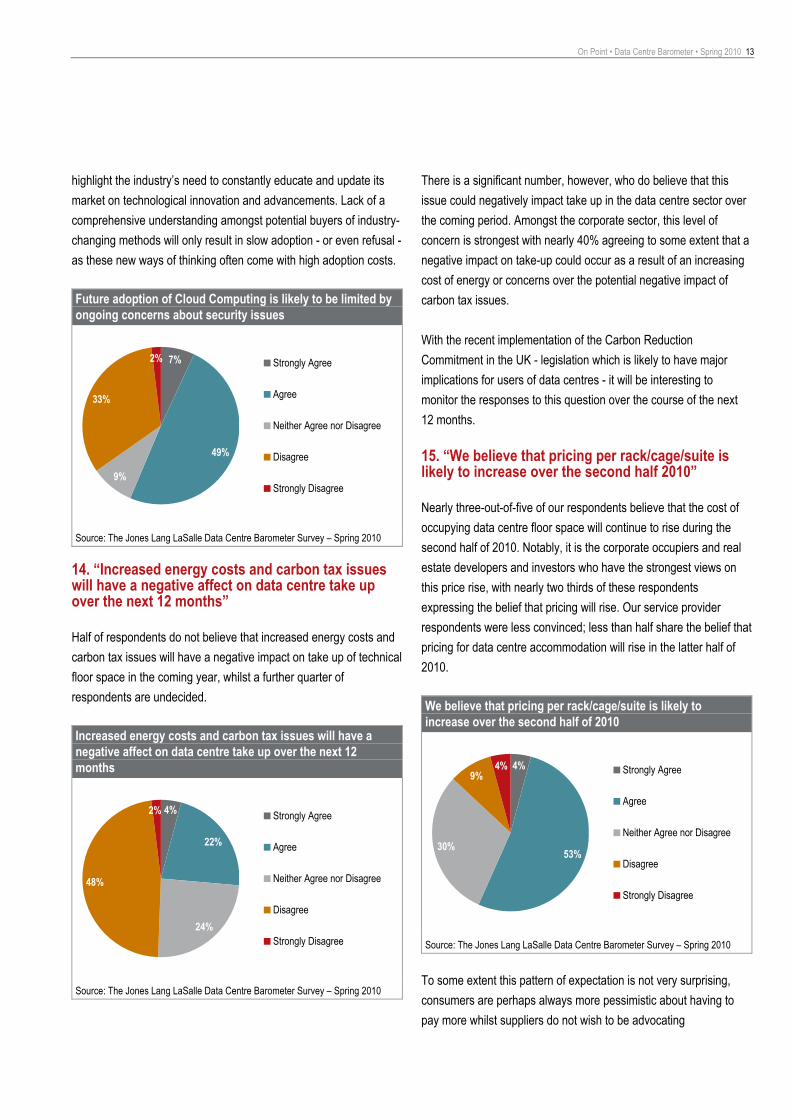
13. “Future adoption of Cloud Computing is likely to be limited by ongoing concerns about security issues” Security would seem to be a concern with regard to Cloud Computing amongst some of our survey respondents with over half agreeing, to some extent, that future adoption of this technology is likely to be limited by ongoing fears about it. When broken down on a sectoral basis, nearly three quarters of respondents from the corporate sector expressed their agreement with the statement.
Whilst a difference of opinion between “vendors” and “purchasers” of Cloud Computing products is not entirely surprising, the results
On Point • Data Centre Barometer • Spring 2010 13
highlight the industry’s need to constantly educate and update its market on technological innovation and advancements. Lack of a comprehensive understanding amongst potential buyers of industry-changing methods will only result in slow adoption - or even refusal - as these new ways of thinking often come with high adoption costs.
Future adoption of Cloud Computing is likely to be limited by ongoing concerns about security issues
7%
49%
9%
33%
2% Strongly Agree
Agree
Neither Agree nor Disagree
Disagree
Strongly Disagree
Source: The Jones Lang LaSalle Data Centre Barometer Survey – Spring 2010
14. “Increased energy costs and carbon tax issues will have a negative affect on data centre take up over the next 12 months” Half of respondents do not believe that increased energy costs and carbon tax issues will have a negative impact on take up of technical floor space in the coming year, whilst a further quarter of respondents are undecided.
Increased energy costs and carbon tax issues will have a negative affect on data centre take up over the next 12 months
22%
24%
4%
48%
2% Strongly Agree
Agree
Neither Agree nor Disagree
Disagree
Strongly Disagree
Source: The Jones Lang LaSalle Data Centre Barometer Survey – Spring 2010
There is a significant number, however, who do believe that this issue could negatively impact take up in the data centre sector over the coming period. Amongst the corporate sector, this level of concern is strongest with nearly 40% agreeing to some extent that a negative impact on take-up could occur as a result of an increasing cost of energy or concerns over the potential negative impact of carbon tax issues.
With the recent implementation of the Carbon Reduction Commitment in the UK - legislation which is likely to have major implications for users of data centres - it will be interesting to monitor the responses to this question over the course of the next 12 months.
15. “We believe that pricing per rack/cage/suite is likely to increase over the second half 2010” Nearly three-out-of-five of our respondents believe that the cost of occupying data centre floor space will continue to rise during the second half of 2010. Notably, it is the corporate occupiers and real estate developers and investors who have the strongest views on this price rise, with nearly two thirds of these respondents expressing the belief that pricing will rise. Our service provider respondents were less convinced; less than half share the belief that pricing for data centre accommodation will rise in the latter half of 2010.
We believe that pricing per rack/cage/suite is likely to increase over the second half of 2010
4%
53%30%
9%4% Strongly Agree
Agree
Neither Agree nor Disagree
Disagree
Strongly Disagree
Source: The Jones Lang LaSalle Data Centre Barometer Survey – Spring 2010
To some extent this pattern of expectation is not very surprising, consumers are perhaps always more pessimistic about having to pay more whilst suppliers do not wish to be advocating

14 On Point • Data Centre Barometer • Spring 2010
rising prices. Beyond this, the fact that corporate occupiers are more circumspect than other respondent groups in respect of their proposed expansion plans, may well be influenced by the fact that they are more likely to believe prices for technical floor space are on the rise in the short to medium term.
16. “We believe that the availability of finance for corporates will increase over the next 12 months allowing them to carry out data centre expansion plans” There has been little change in sentiment since the last survey with regard to our respondent’s thoughts on the availability of finance to facilitate expansion plans increasing over the next 12 months. As was the case at the end of 2009, nearly three-in-five survey respondents agree that there is likely to be an increase in funds for data centre expansion over the coming year.
IT integrators, carriers and colocation providers are the most confident that difficult finance raising conditions may be subsiding, with over two thirds of them believing that finance availability will increase over the next 12 months. Corporates and real estate developers, however, remain a little more cautious, with only 50% believing that access to money would become easier over the year.
We believe that the availability of finance for corporate will increase over the next 12 months allowing them to carry out data centre expansion plans
0% 10% 20% 30% 40% 50% 60% 70%
Strongly Agree
Agree
Neither Agree nor Disagree
Disagree
Strongly Disagree
DCB 3 January 2010 DCB 4 May 2010 Source: The Jones Lang LaSalle Data Centre Barometer Survey – Spring 2010
17. “We believe that in the next 12 months we will actively source at least 10% of our data centre power explicitly from renewable power resources” A new question for this edition of DCB designed to qualify respondent’s attitudes to committing to renewable energy sources. Respondents were asked whether they would explicitly commit to 10% of their total power draw being derived from renewable sources.
There is no clear consensus amongst the majority of respondents with regard to the question of imminent sourcing of renewable power resources for their data centre requirements. Over a third remained undecided, and the rest were fairly evenly split between committing or not committing to a 10% minimum renewable power source.
The expense of committing to a renewable power source – no matter how small a proportion – may well still be a restriction for those wishing to pursue this route more enthusiastically. However, with a recent Greenpeace estimate suggesting that that data centres will use 1,963 billion kilowatt hours of electricity by 2020, it is likely that renewable power resources will remain high on the agenda and we would expect that, over time, the proportion of respondents agreeing with some sort of minimum commitment should rise.
We believe that in the next 12 months we would actively source at least 10% of our data centre power explicitly from renewable power resources
0% 5% 10% 15% 20% 25% 30% 35% 40%
Strongly Agree
Agree
Neither Agree nor Disagree
Disagree
Strongly Disagree
DCB 4 May 2010 Source: The Jones Lang LaSalle Data Centre Barometer Survey – Spring 2010
On Point • Data Centre Barometer • Spring 2010 15
Data Centre Location
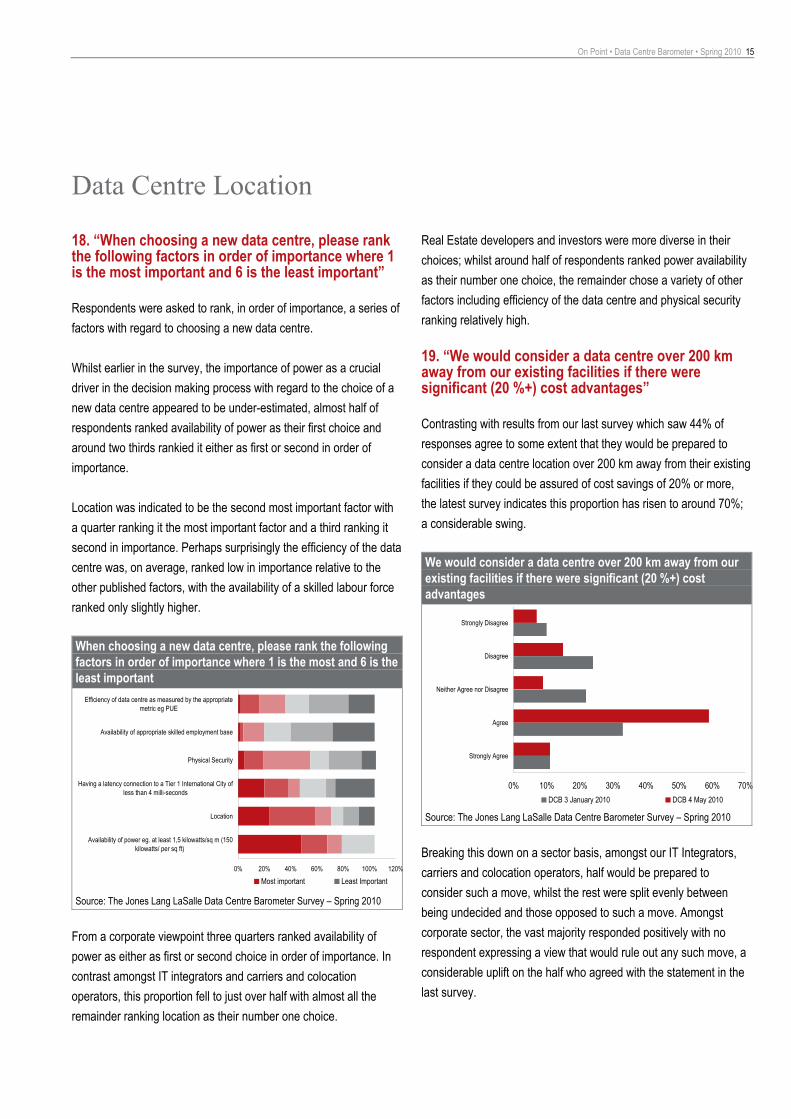
18. “When choosing a new data centre, please rank the following factors in order of importance where 1 is the most important and 6 is the least important” Respondents were asked to rank, in order of importance, a series of factors with regard to choosing a new data centre.
Whilst earlier in the survey, the importance of power as a crucial driver in the decision making process with regard to the choice of a new data centre appeared to be under-estimated, almost half of respondents ranked availability of power as their first choice and around two thirds rankied it either as first or second in order of importance.
Location was indicated to be the second most important factor with a quarter ranking it the most important factor and a third ranking it second in importance. Perhaps surprisingly the efficiency of the data centre was, on average, ranked low in importance relative to the other published factors, with the availability of a skilled labour force ranked only slightly higher.
When choosing a new data centre, please rank the following factors in order of importance where 1 is the most and 6 is the least important
0% 20% 40% 60% 80% 100% 120%
Availability of power eg. at least 1,5 kilowatts/sq m (150kilowatts/ per sq ft)
Location
Having a latency connection to a Tier 1 International City ofless than 4 milli-seconds
Physical Security
Availability of appropriate skilled employment base
Efficiency of data centre as measured by the appropriatemetric eg PUE
Most important Least Important Source: The Jones Lang LaSalle Data Centre Barometer Survey – Spring 2010
From a corporate viewpoint three quarters ranked availability of power as either as first or second choice in order of importance. In contrast amongst IT integrators and carriers and colocation operators, this proportion fell to just over half with almost all the remainder ranking location as their number one choice.
Real Estate developers and investors were more diverse in their choices; whilst around half of respondents ranked power availability as their number one choice, the remainder chose a variety of other factors including efficiency of the data centre and physical security ranking relatively high.
19. “We would consider a data centre over 200 km away from our existing facilities if there were significant (20 %+) cost advantages” Contrasting with results from our last survey which saw 44% of responses agree to some extent that they would be prepared to consider a data centre location over 200 km away from their existing facilities if they could be assured of cost savings of 20% or more, the latest survey indicates this proportion has risen to around 70%; a considerable swing.
We would consider a data centre over 200 km away from our existing facilities if there were significant (20 %+) cost advantages
0% 10% 20% 30% 40% 50% 60% 70%
Strongly Agree
Agree
Neither Agree nor Disagree
Disagree
Strongly Disagree
DCB 3 January 2010 DCB 4 May 2010 Source: The Jones Lang LaSalle Data Centre Barometer Survey – Spring 2010
Breaking this down on a sector basis, amongst our IT Integrators, carriers and colocation operators, half would be prepared to consider such a move, whilst the rest were split evenly between being undecided and those opposed to such a move. Amongst corporate sector, the vast majority responded positively with no respondent expressing a view that would rule out any such move, a considerable uplift on the half who agreed with the statement in the last survey.
16 On Point • Data Centre Barometer • Spring 2010
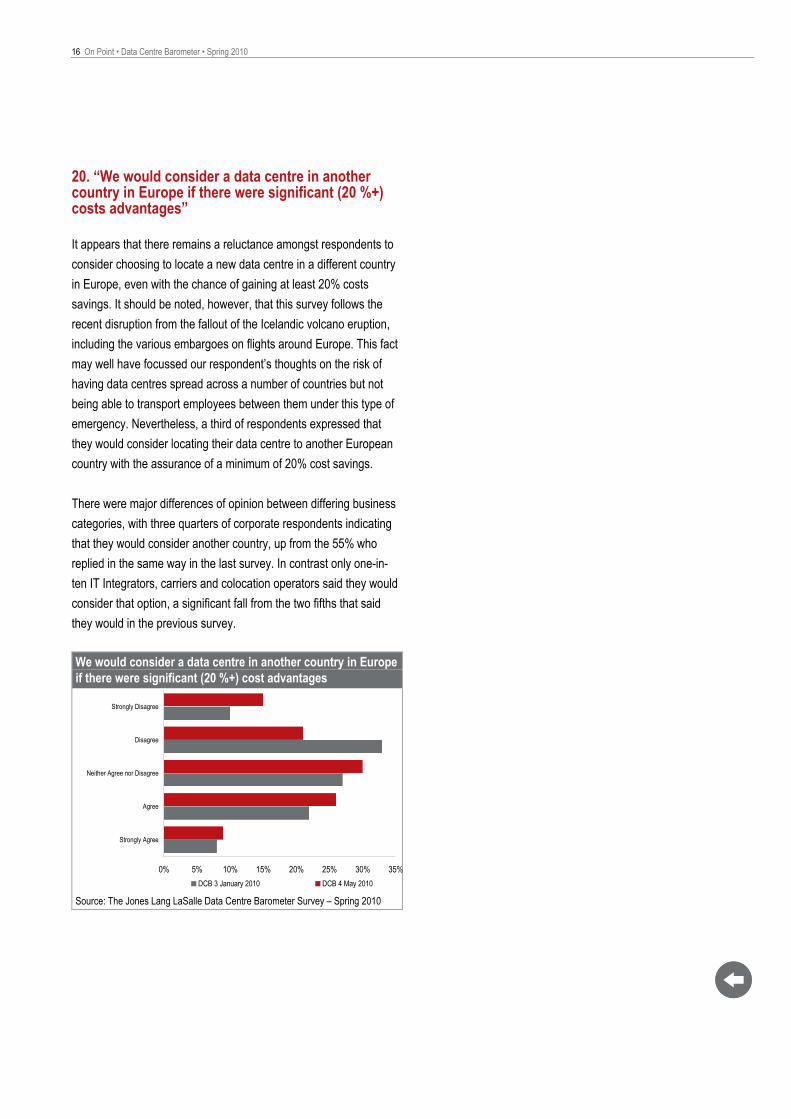
20. “We would consider a data centre in another country in Europe if there were significant (20 %+) costs advantages” It appears that there remains a reluctance amongst respondents to consider choosing to locate a new data centre in a different country in Europe, even with the chance of gaining at least 20% costs savings. It should be noted, however, that this survey follows the recent disruption from the fallout of the Icelandic volcano eruption, including the various embargoes on flights around Europe. This fact may well have focussed our respondent’s thoughts on the risk of having data centres spread across a number of countries but not being able to transport employees between them under this type of emergency. Nevertheless, a third of respondents expressed that they would consider locating their data centre to another European country with the assurance of a minimum of 20% cost savings.
There were major differences of opinion between differing business categories, with three quarters of corporate respondents indicating that they would consider another country, up from the 55% who replied in the same way in the last survey. In contrast only one-in-ten IT Integrators, carriers and colocation operators said they would consider that option, a significant fall from the two fifths that said they would in the previous survey.
We would consider a data centre in another country in Europe if there were significant (20 %+) cost advantages
0% 5% 10% 15% 20% 25% 30% 35%
Strongly Agree
Agree
Neither Agree nor Disagree
Disagree
Strongly Disagree
DCB 3 January 2010 DCB 4 May 2010 Source: The Jones Lang LaSalle Data Centre Barometer Survey – Spring 2010

On Point • Data Centre Barometer • Spring 2010 17
Guest Feature
Critical Environment Management (CEM) – Performance Management
Jones Lang LaSalle understand the importance of critical environments and the need to achieve high availability in terms of the systems supporting data centres. It has been our experience that collectively a lot of focus is placed on determining infrastructure requirements, due diligence reporting, gap assessments and the list goes on. All these aspects are correct and will continue to be a focus. However, ‘how your engineering operations group or your facility partner’ operates is also a key aspect to achieving 100% uptime and managing operational risk.
The ‘performance’ requirements are often understated and difficult to quantify in terms of the business expectations.
Although, the ‘term’ engineering may suggest a logical and methodical approach to how a task is performed, the reality is that the complexity of ‘what and how’ Engineering Operational Teams operate is not easily measurable. It is correct that there are sites where the operation stands above the rest, but establishing this and then benchmarking that operation with another facility in a factual way with meaningful data is difficult. Even then, driving performance needs a vehicle to get to a place of greater compliance and ever higher standards.
The Jones Lang LaSalle Critical Environment Management (CEM) team has developed an approach to Operational Performance Management which drives consistency into organisations, allows comparisons of the portfolio operation, and as the data becomes more mature will enable benchmarking for the sectors.
We have created tools for Performance Management, designed for assessing, monitoring, measuring operational and contractual compliance expectations and adherence to clients (and Jones Lang LaSalle’s) policies and governances.
The strategy is quite simply to- • Provide our clients and account directors with greater visibility of
the facility operations • Provide a CEM compliance road map • Drive and measure performance of site operations which can be
applied monthly/quarterly • Identify operational risk and exposures • Drive continuous improvement and decision making
It’s our belief that the ‘intelligent client’ responsible for CEM operations requires a model that drives operational performance month on month and not just an audit program that identifies issues once a year.
18 On Point • Data Centre Barometer • Spring 2010
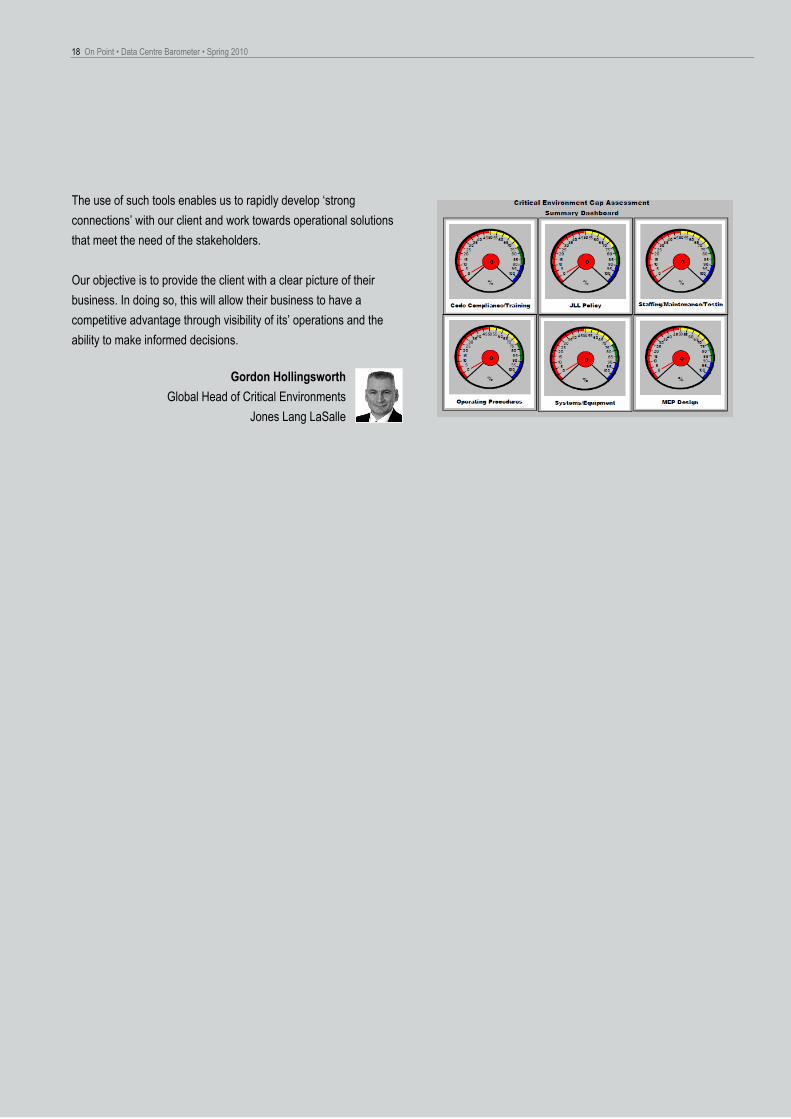
The use of such tools enables us to rapidly develop ‘strong connections’ with our client and work towards operational solutions that meet the need of the stakeholders.
Our objective is to provide the client with a clear picture of their business. In doing so, this will allow their business to have a competitive advantage through visibility of its’ operations and the ability to make informed decisions.
Gordon Hollingsworth Global Head of Critical Environments
Jones Lang LaSalle

On Point • Data Centre Barometer • Spring 2010 19
Letter from America
US Data Centre Site Selection – what are data centre prospects looking for?
Introduction When the time comes for a corporation to decide on a data centre strategy, there are a variety inputs that must be addressed to properly validate this decision. A wrong projection, estimate, or even a simple oversight can devastate a company, forcing financial considerations to deal with the unintended consequences of bad decisions. The process for finding the best place to locate a data centre has been refined over time to accommodate an industry that is evolutionary, based on developing technologies.
This article provides a simple, recent example of our data centre consultation model slightly altered to appeal to a wider audience. The data centre site selection criteria addressed in this study is based on recent trends observed from client interaction, here in the United States. Our model both provides a snapshot of the current state of the data centre market in the US and helps decision makers execute an intelligent selection when the time comes to render a choice on data centre location. The model can be broken down into 4 primary steps: (1) Creating preferential categories and sub-categories, [a weighting matrix] (2) Market selection, (3) Data gathering and data input, and (4) Summary and conclusion.
Data Centre Site Selection Weighted Ranking Model The initial step in achieving the optimal data centre location is to pick a set of categories and find out how important each category is to a user prospecting the national market (or in this case, 10 cities). Then, from these primary categories, a range of sub-categories needs to be established and weighted relative to importance. This step can be extremely bespoke and time consuming (we’ve seen up to 140 categories and sub-categories); but, for the purposes of this study, let’s keep this analysis high level and take a look at five very typical categories and their respective sub-categories that are almost always on the radar:
Category: Environmental (35%)
Sub-category Name Subcategory Weight Seismic / Earthquake 40% Hurricane 20% Tornados 20% Snowfall 10% Wind 10% Category: Power (30%)
Sub-category Name Subcategory Weight Power Rates 90% Market Regulation 10% Category: Fiber (20%)
Sub-category Name Subcategory Weight Peering Point (Distance) 50% Colocation Providers in Market 50% Category: Real Estate (10%)
Sub-category Name Subcategory Weight Construction Costs 100% Category: Labor (5%)
Sub-category Name Subcategory Weight IT Workforce 100%
Markets The US markets were observed at a city level and were selected based on heightened levels of activity in the past year from 1 of the 2 types of data centre prospects: (1) Colocation/wholesale and (2) Enterprise users. Typically, the former will pursue major metros where there is a strong, client-driven demand (ie. where the users exist or want to be – places like New York City, Chicago or Dallas). More frequently, primarily due to the oversaturation of major metros, some colo/wholesale users are investigating emerging markets (or second and third tier US cities such as San Antonio, Richmond, Phoenix, or Nashville) that have moderate client demand and fairly strong fibre connectivity. The latter prospect, or the enterprise user, will tend toward more rural areas that are able to provide a user with location-based economics, such as cheap power and favourable incentives (places like Kansas City, Charlotte or Omaha).
For the purposes of simplifying the study, only 10 markets were selected and represent a consortium of cities that both a colocation and enterprise user might investigate in today’s data centre climate.

20 On Point • Data Centre Barometer • Spring 2010
Results and Summary These 10 markets, in no particular order, are: Denver, Chicago, Charlotte, Omaha, New York City, Kansas City, Phoenix, Dallas, Richmond and Atlanta. It should be noted that all of these cities are favourable data centre markets, consistently under review by our clients. So the order or best ranked cities resulting from this study are essentially a designation based on a predetermined set of criteria. Rankings and order will change based on user preference, and a city that ranks low on this test does not mean that the city is a poor place to locate a data centre; instead, a city or major metro’s inclusion on this test is rationale that it is in fact a favourable place to locate a data centre based on what we’ve seen here in the United States.
In the 10 market example, the data entry yielded the results cited below. Remember, the lower the rating, the more favourable a given market will be for locating a data centre based on the attributes and weighted importance outlined in this study
Rank Market Overall Rank
Environ-mental Power Fibre Real
Estate Labour
1 Atlanta, GA 3.63 ● ● ● ● ● 2 Dallas, TX 3.65 ● ● ● ● ● 3 Phoenix, AZ 3.91 ● ● ● ● ● 4 Chicago, IL 3.99 ● ● ● ● ● 5 Richmond, VA 4.29 ● ● ● ● ● 6 Charlotte, NC 4.5 ● ● ● ● ● 7 Denver, CO 4.51 ● ● ● ● ● 8 Kansas City, MO 4.77 ● ● ● ● ● 9 Omaha, NE 5.12 ● ● ● ● ● 10 New York, NY 5.24 ● ● ● ● ●
Data Collection After creating the base model and establishing locations to analyse, the next step in the consulting study process would be the information gathering stage. Here, sub-categories are quantified with values (the supporting documentation can be qualitative or quantitative) and processed to serve as a function of its parent category. The sub-categories act as a catalyst to formulate a categorical value, which ultimately rates the favourability of a city. As an example, let’s examine the power category. Power is determined by the power rates specific to data centre users and by the market regulation for power. In the US, it’s a state level analysis as the state will govern whether its power situation should be regulated or deregulated.
● Favourable results with respect to the sample markets ● Moderately favourable results with respect to the sample markets ● Less than favourable results with respect to the sample markets
For the quantitative driven results typically processed as a result of the study’s calculations, I have substituted a colour based scale showing which categories (environmental, power, fibre, real estate, and labour) resulted in favourable (green) or less than favourable (red) values. To reiterate when assessing the best and worst of the list, it should be known that all of these cities for one reason or another are favourable data centre markets. Categories and sub-categories and their respective weights just happened to reveal that, based on preferences, Atlanta happened to be the best place to locate a data centre. In conclusion the definition and confirmation of the driving categories and their respective weightings are paramount in reaching the ultimate decision in data centre site selection.
In order to get power rates for data centre users, we’d typically engage in discussion with the power company and disclose specific requirements based on a ramp-up schedule of power. Most of the time, we may offer up additional information such as the power and load factors which really helps achieve an accurate pricing estimate from the power company. The value that is considered for the model is the estimated power rate, given in US$ / kWh. The value is collected across all subject markets and then assigned a rank of favourability to each city. The rank is a Likert Scale model, based on a 1 to 10 spread, where 1 is the most favourable and 10 is the least favourable. For the market regulation subcategory, a binary value (1, 0) might be established based for a user who may or may not find favourability in regulated versus deregulated markets (we have seen this both ways).
Brian Oley Vice President
Mission Critical Solutions, Jones Lang LaSalle Dallas, Texas
On Point • Data Centre Barometer • Spring 2010 21
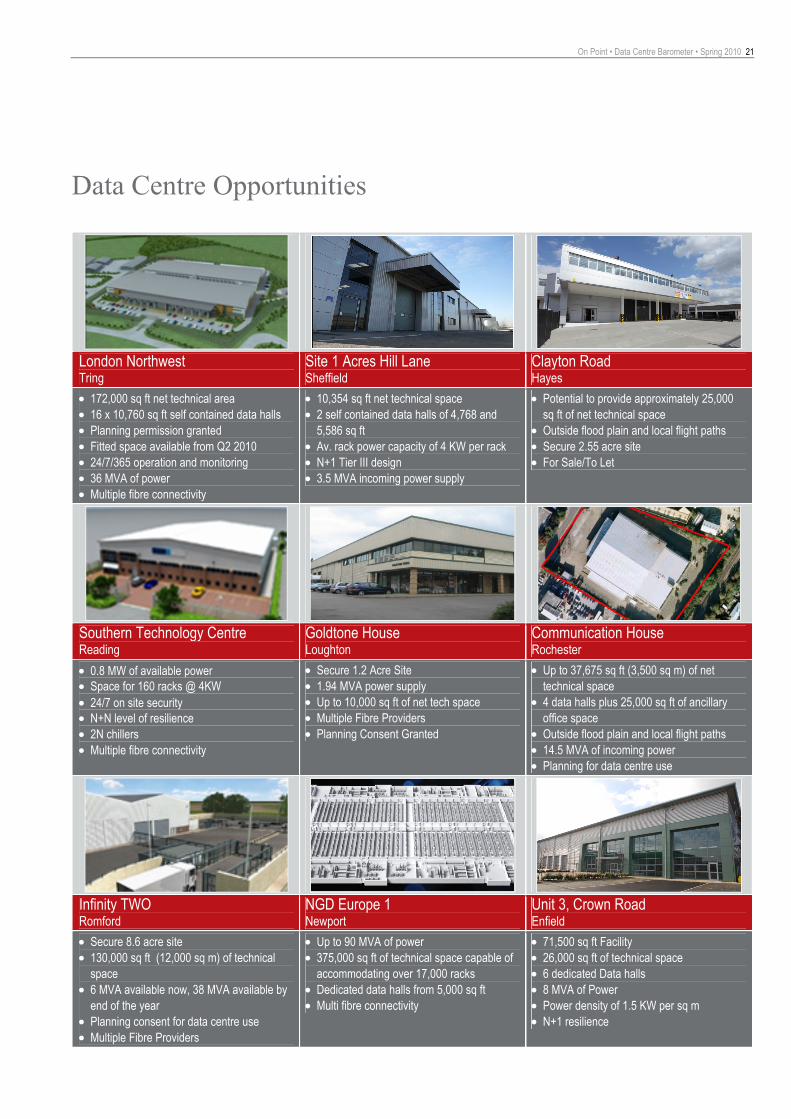
Data Centre Opportunities
London Northwest Tring
Site 1 Acres Hill Lane Sheffield
Clayton Road Hayes
• 172,000 sq ft net technical area • 16 x 10,760 sq ft self contained data halls • Planning permission granted • Fitted space available from Q2 2010 • 24/7/365 operation and monitoring • 36 MVA of power • Multiple fibre connectivity
• 10,354 sq ft net technical space • 2 self contained data halls of 4,768 and
5,586 sq ft • Av. rack power capacity of 4 KW per rack • N+1 Tier III design • 3.5 MVA incoming power supply
• Potential to provide approximately 25,000 sq ft of net technical space
• Outside flood plain and local flight paths • Secure 2.55 acre site • For Sale/To Let
Southern Technology Centre Reading
Goldtone House Loughton
Communication House Rochester
• 0.8 MW of available power • Space for 160 racks @ 4KW • 24/7 on site security • N+N level of resilience • 2N chillers • Multiple fibre connectivity
• Secure 1.2 Acre Site • 1.94 MVA power supply • Up to 10,000 sq ft of net tech space • Multiple Fibre Providers • Planning Consent Granted
• Up to 37,675 sq ft (3,500 sq m) of net technical space
• 4 data halls plus 25,000 sq ft of ancillary office space
• Outside flood plain and local flight paths • 14.5 MVA of incoming power • Planning for data centre use
Infinity TWO Romford
NGD Europe 1 Newport
Unit 3, Crown Road Enfield
• Secure 8.6 acre site • 130,000 sq ft (12,000 sq m) of technical
space • 6 MVA available now, 38 MVA available by
end of the year • Planning consent for data centre use • Multiple Fibre Providers
• Up to 90 MVA of power • 375,000 sq ft of technical space capable of
accommodating over 17,000 racks • Dedicated data halls from 5,000 sq ft • Multi fibre connectivity
• 71,500 sq ft Facility • 26,000 sq ft of technical space • 6 dedicated Data halls • 8 MVA of Power • Power density of 1.5 KW per sq m • N+1 resilience

Jones Lang LaSalle – Data Centre Advisory Group
Mark Larard Director Data Centre Advisory Group +44 (0)20 7399 5428 [email protected]
David Willcocks Lead Director Data Centre Advisory Group +44 (0)20 7399 5294 [email protected]
Charles Carden Associate Director Data Centre Advisory Group +44 (0)20 7399 5249 [email protected]
Oliver Quinn Surveyor Data Centre Advisory Group +44 (0)20 7399 5721 [email protected]
Jones Lang LaSalle
Gordon Hollingsworth Director Critical Environments +44 (0) 20 7399 5239 [email protected]
Brian Oley Vice President Mission Critical Solutions +1(972) 361 5794 [email protected]
James Carson Director Rating +44 (0)20 7852 4082 [email protected]
Chris Strathon Director Valuation +44 (0)20 7399 5848 [email protected]
iXConsulting
Paul Ryan Senior Consultant +44 (0)20 7493 7444 [email protected]
iXConsulting is an independent data centre research house. It is the publisher behind the only daily news research service developed for organisations with a strategic interest in the data centre and IT infrastructure industries - the iXNewsSearch. Groundbreaking at its inception in 2001 and recently passing its 2000th issue, the interactive e-mail is packed with global news providing invaluable and timely insights into the business of data centres. For access to this leading publication, please click here http://www.ixconsulting.co.uk
Data Centre Barometer – Spring 2010 Volume Issue 4 www.joneslanglasalle.co.uk/datacentres OnPoint reports from Jones Lang LaSalle include quarterly and annual highlights of real estate activity, performance and specialised surveys and forecasts that uncover emerging trends.
COPYRIGHT © JONES LANG LASALLE IP, INC. 2010. All rights reserved. No part of this publication may be reproduced or transmitted in any form or by any means without prior written consent of Jones Lang LaSalle. It is based on material that we believe to be reliable. Whilst every effort has been made to ensure its accuracy, we cannot offer any warranty that it contains no factual errors. We would like to be told of any such errors in order to correct them.