the journal of adhesion archimerarchimer.ifremer.fr/doc/00142/25317/26067.pdfthe adhesives, further...
TRANSCRIPT

Ple
ase
note
that
this
is a
n au
thor
-pro
duce
d P
DF
of a
n ar
ticle
acc
epte
d fo
r pub
licat
ion
follo
win
g pe
er re
view
. The
def
initi
ve p
ublis
her-
auth
entic
ated
ver
sion
is a
vaila
ble
on th
e pu
blis
her W
eb s
ite
1
The Journal of Adhesion September 2013, Volume 89, Issue 9, Pages 727-751 http://dx.doi.org/10.1080/00218464.2012.750580 © Taylor & Francis Group, LLC The original publication is available at http://www.tandf.co.uk/journals/
Archimer http://archimer.ifremer.fr
3D Modeling of the Elastic-Plastic Behavior of Thin Aeronautical Adhesive Films Suited for a Wide Range of Tensile/Compression-Shear
Loads
Julien Mauricea, b, Romain Creac'hcadecb, Jean-Yves Cognardb, *, Peter Daviesc, Georges Meirinhosa
and Stéphane Mahdia a Airbus Operations S.A.S. , Toulouse , France b LBMS, ENSTA Bretagne , Brest , France c IFREMER – Brest Centre, Materials & Structures Group , Plouzané , France *: Corresponding author : Jean-Yves Cognard, [email protected]
Abstract: Adhesive bonding is an interesting structural assembling technique for weight saving in modern commercial aircraft, in which the use of composites materials is increasing. In order to meet both optimization and respect of safety conception constraints, the development of accurate numerical strategies is required. Thus, improvement in the experimental characterization and in the design of reliable numerical tools for bonded assemblies is necessary. This paper presents the characterization of the elastic-plastic behaviour of four aeronautical adhesive films, consisting of two epoxy-based resins supported by two types of carrier. The characterization over a wide range of monotonic proportional tensile-shear loads is performed using a modified Arcan test device designed to strongly limit the influence of edge effects. Moreover, to obtain an accurate definition of the initial elastic limit of the adhesives, further experimental tests have been performed using a pressure vessel especially designed to study the influence of the hydrostatic stress. Inverse identification techniques using finite element analysis have been used to identify the material parameters of an elastic-plastic model based on the experimental results (the load-displacement curves). Results underline the potential of such a model to represent the non-linear behaviour of ductile adhesives under tensile/compression-shear proportional monotonic loads. Keywords: Aeronautical ; Mechanical properties of adhesives ; Numerical modeling

2
1. Introduction
Adhesive bonding is an attractive assembly method for structural and technologically advanced applications as it can result in significant weight saving [1]. However, it requires the development of accurate numerical strategies [2], in order to respect safety and design constraints. For commercial aircraft design, in a context of manufacturing time optimization, weight saving and the growing use of composite structural components, the use of adhesive bonding has steadily increased over the last 40 years [3-7]. It is now being developed both as a structural assembly method for stiffened panels [8] and in hybrid bolted/bonded joints [9]. Thus, improvements in the experimental characterization and in the design of numerical tools for bonded assemblies are essential to meet both the objectives of structural optimization and certification. Although shear loading is the favoured load transfer mode in any adhesively bonded joint design, it appears that in the critical loci (often localized in spew fillets, edges or corners) the stress and strain states encountered are truly multiaxial [10,11] and are often characterized by stress concentrations [12,13]. However, the 3D inelastic behaviour of adhesive films typically employed for aircraft applications remains relatively unexplored, due to the fact that common difficulties encountered in adhesively bonded joint characterization are emphasized when it comes to tackling the case of very thin bondlines (around 200 µm), such as those used in aeronautical assemblies. Indeed, considering the widely used Thick Adherend Shear Test [14], it has been demonstrated that when the bondline is below 500 µm thick, the shear modulus can be underestimated by up to 15% [15]. Added to the non-uniformity of the stress state [16], determination of the intrinsic stress/strain behaviour of adhesive films of about 200 µm thick is thus not recommended. Also, because of the very small displacements encountered in testing of aeronautical film assemblies, the strain determination is critical [15]. Besides, using only a shear test does not enable the strength difference between traction and compression loads to be characterized, and the behaviour of adhesives, as polymeric materials, is sensitive to this difference [12, 17-20]. This often requires different tests or specimen designs to be employed in order to cover the several stress states required for an efficient characterization. Last but not least, most of the current specimen designs involve quite large stress concentrations at the end of the overlap [16, 21], and non-uniform stress states within the adhesive layer. On the one hand, the identification is thus disturbed by premature crack onset situated at the locus close to the adhesive-substrate interfaces [16,22], and on the other hand, the direct translation from force and displacement measurements to an intrinsic stress-strain behaviour is all but straightforward. For structural applications, the strength and the long-term durability are key elements of the design process [23]. Adhesives used for aircraft applications are often supplied as films, with or without a carrier. For such materials, dedicated manufacturing conditions have to be used in order to avoid the formation of voids [24]. Moreover, compatibility of the surface treatment [25, 26], influence of cyclic loadings [27], of viscous effects [16] and of environmental parameters such as moisture [28] and temperature [29] have to be taken into account in the design process. At the end, the set-up of a 3D characterization strategy based on different specimen designs appears difficult in view of an industrial application. In terms of modelling, various constitutive laws have been assessed or developed to describe the elastic-plastic behaviour of adhesively bonded joints under monotonic loads. In particular, two main characteristics can be drawn from these studies: - The hydrostatic stress dependency of the yield surface and the flow rule has to be taken into account for a complete description under mixed loads. - Non-associated formalism is also necessary to describe the high ratio between shear and tensile plastic strains accurately.

3
Previous work [19-20, 30] has demonstrated that a Mahnken-Schlimmer type model (MS) [18] can provide a good description of adhesive behaviour over the whole domain covering tension, tension-shear, shear and compression-shear loads. This paper presents the characterisation of the elastic-plastic behaviour of four aeronautical adhesive film configurations, consisting of two epoxy-based resins (from two adhesive manufacturers) supported by two types of carrier. The characterization over a wide range of loads is performed using a modified Arcan test device, designed to strongly limit the influence of edge effects [16] and a 3D full-field analysis of the adherend displacements. In a preliminary phase, the choice of a chemical surface treatment of the metallic adherends was performed in order to optimize the assembly strength. The first part of the paper presents the experimental characterization over a wide range of monotonic proportional tensile-shear loads of the different adhesives. In order to validate the definition of the initial elastic limit of the adhesives, experimental tests have been performed using a pressure vessel designed to study the influence of the hydrostatic stress [19]. In the second part, inverse identification techniques using finite element analysis have been used to identify the material parameters of an elastic-plastic MS type of model using the experimental results (the load-displacement curves). This identification was then validated by considering complementary tests realized under other tension-shear load combinations. The results underline the possibilities of such a model to represent the non-linear behaviour of ductile adhesives under tensile/compression-shear proportional monotonic loads.
2. Test set-up, materials and bonding process
2.1. Modified Arcan device
A modified Arcan fixture developed in previous studies and presented in Fig. 1.a was used. It aims to load with different ratios of shear and tension or compression a unique type of bonded assembly with a classic tension test machine. Indeed, if we define γ as the angle between the normal to the adhesive layer and the axis of the tensile load (Fig. 1.a), the Modified Arcan apparatus allows γ to range from 0° (constrained tension) to 135° (mixed compression-shear) passing through 90° (shear). The fixing system has been designed to prevent any misalignment and to avoid preloading of the assembly [16, 31]. 3D digital image correlation (DIC) [32], with an acquisition frequency of 1 Hz, was used for the measurement of the relative displacements of the two substrates, and thus the deformation of the adhesive (Fig. 1.b). Classical post-processing of modified Arcan results separates the behaviour in the normal (N) and tangential (T) directions as defined in Fig. 1.a. In the following, DN and DT denote the relative displacements of the substrates respectively in the normal and tangential directions whereas FN and FT represent the normal and tangential components of the applied load. It has to be noted that considering the small displacements encountered and to take into account the deformation of the substrates, DN and DT are measured at a given distance from the mid plane of the bonded layer. This distance is defined in 3D DIC post-processing according to the straight lines shown in Fig. 2.b. It will then be applied in the finite element analysis (FEA), used for the inverse identification of the adhesive behaviour (see later in section 4), in order to have a precise comparison between experimental and numerical results.
Experimental tests presented in this paper were made, unless stated otherwise, for a displacement rate of the crosshead of the tensile testing machine of 500 µm/min for a joint thickness of 95 µm and 100 µm/min for a joint thickness of 183 µm; thus, the tests were performed at a strain rate of about 9.10-2s-1
2.2. Geometry of the substrates
The design of the substrates is based on three principles: the limitation of edge effects, a good relative positioning of the substrates, and a precise control of the bonded layer thickness.

4
Limitation of edge effects is obtained by the manufacturing of a beak all round the bonded surface, as presented in Fig. 2.c. An additional cleaning of the free edges to impose a rounded shape is generally proposed for paste adhesives [16]. However, for bonded assemblies with thin adhesive films this is not easy to perform. Thus, the use of sharp beaks was proposed in order to limit stress concentrations [16]. To ensure a precise adhesive thickness and good relative positioning of the two substrates during the bonding process, integral spacers were manufactured during the machining of substrates (Fig. 2.a). Spacers enable a precise and repetitive thickness among the specimens. Screws are used to ensure the relative positioning of the two substrates during the bonding process and a controlled torque of 2.5 Nm is applied to further limit the scatter in the adhesive thickness. After the curing process, the spacers are cut off, leaving the bonded specimen to be used with the modified Arcan device (Fig. 2.b). For such specimens, the area of the bonded section is 65 mm x 10 mm.
2.3. Adhesives and curing process
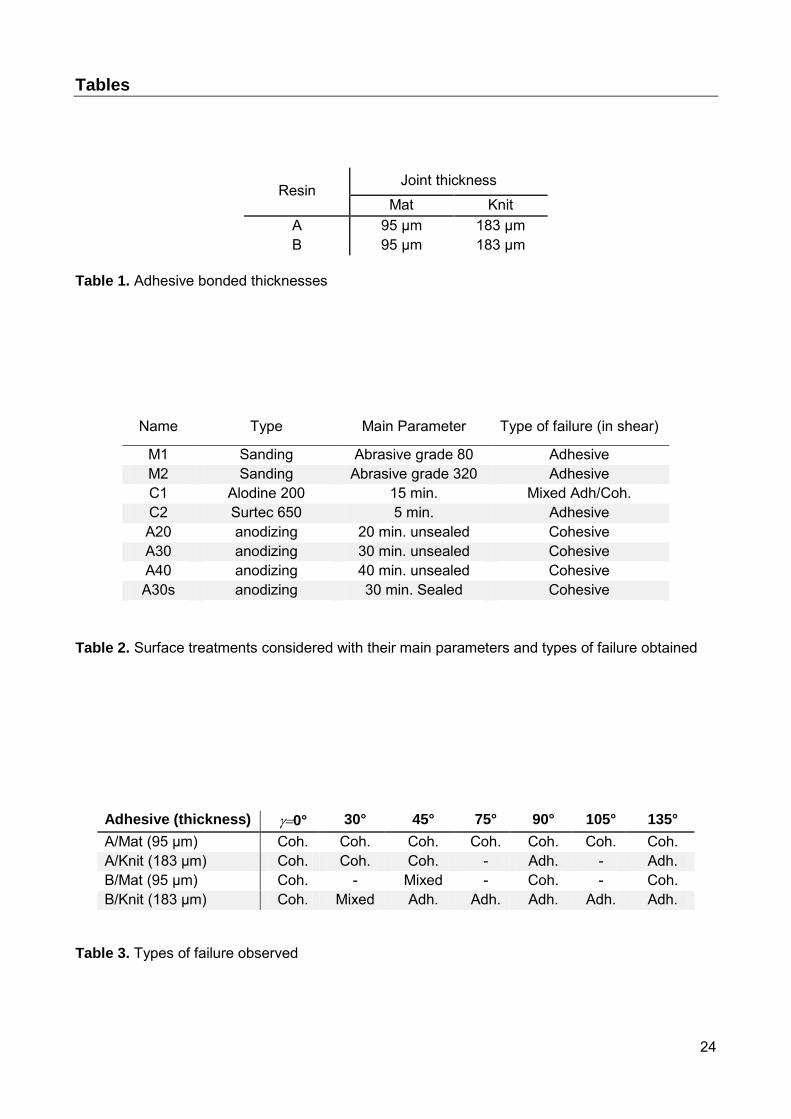
In this study, four aeronautical adhesive films have been tested, with two types of resins and two types of carriers as presented in Table 1. Initial thicknesses vary from about 100 µm for the Mat configurations to 200 µm for the Knit ones, but only two thicknesses (95 µm and 183 µm) were retained for the tests. Table 1 presents the adhesive thicknesses after curing. Analysis with micro tomography techniques has shown previously that polymerization in an oven without pressure leads to quite large porosity in the adhesive. Therefore, for the different experimental tests presented here, the curing process has been carried out in an autoclave following the manufacturers’ recommendations. Substrates were made of aluminium, even if such adhesives are used for bonding composite parts. This is coherent with the industrially oriented hypothesis of a negligible influence of the interphase associated with cohesive-only failures required for adhesives characterization.
2.4. Choice of the surface treatment prior to bonding
Various surface preparations of the substrates have been tested in order to optimize the strength of the aluminium/adhesive interface and obtain cohesive failures. Three types of treatment were considered: mechanical abrasion (sanding with different grades), chemical treatment (Alodine or Surtec) and unsealed anodising (by sulphuric acid with different durations). One sealed anodization was also tested. These treatments, with their main parameters, are summarized in Table 2. The treatments were compared for the adhesive A/Mat in a shear configuration (90°). This configuration was chosen because it is considered as the most critical for the adhesive/substrate strength since the load transferred is generally higher in shear. This is confirmed by previous studies with the modified Arcan test for which, whatever the adhesive considered, once cohesive failure is obtained in shear, it is also cohesive for other load ratios. For each configuration, three specimens were considered. Results obtained for the failure loads are presented in Fig. 3.a and the comparison of the mean curves is given in Fig. 3.b. Here the mean stress, i.e within the bonded layer, is derived as the applied load divided by the bonded surface. All figures have been normalized, by the same stress value, for confidentiality reasons. Results show a good correlation between the mean load at failure and the type of failure obtained. Highest failure loads correspond to cohesive failures, whereas adhesive failures show the lowest loads. Besides, considering the scatter within cohesive failures, it is clear that unsealed sulphuric acid anodizing gives the best results. Comparisons of the stress vs. relative displacement curves confirm these trends: mean strains at failure are higher for anodizing treatments whereas premature failure at low displacement and associated with adhesive failure is observed for the Alodine treatment. All curves show similar initial stiffness so the main differences are in the apparent elastic limit and displacement at failure. Based on these results, sulphuric anodizing – 20 min. – unsealed was chosen as the treatment for all the tests that will be presented hereafter.

5
3. Experimental analysis for adhesive A
This section presents some aspects of the mechanical behaviour of an adhesive film. It includes modified Arcan results under monotonic loads and is completed by results at different strain rates as well as under cyclic loads in shear. In addition, modified Arcan tests have been performed inside a pressure vessel in order to study the behaviour of such adhesives under higher compressive hydrostatic stresses.
3.1. Results under tensile/compression-shear loads
Fig. 4 presents the results for the A/Mat adhesive with various load ratios (0°, 30°, 45°, 75°, 90° and 135°). Results are separated into the normal and the tangential behaviour. Indeed, a large ratio exists between these and, in particular, very small displacements are observed in the normal direction (15µm at failure for = 0° against 60µm for = 90°). As a consequence, some noise appears in the normal direction for mixed loads, at 75° and 135° in particular, for which the displacements are about 8 times greater in the tangential direction. Two or three tests were performed for each configuration. All failed cohesively within the adhesive, as presented in Fig. 5 for the four main directions considered (i.e. tension, tension-shear at 45°, shear and compression-shear at 135°). The scatter observed among the results is relatively low and corresponds to previous observations for the modified Arcan device with paste adhesives [16], associated with low stress concentrations. The different loads at failure for a given value of are close whereas the relative displacements at failure exhibit more important variations. It may be that the frequency chosen for image acquisition (1Hz) is not sufficient to register the exact moment of failure, leading to scatter in the displacement at failure which is not found for the load because of the ductility observed. Whatever the load applied, inelastic behaviour is clearly visible. Besides, behaviour in tension-shear and compression-shear differ qualitatively, since in the normal direction the compression-shear response is almost linear, even when the elastic limit, clearly apparent on the tangential component, is passed. This is not the case for the tension-shear results, where the inelastic behaviour is more pronounced in the normal direction. The inelastic behaviour of the A/Mat adhesive was further studied by investigating strain-rate effects and cyclic loads as presented in Fig. 6.a and 6.b respectively. All were performed in a shear configuration (=90°) and cyclic loads were applied at a strain rate of 9.10-2 s-1, applying 12 cycles incrementing the maximum load before failure. An increase in the strain rate results in an increase of both the apparent yield and ultimate stress whereas the initial stiffness seems less affected for a ratio of 1 to 100 (Fig. 6.a). Considering cyclic loadings (Fig. 6.b), the hysteresis loops observed confirm the viscous behaviour of the adhesive. A loss of the secant stiffness of about 25% and permanent residual displacement were noted between the first and the last cycle, indicating damage in the adhesive.
3.2. Influence of compressive hydrostatic stresses
In order to analyse the influence of high compressive hydrostatic stress on the mechanical behaviour of the adhesive and to obtain a more precise definition of its initial elastic limit, additional tests have been performed using a specific pressure vessel called “CHEM” [19]. This allows a compressive stress state to be applied by increasing the water pressure inside a chamber mounted on a tensile machine. View-glasses are used to see inside the vessel up to a pressure of 60 MPa, which allows 2D DIC to be employed (Fig. 7.a). Given the limited volume of the CHEM, a smaller Arcan fixture than the one previously described with an external diameter of 155 mm had to be developed [19]. The specimens used with this device have a bonded section of 50 mm x 9 mm.

6
After positioning the device in the tensile machine, the vessel is closed using the screw-nut system presented in Fig. 7b. It is then filled with tap water and the required pressure is applied using a pump. While the pressure increases, a two-chamber equilibrium system ensures no other preloading of the specimen. Thus, during this phase, the only load applied to the specimen is due to the hydrostatic pressure. For the bonded specimens used, the main part of the adhesive is loaded under compression [19]. Then, a mechanical test, imposed by the tensile machine, can be performed at a constant pressure in the vessel. In this study, only tests in a shear configuration (=90°) have been performed. Results are presented in Fig. 8.a for internal pressures of 0.3, 30 and 60 MPa and will be detailed in section 4.2. Two or three tests were run for each configuration at a strain rate of 9.10-2s-1. Despite higher scatter than for the tests without pressure described in section 3.1 (Fig. 4.b), the results show an increase of the mean load at failure with increasing applied pressure. From 1 at 0.3 MPa, it increases up to 1.25 at 30 MPa and 1.36 at 60 MPa. The same trend is observed for the load at the elastic/inelastic limit. 4. Modelling of the non-linear behaviour of the adhesives
We focus here on the elasto-plastic behaviour of the adhesive films considered. Experimental and numerical results were presented in the previous section for adhesive A/Mat, and at the end of this section for the three other adhesives. Viscous effects and damage are not considered. The modified Arcan test results provide a large database for the identification and validation of a 3D constitutive model. As stated in the introduction, various ratios of loads are considered in order to precisely characterize the complex behaviour of these adhesives. However, the 3D stress and strain fields within a modified Arcan specimen are not uniform. Identification of any model based on these results has thus to be carried out using inverse identification. Based on the results from a previous study [20], a simplified identification process has been developed for an existing model. This model has been slightly modified and applied to the case of the aeronautical adhesive films considered here. The next section first describes the model and then the results obtained for its step-by-step identification for all the adhesives considered.
4.1. Equations of the model
The model proposed by Schlimmer has been chosen, following a previous study [20]. The yield surface, F , is given by :
YpapYaF VM 2
201
2 (1)
Where VM is the von Mises equivalent stress, p the hydrostatic stress component defined
according the decomposition of the stress tensor into a deviatoric ( S ) and a hydrostatic part (
dIp ):
dIpS SSVM :2
3 )(
3
1trp (2)
7
1a and2a are two parameters defining the shape of the function in the von-Mises-hydrostatic
pressure (Mises-p) plane, 0Y the von Mises stress at the elastic-plastic limit in pure shear and dI
the third order identity tensor. The hardening function is defined by:
v
beHeeqYY v
)1(0 (3)
Where q, b and H are the three parameters to be identified. The internal strain-like variable of the
model,ve , is given by the relation:
pl
vYe :0 (4) pl is the plastic strain tensor which is defined by a classical normal rule such as:
Gdd pl (5)
where d is the plastic multiplier and G the flow function:
YpaG VM 2*
2
2 when 0p (6.1)
YpaG VM 2*
3
2 when 0p (6.2)
This definition differs from the one initially proposed. Indeed, a previous study [20] demonstrated
that, with the assumption of inelastic strain in shear without volume change, a non-symmetric flow
rule with respect to the von Mises axis could enhance the fitting of the model for the compression-
shear behaviour. Continuity of
G is assured by the horizontal tangent at the point of zero
hydrostatic stress (p).
The model is thus, using this a-priori definition, chosen non-associated, since the flow function and the yield function may not be the same. In order to deal with the non-uniform stress state, a simplified inverse identification approach to the model has been developed [20]. It involves a sequential approach, using a minimum number of optimization/FEA coupling steps. Three steps use the results obtained with the modified Arcan specimen in order to identify the eight parameters of the model as follows: - identification of the initial yield surface (Y0, a1 and a2), using mainly elastic
- simulations,
- identification of the hardening function (q, b and H), using inverse identification,
- identification of the flow rule parameter (a2* and a3*), using inverse identification.

8
This procedure has been applied for the four aeronautical films considered in this study. Table 3 summarizes the load ratios tested for each adhesive as well as the modes of failure obtained. It can be seen that cohesive failures were not obtained for all adhesives in all the configurations. A/Mat and B/Mat give the best results, whereas for A/Knit, adhesive failures were observed in shear and compression-shear and for B/Knit cohesive failures occurred only in the tension configuration (0°). This is because the surface treatment has been optimized for the A/Mat film. Besides it has been demonstrated that stress concentrations at the interface increase with the thickness of the bonded joint [13]. This could explain why the best results were obtained with thin (95 µm) bondline thickness rather than the thicker ones. The results obtained for Knit adhesives should therefore be treated with caution but were kept in this paper because of the overall good fitting achieved. In the following, the results obtained at each step are presented. The method used is briefly described. The reader is referred to a more detailed article [20] for a complete description of the process.
4.2. Initial elastic limit
The elastic function is identified in the von Mises-hydrostatic stress plane. Experimental points are obtained using the stress state at the centre of the Arcan specimen determined by linear elastic FEA at the load that experimentally corresponds to the beginning of non-linearity. The yield function of the model (defined by Y0, a1 and a2) is then fitted using a classical least-squares method. Comparisons with the experimental results for A/Mat and A/Knit adhesives are presented in Fig. 9.a. Comparison of the identified functions for the four adhesives is presented Fig. 9.b. For the A/Mat adhesive, good fitting of the yield surface is achieved on the whole domain. For the A/Knit, the MS function over-estimates the yield limit in compression-shear. Besides, a clear gap is obtained between these two configurations since for a given proportional load path (that is to say considering a straight line in the von Mises-hydrostatic stress plane starting from the origin) the yield stress for the A/Mat adhesive is at least 25% higher. Fig. 9.b confirms that the A/Mat gives the highest yield stress over the whole domain compared to the other adhesives. Another interesting point is the differences for positive hydrostatic stresses (tension-shear and tension domain). Indeed, despite having almost the same value in shear, B/Knit and A/Knit show an important difference under tension loads, confirming that comparisons of adhesives under shear loads only are not sufficient to characterize their behaviour. Validation of the yield function was also carried out for the A/Mat adhesive using a modified Arcan device in shear within the CHEM system. For this test, the load path in the von Mises-hydrostatic stresses plane encountered by the adhesive differs from those observed in the modified Arcan device alone. This is illustrated in Fig. 8.b. For tests in the CHEM, pressurization leads to compression of the adhesive up to points A (30 MPa) or B (60 MPa). The pressure is then kept constant while loading the specimen in shear, which corresponds to a vertical load path up to yielding. This is in contrast to the, proportional load paths which are applied in classical modified Arcan tests (represented for γ= 90° and 135°). As a consequence, a test in shear-configuration, at a 30 MPa pressure level in the CHEM, enables the estimated yield surface to be reached at almost the same point as a mixed compression-shear test (135°). At 60 MPa there is no equivalent load ratio for the modified Arcan device and at 0.3 MPa it almost corresponds to a load ratio of 90° (shear test) since the compressive load applied is very low. The results obtained are in good agreement with the tests at 30 and 60 MPa. The yield points are, considering the scatter bars, in line with the predictions of the model. At 0.3 MPa, however, the predicted yield point is higher by at least 10%. It is important to note that the use of the pressure vessel increases the scatter in the results, associated with the complexity of this device, but interesting information is obtained in order to define the initial elastic domain.

9
4.3. Hardening function
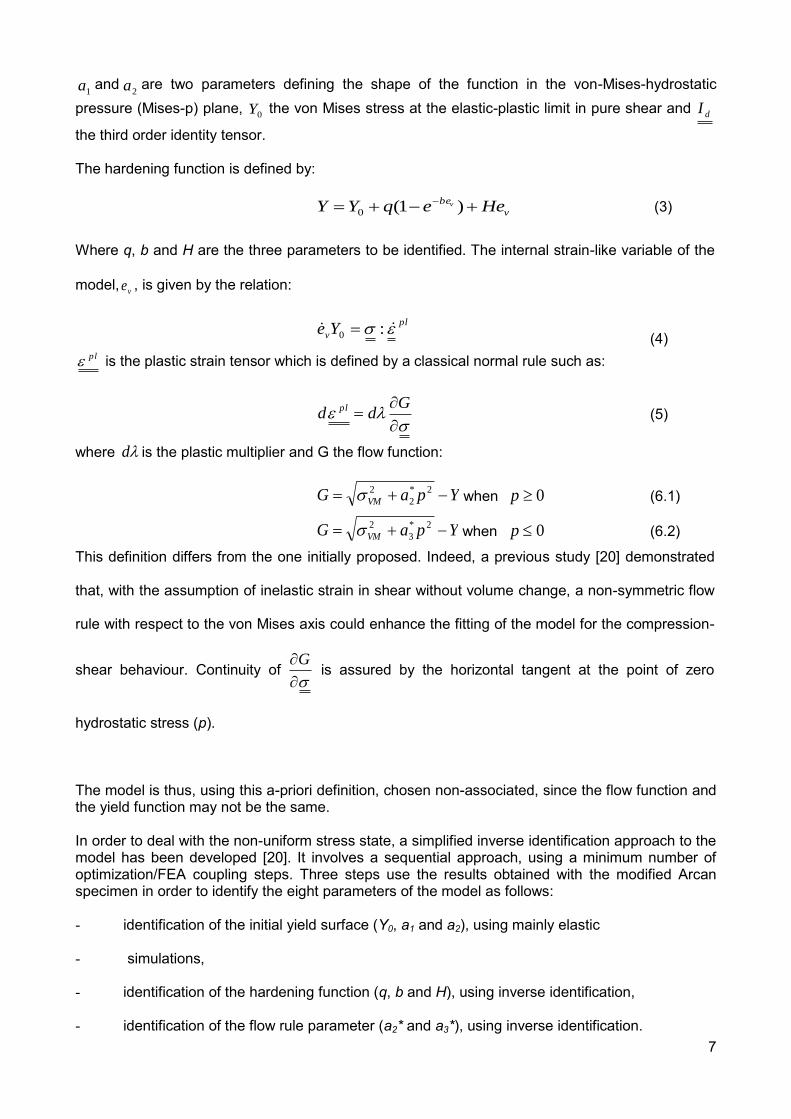
The hardening function parameters (q, b and H) are identified using an inverse identification process. H mainly influences the asymptotic behaviour (slope of the curve) whereas q and b influence the shape of the rounded part. The comparisons of experimental (Exp.) vs. numerically identified results (FEA) are presented in Figures 4.b (A/Mat), 10.b (A/Knit), 11.b (B/Mat) and 12.b (B/Knit). In each case, the numerical results are in good agreement with the experimental ones. In order to compare the different adhesives, Fig. 13 presents the hardening functions. The main differences are observed in the shape of the rounded part at the beginning of the inelastic strain behaviour, whereas the asymptotic slopes are quite similar. It should be noted that plots of Y/Y0 vs. ev are presented in Fig. 13, so differences in the initial elastic limit in shear (Y0) do not appear here.
4.4. Flow function
The remaining flow rule parameters, a2
* in the tension-shear domain and a3* in the compression-
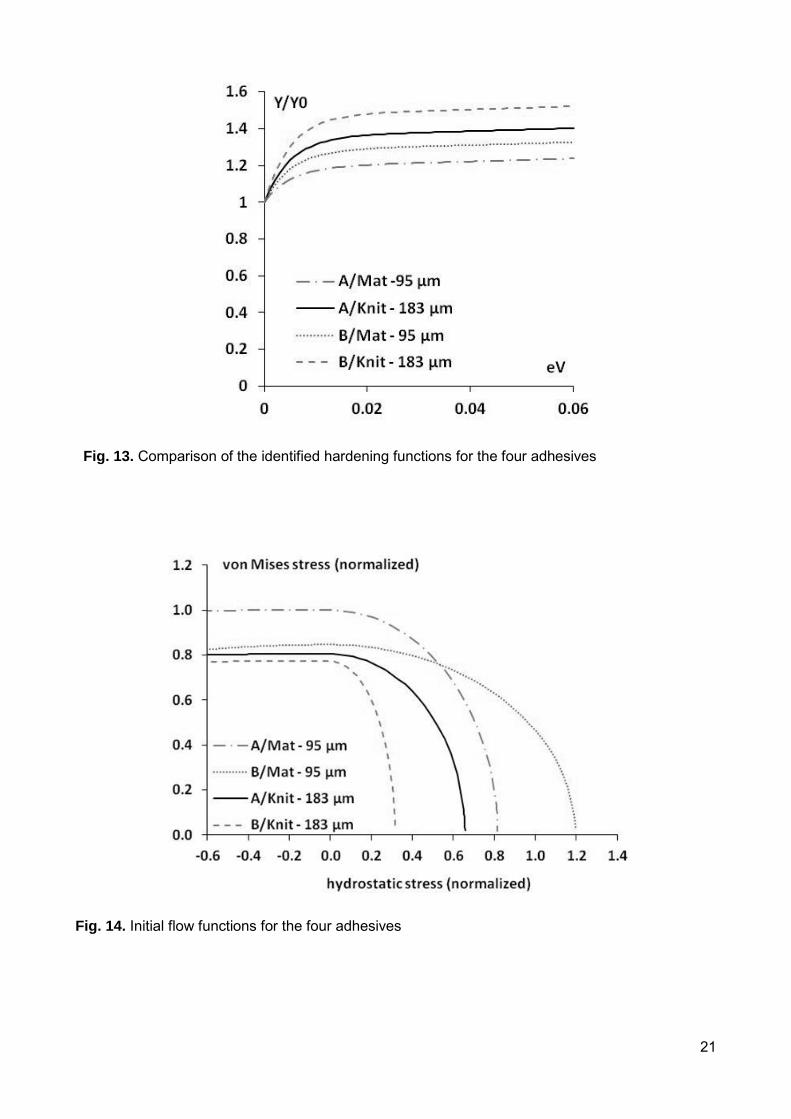
shear domain, were determined using a parametric study. The experimental results used to determine the optimized parameters are the load ratios respectively at 45° and 135°. Comparisons between FEA and experimental results are presented in Figures 4 (A/Mat), 10 (A/Knit), 11 (B/Mat) and 12 (B/Knit). Results obtained in tension-shear (45°) are quite close except for the B/Mat configuration in the normal direction, for which the transmitted load is slightly overestimated. In compression-shear, correlations for the mat and the knit configurations clearly differ. For the knit configuration, the FE results do not match with the experimental ones in the tangential direction since the transmitted load at a given relative displacement is overestimated once the elastic limit is reached. In both cases, this corresponds to the gap between the experimental and identified yield surfaces, as illustrated in Fig. 9.a for the A/Knit adhesive and discussed in section 4.2. However, the overall shapes of the curves are correct, suggesting that the difference may only result from an offset of the yield surfaces. Fig. 14 presents the different identified initial flow functions. The benefit of having a dissymmetric function with respect to the von Mises stress axis is clearly emphasized. Indeed, in compression-shear, the function seems almost independent of the hydrostatic stress component; a3
* values are very small and could be removed from the definition, which could enable a fitting of the model without any further parameters needed compared to the solution proposed in [20].
4.5. First validations
Finally, the identification has been made using experimental results in shear, tension-shear and compression-shear. Further tests have been considered under different load ratios as summarized in Table 3. These results constitute a first validation of the model. Comparisons of the identified models are presented in Figures 4, 10, 11 and 12. In particular, the A/Mat results include load ratios at 0°, 30° and 75°. Good fits are observed for 30° whereas at 75° the transmitted load (mainly in shear) is under-estimated due to an offset of the yield surface as observed (Fig. 9.a). At 0°, the initial stiffness is not very well described, but the small displacements measured, 15 µm maximum, can explain the error with respect to the model. Considering the other adhesives, results for the A/Knit (Fig. 10) and B/Mat (Fig. 11) and B/knit (Fig. 12) are satisfactory.
4.6. Comparison of the mechanical behaviour of the four adhesives
Fig. 15 shows a comparison of the identified numerical results for the loads at 0°,45°,90° and 135°, separating the normal and the tangential behaviours. The results are presented as the mean stress (corresponding tangential or normal load divided by the bonded area) versus the relative displacement divided by the adhesive thickness, which is the equivalent of a normalized stress vs. strain curve. Once again, due to the non-uniform 3D stress/strain encountered within the modified

10
Arcan specimen, this does not correspond to a real stress/strain relation, but it allows the adhesives to be compared on the same basis. According to the correlations obtained (Figures 4, 10, 11 and 12) and considering that adhesive failures were observed for the two Knit configurations, these comparisons are relevant for shear and tension-shear loads. Here the main differences are in the rounded shape of the elastic-plastic transition of the behaviour, which is in line with the observations made during the identification steps (section 4.2 to 4.4). Indeed, for a given load ratio, whatever the configuration, the slope of the asymptotic behaviour does not depend on the adhesive type. Besides, since almost identical elastic coefficients were chosen, there is no significant difference in the elastic part of the behaviour between the Mat or the Knit supported films. The difference between Mat and Knit configurations observed in both directions is explained by the fact that the curves do not represent the real stress vs. real strain material relationship. In order to compare the mean values at failure for the different adhesive films, the relative displacements normalized by the adhesives thickness (i.e. equivalent mean strain) and the mean stress are presented respectively in Figures 16 and 17 for the different load ratios. For the mean strain, comparisons of the results obtained in the normal direction (Fig. 16.a) are not straightforward and no clear conclusion can be drawn. Once again, an insufficiently high data acquisition frequency may be invoked, associated with very small displacements. In the tangential directions (Fig 16.b), it is clear that whatever the load ratio, the maximum value is obtained for the A/Mat adhesive. The same adhesive with a knit carrier shows almost the same mean strain at failure in tension-shear and lower values in shear (-30%) and compression-shear (-22%) whereas for adhesive B, the configuration (carrier and thickness) is less influential in compression-shear (-13%) and has virtually no influence in shear and tension-shear. A very similar trend is observed for the mean stress at failure (Fig. 17). 5. Conclusion
This study focused on the mechanical characterization of aeronautical adhesive films under a wide range of loads, and the identification of an advanced elasto-plastic model. The use of a modified Arcan specimen and 3D Digital Image Correlation enabled a large data base to be obtained with low scatter. In particular, a surface treatment was chosen using one of the adhesives in order to obtain cohesive failures, and a dedicated post-processing method was developed in order to achieve accurate results considering the very small displacements encountered. A modification of the Mahnken-Schlimmer model was then proposed. It was identified using a simplified inverse identification process. The results obtained for the four adhesives enable the overall method to be validated. Indeed the good versatility of the model enables it to describe the differences observed between the four adhesives and to achieve a relatively good fitting for each configuration. A first validation of the model considering different load ratios of the modified Arcan device was carried out, and further Arcan tests performed in shear using a pressure vessel validated the yield surface obtained under higher compressive stress states. The dependence on the hydrostatic stress component of the yield function and non-associated formalism is clearly demonstrated. The definition of a dissymmetric flow function enabled the behaviour for both tension-shear and compression-shear loads to be accurately described. For the latter, the results obtained show that the dependence on the hydrostatic stress component is needed in the tension-shear domain but almost inexistent under compression-shear loads. Work is underway to analyse, experimentally and numerically, the behaviour of aeronautical bonded composite structures. Further interesting continuations of this work would be to study the influence of viscous effects, of cyclic loadings and of non-proportional loading paths.

11
Acknowledgements
The authors wish to acknowledge Laurent Kerneis from LBMS/ENSTA Bretagne for his help on the bonding of the Arcan specimens and André Kerboul from IFREMER for his collaboration in the experimental tests with the pressure vessel. References
[1] L.F.M. da Silva, A. Öchsner, R.D. Adams, Handbook of Adhesion Technology, Springer,
Heidelberg, 2011. [2] L.F.M. da Silva, A. Öchsner, Modeling of adhesively bonded joints, Springer, Heildelberg,
2008. [3] P.D.L. Potter, Primary adhesively bonded structure technology, Design Handbook for
Adhesive Bonding, Douglas Aircraft Company, Technical report AFFDL- TR-79-3129, 1979.
[4] J.A Bishopp, The history of Redux and the Redux bonding process, Int. J. Adhes. Adhes. 17 (1997) 287-301.
[5] A. Higgins, Adhesive bonding of aircraft structures, Int. J. Adhes. Adhes. 20 (2000) 367-376.
[6] A.A. Baker, L.R.F. Rose, R. Jones, Advances in the Bonded Composite Repair of Metallic
Aircraft Structure, Elsevier Ltd, 2002.
[7] R. D. Adams, J. Comyn, W. C. Wake, Structural Adhesive Joints in Engineering, Chapman & Hall, London, UK, 1997.
[8] J. Bertolini, B. Castanié, J.J. Barrau, J.P. Navarro, An experimental and numerical study on omega stringer debonding, Compos. Struct. 86 (2008), 233-242.
[9] C.T Hoang-Ngoc., E. Paroissien, Simulation of single-lap bonded and hybrid (bolted/bonded) joints with flexible adhesive, Int. J. Adhes. Adhes. 30 (2010) 117–129.
[10] C.H. Wang, L.R.F. Rose, Determination of triaxial stresses in bonded joints, Int. J. Adhes. Adhes. 17 (1997) 17-25.
[11] R. Kruger, P.J. Minguet Analysis of composite skin-stiffener debond specimens using a shell/3D modelling technique, Compos. Struct. 81 (2007) 41–59.
[12] C.H Wang, L.R.F. Rose, Compact solutions for the corner singularity in bonded lap joints, Int. J. Adhes. Adhes. 20 (2000) 145-154.
[13] J.Y. Cognard, Numerical analysis of edge effects in adhesively-bonded assemblies. Application to the determination of the adhesive behaviour, Comp. Struct. 86 (2008) 1704-1717.
[14] ASTM D5656-95. Standard test method for thick-adherend metal lap-shear joints for determination of the stress–strain behavior of adhesives in shear by tension loading. ASTM, 1995.
[15] C. Yang, J.S Tomblin, Investigation of adhesive behavior in aircraft applications, DOT/FAA/AR-01/57, FAA technical Report, 2001
[16] J.Y. Cognard, R. Créac’hcadec, L. Sohier, P. Davies, Analysis of the non linear behaviour of adhesives in bonded assemblies. Comparison of TAST and ARCAN tests, Int. J. Adhes. Adhes. 28 (2008) 393-404.
[17] R. Raghava, RM Caddell, G.S.Y. Yeh, The macroscopic yield behaviour of polymers, J. Mater. Sci. 8 (1973) 225-232.
[18] R. Mahnken, M. Schlimmer, Simulation of strength difference in elasto-plasticity for adhesive materials, Int. J. Num. Meth. Eng. 63 (2005) 1461-1477.
[19] J.Y Cognard, R. Créac’hcadec, L.F.M da Silva, F.G Teixeira, P. Davies, M. Peleau, Experimental analysis of the influence of hydrostatic stress on the behaviour of an adhesive using a pressure vessel, J. Adhes. 87 (2011) 804-825.
[20] J. Maurice, J.Y Cognard, R. Créac’hcadec, P. Davies, L. Sohier, S. Mahdi, 3D modeling of the behavior of an adhesive in an assembly using a non-associated elastoplastic pressure dependent model, J. Adhes. Sci. Technol. (in press), 2012

12
[21] E. Sancaktar, S.R. Simmons, Optimization of adhesively-bonded single lap joints by adherend notching, J. Adhes. Sci. Technol. 14 (2000) 1363 –1404.
[22] G. Dean, L. Crocker, B. Read, L. Wright, Prediction of deformation and failure of rubber-toughened adhesive joints, Int. J. Adhes. Adhes. 24 (2004) 295-306.
[23] S.G. Prolongo, K.F. Horcajo, G. Del Rosario, A. Uren, Strength and Durability of Epoxy-Aluminum Joints, J. Adhes. 86 (2010) 409–429.
[24] L.F.M. da Silva, R.D. Adams, M. Gibbs, Manufacture of adhesive joints and bulk specimens with high-temperature adhesives, Int. J. Adhes. Adhes. 24 (2004) 69–83.
[25] S.Y. Park, W.J. Choi, H.S. Choi, H. Kwon, S.H. Kim, Recent Trends in Surface Treatment Technologies for Airframe Adhesive Bonding Processing: A Review (1995–2008), J. Adhes. 86 (2010) 192–221.
[26] K.A. Yendall, G.W. Critchlow, Novel methods, incorporating pre- and post-anodising steps, for the replacement of the Bengough–Stuart chromic acid anodising process in structural bonding applications, Int. J. Adhes. Adhes. 29 (2009) 503–508.
[27] V. Shenoy, I.A. Ashcroft, G.W. Critchlow, A.D. Crocombe, Fracture mechanics and damage mechanics based fatigue lifetime prediction of adhesively bonded joints subjected to variable amplitude fatigue, Eng. Fract. Mech. 77 (2010) 1073–1090.
[28] A. Mubashar, I.A Ashcroft, G.W. Critchlow, A.D. Crocombe, Modelling Cyclic Moisture Uptake in an Epoxy Adhesive, J. Adhes. 85 (2009) 711–735.
[29] L.F.M. da Silva, R.D. Adams, Measurement of the mechanical properties of structural adhesives in tension and shear over a wide range of temperatures, J. Adhes. Sci. Technol., 19 (2005) 109–141.
[30] P. Jousset, M. Rachik, Pressure-Dependent Plasticity for Structural Adhesive, J. Adhes. Sci. Technol. 24 (2010) 1995-2010
[31] J.Y. Cognard, P. Davies, L. Sohier, R. Créac’hcadec, A study of the non-linear behavior of adhesively-bonded composite assemblies, Compos. Struct. 76 (2006) 34-46.
[32] www.gom.com, (last time accessed: November 2012) Figure
(a) (b)
Fig. 1. Modified Arcan test and measurement system. (a) Arcan device (here = 45°) and (b) 3D DIC system set-up.
N
T

13
(a) (b) (c)
Fig. 2. Presentation of the bonded specimens. (a) before curing, (b) before testing and (c) geometry of the beak
(a) (b)
Fig. 3. Influence of the surface preparation of the aluminium substrates on the behaviour of the bonded assembly under shear loads. (a) load at failure and (b) load-displacement diagram.
screws
Spacers
Line for post-processing

14
Fig. 4. Experimental (Exp.) and numerical (Finite Element Analysis- FEA) results for adhesive A/Mat in the normalized load-displacement diagrams under various tensile/compression-shear loads. (a) = 0°, (b) = 90°, (c) = 135° - normal direction, (d) = 135° - tangential direction, (e) = 30°,45°,75° - normal direction and (f) = 30°,45°,75° - tangential direction

15
(a) = 0°
Tensile
(b) = 45° Tensile-shear
c) = 90° Shear
(d) = 135° Compression-shear
Fig. 5. Failure modes for Adhesive A/Mat under various tensile/compression-shear loads.
Fig. 6. Influence of strain rate and behaviour under cyclic loads of bonded assembly under shear loads (= 90°) for the A/Mat adhesive film. (a) strain rate effect and (b) behaviour under cyclic loads.

16
(a) (b) Fig. 7. Presentation of the pressure vessel (CHEM system). (a) presentation of the vessel in closed position and (b) experimental device (in shear configuration) in the vessel (open position).
(a)
(b)
Fig. 8. Influence of an initial hydrostatic pressure on a shear mechanical load for adhesive A/Mat. (a) stress-displacement diagram and (b) loading paths in the von Mises stress-hydrostatic stress diagram
metallic
closure
view-glass
screw
-nut
Modified Arcan
device
screw
-nut

17
(a)
(b)
Fig. 9. Yield surfaces identifications: (a) Experimental versus MS model for A/Mat & A/Knit and (b) MS model identified for the four adhesives

18
Fig. 10. Experimental and numerical results for Adhesive A/Knit in the normalised load-displacement diagrams under various tensile/compression-shear loads. (a) = 0°, 45° - normal direction, (b) = 45°, 90° - tangential direction, (c) = 135° - normal direction and (d) = 135° - tangential direction

19
Fig. 11. Experimental (red curves) and numerical (blue curves) results for Adhesive B/Mat in the normalised stress-displacement diagrams under various tensile/compression-shear loads. (a) = 0°, 45° - normal direction, (b) = 45°, 90° - tangential direction, (c) = 135° - normal direction and (d) = 135° - tangential direction.

20
Fig. 12. Experimental and numerical results for adhesive B/Knit in the normalised load-displacement diagrams under various tensile/compression-shear loads. (a) = 0°, 45° - normal direction, (b) = 45°, 90° - tangential direction, (c) = 135° - normal direction and (d) = 135° - tangential direction
21
Fig. 13. Comparison of the identified hardening functions for the four adhesives
Fig. 14. Initial flow functions for the four adhesives

22
Fig. 15. Comparison of the identified behaviour of the four adhesive films: numerical results. (a) = 0°, (b) = 90°, (c) = 45°- normal direction, (d) = 45° - tangential direction, (e) = 135° - normal direction and (e) = 135° - tangential direction

23
(a)
(b)
Fig.16. Equivalent mean strain at failure for the four adhesives with respect to the loading parameter (). (a) results in the normal direction and (b) results in the tangential direction.
Fig. 17. Equivalent mean stress at failure or the four adhesives with respect to the loading parameter ()
24
Tables
Resin Joint thickness
Mat Knit A 95 µm 183 µm B 95 µm 183 µm
Table 1. Adhesive bonded thicknesses
Name Type Main Parameter Type of failure (in shear)
M1 Sanding Abrasive grade 80 Adhesive M2 Sanding Abrasive grade 320 Adhesive C1 Alodine 200 15 min. Mixed Adh/Coh. C2 Surtec 650 5 min. Adhesive A20 anodizing 20 min. unsealed Cohesive A30 anodizing 30 min. unsealed Cohesive A40 anodizing 40 min. unsealed Cohesive A30s anodizing 30 min. Sealed Cohesive
Table 2. Surface treatments considered with their main parameters and types of failure obtained
Adhesive (thickness) 0° 30° 45° 75° 90° 105° 135°
A/Mat (95 µm) Coh. Coh. Coh. Coh. Coh. Coh. Coh. A/Knit (183 µm) Coh. Coh. Coh. - Adh. - Adh. B/Mat (95 µm) Coh. - Mixed - Coh. - Coh. B/Knit (183 µm) Coh. Mixed Adh. Adh. Adh. Adh. Adh.
Table 3. Types of failure observed