the journal of financial perspectives - ernst & young75321afc-e231-451a-a67c-1bba2f9d... · the...
TRANSCRIPT
The Journal of
FinancialPerspectivesEY Global Financial Services Institute July 2014 | Volume 2 – Issue 2
Article: Firm structure in banking and finance: is broader better?

The EY Global Financial Services Institute brings together world-renowned thought leaders and practitioners from top-tier academic institutions, global financial services firms, public policy organizations and regulators to develop solutions to the most pertinentissues facing the financial services industry.
The Journal of Financial Perspectives aims to become the medium of choice for senior financial services executives from banking and capital markets, wealth and asset management and insurance, as well as academics and policymakers who wish to keep abreast of the latest ideas from some of the world’s foremost thought leadersin financial services. To achieve this objective, a board comprising leading academic scholars and respected financial executives has been established to solicit articlesthat not only make genuine contributions to the most important topics, but are also practical in their focus. The Journal will be published three times a year.
gfsi.ey.com
The articles, information and reports (the articles) contained within The Journal are generic and represent the views and opinions of their authors. The articles produced by authors external to EY do not necessarily represent the views or opinions of EYGM Limited nor any other member of the global EY organization. The articles produced by EY contain general commentary and do not contain tailored specific advice and should not be regarded as comprehensive or sufficient for making decisions, nor should be used in place of professional advice. Accordingly, neither EYGM Limited nor any other member of the global EY organization accepts responsibility for loss arising from any action taken or not taken by those receiving The Journal.

EditorialEditor
Shahin ShojaiEY LLP
Advisory Editors
Dai BedfordEY LLP
Ratan EngineerEY LLP
Shaun CrawfordEY LLP
David GittlesonEY LLP
Carmine DiSibioEY LLP
Bill SchlichEY LLP
Special Advisory Editors
Ben GolubBlackrock
Antony M. SantomeroThe Wharton School
Anthony NeohBank of China
Nick SilitchPrudential Financial
Steve PerryVisa Europe
Editorial Board
Viral V. AcharyaNew York University
Deborah J. LucasMassachusetts Institute of Technology
John ArmourUniversity of Oxford
Massimo MassaINSEAD
Tom BakerUniversity of Pennsylvania Law School
Patricia A. McCoyUniversity of Connecticut School of Law
Philip BoothCass Business School and IEA
Tim MorrisUniversity of Oxford
José Manuel CampaIESE Business School
John M. MulveyPrinceton University
Kalok ChanHong Kong University of Science and Technology
Richard D. PhillipsGeorgia State University
J. David CumminsTemple University
Patrice PoncetESSEC Business School
Allen FerrellHarvard Law School
Michael R. PowersTsinghua University
Thierry FoucaultHEC Paris
Andreas RichterLudwig-Maximilians-Universitaet
Roland FüssUniversity of St. Gallen
Philip RawlingsQueen Mary, University of London
Giampaolo GabbiSDA Bocconi
Roberta RomanoYale Law School
Boris GroysbergHarvard Business School
Hato SchmeiserUniversity of St. Gallen
Scott E. HarringtonThe Wharton School
Peter SwanUniversity of New South Wales
Paul M. HealyHarvard Business School
Paola Musile TanziSDA Bocconi
Jun-Koo KangNanyang Business School
Marno VerbeekErasmus University
Takao KobayashiAoyama Gakuin University
Ingo WalterNew York University
Howard KunreutherThe Wharton School
Bernard YeungNational University of Singapore
Read full article
Executive summary
Firm structure in banking and finance: is broader better?by Markus Schmid, Professor of Corporate Finance, Swiss Institute of Banking andFinance, University of St. Gallen and Ingo Walter, Seymour Milstein Professor of Finance,Corporate Governance and Ethics, Stern School of Business, New York University
A focal point in strategic and regulatory debates about the pros and cons ofdiversification among financial institutions continues to be the issue of economies ofscope in financial intermediation. In this paper, we summarize the theoretical research onthe value of diversification in financial services firms, and survey the empirical researchdone so far on the conglomerate discount (the suggestion that diversified businessare priced less favorably by the markets due to the fact that management expertise isspread too thinly, or that due to soft factors many of the benefits of conglomerationdon’t materialize, etc.) in U.S. and international financial services businesses. We alsoreview research on the internal capital market efficiency of universal banks and financialconglomerates. The paper provides new empirical evidence on the conglomeratediscount in U.S. financial intermediaries and how that changes between non-crisisand crisis periods, showing a decline in the discount under turbulent conditions. Thissuggests that the markets value the benefits of diversification among financial servicesfirms during turbulent times as it helps protect the firm from severe issues in one part ofits business. At other times, conglomerations are viewed less favorably by the markets.
AbstractA focal point in strategic and regulatory debates about the pros and cons of diversification among financial institutions continues to be the issue of economies of scope in financial intermediation. In this paper, we summarize the theoretical research on the value of diversification in financial services firms, and survey the empirical research so far on the conglomerate discount in U.S. and international financial services businesses. We also review research on the internal capital market efficiency of universal banks and financial conglomerates. The paper provides new empirical evidence on the conglomerate discount in U.S. financial intermediaries and how that changes between non-crisis and crisis periods, showing a decline in the discount under turbulent conditions.
Firm structure in banking and finance: is broader better?Markus Schmid Professor of Corporate Finance, Swiss Institute of Banking and Finance, University of St. GallenIngo Walter Seymour Milstein Professor of Finance, Corporate Governance and Ethics, Stern School of Business, New York University
1. IntroductionAs the structural transformation of national financial systems and the global financial architecture continues, three questions are often raised during the debates: is it better for financial services firms to be (1) bigger, (2) geographically expansive and (3) functionally diverse? These questions have implications for the strategic positioning of banks and financial firms in optimizing revenues, risks and costs. They are also of interest to regulators and the general public in terms of the trade-offs that exist between efficiency, innovation and stability in setting the rules under which financial services firms are required to operate.
These debates have informed a rich array of both conceptual and empirical studies that address the underlying issues and attempt to confirm or refute the central hypotheses in financial intermediation. This paper addresses the third of the aforementioned issues — whether functional diversity in financial intermediation creates or destroys value among financial intermediaries. This literature is less well developed than work on the size and scale of financial firms, but no less important in driving the strategic and regulatory debates.
In the U.S., the Gramm-Leach-Bliley Act of 1999 (GLB) removed many of the restrictions on financial services firms. Well before the GLB legislation, U.S. banks were already shifting away from lending activities toward a broader array of financial services, in part through separately capitalized subsidiaries of bank holding companies (BHCs). But the Act opened the way for full financial integration by explicitly allowing U.S. BHCs to engage in brokerage, advisory and underwriting activities, among others. In Europe, the scope for functional diversification of financial intermediaries had been deregulated earlier and more completely. The E.U. Second Banking Coordination Directive of 1989 allowed European banks, as universal credit institutions, to diversify directly (without BHCs) into various activity areas such as commercial banking, investment banking and insurance. In terms of strategy, financial services firms can change their degree of diversification either by divesting or acquiring assets, or by redirecting their activities into new business segments. And a firm’s portfolio of activities can shift over time due to divergent growth rates in the existing business segments.
Firm structure in banking and finance: is broader better?
Various arguments have been made in favor of diversification as a value-enhancing strategy for financial services firms.1 The most important are so-called “synergies” resulting from cost and revenue economies of scope. Other potential benefits are lowertax burdens as a result of tax-efficient intra-firm transactions and more efficient internal, as compared to external, capital markets resulting from a better coordination across highly specialized activity lines, better monitoring and control of capital expenditures, and sharing of managerial best-practices. Reduced bankruptcy risk due to less than perfectly correlated revenue streams across functional segments may likewise result in improved debt ratings, higher debt capacity, lower taxes and lower weighted average cost of capital (WACC) of diversified financial firms resulting in higher share prices as compared to more specialized financial firms.
Separately, too-big-to-fail backstops provided by the public at zero or below-market cost through the central bank or public guarantee agency may support the creditworthiness of the banking unit of a financial conglomerate, and by extension the entire financial firm. Depending on the backstop beneficiaries, extending from retail depositors to subordinated debtholders and even shareholders, explicit or implicit public guarantees can benefit a financial firm’s WACC and mask the impact of scale and scope economies and diseconomies, creating serious competitive distortions in the process.
Arguments against diversification in financial services firms include a cross-subsidization among business lines, which may result in inefficient capital allocations and reduced performance incentives in the profitable business segments. Diversification may also lead to overinvestment in low-NPV projects due to excess free cash flow and unused borrowing capacity, as well as non-materiality of individual capital allocation errors in relationto the firms’ overall market value. In financial conglomerates, conflicts of interest among clients and activity-areas may create incremental exposure to reputation risk resulting in higher debt costs and lower share prices.
Firm structure in banking and finance: is broader better?
1 For a detailed review of arguments for and against diversification in financial services firms, see Walter (2004), Chapter 3.
Whether the benefits of diversification and financial conglomeration outweigh specialization is a key issue in defining the strategies of financial intermediaries and the evolving architecture of national and global financial systems. There already exists a large body of literature on the valuation effects of corporate diversification in non-financial firms.2 However, the literature on the valuation effects of diversification in financial intermediaries has been much more limited, but has grown substantially in recent years.
In section 2, we summarize the findings of the existing literature on the valuation effects of diversification in financial intermediaries. In section 3, we extend the empirical analysis in Schmid and Walter (2009) by another eight years to investigate the value of diversification in a consistent empirical setup based on a data panel covering nearly 30 years. The empirical findings confirm a conglomerate discount in financial services firms for the sample period 1985–2012. However, when compared to previous studies by Laeven and Levine (2007) and in particular Schmid and Walter (2009), the average discount, while still statistically and economically significant, is somewhat reduced. We show that this reduction in the average discount appears to result from increased diversification benefits in the crisis years 2006–08 when the diversification discount turned insignificant. Hence, as could be expected, the risk-reducing effect of diversification seems to be particularly valuable during a crisis.
2. Theoretical researchThe focus of this article is on empirical research. Nevertheless, we begin by briefly summarizing the findings of the theoretical literature on the value implications of functional diversification in financial intermediaries.
Boot and Schmeits (2000) show that, in a competitive environment with modest returns to capital, diversification is valuable as it helps to protect these returns and reduces therisk-taking incentives resulting from limited liability. They show that the introduction of
2 See Martin and Sayrak (2003) and Erdorf et al. (2013) for literature reviews.
Firm structure in banking and finance: is broader better?

internal cost-of-capital allocation schemes creates internal market discipline that complements the weak external market of conglomerate firms.
They conclude that, under certain circumstances diversification may very well create value and argue that this is particularly likely in the banking industry.Wagner (2010) develops a model that shows that even though diversification reduces financial institutions’ individual probability of failure, by exposing them to the same risks, and hence making them more similar to each other, it increases the risk of systemic crises. When such crises induce costs exceeding those emanating from individual bank failures, efficient diversification encompasses a trade-off between lower overall probabilities of banking failures and a higher probability of systemic failures. These arguments can be extended beyond diversification and also apply to interbank liquidity insurance and bank mergers. The two main conclusions are that full diversification is not optimal and that capital requirements for banks with more diversified portfolios should be higher rather than lower.3
Ibragimov et al. (2011) develop a model in which negative externalities arise because diversification decisions at financial intermediaries may be optimal for the individual firms by reducing the risk of individual failure, but at the same time they may be suboptimal for society as a whole due to a higher risk of systemic failure. The results depend on the distributions of risks that the financial intermediaries assume. When these risks are thin-tailed, diversification is optimal for both the individual firms and society. When these risks are moderately heavy-tailed, diversification is optimal for the individual firms but suboptimalfor society.
Gatzert and Schmeiser (2011) provide a conceptual framework in which the conglomerate discount of financial intermediaries is quantified by employing an option-based approach, with potential diversification benefits being calculated using the tail value-at-risk and shortfall probability. They show that under competitive conditions, the potential benefits fromdiversification are small.
3 Acharya and Yorulmazer (2007, 2008) show that banks may choose to increase the likelihood of joint failures to induce regulators to bail them out.
Firm structure in banking and finance: is broader better?
Freixas et al. (2007) investigate in a theoretical model framework the risk-taking incentives of financial conglomerates that combine banking and non-banking units. They show that theconglomerate’s liability structure determines the level of market discipline faced by the firm, which in turn determines the risktaking incentives of the conglomerate. Their paper shows that conglomerates extend the reach of the deposit insurance safety net to their non-banking divisions, resulting in higher risk-taking, which in turn may outweigh any diversification benefits.4 Their model also makes predictions about the relative valuation of financial conglomerates versus stand-alone firms — because financial conglomerates have less access to the deposit insurance fund, they should trade at a discount relative to stand-alonefinancial institutions.net to their non-banking divisions, resulting in higher risk-taking, which in turn may outweigh any diversification benefits.4 Their model also makes predictions about the relative valuation of financial conglomerates versus stand-alone firms — because financial conglomerates have less access to the deposit insurance fund, they should trade at a discount relative to stand-alone financial institutions.
2.1 Empirical research on U.S. dataThe U.S. has been the focus of most empirical studies because of its large market size, the number and variety of financial institutions, a single currency and a single accounting andregulatory regime.
One way to investigate the value of functional diversification of banks is to perform an event study analysis of merger announcements distinguishing between diversifying and focusing mergers. In fact, earlier empirical research was mainly interested in analyzing the potential cost savings and revenue gains from bank mergers. For example, Houston and Ryngaert (1994) show that the overall gains from 153 bank mergers announced between 1985 and 1991 are positive but statistically insignificant. Moreover, they find that greater operations overlap is associated with higher merger gains.
Houston et al. (1999) find that in-market (i.e., concentrating) mergers tend to create value upon announcement. Specifically, they find that target firms gain and acquirers do not lose
4 In contrast, they show that in financial holding company conglomerates capital arbitrage may increase market discipline and raise welfare.
Firm structure in banking and finance: is broader better?
in in-market mergers. They argue that such in-market merger transactions are expected to cut costs faster and more dramatically than market-extending mergers.
DeLong (2001) finds that the markets react positively to bank mergers that focus activities (and geography) while diversifying mergers do not create value. In contrast to most other studies, DeLong (2001) uses cluster analysis of stock returns to determine the activity focus of banks. Bidders in diversifying mergers destroy value on a statistically significant scale, bidders in non-diversifying mergers do not destroy any value, and targets earn approximately the same returns in both groups.Stiroh (2004a) analyzes the potential diversification benefits resulting from banks shifting from interest income to fee income, trading revenue, and other types of non-interest income. The study finds little evidence of diversification benefits resulting from a shift toward non-interest income. Most importantly, a greater reliance on non-interest income, and in particular on trading revenue, is associated with higher risk and lower risk adjusted profits.
DeYoung and Roland (2001) investigate the relationship between bank profitability, volatility, and the share of different revenue sources resulting from different activities of large commercial banks. Consistent with Stiroh (2004a), the authors find that alarger fraction of fee-based revenue increases the volatility of both bank revenues and bank earnings.
Stiroh (2004b) investigates the relationship between activity diversification and risk-adjusted performance of small community banks in the U.S. The study distinguishes between diversification of broad activity classes, such as shifting between interestgenerating activities, fiduciary operations and, trading revenue and diversification within these broad activity classes. The results show that diversification across broad activity classes is not associated with benefits, but that diversification within the lending and non-interest activities is associated with a higher risk adjusted performance.
A further stream of research investigates the stock market reaction to announcements of regulatory changes affecting banks’ possibilities to diversify. This work suggests that themarket reacted favorably to the announcement of the passage of the U.S. GLB legislation in 1999, which opened the way for integrated multi-functional financial intermediaries.
Firm structure in banking and finance: is broader better?
For example, Lown et al. (2000) find positive returns associated with both commercial and investment banks’ stocks upon announcement by President Clinton on 22 October 1999 that the passage of GLB was imminent. Consistent with this work, Yu (2003) reportspositive returns to the announcement of GLB for large securities firms, large insurance companies, and bank holding companies already active in some securities businesses i.e., firms with so-called “Section 20 subsidiaries” allowing limited investment banking activities. The market seems to have expected gains from functional diversification of financial services firms, or at least increased opportunities to diversify and possibly benefit from cross-product synergies, extensions of “too-big-to-fail” guarantees, or other facets of diversification.
Stiroh and Rumble (2006) use a sample of roughly 1,800 U.S. FHCs from 1997 to 2002 to investigate whether U.S. financial holding companies benefit from diversification into non-interest income activities. The results based on a panel regression framework with firm fixed effects — which allows for quantifying the impact of changes in diversification on risk-adjusted profits — suggest no value impact of diversification, but instead show a negative impact of the ratio of non-interest income to net operation income on risk-adjusted profits of FHCs.
Schmid and Walter (2009) investigate the valuation effects of diversification across the entire range of financial intermediation functions — commercial banking, investment banking, insurance, asset management, and financial infrastructure services (clearance, settlement, payments, custody, etc.) — in a sample of roughly 4,000 U.S. bank-years on 660 banks from 1985 to 2004. The results from fixed effects regressions show a substantial and persistent conglomerate discount of between 9% and 15% among financial intermediaries. Financial intermediaries choose to diversify for unknown reasons. Hence, diversification is an endogenous choice variable [Campa and Kedia (2002)]. In addressing these issues econometrically, Schmid and Walter (2009) confirm the existence of a conglomerate discount and suggest that it is diversification that causes the discount, notthe fact that troubled firms diversify into other more promising activity areas. The study also investigates whether the conglomerate discount depends on the firms’ main activity-area or on the specific financial activity-areas that are combined within the conglomerate.
Firm structure in banking and finance: is broader better?
It finds a significant conglomerate discount in all three main activity-areas (credit intermediation, securities and insurance) but no conglomerate discount associated with investment banking. Moreover, there is little difference in the conglomerate discount across different combinations of financial activity-areas with two notable exceptions: combinations of commercial banking and insurance segments and combinationsbetween commercial banking and investment banking segments are associated with a significant premium.
2.2 Empirical research on international dataLaeven and Levine (2007) use a sample of 836 banks from 43 countries over the time period 1998–2002 to investigate whether banks that engage in multiple activities are traded at lower prices than specialized banks. As a measure of bank value, the authors use a modified version of the Lang and Stulz (1994) “chop-shop” Tobin’s Q (market value to book value ratio), which controls for general valuation differences across financial services industries. They differentiate focused from diversified banks by their interest income versus non-interest income and by loans versus other earning assets. While this is arguably a crude measure, it may also help to overcome the problem of using self-reported segment data. The results show a statistically significant and economically large conglomerate discount which survives controlling for the endogenous self-selection of banks and a battery of other robustness tests.
Baele et al. (2007) analyze whether there is a diversification discount in a sample of 255 banks from 17 European countries over the time period 1989–2004. Bank value is measured by an adjusted Tobin’s Q ratio, and the authors find a positiverelationship between bank value and the degree of functional diversification, arguing that the stock market seems to anticipate higher bank profits resulting from diversification. The authorsalso investigate the relationship between bank diversification and both idiosyncratic and systematic bank risk. Their results suggest a nonlinear relationship between diversification and idiosyncratic risk. Most of the banks in the sample are able to reduce idiosyncratic risk by diversifying. Consistent with Stiroh (2006), the study finds that a higher share of non-interest income in total income is associated with higher systematic risk. This has conflicting implications for different stakeholders – large shareholders or bank managers
Firm structure in banking and finance: is broader better?
are mainly interested in idiosyncratic risks, while diversified investors mainly care aboutsystematic risk.
Van Lelyveld and Knot (2009) investigate whether diversification activities combining banking and insurance create or destroy shareholder value in a sample 135 financial firms in the European Union. Specifically, they compare the excess value measure proposed by Berger and Ofek (1995) across 45 focused banks, 45 focused insurance companies, and 45 diversified financial intermediaries active in both commercial banking and insurance provision. However, due to some filters in the data management process and data availability only 25 firms (with 132 observations over the time period 1990–2005) end up in their multivariate tests. Their results suggest no consistently significant conglomerate discount resulting from combinations of banking and insurance activities, which is consistent with the results in Schmid and Walter (2009).5 However, they show that there is quite some variation in cross-section analysis and that a diversification discount may apply depending on firm size, complexity and risk.
Elsas et al. (2010) investigate the relationship between revenue diversification and bank value in a sample of 3,348 bank-year observations on 380 listed banks from nine countries during 1996–2008. The nine countries covered by the study are Australia, Canada, France, Germany, Italy, Spain, Switzerland, the U.K. and the U.S. and the sample covers only large banks with total assets exceeding U.S.$1b in at least one sample year. The authors find a positive relationship between revenue diversification and bank profitability resulting from higher margins from non-interest activities and lower cost-to-income ratios. This higher profitability also seems to translate into higher market values of diversified banks.
Mercieca et al. (2007) investigate whether diversification of small European banks into non-interest income activities improves performance. Their sample includes 755 small banks, i.e., banks with an asset size below €450m as of year-end 2000, from the 15 European Union member countries before the 2004 E.U. enlargement over the period 1997–2003. As the sample includes both listed and unlisted banks, bank performance
5 This finding is also consistent with Cubo-Ottone and Murgia (2000), who find positive and significant merger announcement returns associated with European banks diversifying into the insurance industry.
Firm structure in banking and finance: is broader better?

is measured based on accounting and not market measures (ROA, ROE). The authors find no evidence of diversification benefits within and across business lines and a negative valuation effect associated with higher shares of non-interest income in total income. They conclude that — in an increasingly competitive environment due, for example, to the Financial Sector Action Plan, the Takeover Directive of the E.U. and Basel II — small European banks diversify into activity areas where they lack expertise and experience,resulting in value losses.
Berger et al. (2010) use a sample of 464 bank-year observations on 88 Chinese banks over the period 1996–2006 to investigate whether there is a diversification discount in Chinese financial firms. The results suggest that four different dimensions of diversification — loans, deposits, assets and geography — are all associated with reduced profits, higher costs and a significant valuation discount. Moreover, they find that foreign ownershipand/or conglomerate affiliation is associated with a smaller diversification discount in Chinese banks. The authors argue that these findings are consistent with better monitoring and access to more and better networks, and partnerships help Chinese banks to overcome inefficiencies associated with diversification of bank activities.
2.3 Bank diversification and internal capital marketsInternal capital markets within financial conglomerates can either serve shareholders’ interests by mitigating external capital constraints if run efficiently, or destroy company value if resulting in an inefficient cross-subsidization among business lines and as a consequence reduced performance incentives in the profitable business segments. Available evidence on nonfinancial conglomerates suggests that internal capital marketsresult in inefficient cross-subsidization and, on average, destroy shareholder value [e.g., Scharfstein (1998), Rajan (2000)].
Houston et al. (1997) investigate the existence of internal capital markets in bank- holding companies by analyzing the cash flow sensitivity of loan growth, and the correlation between different subsidiaries’ loan growth, within a bank holding company. They find that the loan growth of subsidiaries is more sensitive to changes in the holding company’s cash flows and capital position than the subsidiary’s own cash flow and capital
Firm structure in banking and finance: is broader better?

position. They also find that loan growth is negatively correlated across the subsidiaries within a bank holding company. In short, their findings confirm the existence of internal capital markets in bank holding companies.
Campello (2002) investigates whether internal capital markets help banks alleviate the impact of external financial constraints on investments, and whether they promote investment efficiency. He compares the responses of small subsidiary and independentbanks to monetary policy changes.6 The results show that internal capital markets in financial conglomerates relax credit constraints faced by stand-alone banks and lessen the impact of a tight monetary policy on bank lending activity. The study also finds thatfrictions between conglomerate headquarters and external capital markets result in a less efficient investment allocation process in small bank holding companies but not in large ones.
Klein and Saidenberg (2010) find evidence consistent with a conglomerate discount in bank holding companies. Specifically, bank holding companies with more subsidiaries are found to be less profitable and show lower Tobin’s Q ratios than bank holding companies with fewer subsidiaries. The authors also attempt to separate the effects of organizational structure from those of diversification, and find that neglecting the effect of organizational structure results in an inflated conglomerate discount. Finally, they show that the benefits of an internal capital market can be realized best within firms with fewer independentlychartered sub-units due to significant costs associated with managing complex, multi-unit organizations.
3. New empirical analysisIn this section, we extend the sample used in our earlier work — Schmid and Walter (2009) — by eight additional years (2005–12), resulting in a 28-year sample period extending from 1985 to 2012. The sample consists of all financial firms from 1985 to 2012, with data reported on both the Compustat segment and industrial annual data files and total assets
6 The reason for focusing on small rather than large banks is that large banks can offset Fed policies on the margin because of their better access to non-reservable forms of deposits at relatively low costs [e.g., see Kashyap and Stein (2000)].
Firm structure in banking and finance: is broader better?
of at least U.S.$100m, and we apply the same filters as in our earlier study. The datasetcovers the broadly-defined U.S. financial services sector, including commercial banks and bank holding companies, insurance companies, asset managers and broker-dealers, but excludes investment companies as well as foreign firms listed as American Depository Receipts (ADRs).
To examine whether diversification increases or decreases firm value, we use the excess value measure proposed by Berger and Ofek (1995) and used in many other studies, including ours. This excess value measure compares a firm’s value to its imputedvalue if its segments were operating as standalone entities. Each segment of a diversified firm is valued based on the median sales (assets) multipliers for single-segment firms in that industry.7 The imputed firm value for each segment is then calculated by multiplying the segment’s sales (assets) by the median ratio of the market value to sales (assets) for single-segment firms in the s ame industry. The industry median ratios are based on the narrowest North American Industry Classification System (NAICS) grouping that includes at least five single-segment firms with complete data and total assets of at least U.S.$100m. The imputed value of the complete firm is calculated as the sum of the imputed segment values. The imputed value provides an estimate of the firm if all of its segments were operated as stand-alone entities, assuming that in this case the segment’s valuation would correspond to that of the median focused firm in the same industry. Excess value is then calculated as the log of the ratio of a firm’s value to its imputed value. A negative excess value indicates that a firm trades at a discount and a positive excess value implies that the firm trades at a premium as compared to the median focused firm in the same industries.
We use alternative measures of diversification. The first is a dummy variable, which is equal to one if a firm reports more than one segment with different NAICS industry codes assigned in Compustat’s Segments data file. Second, we use the number of segments reported by Compustat. Finally, we use a sales- and asset-based Herfindahl-
7 Compustat defines sales for financial companies as total current operating revenue plus net pretax profit or loss on securities sold or redeemed minus non-recurring income.
Firm structure in banking and finance: is broader better?

Hirschman index (HHI) that is computed as the sum of the squares of each segment’s sales (assets) as a proportion of the square of total sales (assets) for the firm.
Table 1 provides an overview of the number of sample firms for each calendar year in our sample, along with the percentage of focused and diversified firms in each year. The percentage of diversified firms in our sample decreases steadily from 53.2% in 1985 to 27.3% in 1996. However, between 1997 and 1998 there is a large jump in the percentage of diversified firms from 30.6% to 45.3%.8 From 1998 to 2012, there is no clear trend in diversification with the percentage of diversified years fluctuating between 43.3% (2010) and 58.5% (2005).
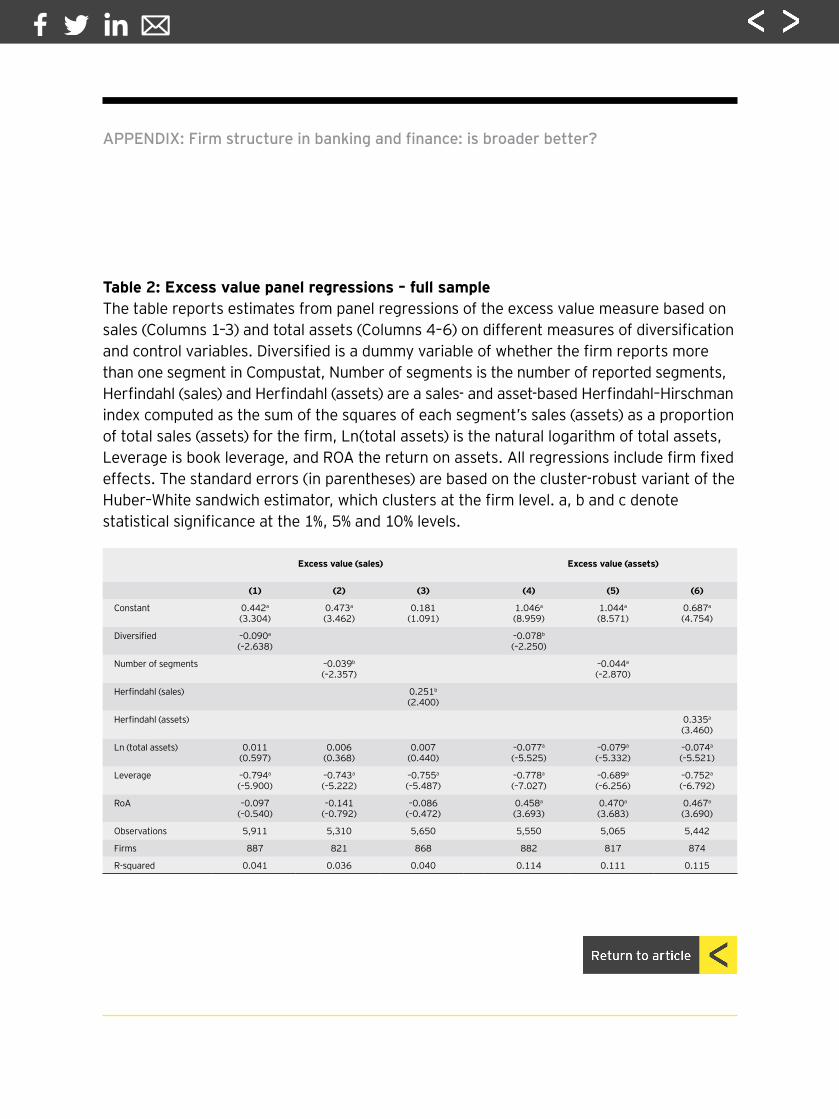
Table 2 reports the results from panel regressions of the excess value measure based on sales (Columns 1–3) and assets (Columns 4–6) on alternative measures of diversification and controls. As noted, the regressions specifications include 28 sample years. All regressions include firm fixed effects to control for unobserved firm characteristics that are constant over time. To account for within-correlation between observations on the same firm, the standard errors are clustered at the firm level. Consistent with our earlier findings in Schmid and Walter (2009), the results indicate a significant diversification discount in all six regression specifications. Based on the dummy variables in Columns 1 and 4, diversified firms trade at a discount of between 7.8% and 9.0% as compared to a portfolio of focused firms. This diversification discount is still highly significant but somewhat smaller than the discount reported for the years 1985–2004.
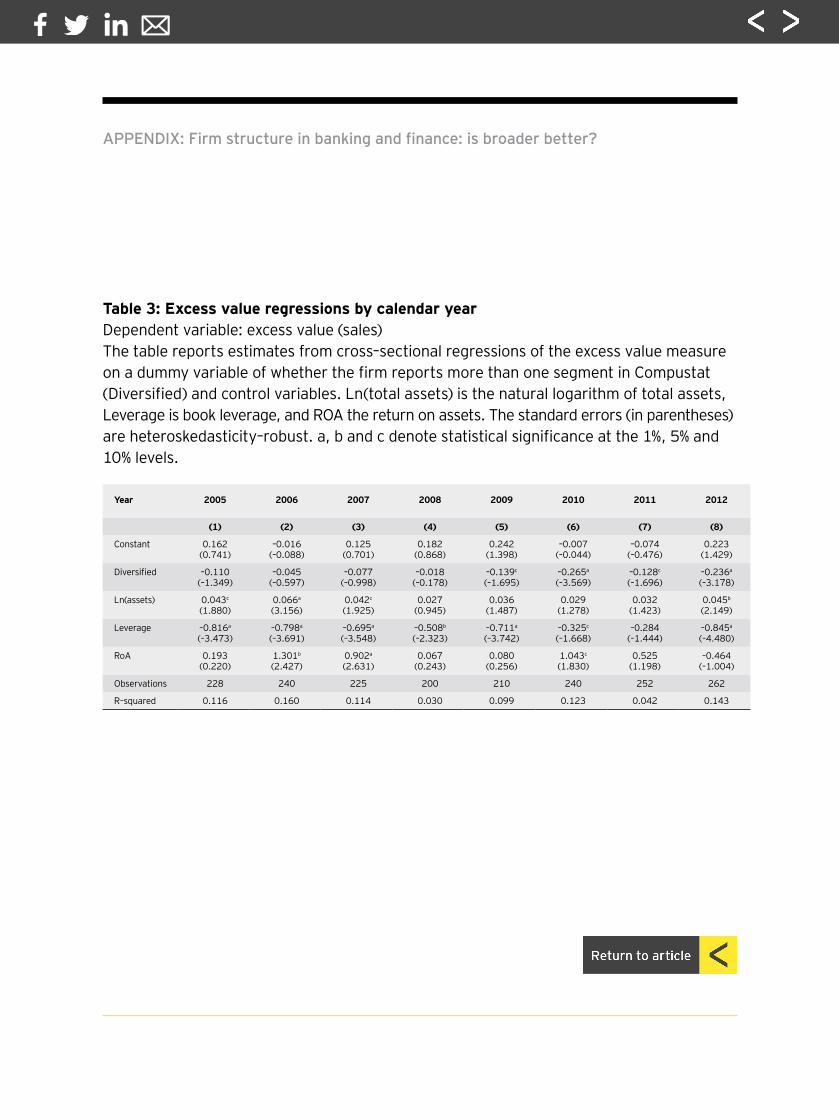
In Table 3, we re-estimate the regression specification in Column 1 of Table 2 for each sample year from 2005 to 2012 separately to investigate whether the value (or cost) of diversification changed over the more recent sample years. The results show that the diversification discount is statistically and economically significant in the years 2009–12 but insignificant in the years 2005–08. While the coefficient on the Diversified dummy
8 In 1998, SFAS 131 superseded SFAS 14 in the regulation of segment reporting and SIC was replaced by NAICS.14 One reason for this regulatory change was a perceived underreporting of segments. Consistently, Berger and Hann (2003) show that the introduction of SFAS 131 has resulted in firms reporting a greater number of segments.
Firm structure in banking and finance: is broader better?
is still sizable in 2005, indicating a diversification discount of 11.0%, the estimate of the discount is much smaller and insignificant at the onset and throughout the recent financial crisis.
This finding suggests that, as expected, the risk-reducing effect of diversification is particularly valuable during the crisis years and outweighs the negative effects of diversification. Our results are consistent with Kuppuswamy and Villalonga (2012), showing that the value of diversified non-financial firms relative to focused firms increased in the recent financial crisis due to a debt coinsurance feature of conglomerates and more efficient internal capital markets.9
To summarize, the new empirical results reported here confirm the finding of a conglomerate discount in financial services firms over an extended time period covering almost 30 years. However, the average discount reported is somewhat smaller than in previous studies [e.g., Laeven and Levine (2007), Schmid and Walter (2009)]. This reduction in the average discount seems to emanate from increased diversification benefits in the crisis years when the diversification discount turned insignificant. Hence, similar to effective risk management in financial firms, corporate diversification may provide benefits in a crisis environment but at a cost in a good market environment [e.g., Aebi et al. (2012), Ellul and Yerramilli (2013)].
4. ConclusionScope and scale lie at the heart of the debate on the static and dynamic efficiency of the financial architecture. Management of banking and financial services firms are mandated to take both issues into consideration, when considering strategic positioning of their enterprises in the competitive playing field of today’s financial markets. Much of the research on scale economies in banking suggests that scale effects on firm-wide costfunctions dissipates at surprisingly small-size levels. However, scale benefits differ widely by function — global custody is heavily scale-driven while in corporate advisory services scale economies are virtually immaterial, for example. Much less research has focused on
9 It is possible that subsidies in the form of implied public guarantees are responsible for part of the reduction in the discount between the pre-crisis and crisis periods, although we control for firm size in the regressions. However, a linear size control may not be sufficient to pick up this effect.
Firm structure in banking and finance: is broader better?

cost and revenue economies of scope, in part because the natural source of datasets (with large numbers and types of financial firms within a single market with one currency and one tax and regulatory environment), did not exist for a country, such as the U.S. because it had a history of separation between banking and non-banking financial intermediation, from 1933 to 1999. The fact that empirical studies were hindered by the need to adjust for the many other factors besides scope that affect firm value metrics also played a part in the lack of literature.
In this paper, we provide an up-to-date survey of scope-related theoretical and empirical research, which offer a disparate array of results distinguished by the absence of consistently definitive conclusions. The exception is a predominant finding of a conglomerate discount in the financial services sector in most empirical studies — comparable to the findings in the nonfinancial sector — as well as the finding of greater stability associated with a broader scope of activities. This suggests that scope-effects generally favor debt-holders (and taxpayers if systemic backstops exist) relative to shareholders. This seems corroborated in our finding of a lower conglomerate discountduring the recent period of financial turbulence relative to precrisis conditions.
Firm structure in banking and finance: is broader better?

ReferencesAcharya, V., and T. Yorulmazer, 2007, “Too many to fail – An analysis of time-inconsistency in bank closure policies,” Journal of Financial Intermediation 16, 1–31Acharya, V., and T. Yorulmazer, 2008, “Cash-in-the-market pricing and optimal resolution of bank failures,” Review of Financial Studies 21, 2705–2742Aebi, V., G. Sabato, and M. Schmid, 2012, “Risk management, corporate governance, and bank performance in the financial crisis,” Journal of Banking and Finance 36, 3213–3226Baele, L., O. De Jonghe, and R. Vander Vennet, 2007, “Does the stock market value bank diversification?” Journal of Banking and Finance 31, 1999–2023Berger, A. N., I. Hasan, and M. Zhou, 2010, “The effects of focus versus diversification on bank performance: evidence from Chinese banks,” Journal of Banking and Finance 34, 1417–1435Berger, P. G., and R. Hann, 2003, “The impact of SFAS No. 131 on information and monitoring,” Journal of Accounting Research 41, 163–223Boot, A. W. A., and A. Schmeits, 2000, “Market discipline and incentive problems in conglomerate firms with applications to banking,” Journal of Financial Intermediation 9, 240–273Campello, M., 2002, “Internal capital markets in financial conglomerates: evidence from small bank responses to monetary policy,” Journal of Finance 57, 2773–2805Campa, J. M., and S. Kedia, 2002, “Explaining the diversification discount,” Journal of Finance 57, 1731–1762Cubo-Ottone, A., and M. Murgia, 2000, “Mergers and shareholder wealth in European banking,” Journal of Banking and Finance 24, 831–859DeLong, G., 2001, “Stockholder gains from focusing versus diversifying bank mergers,” Journal of Financial Economics 59, 221–252DeYoung, R., and K. P. Roland, 2001, “Product mix and earnings volatility at commercial banks: evidence from a degree of total leverage model,” Journal of Financial Intermediation 10, 54–84Ellul, A., and V. Yerramilli, 2013, “Stronger risk controls, lower risk: evidence from U.S. bank holding companies,” Journal of Finance 68, 1757–1803Elsas, R., A. Hackethal, and M. Holzhaeuser, 2010, “The anatomy of bank diversification,” Journal of Banking and Finance 34, 1274–1287Erdorf, S., T. Hartmann-Wendels, N. Heinrichs, and M. Matz, 2013, “Corporate diversification and firm value: a survey of recent literature,” Financial Markets and Portfolio Management 27, 187–215Freixas, X., G. Loranth, and A. D. Morrison, 2007, “Regulating financial conglomerates,” Journal of Financial Intermediation 16, 479–514Gatzert, N., and H. Schmeiser, 2011, “On the risk situation of financial conglomerates: does diversification matter?” Financial Markets and Portfolio Management 25, 3–26Houston, J., C. James, and D. Marcus, 1997, “Capital markets frictions and the role of internal capital markets in banking,” Journal of Financial Economics 46, 135–164Houston, J., C. James, and M. Ryngaert, 2001, “Where do merger gains come from? Bank mergers from the perspective of insiders and outsiders,” Journal of Financial Economics 60, 285–331Houston, J., and M. Ryngaert, 1994, “The overall gains from large bank mergers,” Journal of Banking and Finance 18, 1155–1176Ibragimov, R., D. Jaffee, and J. Walden, 2011, “Diversification disasters,” Journal of Financial Economics 99, 333–348
Firm structure in banking and finance: is broader better?

Kashyap, A., and J. C. Stein, 2000, “What do a million observations on banks say about the transmission of monetary policy?” American Economic Review 90, 407–428Klein, P., and M. Saidenberg, 2010, “Organizational structure and the diversification discount: evidence from commercial banking,” Journal of Industrial Economics 58, 127–155Kuppuswamy, V., and B. Villalonga, 2012, “Does diversification create value in the presence of external financing constraints? Evidence from the 2007–2009 financial crisis,” Working Paper, New York UniversityLang, L. H. P., and R. M. Stulz, 1994, “Tobin’s Q, corporate diversification, and firm performance,” Journal of Political Economy 102, 1248–1280Laeven, L., R. Levine, 2007, “Is there a diversification discount in financial conglomerates?” Journal of Financial Economics 85, 331–367Lown, C. S., C. L. Osler, P. E. Strahan, and A. Sufi, 2000, “The changing landscape of the financial services industry: what lies ahead?” Federal Reserve Bank of New York Economic Policy Review 6, 39–55Martin, J. D., and A. Sayrak, 2003, “Corporate diversification and shareholder value: A survey of recent literature,” Journal of Corporate Finance 9, 37–57Mercieca, S., K. Schaeck, and S. Wolfe, 2007, “Small European banks: benefits from diversification?” Journal of Banking and Finance 31, 1975–1998Rajan, R., H. Servaes, and L. Zingales, 2000, “The cost of diversity: the diversification discount and inefficient investment,” Journal of Finance 55, 35–80Scharfstein, D., 1998, “The dark side of internal capital markets II: evidence from diversified conglomerates,” NBER Working Paper No. 6352Schmid, M., and I. Walter, 2009, “Do financial conglomerates create or destroyeconomic value?” Journal of Financial Intermediation 18, 193–216Stiroh, K. J., 2004a, “Diversification in banking: is noninterest income theanswer?” Journal of Money, Credit, and Banking 36, 853–882Stiroh, K. J., 2004b, “Do community banks benefit from diversification?” Journal of Financial Services Research 25, 135–160Stiroh, K. J., 2006, “A portfolio view of banking with interest and noninterest activities,” Journal of Money, Credit, and Banking 38, 1351–1361Stiroh, K. J., and A. Rumble, 2006, “The dark side of diversification: the case of US financial holding companies,” Journal of Banking and Finance 30, 2131–2161van Lelyveld, I., and K. Knot, 2009, Do financial conglomerates create or destroy value? Evidence from the EU, Journal of Banking and Finance 33, 2312–2321Wagner, W., 2010, “Diversification at financial institutions and systemic crises,” Journal of Financial Intermediation 19, 373–386Walter, I., 2004, Mergers and acquisitions in banking and finance, Oxford University Press, New YorkYu, L., 2003, “On the wealth and risk effects of the Glass-Steagall overhaul: evidence from the stock market,” Working Paper, New York University
Firm structure in banking and finance: is broader better?

AppendixFirm structure in banking and finance: is broader better?
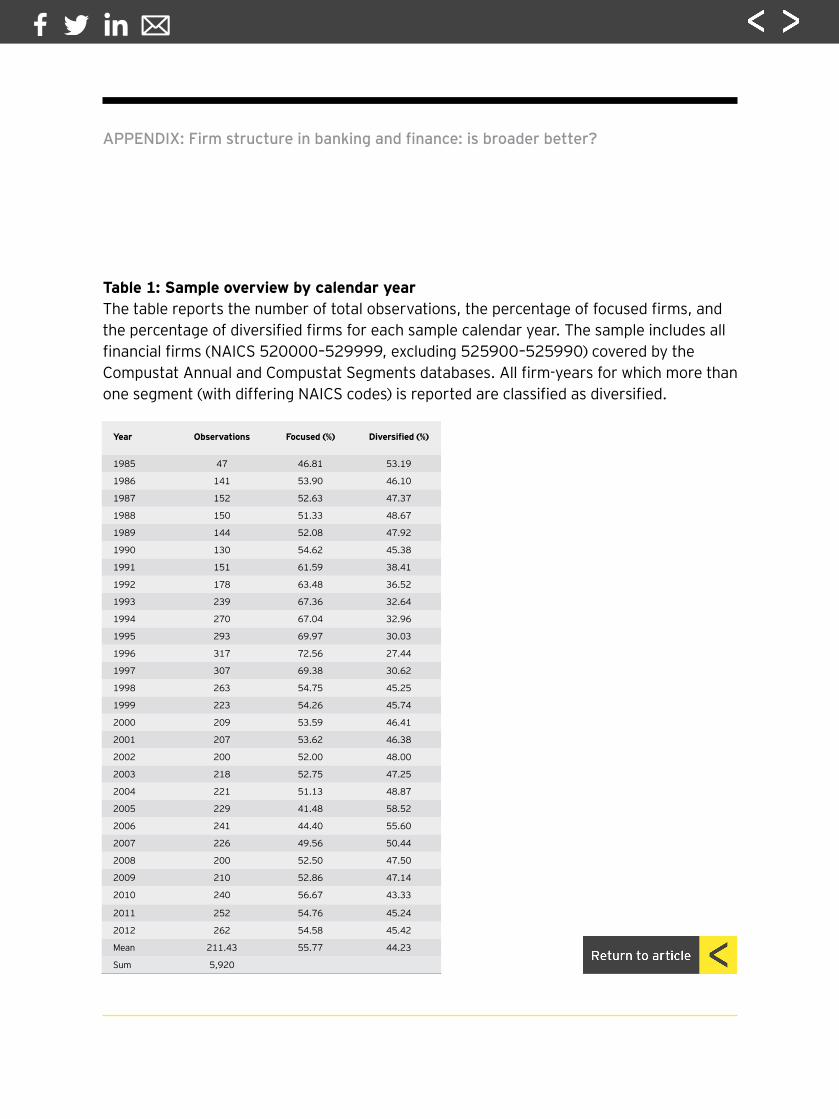
Table 1: Sample overview by calendar yearThe table reports the number of total observations, the percentage of focused firms, and the percentage of diversified firms for each sample calendar year. The sample includes all financial firms (NAICS 520000–529999, excluding 525900–525990) covered by the Compustat Annual and Compustat Segments databases. All firm-years for which more than one segment (with differing NAICS codes) is reported are classified as diversified.
Year Observations Focused (%) Diversified (%)
1985 47 46.81 53.19
1986 141 53.90 46.10
1987 152 52.63 47.37
1988 150 51.33 48.67
1989 144 52.08 47.92
1990 130 54.62 45.38
1991 151 61.59 38.41
1992 178 63.48 36.52
1993 239 67.36 32.64
1994 270 67.04 32.96
1995 293 69.97 30.03
1996 317 72.56 27.44
1997 307 69.38 30.62
1998 263 54.75 45.25
1999 223 54.26 45.74
2000 209 53.59 46.41
2001 207 53.62 46.38
2002 200 52.00 48.00
2003 218 52.75 47.25
2004 221 51.13 48.87
2005 229 41.48 58.52
2006 241 44.40 55.60
2007 226 49.56 50.44
2008 200 52.50 47.50
2009 210 52.86 47.14
2010 240 56.67 43.33
2011 252 54.76 45.24
2012 262 54.58 45.42
Mean 211.43 55.77 44.23
Sum 5,920
APPENDIX: Firm structure in banking and finance: is broader better?
Excess value (sales) Excess value (assets)
(1) (2) (3) (4) (5) (6)
Constant 0.442a (3.304)
0.473a (3.462)
0.181 (1.091)
1.046a (8.959)
1.044a (8.571)
0.687a (4.754)
Diversified –0.090a (–2.638)
–0.078b (–2.250)
Number of segments –0.039b (–2.357)
–0.044a (–2.870)
Herfindahl (sales) 0.251b (2.400)
Herfindahl (assets) 0.335a (3.460)
Ln (total assets) 0.011 (0.597)
0.006 (0.368)
0.007 (0.440)
–0.077a (–5.525)
–0.079a (–5.332)
–0.074a (–5.521)
Leverage –0.794a (–5.900)
–0.743a (–5.222)
–0.755a
(–5.487)–0.778a (–7.027)
–0.689a (–6.256)
–0.752a (–6.792)
RoA –0.097 (–0.540)
–0.141 (–0.792)
–0.086 (–0.472)
0.458a (3.693)
0.470a (3.683)
0.467a (3.690)
Observations 5,911 5,310 5,650 5,550 5,065 5,442
Firms 887 821 868 882 817 874
R-squared 0.041 0.036 0.040 0.114 0.111 0.115
Table 2: Excess value panel regressions – full sampleThe table reports estimates from panel regressions of the excess value measure based on sales (Columns 1–3) and total assets (Columns 4–6) on different measures of diversification and control variables. Diversified is a dummy variable of whether the firm reports more than one segment in Compustat, Number of segments is the number of reported segments, Herfindahl (sales) and Herfindahl (assets) are a sales- and asset-based Herfindahl–Hirschman index computed as the sum of the squares of each segment’s sales (assets) as a proportion of total sales (assets) for the firm, Ln(total assets) is the natural logarithm of total assets, Leverage is book leverage, and ROA the return on assets. All regressions include firm fixed effects. The standard errors (in parentheses) are based on the cluster-robust variant of the Huber–White sandwich estimator, which clusters at the firm level. a, b and c denote statistical significance at the 1%, 5% and 10% levels.
APPENDIX: Firm structure in banking and finance: is broader better?
Year 2005 2006 2007 2008 2009 2010 2011 2012
(1) (2) (3) (4) (5) (6) (7) (8)
Constant 0.162 (0.741)
–0.016 (–0.088)
0.125 (0.701)
0.182 (0.868)
0.242 (1.398)
–0.007 (–0.044)
–0.074 (–0.476)
0.223 (1.429)
Diversified –0.110 (–1.349)
–0.045 (–0.597)
–0.077 (–0.998)
–0.018 (–0.178)
–0.139c (–1.695)
–0.265a (–3.569)
–0.128c (–1.696)
–0.236a (–3.178)
Ln(assets) 0.043c (1.880)
0.066a (3.156)
0.042c (1.925)
0.027 (0.945)
0.036 (1.487)
0.029 (1.278)
0.032 (1.423)
0.045b (2.149)
Leverage –0.816a (–3.473)
–0.798a (–3.691)
–0.695a (–3.548)
–0.508b (–2.323)
–0.711a (–3.742)
–0.325c (–1.668)
–0.284 (–1.444)
–0.845a (–4.480)
RoA 0.193 (0.220)
1.301b (2.427)
0.902a (2.631)
0.067 (0.243)
0.080 (0.256)
1.043c (1.830)
0.525 (1.198)
–0.464 (–1.004)
Observations 228 240 225 200 210 240 252 262
R–squared 0.116 0.160 0.114 0.030 0.099 0.123 0.042 0.143
Table 3: Excess value regressions by calendar yearDependent variable: excess value (sales) The table reports estimates from cross–sectional regressions of the excess value measure on a dummy variable of whether the firm reports more than one segment in Compustat (Diversified) and control variables. Ln(total assets) is the natural logarithm of total assets, Leverage is book leverage, and ROA the return on assets. The standard errors (in parentheses) are heteroskedasticity–robust. a, b and c denote statistical significance at the 1%, 5% and 10% levels.
APPENDIX: Firm structure in banking and finance: is broader better?

About EYEY is a global leader in assurance, tax, transaction and advisory services. The insights and quality services we deliver help build trust and confidence in the capital markets and in economies the world over. We develop outstanding leaders who team to deliver on our promises to all of our stakeholders. In so doing, we play a critical role in building a better working world for our people, for our clients and for our communities.
EY refers to the global organization, and may refer to one or more, of the member firms of Ernst & Young Global Limited, each of which is a separate legal entity. Ernst & Young Global Limited, a UK company limited by guarantee, does not provide services to clients. For more information about our organization, please visit ey.com.
© 2014 EYGM Limited. All Rights Reserved.EYG No. CQ0146
ey.com
The articles, information and reports (the articles) contained within The Journal are generic and represent the views and opinions of their authors. The articles produced by authors external to EY do not necessarily represent the views or opinions of EYGM Limited nor any other member of the global EY organization. The articles produced by EY contain general commentary and do not contain tailored specific advice and should not be regarded as comprehensive or sufficient for making decisions, nor should be used in place of professional advice. Accordingly, neither EYGM Limited nor any other member of the global EY organization accepts responsibility for loss arising from any action taken or not taken by those receiving The Journal.The views of third parties set out in this publication are not necessarily the views of the global EY organization or its member firms. Moreover, they should be seen in the context of the time they were made.
Accredited by the American Economic AssociationISSN 2049-8640