the kinetics and reaction mechanism of the goethite to...
TRANSCRIPT

The kinetics and reaction mechanism of the goethite to hematite transformation
C. J. G o s s
Department of Earth Sciences, University of Cambridge, Downing St., Cambridge CB2 3EQ
Abstract
A complete mechanism for the transformation goethite to hematite based upon the results of thermogravimetric, transmission electron microscope and X-ray diffraction investigations is presented. A porous microstructure and hematite crystallites in twin orientation are found to develop during transformation. For the main part of the transformation, and at higher temperatures, the reaction is controlled by a two-dimensional phase boundary. Activation energies of 169 +_ 8 k J/mole (for an ore mineral) and 154_+ 15 kJ/mole (for a recent sedimentary goethite) were obtained for this part of the transformation. At early stages and lower temperatures, the mechanism is one of proton/iron transfer across the reaction interface. Important goethite characteristics are grain size, shape, crystallinity and excess water content. The activation energy is found to depend upon temperature and degree of dehydration.
KEYWORDS: goethite, hematite, reaction mechanism, electron microscopy, X-ray diffraction.
Introduction
G o E T H I T E and hematite are the main iron-bearing minerals in sedimentary red beds and the fine- grained hematite gives red beds their characteristic colour. Hematite is abundant in ancient red beds but very uncommon in younger deposits (up to 2 m.y.) and it is generally accepted that the hematite is a post-depositional phase formed during early diagenesis. The predominant phase in younger deposits is goethite, giving the rocks a yellow or brown eolour.
The origin of the hematite is unclear and has most likely formed along different pathways in different sediments. The hematite may have been formed: (1) in situ, directly from a red hematitic soil or clay; (2) by the ageing of amorphous hy- drated iron oxides (limonite); (3) by the dehydration of crystalline goethite; or (4) by the re-solution of the original goethite and the re-precipitation of hematite from an intermediate phase (e.g. ferri- hydrite) in solution. The origin of the original iron and the prevailing conditions (climate, iron con- centration in solution, pH and Eh ofgroundwaters, depth of sediment burial, temperature, and hydro- static pressure) wilt all affect the pathway that produces hematite.
The relative stability of the two minerals is controlled by thermodynamic constraints. Equi-
librium for the transformation is affected by pres- sure, relative humidity, temperature and grain size (Langmuir, 1971). From his results Langrnuir (1971, 1972) concluded that fine-grained goethite (< 0.1 pm) is unstable relative to hematite under virtually all geological conditions and that coarse- grained goethite (> 1.0 #m) is stable up to 80 ~ and 40~ humidity. Although most goethites in sediments are < 0.1 #m in size and hence thermodynamically unstable, the reaction kinetics are so slow that goethite is the more common phase in recent deposits.
The kinetics of the reaction have been studied by Lima-de-Faria (1963), Pollack et al. (1970a and b), Keller (1976) and Thrierr-Sorel et al. (1978). Lima- de-Faria (1963) quotes an activation energy of 19.8 kcal/mole (82.8 k J/mole) for a crushed single crystal goethite and Pollack et al. (1970a and b) quote 29 _ 3 kcal/mole (121 _+ 13 kJ/mole) for two natural 'limonites', which are probably poorly crystalline or amorphous goethites. Thrierr-Sorel et al. (1978) give an activation energy of 21 kcal/mole (88 kJ/ mole) for a fibrous goethite. Keller (1976) gives activation energies in the range 23 to 40 kcal/mole (96 to 167 k J/mole) for a variety of goethite types and suggests that the relationship between activa- tion energy and crystallinity of the parent material is linear. Only one of these authors (Pollack et al., 1970a and b) discusses the amount of water held in
Mineralogical Magazine, September 1987, Vol. 51, pp. 437-51 �9 Copyright the Mineralogical Society

438 C . J .
their samples and none of them the effect tha t this excess water would have on their results.
L ima-de-Far ia (1963) suggests a mechanis t ic model for the react ion based on tha t proposed for bruci te by Ball and Taylor (1961) which involves the format ion of an in termediate phase. Wata r i et al. (1979, 1983) favour a direct t ransformat ion , goethite to hemati te , wi thout an in termediate phase.
To date no complete mechan ism has been pro- posed for the t ransformat ion. The present s tudy considers the direct dehydra t ion of two na tura l crystalline goethites and elucidates the react ion mechan ism from a combina t ion of kinetic and micros t ruc tura l evidence. Kinet ic da ta a lone can- no t satisfactorily define solid-state t ransforma- tions; the theory is of an empirical na ture and the results sensitive to exper imental condit ions. Mechanisms proposed from thermogravimet r ic da ta need to be s trongly suppor ted by microstruc- rural evidence. Nevertheless the de te rmina t ion of act ivat ion energies is of use in est imating the geological t ime scale of the reaction.
TABLE I. Crystallographic relationships between
goethlte and hematite
Cell dlrections Cell parameters
G [ I 0 0 ] / / B [ 001 ] 3 ag - e b
O [010] / / H [010 ] bg = 2 a h
G [001] // H [210] 3 Cg = J3 a h
Structures. The structures of the two minerals are very similar; bo th have hexagonal close-packed oxygens with octahedral ly coord ina ted iron. The close s t ructural relat ionship (Table 1) suggests a topotact ic t r ans format ion in which the oxygen sub-latt ice is preserved. Goeth i te and hemat i te crystallize in the o r t ho r hom bi c and t r igonal systems respectively, the layer repeat perpendicular to the close packed planes being 2 and 6 respec- tively. In goethite half the octahedral interstices are filled, in hemat i te two thirds, and the order ing of the i ron a toms within the oxygen lattice will give rise to twinning in bo th structures. Twin forma- t ion in goethite has no t been observed in na ture but is c o m m o n in synthetics (e.g. Cornell and M a n n , 1983). Twinning in hemat i te produced from goethite is c o m m o n and forms an impor t an t par t of the mechanism.
Uni t cell parameters for goethite are a = 4.65, b = 10.02, c = 3 .04/~ (Z = 4); for hemat i te a =
G O S S
5.04, c = 13.77 A (Z = 6) (Murray, 1979). The reduct ion in volume tha t ' occurs dur ing dehydra- tion, 28.7~o results in the format ion of cracks and pores within the grains.
Experimental. Thermogravimetric data were collected using a Stanton Redcroft balance, model 761, with temperature controlled to < ___ I~ heating rates of 1 ~ to 990 ~ and a mass uncertainty ___ 0.5 #g. A constant flow ofN z (O2-free) gas at 20 ml/min and one atmosphere pressure was maintained over the samples. Low- and high-resolution electron microscopy was carried out on an AEI EM6G and a JEM-100CX instrument respec- tively. Powder XRD analysis was carried out using a Cu-K~ source at l~ and 0-25~ scan speeds using a silicon standard.
The 9oethite samples. Natural goethites occur in several different forms; as stalactitic ore minerals (fibrous 'kidney ore' or prismatic), as fine pigment (often acicular), as concretions and nodules, or as grain coatings. Most synthetic goethites consist of fine needles.
The first goethite studied was an ore mineral (Harker Museum Collection No. 1323, Cambridge), with a tabu- lar, prismatic morphology, no impurities and a total mass loss of 10.1 +0.2~, in good agreement with the stoichio- metric loss expected, 10.112~. The sample cleaved along (010) to form plates which were gently hand ground in an agate mortar, and sieved to form a sample in the range 75 106 #In and less than 53 #m. The sample was found to give good sharp XRD peaks; it was stored in a desiccator prior to use.
The second goethite, obtained from a sand quarry in the Lower Greensand near Leighton Buzzard, formed a coating around quartz grains. The sample is given the label 'L.B.'. It was very friable, enabling it to be separated by hand in order to discard the larger quartz grains. This separation produced a fine loose powder, which was placed in an ultrasonic bath in distilled water for several hours. The goethite formed a suspension which was removed and dried at 50 ~ The final product was stored in a desiccator.
The L.B. goethite was found to form either small equidimensional flakes about 140 A in size or very thin large flakes-of approximately 480 A planar dimension (TEM). Lattice fringes can be observed on the flakes, indicating that the goethite is crystalline. Diffraction patterns are powder rings because many grains contribute to the information within the smallest aperture available, but fringe spacing, especially that of the hematite produced from this goethite, confirm that the flakes are parallel to (010) i.e. the cleavage plane of goethite. XRD powder patterns show quartz and broad goethite peaks only (where broadening is due to size); no clay-mineral peaks are seen. The quartz content of the final sample is estimated at 11.9 + 1.0~ by the method of known addi- tions (Brindley and Brown, 1980) and the sample was found to have a total water loss of 16.39(7)~, including an estimated 2.1~ adsorbed water. Excess water, both adsorbed and structural, is common in natural and synthetic goethites.
In addition to these goethites, several others were investigated for comparison; a fibrous mineral, which broke up to form needles of length approximately 0.1 #m.

GOETHITE-HEMATITE TRANSFORMATION 439
and two synthetic goethites supplied by Mapico (1 /~m grain size quoted) and B.A.S.F. (114 m2/g specific surface area quoted). The amount of excess water was found to be greater in finer-grained and fibrous goethites, and is also common in poorly crystalline goethites, e.g. those made from gels.
formation of a reaction mechanism from kinetic data needs a parallel and independent investigation of microstructure. Without the definition of a reaction mechanism, it is difficult to determine the effect of different experimental and environmental conditions on the transformation.
Thermogravimetry
Theory. Isothermal TG data, y vs. t. are often modelled on an integrated rate equation,
g(y) = kt
derived from the rate law dy /d t = cf(y). Here, y is the fraction transformed, t is time, c a constant, k the rate constant and 9(Y) the reaction function. The variation in reaction rate with temperature, T, is found to obey the following semi-empirical Arrhenius-type equation for many reactions,
k = A e x p ( - - E , / R T )
where R is the gas constant, A the pre-exponential factor and Ea an activation energy. Discussion of methods of analysis of thermogravimetric data can be found in Burke (1965), Bla~ek (1973), Brown et al. (1980) and Galwey (1982).
In the solid state, reactions are often complex and may proceed via a series of steps. The basic mechanisms comprising the overall reaction will each represent a particular physical process, such as nucleation, growth or diffusion, and each of these processes will have a particular activation energy. The empirical activation energy, E~, measured for an overall solid-state transformation will refer to the combination of these basic mechanisms contri- buting to the reaction. Alternatively, within the sequence of basic mechanisms, one may dominate the overall reaction, usually the slowest reaction in sequential reactions, called the rate-determining step. It is the kinetics of this step which are measured.
Unless the overall reaction can be broken down into a series of steps (and each identified with a basic mechanism) or the rate-determining step determined, then any activation energy calculated from the data must refer to the overall reaction. The E, will then be very dependent both upon the sequence of events and the relative importance of the reaction mechanisms making up the overall reaction and hence very dependent on experimental conditions. In this sense, it is important to refer particular activation energies measured for a solid- state transformation not only to that reaction, but to the conditions of the experiment, e.g. grain size, shape, crystallinity, temperature and pressure.
Kinetic analysis provides a good phenomeno- logical description of the transformation, but the
370~ 327oc
282~
o.8 2 6 3 ~
0 . 6
y
~ so 100 150 200
Time (rain)
2 4 0 ~
o.8 231o C
0.7
o.~ (b)
o . s
Y o . 4
o - a o
o.2 ~ 217 C
0.1
~ 0 2 4 6 8 lO 12 14
Time= x 103 mins
FIG. 1. (a) Isothermal dehydration curves, 240 370 ~ for the ore mineral goethite. Grain size < 53 #m, sample mass 8-10 mg. (b) Isothermal dehydration curves, 240-217 ~
Sample mass 40 mg for 217 ~ otherwise 8 10 mg.
Thermogravimetric results o f the ore mineral. Fig. la shows the mass loss curves for goethite (grain size < 53/~m) at a series of temperatures. At lower temperatures the curves become sigrnoidal, rather than deceleratory, with the appearance of an induction period for values y up to 0.1 (Fig. lb). The highest-temperature curve (370~ was not in- cluded in the analysis because it was considered that heat transfer dominated the reaction at this temperature. Experimentally, the results have been shown to depend upon sample size, grain size distribution, packing factors and heating rates. The errors in the results table (i.e. in Ea) reflect the systematic error in ascertaining the zero point of the reaction, and the graphical and calculation errors, but not the random errors in measuring y or t which were very small.

440 C . J . G O S S
TABLE 2. Selection of reaction functions, g(y), for various TABLE 3a. Data from inln(I/1-y) vs. int plots,
mechanisms, taken from the literature; n is the theoretical slope goethite <53um.
of the inln(I/(1-y)) vs. lnt plot.
Temperature n r range of y +ioc g(y) Mechanism n
Y
Deceleratory y,t curves
I~(I-y) I/2 R 2
I-(I~y) I/3 R 3
-in(l-y) F I
y2 D~
(I-(I-y}I/3) 2 03
Sigmodal y,t curves
(-!n(I-y)) I/2 A 2
(-in(1 y))I/n An
zero order 1 . 2 4
phase boundary controlled 1.11 by area
phase boundary controlled 1.07 by volume
homogeneous 1.00
diffusion in I dimension 0.62
ci~fuslon in 3 dimension 0.54
random nucleation and 2.00 growth
Avrami-Erofe'ev n
327 1 .11 + 0 . 0 3 0 . 9 9 9 8 0 .1 - 0 . 8
282 1 . 0 9 + 0 . 0 2 0 . 9 9 9 1 0 .1 - 0 . 8
263 0.973• 0.9971 0.1 - 0.8
240 1.570-0.003 0.9954 0.1 - 0.8
231 1.45 • 0.9866 0.1 - 0.7
217 a 1.80 • 0.9989 0.05 - 0.35
Note a. Sample mass 40mg. Otherwise 8-10mg.
TABLE 3b. Values of n from lain plots for early
stages, goethite <53um.
TABLE 4. Activation energies calculated from in 'time to ' method of
analysis, sample mass 8-10mg, within the temperature range given.
Grain Size < 53um 75 - 106~m
E a ( k J / m o l e )
Y
282,262,240"C ~62,240,231'C 327,282,262~C 282,262,240~C
0.05 234*8 184• 132~8
0 . 1 o 249+8 249+8 175~8 203:8
0.25 227+8 227• 164~8 203:8
0.50 g16~8 227• 164• 194-8
0.75 210• 218• 166• 193+8
Average 0.25-0.75 21824 22g• 165• 194•
0.35 E a = 264• range 262,241,217~C, 40mg sample
Temperature ~C n ~ange of y
231 0.56z0.03 0.00-0.09
2~1 0.70• 0.01-0.05
217 O.79:0.06 0.02-0.05
TABLE 5. Activation energies calculated from in 'rate at'
sample mass 8-]0mg, for temperature range given.
g a (kJ/mole) •
y 327,282.263~ 282,263,240~ size
0.05 128 231 53~m
0.10 146 231 53~m
0.25 157 218 53~
0.25 140 208 75-106~m
method,
It is possible to model the data on a series of reaction functions 9(Y), each representing a particu- lar reaction mechanism. A selection of these are shown in Table 2. Some authors have found that the functions 9(Y)fi t the data to the same degree and each yield very similar E, (e.g. Criado et al., 1984). The Johnson Mehl equation, y = 1 -exp[ - - (k t )"] (see also the Avrami Erofe'ev equation, Table 2) is found to satisfy many isothermal kinetic data. Plots of lnln(1/1-- y) vs, In t are linear with slope n, and intercept nln k. Using this method, it is very difficult not to obtain a good fit to the lnln plots with the raw y, t data. For the goethite data, plots of lnln(1/1 - y) vs. In t were linear for 327, 282, 263 and 240 ~ and for 231 and 217 ~ split into two linear sections: y < 0.1 and y > 0.1. The order n calcu-
lated from these lnln plots is given in Table 3a and b. The range of y over which a straight line was obtained is shown in the last column, with the regression coefficients of this line in the 4th column. The Arrhenius plots (ln k vs. 1 /T) from this method were curved, and E, values calculated for various temperature regions are given in Table 6.
The In 'time to' method of analysis involves integrating a (non-specific) reaction function 9(Y) between y = 0 and y = Y (of value 0 to 1). The numerical value of the integral is a constant with temperature, such that
In tr = c o n s t a n t - I n a + E , / R T ,
where tr is the time to reach y = Y. Plots of In tr vs. l I T yield an activation energy. The method

G O E T H I T E - H E M A T I T E T R A N S F O R M A T I O N 441
assumes that g(y) is independent of y, and that the point y = Y is the same point in the transformation at each temperature.
A similar method, the 'change in rate' method, involves plotting the rate of reaction, dy/dt (at a specific value y = Y) vs. l IT. The method applies the Arrhenius equation directly, i.e.
In (dy/dt)r = constant - In A - E J R T,
and assumes that the rate (dy/dt)r does not depend on the reaction up to y = Y, but avoids the difficulty in defining a zero point, t = 0, y = 0, as is often the problem with the In ' time to' method.
Values of E~ calculated from the In ' time to ' method and from the change in rate method are given in Tables 4 and 5 respectively for various values y = Y. The advantage of both these methods over the Avrami Erofe 'ev-Johnson Mehl ap- proach is that they do not depend on defining a specific function 9(Y) and will indicate if E, is a function of y.
1"0
0"8 ~ ~ 0"6
Y 0"4 0 -2
U I I I I r 3OO 35O 4OO
T e m p e r a t u r e ~
FIG. 2. Non-isothermal curve for ore mineral goethite (< 53/zm) at a heating rate of 8.3 ~
A Coats and Redfern plot (Coats and Redfern, 1964) for a heating rate of 8.3 ~ is shown in Fig. 2. The following equation describes the kinetics of a continuous run for a heating rate, fl;
In g ( y ) - 2 In T = in (AR/E,f l )-- E, /R T.
Values of E, obtained by this method are given in Table 6 for various reaction functions g(y) and two gas flow rates.
The variation in E, with method of analysis highlights the unsatisfactory nature of the applica- tion of basic kinetic theory to solid-state trans- formations. Nevertheless the following trends can be seen, for values of y between 0.1 and 0.8: (a) E, increases with decreasing temperature; (b) E, in- creases with decreasing gas flow rate; (c) E, de- creases with increasing grain size within the grain size range studied, the difference being greater at
lower temperatures, and y < 0.1, but marginal in other regions.
Discussion. All methods of analysis show a variation of E, with temperature. Neither E, or A is necessarily independent of temperature. The curves ofln k vs. 1/T, and in ('rate at') vs. 1 /Tbo th showed a smooth curvature where E, increased with decreas- ing temperature. This may (a) be due to a change in mechanism with temperature, or (b) show the approach to equilibrium at lower temperatures. Both were thought to be the case here.
The equilibrium temperature, calculated using the free energy equation of Langmuir (1971) for 30 pm cube edged goethite (of the same surface area as a 50 pm by 2/~m flake), is 120 ~ The Arrhenius equation assumes that we are far from equilibrium, and hence it is necessary to use the E, for the highest temperature range as representing the transforma- tion.
The kinetics in the region y < 0.8, for tempera- tures in the range 327 ~ to 263 ~ is very con- sistent. Ea remains constant (Tables 4, 5) with increasing y for y > 0.1 and the order of the reaction is found to be n = 1.10_+0.02 (Table 3a, 327, 282 ~ A very similar set of results was found for the grain size 75 106/~, with n = 1.13 _+0.02 for temperatures 327 to 263 ~ for this size. At lower temperatures, for y = 0.1-0.8, the value of n in- creases into the region 1.45-1.8 for both grain sizes.
At lower temperatures (240 ~ and less), the effect of the induction period is seen for y < 0.1. The results of an additional run conducted at 217 ~ taking two weeks to reach y = 0.4, are given in Tables 3 and 4. For these lower-temperature plots the reaction rate (i.e. dy/dt) was slow up to y = 0.1 and E, found to be higher (Table 4, y = 0.05, 0.1; Table 5, y = 0.05). The Johnson-Mehl curves split; the values of n are 1.5, 1.8 for y > 0.1 and in the region 0.5-0.7 for y < 0.1 (Table 3b). The kinetic evidence is in favour of a change in mechanism. It is difficult to ascertain this mechanism from the few data in this region. In addition, the systematic errors (e.g. in locating the zero point) and random errors are all larger in this region because of the shorter times involved.
Above y = 0.8 the rate decreases suddenly. This was found to be the point at which the reaction slowed down for all the goethites tested.
Activation energies from the Coats and Redfern plot vary greatly with g(y) (Table 6). This depen- dence of Ea on 9(Y) has also been seen by other authors (e.g. Criado et al., 1984, for kaolinite).
The 'order ' of the reaction, as given here by n, is not the same as those quoted by other authors (i.e. Pollack et al., 1970a and b; Keller, 1976; Thrierr- Sorel, et al., 1978), and the reason for this lies in the different methods of analysis and experimental

442 C. J. GOSS
TABLE 6. Summary of activation energies calculated from various methods,
sample mass 8-1Omg.
E a (kJ/mole) in temperature range given ~
Method 327,282,263 282,263,240 range of y
Goethite, <53~m
Johnson-Mehl 170+8 219• 0.I-0.8
g(y)--in(1-y) 175• 200• 0.1-0.8
time to (average) 218• 0.1-0.8
224+4 a 0.25-0.75
rate at (average) 152~ 225• 0.25-0.75
Goethite, 75-IO6~m
Johnson-Mehl 150+8 164+4 0.I-0.8
g(y)=-in(~-y) 161• 172+4 0.I-0.8
time to (average) 165• 194+4 0.25-0.75
rate at (average) 140~8 208+8 0.25-0.75
E a (kJ/mole) region of linearality
Goe~hLte <53um 3cats and Redfern:
g(y~ = R 2 gas 25 mimin !8a-~
gas 0 ml'min 220•
[(y) = zero order 201~8
F I 184•
- A 2 96~8
= D! 59+8
= D 2 363•
y < O . 3
y < 0 . 8
y = 0 . i - 0 . 8
0 . 1 - 0 . 8
0 , 1 - 0 . 7
0 . 1 - 0 . 8
0 . I - 0 . 7
Note a. Temperature range 262,240,23!~
conditions. Different regimes of temperature and times were used by these authors; the length of time over which the reaction was conducted in this work was much longer than in any other study. Addi- tionally, the sample size of previous workers (often 50 mg) and the sample type (e.g. fibrous, fine-
i [ E i I I ] i i i 2 0 0 4 0 0 6 0 0 8 0 0 1 0 0 0
T e m p e r a t u r e * C
FIG. 3. DTG plot of the L.B. goethite at a heating rate of 190 ~
grained and synthetic) are different. In the present work, factors such as sample size, sample prepara- tion, gas pressure, heating rates and packing factors have been shown to affect the results. It is important to refer particular activation energies measured for a solid state transformation not only to that reaction but to the conditions of experiment.
In summary, the kinetic data for the region y < 0.8, temperature 327~ to 262~ are well behaved and indicate, from Table 2, a phase boundary reaction with E a = 1 6 9 + 8 kJ/mole (Table 6, average of results from Johnson-Mehl, 'rate at' and Coats and Redfern methods). The reaction is more complex at lower temperatures and times; the data here suggest a diffusion mechan- ism, with n = 0.5-0.7 for y < 0.1 (temperature 231 ~ with an E a in this region of 264 kJ/mole (Table 4). E a increases as size decreases, especially in the lower temperature and time regions, showing that grain size is an important control on the reaction at these stages.

G O E T H I T E - H E M A T I T E T R A N S F O R M A T I O N
TABLE 7a. Activation energies for the L.B. goethite calculated using
in 'time to' method, from the best fit straight line in temperature
range given.
E a (kJ/mole), in temperature range given
Y 173,193~ 193,238~ 238,281~ 193,238,281~
443
0.10 213 ~9 50 49•
0.20 264 132 77 108•
0.25 254 154 91 126•
0.30 251 165 106 139•
0.40 ~68 180 12~ 160+17
0.50 185 141 165•
0.70 158
0.80 139
Results from the L.B. goethite. This goethite was preheated to 120 ~ for 15 minutes in the balance before isothermal runs were performed to release some of the surface adsorbed water. The mass loss observed was 2.10 _+ 0.05~ in all cases at this stage, regardless of the temperature and time of the run treatment. The total water loss above this was found to be 14.29(7)~. No changes in unit cell parameters were observed after the pre-heating to 120 ~
Analysis of the kinetics of the L.B. goethite was complicated by the presence of the excess water. A D T G plot (Fig. 3) of this goethite showed three peaks. The first corresponds to the release of the weakly bound excess water (up to 200~ and the second (at 380~ to the main dehydration. The third is due to the reduction of hematite to
J 12
10
�9 6
~o ~ 4
2 8 ~ 238~ 1 o C
.--.-.'-- 193~
173~
2 0 0 4O0 6 o o 8 0 0
T i m e ( m i n )
FIG. 4. Isothermal dehydration curves for L.B. goethite, sample mass 8 10 mg. Pre-heated to 120 ~ with a total
loss of 14.3~ above the base level given here.
magnetite. The position of the peaks shift with heating rate.
A set of dehydration curves is shown in Fig. 4. Dehydrat ion occurs at a much lower temperature than for the ore mineral due to the fine grain size. Assuming a total water loss of 14.3~, activation energies derived from the In ' time to' type method are given in Table 7a. Values of y here are not analogous to those for the ore mineral as they refer to different points in the transformation. In order to try to avoid the problems of excess water, the zero of the transformation can be re-set and the 'time to' calculated within the boundaries of Yl = 0.4 and Y2 = 0.5, 0.7, 0.8 (Table 7b). The average of these
TABLE 7b. Activation energies for L.B. goethite, as
taole 7a, with a zero Lime re-set to y=O.U.
~.e In(time 4 ) 0. -0.D,0.7,0.8
E a (kJ/mole) in temperature range
193,238QC 238,281~
0.5 198• 170_+8
0.7 154z8
0.3 138~8
results for the higher-temperature range is 154 Jr 15 k J /mole which lies very close to that of the ore mineral.
DTG. A summary of the D T G results is given in Table 8, for various goethite types. Dehydrat ion

444 C. J, G O S S
starts early (50 ~ for those goethites with excess water but remains at a low level until temperatures of 150-200~ have been reached. For the ore mineral, dehydration did not begin until 260 ~ Peak positions depend on heating rate, sample type and size, and amount of excess water in the goethite. Two peaks or more can be observed in DTG due to non-stoichiometric amounts of water in the goethites. The more weakly bound component is driven off earliest.
minutes for a 100 kV beam, depending on grain thickness. The conditions within the microscope obviously do not reproduce those of the thermo- gravimetric balance.
Grains that have undergone very slight dehydra- tion appear red (hematitic) and then yellow/brown (goethitic) on grinding, suggesting that a skin or shell of hematite formed initially. Fig. 5 shows part of a 40 mg sample of goethite kept at 241 ~ for 15 hours. The weight loss at this point corresponded to y = 0.1. A band of parallel pores has formed around the edge of the flake where the grain has fully dehydrated to give hematite, the rest of the flake being undehydrated goethite. The flecks and pores in the undehydrated part of the grain have arisen through beam damage. Fig. 6 shows a fully dehydrated sample which had been kept at 372 ~ for 3 minutes. The porous structure is very regular and extends throughout the whole grain. The
FIG. 5. TEM micrograph of partially dehydrated goethite (y = 0.1). Scale bar 0.l pm.
TEM and XRD
The ore mineral. Due to the low temperature of the transformation, the dehydration reaction could be followed in situ in the electron microscope by beam heating. The adsorption of electrons within FIG. 6. TEM micrograph of a fully dehydrated goethite the thicker flakes causes local heating and the showing a very regular set oflamellae c. 36 ~ apart. Scale dehydration then takes between 10 seconds and 20 bar 250 ~. Arrow perpendicular to H(001).
Table 8. Summary of results from DTO plots Of various goethite types.
sample DTG plot
goethite %water grain heating types of peaks position of type loss size rate observed main pea~
fibrous, mineral 2. ~ <53~m 8.3~C/min one, assymetric 290QC Hume coil. ~o.1238 peak
fibrous, synthetic 313% 114m2/g 8.3 one mai~ peak with 2~0~C B.A.S.F. low temp. shoulder
fibrous, synthetic 313% 1~m 8.3 two pea~s, second 315QC Mapico yellow length at 270~
ore miaeral Harker 10.1% <53~m S.3 single, assymetric 345~C coil. No. 1323 peak
L.B. sedimentary 16.4% O.01-O.05~m 44~ one main peak with 290~C goethite broad shoulders
L.B. sedimentary 16.4% // 190oC/min three peaks 38g~c goethite

GOETHITE HEMATITE TRANSFORMATION 445
FIG. 7. Low-resolution EM sequence of micrographs illustrating the in situ beam dehydration of a goethite flake. (a) Goethite, zone axis [011] and (b) the same flake a few minutes later. Note the development of pores parallel to G(100). Scale bar 0. l/lm. Arrows perpendicular to G(100).
lamellae were found to be ~ 36 A apart (calibrated against an aluminium standard) and parallel to H(001).
Fig. 7 shows two electron micrographs which follow the dehydration in the electron microscope. Fig. 7a is of an undehydrated flake and Fig. 7b shows the same flake after a few minutes. The pores
have begun to form parallel to the close-packed planes in goethite, G(100), extending from the edge inwards. Pores that appear to start and stop within the grain in fact run from the top to the bottom surfaces.
Fig. 8a c also illustrates the progression of the reaction in the microscope, showing the product forming at the surface and steadily progressing inwards. The pores are again parallel to G(100)/ H(001) and are seen to progress faster in this plane than perpendicular to it. The pore direction and width remain constant throughout the transforma- tion. The distance between the pores is approxi- mately 40 A i.e. 8 close packed planes apart (4 goethite unit cells). The set of goethite lattice fringes in between the pores (Fig. 8c) shows that undehydrated and dehydrated parts of the grain are distinct and that the pores are associated with the product.
Cracks in the grains sometimes appear, especially in grains dehydrated in the beam and in samples dehydrated at higher temperatures. This is a result of the reduction in volume that occurs during the transformation. Otherwise the volume change is taken up by the formation of pores, which are found to be 36-40 A apart and ~ 24 A wide. The pores of samples from the lower temperature runs are much more regular than those for the higher tempera- tures, but of the same width. At higher temperatures the water is not released at a slow enough rate for a very regular system of pores to form.
Fig. 9a is of a sample kept at 240 ~ for 48 hours. The coherency of the lattice fringes suggests that a single crystal of goethite is transformed directly to a single crystal of hematite and that isolated parts of the grain do not dehydrate independently. Fig. 9b illustrates the formation of hematite twin crystal- lites of about 50 A in width. The fringe systems are completely coherent across the twin boundaries,
FIG. 8. (a c) Micrographs of an identical grain lying in the G[011] axis showing the progression of the porous microstructure from the grain edge inwards during the course of 15 minutes. The pores can be seen to grow quickest parallel to G(100)/H(001). The reaction interface consists of the boundary between the porous product and the
undehydrated grain. Scale bars 250 A. Arrows perpendicular to G(100)/H(001).
446 C . J . GOSS
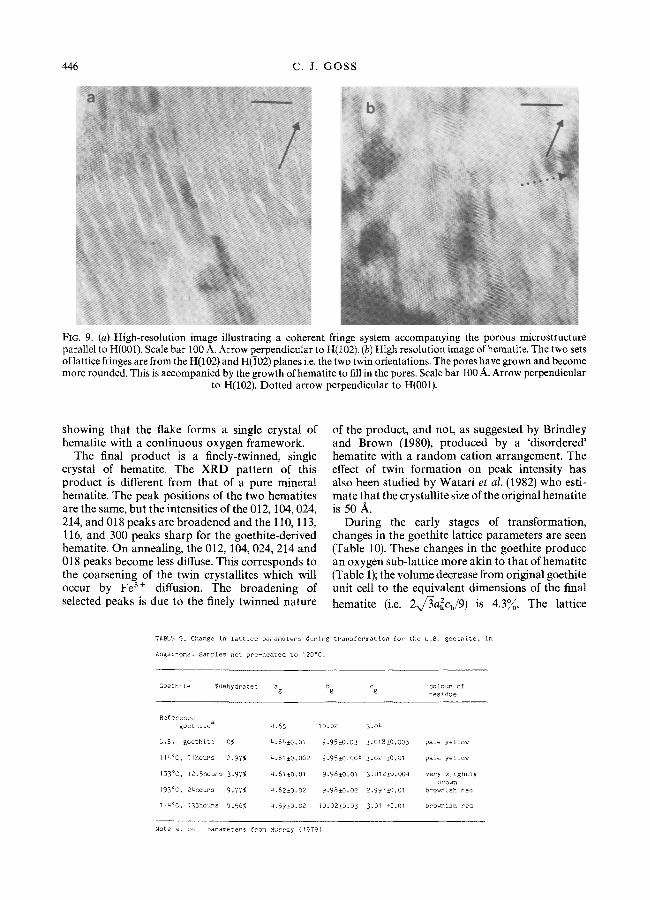
FIG. 9. (a) High-resolution image illustrating a coherent fringe system accompanying the porous microstructure parallel to H(001). Scale bar 100 A. Arrow perpendicular to H(I02). (b) High resolution image of hematite. The two sets of lattice fringes are from the H(102) and H(102) planes i.e. the two twin orientations. The pores have grown and become more rounded. This is accompanied by the growth of hematite to fill in the pores. Scale bar 100 A. Arrow perpendicular
to H(102). Dotted arrow perpendicular to H(001).
showing that the flake forms a single crystal of hematite with a continuous oxygen framework.
The final product is a finely-twinned, single crystal of hematite. The XRD pattern of this product is different from that of a pure mineral hematite. The peak positions of the two hematites are the same, but the intensities of the 012, 104, 024, 214, and 018 peaks are broadened and the 110, 113, 116, and 300 peaks sharp for the goethite-derived hematite. On annealing, the 012, 104, 024, 214 and 018 peaks become less diffuse. This corresponds to the coarsening of the twin crystallites which will occur by Fe 3§ diffusion. The broadening of selected peaks is due to the finely twinned nature
TABLE 9. Change in lattice parameters during
Angstroms. Samples not pre-heated to 120~
of the product, and not, as suggested by Brindley and Brown (1980), produced by a 'disordered' hematite with a random cation arrangement. The effect of twin formation on peak intensity has also been studied by Watari et al. (1982) who esti- mate that the crystallite size of the original hematite is 50 A.
During the early stages of transformation, changes in the goethite lattice parameters are seen (Table 10). These changes in the goethite produce an oxygen sub-lattice more akin to that of hematite (Table 1); the volume decrease from original goethite unit cell to the equivalent dimensions of the final hematite (i.e. 2x/3a~ch/9 ) is 4.3~o. The lattice
transformation for the L.B. goethite, in
Goethite %dehydrated ag bg Cg colour of residue
Reference goethite a 4.65 10.02 3.O4
L.3. goethite 0% 4.64• 9.95+O.03 3.O18• pale yellow
114~ 91hours 2.97% 4.61• 9.95+0.004 3.02 • pale yellow
153~ 12.5hours 3.97% 4.61• 9.96• 3.O12• very Slightly brown
193~ P4hours 9.77% a.62~0.02 9.98+0.02 2.997• brownish red
174~ 135hours 9.56% 4.59• ~0.O2• 3.01 +0.O1 brownish red
Note a. cell parameters from Murray (1979)

GOETHITE HEMATITE TRANSFORMATION
TABLE IO. Changes in lattice parameter for the ore mineral goethlte as a
function of dehydration, in Angstroms.
447
Goethtte y ag bg Cg residueCOl~ of
ore mineral 0.00 4.54 +0,05 10.09 • 3.07 • brown
241~ 16 hours 0.11 4.605• 9.965• 3.022+0,002 pale pinkish brown
217~ g90 hours 0.38 4.602• 9.966• 3.023• deep bright fed
Hematite y a h c h co[our of residue
277~C, 290 hours 0.38 5.041• 13.76• deep brkght red
262 ~C , 9 hours 0.82 5.039• 13.78• dark purple brown
parameters of the hematite are found to be invariant to heat treatment (Table 10).
The L. B. 9oethite. Due to the low temperatures of dehydration and fine grain size, TEM of this goethite was difficult. Beam heating caused the sample to dehydrate almost immediately. The porous nature of the product can be seen in Fig. 10a, and Fig. 10b shows another part of the same sample. Here the formation of the two sets of hematite twins can be seen; the fringes are from H(012) planes. Both these figures indicate a reaction mechanism like that proposed for the ore mineral, at least at higher temperatures.
Lattice parameter changes, as a function of ?/o water loss are shown in Table 9 for the lowest temperatures. The original goethite is slightly defective with reduced b and c parameters. No lattice parameter changes are observed until water losses above 2.1 ~o have been achieved. The increase in b occurs after 4~ water loss, and the c parameter remains constant within error.
This goethite was estimated to contain at least 2.1 ~ adsorbed water. The remaining H20 content of 14.3~ must include extra structural water above the 10.112~ stoichiometric content. An outer hematite shell was found to develop after only 3.97~ loss (1.57~ above the 2.1~ level, Table 9), i.e. formation of the product begins before all the extra water above the stoichiometric amount has been driven off. A small amount of water is found to be left in the product, even when only hematite peaks are observed, i.e. the final product can support some OH-ions. On further heating the diffuse XRD lines sharpen as for the ore mineral. Twin coarsen-
ing in this goethite began only after treatment at 900 ~ for 2 hours.
Discussion of transformation mechanism. The mechanism of dehydration is as follows for y < 0.8. The transformation proceeds from the surface in- wards by the formation of parallel pores extend- ing within the close packed planes {G(100) and H(100)}. The product consists of a finely-twinned hematite, separated by pores ~ 36 A apart. The re- action front consists of the interface between the undehydrated goethite and this twin/pore product and the transformation proceeds up to 80~o by the progression of this interface parallel to G(100). Long-range diffusion does not take place, neither does the formation of isolated independent nuclea- tion sites. The rate of advance of this reaction interface is an important part of the transformation mechanism, and on re-examining the kinetic results of the previous section, we can see that the micro- structural evidence supports the conclusion that the mechanism is phase-boundary controlled in two dimensions.
The phase boundary is planar rather than spherical. This is illustrated by a plot of reaction rate (mass loss/unit time)/interfacial area vs. time, since, reaction rate/interfacial area = a constant if the reaction is controlled by a phase boundary. The left-hand side of this equation is independent of time and can be expressed for a spherical boundary as dy/dt.1/{4n(ro)Z.(1-y)2/a}, where r 0 is the radius of the initial spherical grain and the inter- facial area 4gr 2 is re-arranged in terms of y (compare R3, Table 2). For a planar boundary the expression is dy/dt. 1/(2ab), where a and b are the

448 C. J. GOSS
FIG. 10. (a) Micrograph of a fully dehydrated sample of the L.B. goethite. The porous microstructure can be seen, spacing 36 A. Scale bar 100 A,. (b) TEM image of a larger (750 A) flake of the hematite produced from the L.B. goethite. The two sets of fringes can be identified as from the two sets of twins which form crystallites c. 50 A in size.
Scale bar 50 A. Arrow perpendicular to H(012),
sides of a planar sheet. Within the region y = 0.1 to 0.5, the data from this study were found to fit the equation for the planar boundary much better than the spherical.
On a small scale, however, the phase boundary is not strictly planar (e.g. Fig. 8). The interracial area is actually time dependent and this leads to a depen- dence of dy/dt on y. This is especially so at values y < 0.1 (Fig. 8a), where the phase boundary is very irregular. Nevertheless, these results demonstrate
very clearly the proposition that the reaction is controlled by a two-dimensional phase boundary between y = 0.1 and 0.8 at high temperatures, with an alternative mechanism at lower temperatures and early stages (y < 0.1). The tabular morphology of the goethite, the formation of flakes on grinding and the strong relationships between crystallo- graphic structure and pore orientation also suggest a planar rather than spherical interface. The results also show why finer-grained goethites, with a higher surface area to volume ratio, dehydrate more quickly although the mechanism is the same. They also suggest that fibrous goethites, with the needle axis parallel to the crystallographic c axis, may dehydrate differently.
Above y = 0.8 a sharp decrease in reaction rate was noticed in the kinetic plots. At this point the central core of goethite is prevented from dehydrat- ing and the escape of water is blocked by the increasing pressure of water trapped in the outer voids which stabilises the transformation.
The kinetic results suggest a change in the rate-determining step at early stages, which becomes more apparent at lower temperatures. This initial stage in the reaction represents the formation of a skin of hematite on the grains and the energetics of creating the initial porous product. The mechanism proposed for these early stages is one of short-range proton/iron transfer across the pore boundaries. Formation of the reaction inter- face involves the creation of ~ 36 A spaced pores within the close-packed planes, accompanied by the release of water causing a 30~ volume decrease, and the formation of hematite twin crystallites on a scale of 50 A. The release of water takes place by the short-range migration of H + ions from within the G[001] channels to form O H - ions, which then coalesce and are released as water from within the pores. The porous microstructure is formed almost immediately and creates new surfaces from which dehydration can occur. The Fe 3 + vacancies which occur as a result of the removal of water are filled by iron atoms which migrate locally within the lattice to form the Fe ordering of hematite. At higher temperatures this takes place more readily, and the rate-determining step is the rate of progression of the interface and not the rate of formation of the interface.
The kinetics for the early stages of reaction indicate a diffusion mechanism, which could refer to O H - ion migration. The Ea increases with decreasing size in this region indicating that the mechanism is grain-size dependent, i.e. formation of the initial skin of hematite is dependent on surface area. For the main part of the transforma- tion, y = 0.1 to 0.8, the progression of the phase boundary is independent of size, and activation

G O E T H I T E - H E M A T I T E T R A N S F O R M A T I O N 449
energies do not vary within grain size within experimental error.
The microstructural evidence suggests that the transformation mechanism of the recent sedi- mentary goethite is identical to that of the ore mineral.
Changes in goethite lattice parameters have been seen by other workers, for example Lima-de-Faria (1963) and Schwertmann (1984), who both propose that an intermediate goethite structure is formed. This is not the correct reason for the lattice parameter changes. The transformation proceeds by the direct dehydration of goethite to hematite and the lattice parameter changes that occur are produced by the cell volume change on the forma- tion of hematite (i.e. Table 1). The transformation does not take place by the continuous development of hematite from goethite via an intermediate phase.
The mechanism proposed here must be con- trasted with that suggested by Ball and Taylor (1961) for brucite and by Lima-de-Faria (1963) for the whole goethite transformation. The TEM evi- dence presented here (Figs. 5 to 10) is supported by the results of Watari et al. (1979, 1983) who observe a similar microstructure under the microscope. The experiments of Watari et al. (1983) were confined to beam heated specimens. The mechanism of Lima- de-Faria (1963) involved the long-range migration of ions (protons and irons) to donor and acceptor regions and the formation of an intermediate phase which consisted of a sinusoidal modulation of iron atoms within a slightly distorted lattice. In the present study a wider range of samples was studied at different temperatures and y values, resulting in the conclusion that the mechanism is dependent on T and y.
Goethites in the environment. The various path- ways of formation of hematite from goethite and the different morphologies of the original goethite mean that different mechanisms of transformation may occur in different environments, leading to different activation energies, and hence different time scales of dehydration.
The kinetic, TEM and crystallographic evidence presented here define a transformation mechanism. Experiments were conducted on a pure, coarse- grained, well crystalline stoichiometric goethite, and dehydration was carried out under dry nitro- gen at one atmosphere on a loosely-packed powder. Clearly, conditions are not analogous to those in sedimentary rocks. Experiments on the fine-grained, sedimentary goethite, although complicated by excess structural water, show the development of a similar microstructure. The smaller activation energy for this goethite may be due to a difference in grain size, but it is not realistic to compare both
goethites on these grounds as they have different degrees of structural water and crystallinity. The lower activation energy may just reflect the lower degree of crystallinity, confirming the results of Keller (1976), or it may be due to the effects of excess water in the structure. Indeed, the cause may not be simple: fine-grained goethites are generally less crystalline and contain greater amounts of adsorbed water.
Goethites in the natural environment have dif- ferent grain sizes, shapes, varying degrees of crystal- linity and excess water. Aluminium for iron substitution, up to 30~o, is often encountered in soil and clay goethites. It has been proposed in the literature that several types of goethite exist and these have been divided according to A1 content (Shulze, 1982; Fey and Dixon, 1981), size (Murad, 1979), crystallinity (Keller, 1976) and length of G[001] chains (van Oosterhout, 1965). It is more likely that a continuous range of goethites exist, and the variation in thermal analysis (particularly DTA) and kinetics observed in the literature reflects changes in reaction rate with (a) properties such as amount of A1 substitution, water content, shape, crystallinity and (b) experimental conditions, such as water-vapour pressure, temperature, heat- ing rates and packing factors. Direct comparisons between natural and synthetic goethites cannot be made; synthetics rarely contain stoichiometric amounts of water, often giving up to 15~ total weight loss, and can easily acquire impurities during preparation.
Many goethites are acicular, the needle axis of the grain being parallel to the c-parameter of the structure. Due to the close relationship between reaction interface, cleavage plane (and hence plane of grain surface) and pore orientation, one would expect different kinetic results for fibrous and prismatic goethites.
Early thermal work concentrated on the de- hydration of goethite gels which are poorly crystal- line and contain a large amount of extra water. Geith (1952) and Derie et al. (1976) observed two DTA peaks using goethite made from gels. Schwertmann (1984) explains the appearance of two peaks by appealing to the crystallinity of the original goethite and suggests that two peaks are observed if the goethite is highly crystalline; other- wise only one is seen. The second of the two peaks he calls a 'high-temperature peak'. No mention of the water content of goethites is made by Schwert- mann (1984). Poorly crystalline, fine-grained, fibrous and synthetic goethites all carry excess water to varying degrees. A more plausible ex- planation of the double peak is the presence of excess water, which is driven off early in the transformation. Double DTA and DTG peaks can

450 C . J . GOSS
therefore be explained in terms of non-stoichio- metric amounts of water in the goethites.
Water-vapour pressure is an important control on the reaction, both thermodynamically (Lang- muir, 1971) and kinetically (Garcia-Gonzalez et al., 1975; Thrier-Sorel et al., 1978). In this study, the sharp decrease in reaction rate above 80% trans- formed was attributed to the increase of water- vapour pressure in the pores. The retention of water within the porous structure may be a key factor in determining reaction rates, and in this respect the scale of the porous microstructure produced will be important. No change in pore size with tempera- ture was observed for the goethites of this study. Wilson et al. (1980) observe a dependence of pore size with water-vapour pressure for boehmite but no change in size with temperature, and a similar relationship may be true for goethite. Although a change in microstructure may occur with Pn2o, thus affecting reaction rates, the transformation mechanism may remain the same.
At ambient temperature the transformation will take place continuously in the presence of water, and the effects of water-vapour pressure will ob- viously be very important. Extrapolation of reaction rates to geological conditions using an empirical E, is dependent on assuming that the same reaction mechanism operates at the tempera- tures of the experiments and at ~ 25 ~
Conclusions
(1) The transformation mechanism is phase- boundary controlled at high temperatures, the reaction interface being almost planar. The mechanism is more complex at lower temperatures and at early stages, where proton/iron transfer at the reaction interface controls the transformation. The reaction occurs directly from goethite to hematite over a very small area and proceeds by boundary advance. An intermediate phase is not produced. This conclusion was obtained from a TG, TEM, and XRD analysis of a pure, natural, coarse-grained goethite. Evidence from a recent sedimentary goethite suggests that the same mechanism operates.
(2) The kinetics and activation energy for the transformation are found to depend upon tempera- ture and y, and may be dependent on sample size, shape, PH2o and degree of excess water in the original material. For the main part of the trans- formation, and at higher temperatures of dehydra- tion, an Ea of 169+8 kJ/mole was obtained for the ore mineral and 154-t-15 kJ/mole for the sedimentary goethite. Properties such as the size, shape, synthesis, crystallinity, and amount of excess water (adsorbed and structural) carried by goethites
are not independent and the question of the double DTG peaks is resolved by consideration of the wide variety ofgoethite characteristics, especially that of excess water.
(3) Experimental conditions obviously do not reproduce those in natural sediments. Nevertheless this paper defines a transformation mechanism new to the literature and the results form a sound basis on which to model the reaction under geological conditions if attention is paid to important factors such as grain size, shape, crystallinity, excess struc- tural water, and also environmental controls such as temperature, water-vapour pressure, and the presence of surrounding water.
Acknowledgements
The author wishes to thank Dr Andrew Putnis for helpful suggestions and review of the manuscript. The work was carried out under receipt of a NERC studentship.
References
Ball, M. C., and Taylor, H. F. W. (1961) Mineral. Mag. 32, 754 66.
Bla~ek, A. (1973) Thermal Analysis, van Nostrand, Lon- don.
Brindley, G. W., and Brown, G. (1980) Crystal Structures of Clay Minerals and their Identification, Mineralogical Society, London.
Brown, M. E., Dollimore, D., and Galwey, A. K. (1980) Comprehensive Chemical Kinetics. Elsevier, Amsterdam. vol. 22.
Burke, J. (1965) The Kinetics of Phase Transformations in Metals. Pergamon Press, Glasgow.
Coats, A. W., and Redfern, J. P. (1964) Nature 201, 66-9.
Cornell, R. M., and Mann, S. (1983) J. Chem. Soc. Faraday Trans. 1, 79, 2679-84.
Criado, J. M., Ortega, A., Real, C., and Torres de Torres, E. (1984) Clay Minerals, 19, 653 61.
Derie, R., Ghodsi, M., and Cairo-Roche, C. (1976) J. Therm. Anal. 9, 435-40.
Fey, M. V., and Dixon, J. B. (1981) Clays Clay Minerals, 29, 91 100.
Galwey, A. K. (1982) In Thermal Analysis (Miller, B., ed.) Wiley and Sons, 38-53.
Garcia-Gonzalez, M-L., Grange, P., and Delmon, B. (1975) C.R. Acad. Sci. Paris 280, 1439-41.
Geith, M. A. (1952) Am. J. Sci. 250, 677 95. Keller, P. (1976) Neues Jahrb. Mineral. Mh. 115 27. Langmuir, D. (1971) Am. J. Sci. 271, 147 56.
(1972) Ibid. 272, 972. Lima-de-Faria, J. (1963) Z. Kristallogr. 119, 176 203. Murad, E. (1979) Mineral. Mag. 43, 355-61. Murray, J. W. (1979) In Marine Minerals (Burns, R. G.,
ed.) Mineral. Soc. Am. 49-98. Pollack, J. B., Pitman, D, Khare, N., and Sagan, C.
(1970a) J. Geophys. Res. 75, 7480-90. Wilson, R. N., and Goles, G. G. (1970b) Ibid. 75,
7491 500.

G O E T H I T E H E M A T I T E T R A N S F O R M A T I O N 451
Schulze, D. G. (1982) Ph.D. Thesis, Tech. Univers. M/inchen.
Schwertmann, U. (1984) Thermochim. Acta, 78, 39 46.
Thrierr-Sorel, A., Larpin, J-P., and Mougin, G. (1978) Annal. Chim. 3, 305-15.
van Oosterhout, G. W. (1965) Proc. 5th Int. Conf. Mag- netism Nottingham 1964 (Phys. Soc. London, 1965) 529-32.
Watari, F., van Landuyt, J., Delavignelle, R., and
Amelinckx, S. (1979) J. Solid State Chem. 29, 137 50, 417 27.
and Igata, N. (1982) Phys. Stat. Sol. 73, 215-24.
(1983) J. Solid State Chem. 48, 49-64. Wilson, S. J., McConnell, J. D. C., and Stacey, M. H.
(1980) J. Mat. Sci. 19c, 3081-90.
[Manuscript received 22 January 1986; revised 11 September 1986]