the kingdom of eswatini voluntary national review 2019 report€¦ · non-agriculture sector...
TRANSCRIPT
i
THE KINGDOM OF ESWATINI
VOLUNTARY NATIONAL REVIEW
2019 REPORT
‘
Ministry of Economic Planning and Development
June 2019
OPENING STATEMENT
‘Empowering people and ensuring inclusiveness and equality’’

ii
Eswatini is highly committed to the implementation of the Sustainable
Development Goals (SDGs) Agenda 2030 and African Union Agenda 2063. The
substance and objective of SDGs are in line with Vision 2022 contained in the
National Development Strategy (NDS) and Strategy for Sustainable and Inclusive
Growth 2030 (SSDIG). Furthermore, it is aligned to the Strategic Roadmap
earmarked for economic recovery and the National Development Plan 2019/20 –
2021/22. Eswatini committed itself together with all countries to jointly implement
SDGs as essential measures to eradicate poverty, promote shared prosperity and
improve environmental quality. Issues of poverty, welfare, and environmental
quality are a shared challenge to be faced globally as one.
Therefore, one of the main necessary conditions to achieve SDGs is an enabling
policy environment that should be created jointly: a global peace, security and
stability. Goals, targets, and indicators of SDGs that have been agreed are a
continuation and expansion of Millennium Development Goals (MDGs) that were
implemented in 2000-2015. Eswatini successfully achieved 5 out of 8 goals by the
end of 2015. The country was on track on the following MDGs: achieve universal
education (MDG 2); promote gender equality and promote women (MDG 3);
combat HIV/AIDS, malaria and other diseases (MDG 6); ensure environmental
sustainability (MDG 7); and develop a global partnership for development (MDG
8). The country needed to accelerate progress in the following MDGs: end poverty
and hunger (MDG1); reduce child mortality (MDG 4); and improve maternal
health (MDG 5). Indicators that were not achieved in the MDGs era were
considered as an unfinished agenda that is being implemented as SDGs.
The government of Eswatini is committed to become one of the leading pioneers
and role models to achieve SDGs in Africa. The country has mainstreamed Agenda
2030 and Agenda 2063 into its National Development Strategy and National
Development Plan. The institutional arrangement to implement SDGs involves
technical working team and the steering committee. Members of the technical
team are representatives of government, business society, civil society
organizations, academics and experts to ensure inclusiveness and no one left
behind principles. This inclusive set up is to develop national ownership and is
implemented at national and constituency levels. The SDGs secretariat is under
the Ministry of Economic Planning and Development (MEPD).
The SDGs metadata was very instrumental in guiding stakeholders on the
definition of each goal and method of computing indicators to assure comparability
among regions, and ensure no one leave behind principle is in place. Furthermore,
a communication strategy was prepared to create awareness, interest, and

iii
commitment to promote participation of all parties and public engagement to
implement SDGs.
Eswatini has adopted the 2019 VNR theme of "empowering people and ensuring
inclusiveness and equality’’. In preparing the VNR, participation platforms for
different stakeholders were considered namely: persons living with disabilities,
women, youth, academia, civil society, development partners, government
ministries, non-governmental organisations and private sector,
As one of the countries committed to SDGs, Eswatini has an obligation to eradicate
extreme poverty by 2030. Based on the Eswatini Household income and
Expenditure Report 2017, the proportion of people living below the international
poverty line is 58.9% and this is more pronounced in rural area with about 70%
affected persons. Based on the current performance, various integrated efforts are
needed to achieve zero poverty and economic prosperity as the basis for
sustainable economic growth by 2030.
The 2019 VNR reports on 10 goals these are the national priorities and some of
the high level political forum priorities. This includes SDG 1 - no poverty SDG 2 -
zero hunger; SDG 3 - health and wellbeing; SDG 4 - quality education; SDG 6 -
clean water and sanitation; SDG 7- affordable and clean energy; SDG 8 - decent
work and economic growth; SDG 9 - innovation, infrastructure and
industrialization; SDG13 - climate action; SDG16 - peace, security and justice for
all; SDG 17 - partnerships for the goals. The inability to end poverty is considered
as the primary cause of economic instability thus addressing the above dimensions
of poverty will enhance people’s welfare and bring stability.
The overall assessment shows that the country has provided an enabling policy
environment for all sectors and has adhered to Sustainable Development
Conventions such as the Paris Agreement and Sendai Framework for Disaster
Risk Reduction. However, providing the enabling policy environment was not
sufficient to achieve targets. Challenges were faced with implementing goal 10
(reduce inequality within and among countries) and goal 12 (ensure sustainable
consumption and production patterns). Development of the 10-year framework of
programmes on sustainable consumption and production patterns is envisaged to
guide the implementation of goal 12. Institutional strengthening on resources and
data collection will enable timely and accurate reporting on the Sustainable
Development Agenda 2030. Moreover, the government is also continuing to
improve basic services and productive economic programmes to increase
sustainable economic livelihood.

iv
I hope this report will provide understanding and valuable insights of Eswatini’s
experience in conducting SDGs, and the country is open to share and exchange

v
EXECUTIVE SUMMARY
The review process
The review process for the Voluntary National Review was participatory in nature.
It consisted of generating views from a broad spectrum of stakeholders, these
included, academia, business community, civil society organisations, development
partners, government ministries, non-government organisations, persons living
with disabilities, women and the youth. This was complemented by a desk review
on existing sector policies, programmes and external assistance.
Status of the goals
SDG1: End poverty in all its forms everywhere
The proportion of population living below the poverty line improved from 63% in
2010 to 58.9% in 2017. Poverty is most pronounced in rural areas at 70.2% than
urban area 19.6% (2017) and in males 67% than females 59.4% and is highest in
the Shiselweni and Lubombo regions at 71.5% and 67.3% respectively (2017).
SDG 2: End hunger, achieve food security and improved nutrition and promote
sustainable agriculture.
The country undertook a Zero Hunger Strategic Review in 2018 to analyse the
current food and nutrition situation, as well as to identify strategies and
programmes for ending hunger by 2030. The prevalence of stunting among
children under 5 years of age has declined from 25.5% to 19.9% meaning the
country is now within the world food security requirement of below 20%, however
more effort needs to be done to achieve a single digit percentage.
SDG 3: Ensure healthy lives and promote well-being for all at all ages.
The maternal mortality rate indicate a decline from 593/100,000 in 2012 to
474/100,000 in 2018 which reflects a small and slow decline if the country is to
meet the target of 120/100,000 maternal deaths in 2022. Also of concern is the slow
decline in the under 5 mortality rate which was 80 per 1000 in 2012 and fell to 67
per 1000 live births in 2018. Prevalence in HIV/AIDS, malaria and tuberculosis
have stabilised, however, the country is experiencing an increase in non-
communicable diseases which resulted in about 12% of deaths between 2013 and
2017.
SDG4: Ensure inclusive and equitable quality education and promote lifelong
learning opportunities for all.
The country introduced free primary education programme as a means to ensure
that all children have equal access to quality primary education. As a result, the
proportion of children that completed primary education increased from 93.5 % in

vi
2014 to 106.1 % in 2016 and secondary education increased from 49.6% to 61.5 %
respectively. The national literacy rate was 95.3% for women and 91.8 % for men
in 2014.
SDG 6: Ensure availability and sustainable management of water and sanitation
for all.
The national coverage of nationally managed water resources for households is
was 72% in 2014 which is disaggregated by 96% urban population and 63% rural
populace. The increase in access to clean water in rural areas was promoted by the
establishment of micro water schemes in communities. The proportion of
population using safely managed sanitation services, at national level was 53%
which comprises of 78% in the rural areas and 94% in urban populace. However,
there are discrepancies between coverage and access to the services.
SDG 7: Ensure access to affordable, reliable, sustainable and modern energy for
all.
The Rural electricity programme increases access to clean energy for people living
in both urban and rural areas. The proportion of household with access to
electricity nationally increased from 69% in 2014 to 78% in 2018.
SDG 8: Promote sustained, inclusive and sustainable economic growth, full and
productive employment and decent work for all.
There was an increase of about 10% in the proportion of informal employment in
non-agriculture sector nationally when comparing the 2013 and 2016 Labour
Force Survey reports, from 54.3% in 2013 to 65.2% in 2016. The Financial
Inclusion Strategy (2016) has improved access to finance for MSME including
informal sector.
SDG 13: Take urgent action to combat climate change and its impacts.
The country developed the National Climate Change Policy and Strategy 2016, the
National Climate Change Strategy and Action Plan (2014-2019). In addition, the
National Disaster Risk Reduction Policy and National Resilience Strategy and
Disaster Risk Reduction Plan of Action (2017 – 2021) was developed.
SDG16: Promote peaceful and inclusive societies for sustainable development,
provide access to justice for all and build effective, accountable and inclusive
institutions at all levels.
Eswatini has very insignificant cases of conflict-related deaths of about 0.0017%.
The Number of victims of intentional homicide per year in the country increased from 112
in 2016 to 123 in 2018 which is an increased by 8.9%. There is evident increase in

vii
domestic related abuse, reported cases of abuse increased from 7729 in 2015 to
10504 in 2016 this is an increase by 26.4%.
SDG17: Strengthen the means of implementation and revitalize the Global
Partnership for Sustainable Development.
The Aid Policy of 2000 was revised and finalised to inform development of the
National Development Cooperation Policy 2019. This will serve as a guide to all
relevant agencies of Government, development partners, civil society
organizations and other stakeholders on coordination and management of
development cooperation resources.
Challenges
SDGs implementation is based on the principle that domestic resources should be
utilized not necessarily dependent of foreign resources particularly financial
resources. The prevailing fiscal situation in the country is such that there are very
limited resources for effective implementation. Research by its nature is expensive
and so are the studies or surveys that need to be undertaken. The studies compete
for resources with other priorities for the country resulting in time lags for
availability of the much needed and critical data.
Areas for support is requested for:
a) Monitoring the SDGs implementation – need for surveys
(Economic Census, Educational Census, Health Statistics, Multiple
Indicator Cluster Survey, Labour Force Survey, Inter-censal, VAC,
Eswatini Household Income and Expenditure Survey).
b) Capacity building in SDGs based planning and programming.
c) Investment in infrastructure (education, water & sanitation, fuel and
energy, ICT, road network).
d) Resources for SDGs implementation
Lessons learnt
Implementation of the SDGs requires that they be mainstreamed into national
development frameworks. They are not a stand-alone phenomenon but are a
means of fast tracking implementation of national development programme as
such should be integrated to foster efficiency.

viii
TABLE OF CONTENTS
Executive summary………………………………………………………………….….…v
List of Figures & Tables……………………………..………………………….……..…ix
Acronyms……………………………………………………………………………………x
CHAPTER 1: ........................................................................................................................ 1
Introduction ......................................................................................................................... 1
CHAPTER 2: ........................................................................................................................ 3
Methodology And Process For Preparation of The Review ................................................ 3
CHAPTER 3: ........................................................................................................................ 4
Policy and Enabling Environment ...................................................................................... 4
CHAPTER 4 ....................................................................................................................... 11
PROGRESS MADE IN THE IMPLEMENTATION OF SDGs ......................................... 11
SDG 1: No Poverty……………………………………………………..…………………………………………………………12
SDG 2: Zero hunger, .......................................................................................................... 16
SDG 3: Health and Wellbeing. ........................................ Error! Bookmark not defined.
SDG 4: Quality education and lifelong learning ............................................................... 27
SDG 6: Clean water and sanitation . ................................................................................ 32
SDG 7: Affordable and clean energy. ................................................................................ 34
SDG 8: Decent work and economic growth, .................... Error! Bookmark not defined.
SDG 9: Innovation, infrastructure and industries .......................................................... 42
SDG13: Climate action. ..................................................................................................... 46
SDG 16: Peaceful societies and justice for all .................................................................. 49
Goal 17: Partnership for the goals ................................................................................... .53
CHAPTER 5: CHALLENGES……………………..……………………………………….…….57
CHAPTER 6: LESSONS LEARNT…………………………..……………………………….…59
CHAPTER 7: CONCLUSION............................................................................................ 60

ix
LIST OF FIGURES AND TABLES
Figure 1.1: Proportion of population living below the poverty line
Figure 1.2: Population covered by social protection programme
Figure 2.1: Proportion of undernourished children under 5 years
Figure 2.2: Prevalence of stunting among children under 5 years
Figure 3.1: Mortality from non-communicable diseases
Figure 4.1: Proportion of children that complete primary and secondary education.
Figure 4.2: Number of youth and adults in formal and non-formal education.
Figure 6.1: Proportion of population with access to clean water
Figure 6.2: Population using safe sanitation services
Figure 7.1: Proportion of household with access to electricity
Figure 8.1: Annual growth rate of real GDP per sector
Figure 8.3: Working population by age and sex
Figure 9.1: Proportion of gazetted road network accessible all year round
Figure 16.1: Annual number of reported cases of violence
Figure 16.2: Proportion of seized small arms and light weapons
Figure 17.1: Net official development assistance received by Eswatini
Tables
Table 2.3: Annual agricultural statistics
Table 2.6: Plant and Animal Species
Table 3.1: Prioritisation Matrix
Table 4.1: Population with a given level of education proficiency
Table 8.1: Unemployed persons by Sex and Age
Table 9.1: Passenger and freight volumes, by rail and air transport
Table 16.1: Number of victims of intentional homicide

x
ACRONYMS
ACMS : Aid Coodination Management Services
AEC : Annual Education Census
AOI : Agriculture Orientation Index
AU2063 : African Union Development Agenda 2063
CBS : Central Bank of Swaziland
CRD : Chronic Respiratory Disease
CSO : Central Statistical Office
CSOs : Civil Society Organisations
DHS : Demographic and Health Survey
DPMO : Deputy Prime Minister’s Office
DWA : Department of Water Affairs
ECB : Elections and Boundaries Committee
ECCE : Early Childhood Care and Education
EHD : Environmental Health Department
EMIS : Education Management Information System
ERS : Economic Recovery Strategy
FDI : Foreign Direct Investment
FPE : Free Primary Education
FSE&CC : Federation of Swaziland Employers and Chamber of Commerce
FSRA : Financial Services Regulatory Authority
GBV : Gender Based Violence
GDP : Gross Domestic Product
GFICC : Gender and Family Issues Coordination Council
GHG : Green House Gases
HIV : Human Immune Virus
IAPS : Invasive Alien Plant Species
ICAO : International Civil Aviation Organization
ICT : Information and Communication Technology
IUCN : International Union for Conservation of Nature
IRM : Investor Road map
IWRM : Integrated Water Resource Management
LFS : Labour Force Survey
M & E : Monitoring and Evaluation
MCIT : Ministry of Commerce, Industry and Trade
MDGs : Millennium Development Goals
MEPD : Ministry of Economic Planning & Development
MFU : Micro Finance Unit
MHUD : Ministry of Housing and Urban Development
MICS : Multiple Indicator Cluster Survey
MNRE : Ministry of Natural Resources and Energy
MOA : Ministry of Agriculture
MOE : Ministry of Education

xi
MOF : Ministry of Finance
MOH : Ministry of Health
MOLSS : Ministry of Labour and Social Security
MOPS : Ministry of Public Service
MOPWT : Ministry of Public Works and Transport
MPs : Members of Parliament
MTAD : Ministry of Tinkhundla Administration Development
MTEA : Ministry of Tourism and Environmental Affairs
MTN : Mobile Telecommunications Network
NBAP : National Biotechnology and Action Plan
NCDs : Non-Communicable Diseases
NDMA : National Disaster Management Agency
NDS : National Development Strategy
NERCHA : National Emergency Response Council on HIV/AIDS
NGO : Non-Governmental Organisation
NHIP : National Health Insurance Policy
NTD : Neglected Tropical Diseases
ODA : Official Development Assistance
PRMED : Poverty Reduction Monitoring and Evaluation Division
R&D : Research and Development
SACMEQ: Southern and Eastern Africa Consortium for Monitoring
Educational Quality
SACRO : Swaziland Association for Crime Prevention and
Rehabilitation of Offender
SAM : Service Availability Mapping
SDG : Sustainable Development Goals
SEA : Swaziland Environmental Authority
SEC : Swaziland Electricity Company
SERA : Swaziland Electricity Regulatory Agency
SEDCO : Swaziland Enterprises Development Company
SHIES : Swaziland Household Income and Expenditure Survey
SHIMS : Swaziland HIV incidence Measurement Survey
SMME : Small, Medium and Micro Sized Enterprises
SNL : Swazi National Land
SNTC : Swaziland National Trust Commission
SRA : Swaziland Revenue Authority
SRH : Swaziland Reproductive Health Service
STA : Swaziland Tourism Authority
SWADE : Swaziland Agricultural and Development Enterprise
SWSC : Swaziland Water Services Corporation
TWT : Technical Writing Team
UNDP : United Nations Development Programme
UNESCO : United Nations Education Scientific and Cultural Organisation
UNFPA : United Nations Population Fund
UNICEF : United Nations Children’s Fund
xii
VAA : Vulnerability Assessment and Analysis
WASH : Water, Sanitation and Hygiene for All
WFP : World Food Programme

1
CHAPTER 1: INTRODUCTION
The Kingdom of Eswatini is located in the Southern Hemisphere. It is bordered by
Mozambique to its northeast and South Africa to its north, west and south. It is
one of the smallest countries in Africa with a size of about 17,363 square
kilometres, of which 160 square kilometres is water. Climate is transitional
between subtropical and tropical and about 75 percent precipitation falls from
October to March. The climatic conditions range from sub-humid temperate in the
Highveld to semi-arid in the Lowveld. The country is endowed with a number of
natural resources including arable land, minerals and water. Bulembu is the
highest mountain wand peaks at 6,109ft and the largest river is the Great Usuthu
River which is transboundary.
The population is primarily ethnic and the language used is siSwati in the native
form. The latest population census estimates the population to be about 1,093,238
persons, of which about 53 percent are women. Approximately 44 percent of the
population is under 15 years of age while 4 percent is aged 65 years or older. The
majority (79%) of the population lives in rural areas and is dependent on
subsistence farming.
The current economic situation is characterised by declining economic growth; a
narrowing revenues base coupled with rising expenditures that are resulting in
increasingly large fiscal deficits; stagnant private sector activities; deepening
poverty; infrastructure development which is not yet bearing dividends, while on
the other hand there is old infrastructure in deteriorating conditions; and poor
public sector performance and service delivery, to mention some of the challenges.
The government acted promptly by producing a Strategic Roadmap for economic
recovery and re-introduced National Development Plan to set priorities, guide
policy development and national budgeting. It places the priorities as good
governance focused on fiscal stability, inclusive and sustainable growth driven by
private sector development, investments in human capital development, poverty
reduction, efficiencies in public sector service delivery and national stability.
Government reviewed its National Development Strategy of 1997 for the first time
to understand what the country had achieved since 1997, the challenges that have
limited progress towards attaining some of the targeted goals and to reprioritise
given the changing domestic, regional and global environment. This birthed the
Strategy for Sustainable Development and Inclusive Growth (2017) which has
mainstreamed the SADC Agenda 2025, African Union Agenda 2063 and the
United Nations Sustainable Development Agenda 2030. The Sustainable
Development Agenda was launched in June 2016 and a technical team of sector

2
experts was established to domesticate and populate the goals, targets and
indicators. The development of an automated system to monitor implementation
of the agenda was commenced.
The Sustainable Development Goals were interpreted into the local language,
targets and indicators were reviewed and localised by the technical team in 2017.
Sensitization on the SDGs agenda was a very lengthy process conducted at
national, regional and constituency levels. To ensure inclusiveness, a cross-section
of stakeholders were strategically invited. These included chiefs/traditional
leaders, youth, women, men, various cultural regiments, the business community,
academia, people living with disabilities, religious groups, regional development
teams, Non-Governmental Organisations, local governments, government
ministries, and bilateral and multilateral organisations.
The localized SDGs framework was populated by sector expects (SDGs Technical
team) to inform the SDGs baseline report in 2017. Data for populating the SDGs
indicators was solicited from various national reports from various sections of
government and parastatals. Most indicators were sourced from the Multiple
Indicator Cluster Survey of 2014, The External Assistance Annual Reports, the
Eswatini Household Income and Expenditure Survey of 2018 and government
ministries’ annual statistical reports.
Government has put in place the National Climate Change Policy and Strategy of
2016 in line with the Paris Agreement on Climate Change. Furthermore, the
country submitted its third National Communication Plan of 2016 to the United
Nations framework Convention on Climate Change (UNFCC) and is currently
finalizing the fourth national communication plan.
The country developed the National Resilience Strategy and Disaster Risk
Reduction Policy and Action plan of 2017 – 2021. The developed robust monitoring
and warning Multi Hazard Early Warning system is operational and well
disseminated throughout the country. Hence the country is aligned to the priorities
of the Sendai Framework for Disaster Risk Reduction aimed at reducing global
disasters.

3
CHAPTER 2: METHODOLOGY AND PROCESS FOR
PREPARATION OF THE REVIEW
The process was two pronged with stakeholder consultations and desk reviews. A
tool for primary data collection was developed for stakeholders’ contribution on
the progress made in implementation of the goals.
Consultations were conducted in two levels: special groups and technical working
groups (TWG). The special groups were composed of civil society organisations, the
United Nations family and development partners, the private sector
organisations, and special groups (men, women, youth and persons living with
disabilities representatives). Technical working groups were clustered into four
categories namely: Social (SDG 3,4,5 & 16), Poverty (SDG 1,2,10), Economic (SDG
8,9,12,17) and Environmental goals (SDG 6,7,11,13,14,15).
The desk review involved consultations with various ministries and parastatals
who had to populate the implementation progress on the SDGs matrices. The
outputs were co-ordinated and consolidated by the Ministry of Economic Planning
and Development.
.

4
CHAPTER 3: POLICY AND ENABLING ENVIRONMENT
a) Creating ownership of the Sustainable Development Goals.
Consultations:
Advocacy on the Agenda 2030 was carried out through consultations which were
conducted at the national and regional levels according to thematic areas. These
consultations involved participation of a broad spectrum of stakeholders, i.e.
representatives from government, local government civil society, private sector,
media, focused groups, traditional leaders (chiefs), women’s groups, disabled,
youth, various regiments, business community, regional development teams
(RDTs) and constituency development teams (CDT). This process informed the
stakeholders of the new development agenda and their roles in the
implementation of the agenda.
IEC material:
The SDGs were translated into the local language, siSwati, to ensure involvement
and understanding of all levels of stakeholders in the country. This further
necessitated the need to develop promotional material to be used during
sensitization campaigns. These included folders, pens, key-rings, posters, flyers
and a wall banner on the 17 SDGs in the shortened version printed in both
languages, English and siSwati.
Prioritisation of SDGs:
Faced with limited resources, there is strong need to prioritize development issues
and efforts to attain maximum results in a cost-effective manner considering
multiplier effects and means of implementing the goals. The country prioritized
and ranked the SDGs giving due attention and consideration to domestic
contextual realities and future development potentials. Special attention was
given to objective realities prevailing in the country particularly perceived
national focus areas for development and prevailing development gaps. In
addition, consideration was given to challenges, potential for development and
promotion of human development dynamics when prioritizing the SDGs.
The prioritised goals for the medium term were:
SDG 8 : Promote sustained, inclusive and sustainabe economic growth, full
and productive employment and decent work for all.
SDG 2 : End hunger, achieve food security and improved nutrition and
promote sustainable agriculture.
SDG 4 : Ensure inclusive and equitable quality education and promote
lifelong learning opportunities.
SDG 3: Ensure healthy lives and promote well-being for all at all ages.

5
SDG 6 : Ensure availability and sustainable management of water and
sanitation for all.
SDG 7 : Ensure access to affordable, reliable, sustainable and morden
energy for all.
SDG 9 : Build resilient infrastracture, promote inclusive and sustainable
industrialization and foster innovation.
Including SDGs 1 : no poverty and 13: climate action
These SDGs had potential for overal growth including possibilities for generating
better backward-and forward linkages, diversification of economic base and
domestic supply capacity, export and trade promotion
The SDGs were classified into three groups: the ‘prioritised’ which are the main
focus for the country in the medium term; ‘enablers’ is the ideal environment or
conditions for the implementation and achievement of other SDGs, ‘cross-cutting
issues’ as areas for integration in implementation of the goals.
The SDGs prioritization process resulted in the following tabular presentation;
Table 3.1: Prioritisation Matrix
PRIORITISED GOAL CROSS CUTTING ISSUES ENABLERS
2. Zero hunger 1. No poverty 10. Reduced inequalities
3. Good health and well-being 5. Gender equality 13. Climate action
4. Quality education 11. Sustainable cities and
communities
14. Life below water
6. Clean water and
sanitation
12. Responsible consumption
and production
15. Life on land
7. Affordable and clean
energy
16. Peace justice and strong
institutions
8. Decent work and economic
growth
17. Partnership for the goals
9. Industry innovation and
infrastructure
1. No poverty
13. Climate action
Domestication of SDGs Indicators:
The prioritization process led to the domestication of the indicators where the
targets and indicators were reviewed in the local development context using the
following groupings;

6
i. Poverty sectors (Goals 1, 2, 10),
ii. Social sectors (Goals 3, 4, 5, 16),
iii. Environment (Goals 6, 7, 11, 13, 14, 12, 15), and
iv. Economy sector (8, 9, 17).
b) Incorporation of the Sustainable Development Goals in national
frameworks.
The process of Agenda 2030 coincided with the review of the country’s development
framework, National Development Strategy (NDS) and Vision 2022, which
presented an opportunity for integration of the agenda and other emerging
development issues.
The NDS was reviewed and updated embrassing the principles of sustainable
development fostering good alignment between the NDS targets and the SDGs
targets. The National Development Plan details priorities for the country in the
medium term for the Implementation of the NDS. This entails integration of the
goals and targets into national and sectoral policies, strategies and plans.
Challenges
Implementation of SDGs has been faced with challenges in the country. The fiscal
challenges have resulted in limited resources available for implementation of
programmes. There is declining support for development in the country in terms
of ODA. The Middle Income country status which has resulted inability to access
concessional loans.
Availability of timely and quality data to inform programming affected the
performance in monitoring of indicators. Statistics is important to inform
planning, programming and budgeting. Its production is costly and competes with
other priorities of the country resulting in time lags for availability of updates on
data. This compromises the impact of initiatives that are put in place to address
the development challenges.
Limited capacity for effective implementation of the goals at different levels.
Implementation of the goals has to be visible at grassroot level through the
forward and backward linkages between the national and grassroots levels. The
flow should be from the national level, to the regionl level (sub-national level),
local government, constituency and chiefdom levels. Capacities at the levels below
the national level is very limited and needs strengthening.
Involvement of the private sector in development is another challenge. The
country is a small economy and government is the main actor in development. This
has resulted in crowding out of the private sector as its participation in
implementation of the goals is very limted .

7
Advocacy on the SDGs as some stakeholders are still not fully convesant with the
issue of the goals. There is need to have continous sessions and programmes on
the goals to eventually get everyone on the same level of understanding of the
concept in particular their roles and responsibilities.
c) Integration of the three dimensions.
The three dimensions of sustainable development namely economic, social and
environmental have been integrated into development in the country. Priorities
for the country include ensuring economic development, strengthening of the
social sector and promoting environmental sustainability.
Economic development: initiatives to improve availability of resources through
strengthened tax collection, strengthening of Eswatini Revenue Authority (ERA),
promotion of resource mobilization component, public investment, the Micro
Small and Medium Enterprises (SMME) sector, creation of enabling environment
for the private sector to function, harnessing employment creation opportunities
and strengthening of the mining sector.
Social sector: strengthening of social protection floors catering for the vulnerable
and marginalized groups in the society.
Environmental sustainability: initiatives for adaptation to climate change are
a priority as it affects many sectors; agriculture (primary and secondary), tourism,
environment.
d) Leaving no one behind:
Vulnerable groups in the country have been identified as orphaned and vulnerable
children (OVCs), the elderly, people living with disabilities, women and the youth.
There are a range of policies and programmes that have been put in place to
address their plight. They include social protection measures i.e. OVC grant,
elderly grant, disability grant; programmes for their empowerment (especially
women and girls) and addressing their need include youth enterprise fund, women
in development, women empowerment programme, rural development fund.
National initiatives for the HLPF goals
SDG4: Ensure inclusive and equitable quality education and promote
lifelong learning opportunities for all.
Introduction of free primary education to ensure equal access for all children,
introduction of ECCDE child development in readiness for school, strengthening

8
of TVET education in the formal and non-formal education streams (scholarship
awards), construction of schools within acceptable walking distance in
communities.
SDG8: Promote sustained, inclusive and sustainable economic growth,
full and productive employment and decent work for all.
Creation of enabling environment that attracts foreign direct investment resulting
in improvements in employment opportunities, increases in public investment to
induce visible private sector participation, maximum utilisation of resources for
production.
SDG13: Take urgent action to combat climate change and its impacts.
An enabling policy environment has been created that responds to climate change
adaptation and disaster risk reduction.
SDG16: Promote peaceful and inclusive societies for sustainable
development, provide access to justice for all and build effective,
accountable and inclusive institutions at all levels.
The kingdom is generally a peaceful country but cases of violence and abuse are
on the rise according to national standards. Policies that deal with violence and
abuse of the vulnerable groups have been developed and laws to enforce them put
in place e.g. Sexual Offences and Domestic Violence Act of 2019.
SDG17: Strengthen the means of implementation and revitalize the
Global Partnership for Sustainable Development:
Implementation of the country’s development programme is through domestic
resources and support from development partners as well as loans and grants. An
enabling environment for donor support and effective utilisation prevails.
e) Structural issues.
In Eswatini, the National Development Strategy (NDS) is the main framework
for the achievement of sustainable development in the country. The NDS was
originally produced in 1997 and covered a 25-year time horizon. In response to a
changed development context domestically and abroad, its revision started in
2014. This development framework was revised to conform to regional and global
conventions and to incorporate emerging issues in development arena. The

9
outcome of the review was titled Strategy for Sustainable Development and
Inclusive Growth (SSDIG).
The National Development Strategy was operationalized by the Poverty
Reduction Strategy and Action Programme (PRSAP) 2008. The National
Development Plan 2018 -2023 is the medium term framework for accelerating
inclusive growth and sustainable development. The Eswatini Strategic Road
Map 2019-2023 is a medium term development framework prioritising key sectors
that will expedite economic growth in the short turnaround. This policy framework
will ensure sustainable economic development, financial stability & growth,
improving the quality of life for the nation.
Agriculture
The Agriculture sector has formulated several policies to create an enabling
environment within the sector, including:
The National Food Security Policy, which focuses on 4 key pillars,
namely: food availability, food access, food utilisation and nutritional
requirements, as well as stability in equitable food provision, also
approved in 2005;
The National Irrigation Policy, which provides guidelines on the
proper management and conservation of water for irrigated
agriculture, while improving agricultural productivity, approved in
2005;
The Livestock Development Policy, which seeks to promote the
transition from subsistence to commercial livestock farming,
approved in 2006;
The National Agriculture Investment Plan (SNAIP) 2015–2025 and the
Comprehensive Africa Agriculture Development Programme (CAADP).
The SNAIP aims to improve food and nutrition security, reduce rural poverty and
increase the contribution of agriculture to economic development. For nutrition
security, the sector has the following policies in place: National Framework for
Food Security in Schools (2013), Food and Nutrition Policy (FSNP) 2017
and the National Stunting Prevention Action Plan (2016-2018).
Health
In the Health sector, the Government’s overarching policy instrument is the
National Health Policy, which is being implemented in part through the
National Health Sector Strategic Plan 2014-2018. The overall objective is to
ensure accessibility, availability and utilisation of quality health service in
country as well as regain the losses in life expectancy that occurred due to the
10
impact of HIV/AIDS. It is worth noting at this point that life expectancy at birth
has steadily improved, reaching 57.75 years in 2016.
Education
The education sector benefits from an Education Sector Policy (2011) and a
strategic plan referred to as the Education Sector Strategic Plan (ESSP),
covering the period 2010 to 2020. The sector also has a medium term plan, the
National Education and Training Improvement Programme (NETIP).
Implementation of the NETIP began in 2013/14 and ended in 2017/18. NETIP II
has been launched whose main focus is on ensuring access to quality
education for all and life-long learning.
Water and Sanitation
The water sector has a National Water Policy which has been in draft form since
2009 and is being reviewed. It is mainly focused on strengthening water resource
management and sustainability In addition, the sector has an Integrated Water
Resources Master Plan, which was finalised in April 2016. The National
Sanitation policy (2019) and the Sanitation and Hygiene Strategy has been
finalised with main objective of ensuring access to safely managed sanitation
facilities and enforcing hygiene standards.
Fuel and Energy
The sector adopted the following policy frameworks; the National Energy
Policy, National Energy Efficiency Policy, National Energy
Implementation Strategy (2018) and Eswatini Energy Master Plan of 2018
– 2034 to scale up energy access through consideration of off-grid solutions and
introduce energy efficiency interventions which will support the country’s drive on
industrialisation and improvement in welfare
Climate Change
The sector developed the National Climate Change Policy and Strategy 2016,
the National Climate Change Strategy and Action Plan (2014-2019).
Furthermore, reviewed its National Disaster Risk Reduction Policy and
developed a National Resilience Strategy and Disaster Risk Reduction
Plan of Action (2017 – 2021) and the Seasonal Multi-Hazard Contingency
Plan (2015, 2016, 2017 and 2018) was reviewed. These are aimed at ensuring
adaptation to climate change and build national resilience to the risk of disasters.

11
Infrastructure
The sector developed the National Transport Policy and Masterplan and
reviewed the National Information Communication Infrastructure Policy
of 2006 to guide and regulate developments within the transport and
communication infrastructure sectors.

12
CHAPTER 4
PROGRESS MADE IN THE
IMPLEMENTATION OF
THE
SUSTAINABLE
DEVELOPMENT
GOALs

13
SDG 1: End poverty in all its forms everywhere
1.0 Introduction
This goal entails ending poverty in all its forms everywhere. It corresponds to Goal
1 of Agenda 2063: A high standard of living, quality of life and well-being for all.
Poverty is one of the main development challenges affecting the Kingdom.
Development of the National Development Strategy in 1997 was aimed at ending
poverty in the country. The Poverty Reduction Strategy and Action Programme of
2005 was produced as an action plan for NDS implementation tailor made poverty
reduction by 2015 in the country. Its recommendations included establishment of
the Regional Development Fund (RDF), Poverty Reduction Fund, the youth
enterprise fund, the elderly grant.
The evolving development has resulted in emerging poverty issues including the
multi-dimensional nature of poverty. This has necessitated the need to interrogate
this phenomenon to better understand its depth and further identify solutions that
address the new nature. In this regard the country has benefited from India
support through the South-South Cooperation modality administered and
facilitated through UNDP office of the United Nations. Through this support the
country is conducted the Participatory Poverty Assessment (PPA) in an effort to
understand the multi-dimensional nature of poverty and come up with effective
remedial measures to deal with this plight and provide policy guidance. It is
participatory in nature as it benefits from participation of the affected populations
themselves.

14
1.1 Trends
a) Proportion of population living below the poverty line
The country has a population of just above a million at 1,093,238 and the
proportion of population living below the poverty line improved from 63% in 2010
to 58.9% in 2017. Poverty is most pronounced in rural areas at 70.2% than urban
area 19.6% (2017) and in males 67% than females 59.4% and is highest in the
Shiselweni and Lubombo regions at 71.5% and 67.3% respectively (2017) as shown
is figure 1.1.
Figure 1.1 Proportion of population living below the poverty line
A tabular presentation of the proportion of people living below the poverty line is
as shown in the table below:
SDG Indicator Baseline Current
Proportion of population below the international poverty line, by sex, age, employment status and
geographical location (urban/rural)
Population below poverty line 63% 58.9%
- By Sex: Male 59% 67%
- Female 67% 59.4%
- Geographic location: Rural 73% 70.17%
Urban 31% 19.55%
- Regions: Hhohho: 61% 54.08%
Manzini: 58% 51.47%
Shiselweni 68%: 67.26%:
Lubombo: 69% 71.53%
National Poverty line per adult equivalent per month SZL 463 SZL 975.30
0
10
20
30
40
50
60
70
80
Nationa
l
Rural Urban Male Female Hhohho Manzini Lubomb
o
Shiselw
eni
Year 2010 63 73 31 59 67 61 58 68 69
Year 2017 58.9 70.2 19.6 67 59.4 54.1 51.5 67.3 71.5
Pe
rce
nta
ge
s

15
b) Social protection floors
Marginalised or vulnerable groups in the country have been identified to include
the Orphaned and Vulnerable Children (OVCs), the elderly (60 and above years of
age), and the persons living with disabilities. Grants have been established to
cater for their basic necessities namely OVC, Elderly and disability grants. This
support assist these groups to be able to meet their basic needs without which the
situation would be unbearable as people would die. There is a decline in the
number of beneficiaries between the year 2016/17 and 2017/18, however the
elderly grant has the highest number of beneficiaries while the disability grant
has the least as shown in figure 1.2.
Figure 1.2: Population covered by social protection programme
Source: DPM REPORT2016/2017 Financial Year
Beneficiaries of the elderly grant declined by 44% between 2016/17 and 2017/18, from 94, 851 to 65, 773
1.2 Successes
a) The government has implemented a program that teaches school children
especially OVCs to make savings
b) Youth fund was introduced to help in funding the youth’s business ideas
and willingness
c) Implementation of the young heroes program working hand in hand with
world vision, OVCs are given livestock to take care of for their own benefits
d) Regional Development Fund are provided at regional level, it targets to
fund people who want to be in business and with viable business plans
e) Improvement in the communication infrastructure (Swazi Mobile)
0
10,000
20,000
30,000
40,000
50,000
60,000
70,000
80,000
90,000
100,000
OVC ELDERLY DISABILITY
Year 2016/17 52,632 94,851 4,779
Year 2017/18 55,572 65,773 4,641
Nu
mb
er
of
Pe
op
le

16
f) Programs and schemes targeting the improvement of water and electricity
accessibility
g) The country conducted a Child Poverty Assessment and Participatory
Poverty Assessment
1.3 Challenges
a) Increasing cases of theft due to poverty, especially livestock.
b) Limited dissemination of information on development programmes e.g.
youth fund
c) Fiscal challenges limit budget allocation to poverty reduction initiatives
d) Increasing health burden negatively affect the poverty rate
e) Limited monitoring and evaluation on the utilisation of government
resources.
f) Sustainability and targeting for social protection floors
1.5 Emerging issues
a) Increasing number of OVC due to burden of diseases.
b) Poverty has forced people to opt for illicit practices to sustain livelihoods.
1.6 Lessons learned
a) Need to strengthen monitoring and evaluation of poverty alleviating
programmes
b) Community participation in identification of priority poverty alleviation
initiatives is important.
1.7 Describe what actions have been taken to address existing gaps and
challenges
Initiatives have been put in place to address the plight of poverty in the country
and they include social protection programme for the vulnerable groups, in terms
of grants and development funds e.g. elderly grant, youth enterprise fund and
skills development programmes.
1.8 Areas for support
a) Mapping out or locating the poorest households should be and then the
government should help them
1.8 Key messages
a) Stakeholder involvement in development programmes
b) Strengthen prioritisation for effective service delivery

17
SDG 2: End hunger, achieve food security and improved
nutrition and promote sustainable agriculture
2.1 Introduction
This goal entails total elimination of hunger by ensuring food security, improved
nutritional status and promoting sustainable agriculture. This is in-line with
Agenda 2063 goal 5: modern agriculture for increased productivity and production.
The fight against hunger has been identified as a major developmental challenge
that requires concerted efforts to eradicate. It is estimated that one in nine people
globally do not have enough to eat and a majority of the hungry are found in
developing countries where high malnutrition levels are reported. The Kingdom
of Eswatini has not been spared as hunger continues to be one of the limiting
factors bearing an impact on overall economic development of the country.
As a drive towards achieving this goal, the country undertook a Zero Hunger
Strategic Review in 2018 to analyse the current food and nutrition situation and
to identify strategies and programmes for ending hunger by 2030. It was
recommended that the existing policies on mitigating food and nutrition insecurity
in the country are sufficient to achieve this goal and therefore should be fully
integrated and implemented by the agricultural sector. These include the National
Food and Nutrition Policy (NFNP) of 2005 , The Draft Comprehensive Agricultural
Sector Policy (CASP, 2005), National Food Security Policy (NFSP 2009),
Agriculture Extension Policy (AEP 2016), National Framework for Food Security
in Schools (2013), Food and Nutrition Policy (FSNP) 2017 and the National
Stunting Prevention Action Plan (2016-2018), to mention a few.
Official Development Assistance (ODA) towards the agricultural sector in the
country for improving agricultural production and productivity is mainly from the
following development partners; African Development Bank (ADB), European

18
Union (EU), Bank of India, Food Agricultural Organisation (FAO), Internal Fund
for Agricultural Development (IFAD).
Trend Analysis
a) End hunger and ensure access to safe, nutritious and sufficient
food all year round.
In an effort to ensure access to safe and nutritious food all year round, the
National Nutrition Council co-ordinated awareness creation campaigns with
various stakeholders to promote the importance of nutritious food, especially for
infants. The country adopted the Food and Agricultural Organisation (FAO)
definition of the prevalence of undernourishment (PoU) as “the probability that a
randomly selected individual from the reference population is found to consume
less than his/her calorie requirement for an active and healthy life”.
The Multiple Indicator Cluster Survey (2014) stated that the prevalence of
undernourishment for children under five years was at 5.8% nationally. It was
most prevalent among boys at 7.3% than girls at 4.3%, and the rural-urban
disparity show that rural areas are the most affected as depicted in figure 2.1
Figure 2.1 Proportion of undernourished children under 5 years
The prevalence of stunting among children under 5 years of age was also
monitored for children falling below minus 2 standard deviations from the median
height for 5 years old. The level of stunting amongst children under 5 years of age
was 25.5% and mostly observed amongst boys at 29.2%, whilst females constituted
21.7% it further declined to 19.9% in 2018 as shown in figure 2.2 below.
0
1
2
3
4
5
6
7
8
National Male Female rural urban
2014 5.8 7.3 4.3 6.2 4.3
PE
RC
EN
TA
GE
UNDERNOURISHED CHILDREN UNDER 5 YEARS

19
Figure 2.2: Prevalence of stunting among children under 5 years
The country developed a technical working team to monitor food insecurity and
agricultural sustainability according to the Integrated Phased Categorization
(IPC). Furthermore, Government introduced school feeding programmes to assist
in food security and nutrition.
b) Double agricultural productivity and incomes of small-scale food
producers
Eswatini continuously trained small scale agricultural farmers in diverse
agricultural practices and services, for instance in fish and mushroom farming.
This was an effort to double the agricultural productivity and incomes of small-
scale food producers, particular for women, household farmers, and fishers and to
create opportunities for value addition and non-farm employment. The annual
reports from the Ministry of Agriculture showed the following results.
Table 2.3 Annual agricultural statistics
Produce 2016 2018
- Milk production (Million litres) 3.6 18
- Beef (Million Kg) 132 125
- Pork (Million Kg) 1.5 1.3
- Goat (Million Kg) 12.5 12
- Indigenous chicken (Million Kg) 2.4 2.3
- Sheep (Million Kg) 0.5 0.49
- Broiler (Million Kg) 1.01 1.2
- Fish production (Metric tonnes) 7 9
- Sugar production (Metric tonnes) 5,836,553 4,973,571
- Plantations (Million cubic centimetres) 11.4 12.2 Ministry of Agriculture Annual Reports 2016/18
0
5
10
15
20
25
30
nationally moderate severe tunting male female
2014 25.5 18.3 7.2 29.2 21.7
2018 19.9 13.14 6.73 22.11 17.55
Stunting Among Children Under 5 Years

20
To improve farmers’ productivity, government has put in place a programme that
provides farming inputs and tractor services at subsidized prices. In addition, the
construction of earth dams has improved arable agricultural land in selected
communities with prospects to double productivity.
Total maize production for the 2017/18 cropping season was 113,039mt while
domestic requirement is 134,342mt.
c) Maintaining genetic diversity of plants and animals
The country developed a gene bank to conserve plant genetic resources, which is
in line with the global target 2.5 that says: “By 2020, maintain the genetic
diversity of seeds, cultivated plants and farmed and domesticated animals and
their related wild species, including through soundly managed and diversified
seed and plant banks at the national, regional and international levels, and
promote access to and fair and equitable sharing of benefits arising from the
utilization of genetic resources and associated traditional knowledge, as
internationally agreed”. The following plant and animal resources were captured.
Table 2.6 Plant and Animal Species
Number of Resources 2016 2018
Plant accession
secured
570 plant accessions
representing 10 species
626 plant accessions
representing 10 species
Total Livestock production
Cattle population 589 405 501 369
Pig population 38 513 38 335
Goat population 443 218 478 919
Chickens population 2 415 138 1 535 218
Dairy cows population 4835 5275
Sheep population 14 969 16264
2.2 Challenges
a) The conditions provided by marketing entities are not favourable for
farmers.
b) Link between farmers and markets needs to be strengthened.
c) Poor harvesting skills and facilities increases food losses and waste.
d) Climate change is a constraint in agricultural production.
e) The imports exceed exports in the agricultural sector.
2.4 Emerging issues
a) The agricultural sector is mainly dominated by old people.

21
b) Over reliance on government by farmers for farming inputs and services.
c) The increasing rate of the rural- urban migration of the economic active
group negatively affects agriculture, especially in the rural areas.
d) The world is becoming alive to sanitary and phyto – sanitary (SPS) issues
and technical barriers to trade.
2.5 Lessons learned
a) Agricultural projects implementation have to be closely monitored.
b) There is a need to increase agricultural extension services.
c) Farmers have to be taught on how to preserve their farm produce effectively
and the means to preserve harvest traditionally.
d) Adherence to food safety standards needs to be strengthened.
2.4 Actions that have been taken to address existing gaps and challenges
Many projects were implemented to improve gaps in this goal, including: support
for agri-business development, food and nutrition and gene conservation.
The following programmes were put in place, namely:
a) Construction of earth dams for support smallholder farmers in
production. Also, as an intervention for climate change mitigation.
b) Lower Usuthu Irrigation Projects I and II.
c) Input and tractor hire services to improve production and productivity.
d) Some policies are in place and others in draft form.
2.5 Areas for support
a) Research on food and nutrition security is necessary (including the
diversification of crops and livestock).
b) Information management systems for effective planning.
c) Agriculture technologies and infrastructure.
d) Capacity building for human resources.
e) Resource mobilisation to support on going and new programmes.
2.6 Key messages
a) Youth are key for sustainable agricultural development.
b) Strengthen agricultural diversification and commercialisation.
c) Encourage utilisation of all available arable land for agricultural
production.
d) Decentralisation of agricultural services.

22
SDG 3: Ensure healthy lives and promote well-being for all at
all ages.
3.1 Introduction
Ensuring healthy lives and promoting wellbeing for all at all ages is important to
building prosperous societies, as highlighted in goal 3 of the African Union Agenda
2063. The health sector aims to ensure the achievement of SDG 3 by improving
reproductive, maternal and child health; ending the epidemics of major
communicable diseases; reducing non-communicable and environmental diseases;
achieving universal health coverage; and ensuring access to safe, affordable and
effective medicines and vaccines for all. The government is highly committed to
ensuring a healthy and productive population that lives longer, fulfilling and
responsible lives. As a result, the health sector seeks to improve the health of the
people by providing preventative services that are of high quality, relevant,
accessible, affordable, equitable and socially acceptable.
The country revised its National Health Policy (2007) and Health Sector Strategy
to align to emerging global and regional health conventions, thus the National
Health Policy of Eswatini (2017) and second National Health Sector Strategic Plan
(2014 – 2018) are in place. Furthermore, the National Health Financing Policy
(2017) was developed to set out health care financing models and strengthen the
sector’s capacity in health care financing. Disability was mainstreamed into the
health sector. Health infrastructure has increased and is distributed among the
different regions.
The health sector received official development assistance from the following
development partners: European Union, Global Fund, Japan, United States of

23
America, United Nations programme on HIV/AIDS, UNFPA, UNICEF, WFP,
WHO and the World Bank.
3.2 Trends Analysis
a) Reduce the global maternal mortality ratio
• Current updates on the performance of maternal mortality obtained from
the 2017 population census report show a decline from 593/100,000 in 2012
to 474/100,00 and further declined to 452/100000 in 2017 which is
significantly above the target of 120/100,000 maternal deaths in 2022.
Government continues to strengthen maternal health services through
interventions including rehabilitation of maternity units in hospitals and
construction in health centres and clinics. In addition, capacity building of
health care workers to track and improve skilled birth attendance is
ongoing.
b) End preventable deaths of new-borns and children under 5 years.
Eswatini was able to reduce the under 5 mortality rate per 1000 from 104 deaths
per 1000 live births (MICS 2014) to 74/1000 in 2017. This was done through
introduction of new vaccines and increasing immunization coverage for children
under five (5) years of age. In that regard, the interventions are yielding positive
results showing that it will reach a rate of below 60 deaths, which is the target for
2022.
c) End the epidemics of AIDS, tuberculosis and malaria.
Reduction in HIV incidence;
There was a reduction in the incidence rate from 2.1% in 2011 to 1.4% in 2016 for
ages 15 to 49 years. This was as a result of Eswatini’s commitment to provide anti-
retroviral treatment for all people diagnosed with HIV. In addition, EHIMS 2016
shows that the country has made major progress towards achieving the global 90-
90-90 HIV targets by 2020, currently at 84.7- 87.4 - 91.9. 90-90-90 HIV targets
means that 90% of People Living with HIV (PLHIV) should know their HIV status,
90% of those positive be initiated on ART and 90% be virally suppressed.
This was achieved through initiatives such as provision of anti-retroviral therapy,
Prevention of Mother to Child Transmission (PMTCT), Test and Start, HIV testing
and counselling services and other impact mitigation interventions done through
NERCHA. The number of new HIV infections per 1,000 uninfected population
24
were 2.38 per 1000 in 2016 and reduced to 1.36 per 1000 population in 2017. HIV
incidence among adults was recorded to be 1.4% in 2016.
Tuberculosis
Since 2012 TB case detection rate has improved from 46% to 74% in 2017.
Treatment success rate improved from 77% to 83% in 2017 for ordinary TB, whilst
for MDR - TB the improvement was from 56% to 73% in 2017. The strategy has
been to deploy more than 300 active case finders at the community level to identify
and refer people infected with TB to ensure early treatment for newly identified
cases.
Malaria
Diagnosis and treatment of Malaria cases in accordance with National Diagnosis
and Treatment Guidelines increased from 85% in 2012 to 97% in 2017. This
increase shows major progress towards the country attaining certification of
malaria elimination. Due to these major strides, His Majesty King Mswati III was
elected chairperson of the African Leaders Malaria Alliance (ALMA) from 2017 to
2020.
The improvement is attributed to elements including training of health care
workers on the National Diagnosis and Treatment Guidelines, setting up of a
robust surveillance system which allows for timely case detection and
investigation, collaboration with neighbouring countries through participation in
cross border initiatives and providing a leadership role in the Elimination 8
initiative.
d) Reduce by one third premature mortality from non-communicable
diseases
The five year NCD awareness campaign plan was developed and implemented.
Furthermore, the NCDs monitoring and surveillance systems were strengthened.
Morbidity associated with NCDs and lifestyle related hospital visits show an
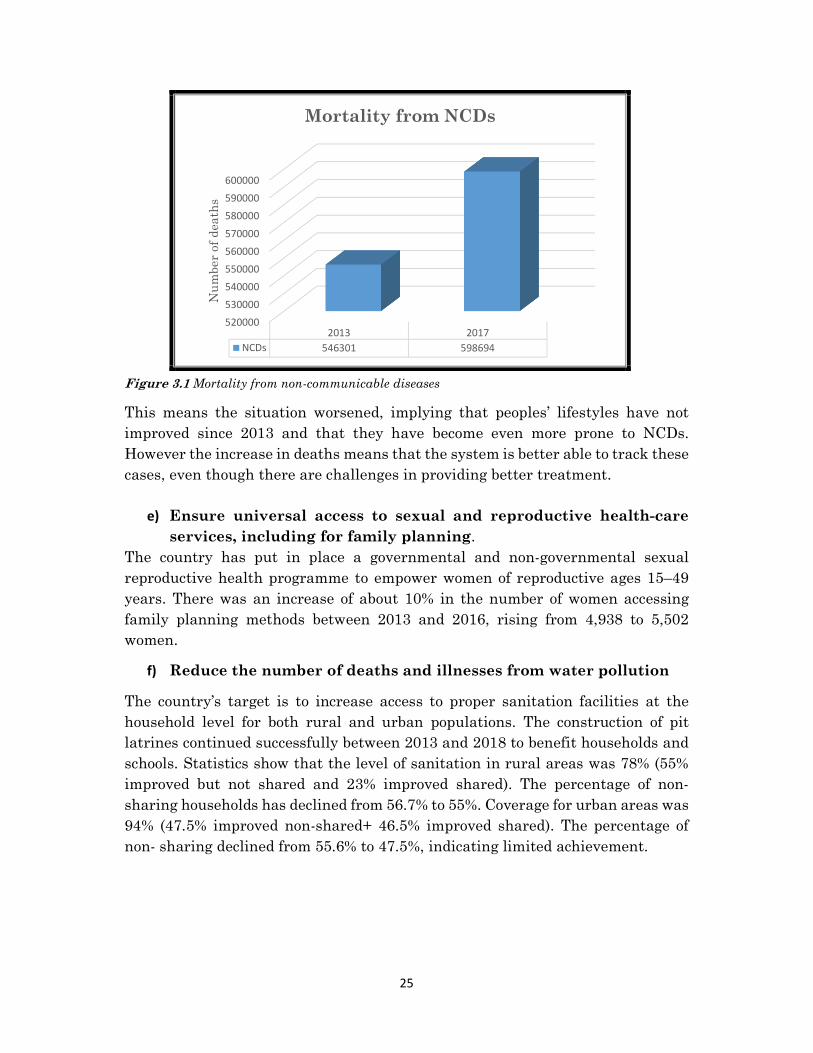
increase between 2013 and 2017, as shown in the figure below.
25
Figure 3.1 Mortality from non-communicable diseases
This means the situation worsened, implying that peoples’ lifestyles have not
improved since 2013 and that they have become even more prone to NCDs.
However the increase in deaths means that the system is better able to track these
cases, even though there are challenges in providing better treatment.
e) Ensure universal access to sexual and reproductive health-care
services, including for family planning.
The country has put in place a governmental and non-governmental sexual
reproductive health programme to empower women of reproductive ages 15–49
years. There was an increase of about 10% in the number of women accessing
family planning methods between 2013 and 2016, rising from 4,938 to 5,502
women.
f) Reduce the number of deaths and illnesses from water pollution
The country’s target is to increase access to proper sanitation facilities at the
household level for both rural and urban populations. The construction of pit
latrines continued successfully between 2013 and 2018 to benefit households and
schools. Statistics show that the level of sanitation in rural areas was 78% (55%
improved but not shared and 23% improved shared). The percentage of non-
sharing households has declined from 56.7% to 55%. Coverage for urban areas was
94% (47.5% improved non-shared+ 46.5% improved shared). The percentage of
non- sharing declined from 55.6% to 47.5%, indicating limited achievement.
520000
530000
540000
550000
560000
570000
580000
590000
600000
2013 2017
NCDs 546301 598694
Nu
mber
of
dea
ths
Mortality from NCDs

26
g) Provide access to affordable essential medicines and vaccines
The country provides highly subsidised health care services. The availability of
drugs and pharmaceuticals is heavily dependent on Government’s resource
envelope. The availability of tracer classes of medicine in 2018 was as follows:
i. ARVs improved from 74.1% in 2013 to 96.4% in 2017
ii. Tuberculosis improved from 82.4% in 2015 to 88.7% in 2017
iii. Family planning deteriorated from 92.9% in 2015 to 61.8% in 2017
iv. Malaria remained unchanged from 94.1% in 2015 to 94.1% in 2017
v. Essential medicines current level at Central Medical Stores is 94%
3.2 Challenges
a) Absence of national data on youth and adolescent sexual reproductive
health surveillance.
b) Teenage pregnancies are high which accelerates HIV incidence and new
infection among young girls is increasing.
c) Poor behavioural change after awareness of NCDs.
d) Limited friendly services.
e) Poverty is one of the causes of sexual malpractices among the youth.
f) Mothers do not want to breast feed their babies.
g) Criminalization of vulnerable people e.g. sex workers.
h) The quality of care in the health sector is restrained by lack of resources
(skills, equipment and medicinal).
i) Community healthcare workers are limited.
j) There still gaps in transmission from paper work to paper less.
k) Attraction and retraining nurses and doctors in rural areas.
3.3 Emerging issues
a) Raising awareness on management of NCDs.
b) Religious beliefs prohibit access to health care.
c) Young people living with HIV especially young girls.
d) Reproductive health education tailored for disabled children.
e) Involvement of the youth in community health motivators’ programme.
3.4 Lessons learned
a) Public finance for health and education is inadequate, hence the need to
prioritise within the sector.
b) Health coverage must be accompanied by quality of services.
c) Good partnerships with development partners has increased coverage and
achievements in some social sectors.
d) HIV/AIDS behavioural change is a bigger challenge.

27
3.5 Actions that have been taken to address existing gaps and challenges
a) Revised the exiting policy documents.
b) Developed the National Health Financing policy for well-coordinated and
structured financial guidance.
c) Infrastructure development, more maternity units have been constructed
in existing health facilities and all newly constructed facilities have the
maternity wing included.
d) Under Five and neonatal: vaccines are now being procure through UNICEF
(Stock out is minimal).
3.6 Areas for support
a) Multi-sectoral approach to address Non communicable diseases (NCDs),
increase technical and financial support towards the social sector
especially the neglected NCDs and decentralization of NCDs services.
b) Early detection of children with disabilities e.g. having psychologist.
c) Strengthen health research.
3.7 Key messages
a) Urgent action to combat NCDs prevalence.
b) Need for user friendly services for special groups.
c) There is a shortage of pharmaceuticals and equipment in hospitals.
d) Strategies to retain highly skilled health practitioners in rural health
facilities.
e) Promotion of preventive health services.

28
SDG 4: Ensure inclusive and equitable quality education and
promote lifelong learning opportunities for all.
4.1 Introduction
This goal aims at ensuring that all people have access to quality education and the
opportunity for lifelong learning. This is line with Agenda 2063 goal 2: Well
Educated Citizens and Skills revolution underpinned by Science, Technology and
Innovation. The Kingdom of Eswatini views education as the quickest and most
viable way to advance development and eradicate poverty. It is the Government’s
priority to provide access to relevant quality education that is affordable at all
levels; taking into account all issues of efficiency, equity and special needs. The
goal goes beyond school enrolment and looks at proficiency levels, the availability
of trained teachers and adequate school facilities, and disparities in education
outcomes.
The Education Sector Policy (2011) and Education Sector Strategic Plan (ESSP),
covering the period 2010 to 2020 was developed was developed to ensure efficiency.
Furthermore, a medium term plan, the National Education and Training
Improvement Programme (NETIP) is being implemented.
The country received external support to review its education policies, strategies
and action plan. Support was also received to strengthen the education sector from
various development partners. The European Development Fund through its
Support to Education and Training (SET) programme provided support to ensure
free access to primary education for pupils. It also strengthened quality and
relevance of the primary education curriculum.
The education sector is supported through ODA from the following development
partners: The Republic of Japan, United Nations Educational, Scientific and

29
Cultural Organisation (UNESCO) and United Nations Children’s Fund
(UNICEF).
4.2 Trends Analysis
a) Ensure quality primary and secondary education.
The country introduced Free Primary Education programme as a means to ensure
that all children have equal access to quality primary education. This programme
has been successfully rolled out to all government schools through local and donor
funds. The Orphaned and Vulnerable Children (OVC) educational programme was
established as a safety net for children attending secondary education.
Government has increased the education infrastructure to address the increase in
school going children including schools for children living with disabilities.
Finally, the Early Childhood Care and Development Education (ECCDE)
programme was launched to increase access to pre-primary education and the
proportion of grade 1 students who have gone through ECCDE increased from 69%
in 2015 to 78% in 2017. The figure below shows the national completion rate for
primary and secondary education.
Figure 4.1 Proportion of children that complete primary and secondary education.
b) Access to technical, vocational and tertiary education.
To ensure equal access for all women and men to affordable and quality technical,
vocational and tertiary education, the country strengthened its institutions of
higher learning. Some colleges were upgraded to universities and diverse
academic institutions were established. The scholarship programme was
0
20
40
60
80
100
120
2014 2016
Primary 93.5 106.1
Seconary 49.6 61.5
PE
RC
EN
T
National Completion Rates
30
reinforced by other governments which increased the number of tertiary trained
students. There was also an increase in the number of students enrolled for
Technical and Vocational Educational Training (TVET) in the past three years.
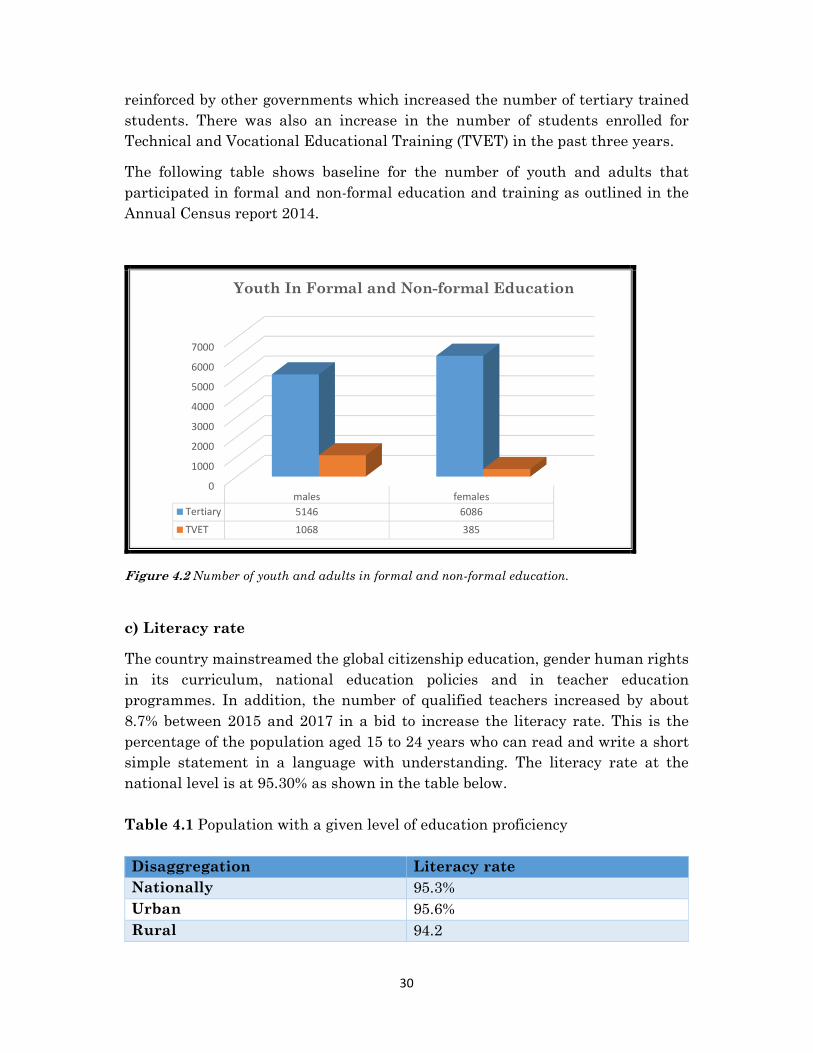
The following table shows baseline for the number of youth and adults that
participated in formal and non-formal education and training as outlined in the
Annual Census report 2014.
Figure 4.2 Number of youth and adults in formal and non-formal education.
c) Literacy rate
The country mainstreamed the global citizenship education, gender human rights
in its curriculum, national education policies and in teacher education
programmes. In addition, the number of qualified teachers increased by about
8.7% between 2015 and 2017 in a bid to increase the literacy rate. This is the
percentage of the population aged 15 to 24 years who can read and write a short
simple statement in a language with understanding. The literacy rate at the
national level is at 95.30% as shown in the table below.
Table 4.1 Population with a given level of education proficiency
Disaggregation Literacy rate
Nationally 95.3%
Urban 95.6%
Rural 94.2
0
1000
2000
3000
4000
5000
6000
7000
males females
Tertiary 5146 6086
TVET 1068 385
Youth In Formal and Non-formal Education

31
4.3 Challenges
a) Unaffordability of school fees leading to low attendance at secondary
schools, including vocational training.
a) OVC grant not adequate, leading to school drop outs.
b) Mismatch of skills training with job market needs.
c) Growth of education sector needs exceed changes in government resource
envelop.
d) Inadequate capacity and resources to monitor the quality and relevance of
education.
4.4 Emerging issues
a) Need to include issues of NCDs in the school curriculum.
b) The focus must shift towards quality education and move away from access.
4.5 Lessons learned
a) Increased investment by government to primary education has a positive
impact on enrolment rates which should be applied to address the challenge
of access to secondary schools.
b) Lack of coordination amongst all stakeholders implementing SDG4 has
resulted in challenges in tracking progress.
4.6 Actions taken to address existing gaps and challenges
a) Government has trained teachers for ECCD and ICT but these have not
been absorbed or recruited in ECCD centres.
b) Development of ICT curriculum for secondary education.
c) Partnerships with development agencies, NGOs and private sector.
4.7 Areas of support
a) Increase the OVC school grants.
b) Increase social protection safety nets and grants and track the recipients
adequately.
c) Improve information systems for targeting vulnerable populations.
d) Expand free education to secondary school.
e) Scholarships must be accessible to students.
f) Provision of ICT equipment (software &hardware) internet connectivity or
infrastructure.
g) Monitoring education quality and relevance.
h) Development of SDG4 roadmap 2020-2030.
4.8 Key messages
a) Skills acquired in training institutions to match the job market.
b) Scale up free education to secondary school.

32
c) Capacity strengthening for teachers in braille and sign language.
d) Introduce vocational education in primary schools.
e) Increase investment for educational programmes.

33
SDG 6: Ensure availability and sustainable management of
water and sanitation for all.
6.1 Introduction
This goal aims to achieve universal, sustainable and equitable access to safe
drinking water, sanitation and hygiene by 2030. This corresponds with goal 1 of
Agenda 2063. In response to the global goals, a Strategy for Water, Sanitation and
Hygiene 2016-2030 that provides a framework to guide our work related to water,
sanitation and hygiene over the next 15 years was developed. On another note, a
medium term strategy was formulated titled the Wash Sector Development
Strategy 2017 to 2022.
The country has further enhanced the water sector policy environment by
developing the Integrated Water Resources Management Draft Masterplan (2016)
and enacting the National Water policy (2018). Furthermore, Transboundary
Water Agreements have been signed with the neighbouring countries of the
Republic of Mozambique and the Republic of South Africa. Therefore, all
transboundary water basins have an operational arrangement for cooperation.
Awareness campaigns on wetland protection and preservation were conducted in
strategic communities.
The National Sanitation policy (2019) and the Sanitation & Hygiene Strategy were
developed to promote access to adequate and equitable sanitation and hygiene.
Improved sanitation approaches have been introduced in some schools and
households to increase the proportion of population using safely managed
sanitation services. Awareness on the hand washing policy was communicated in
all schools and most communities.
To effectively execute SDG 6, the country received foreign aid from various
development partners and donors. These include The African Development Bank,
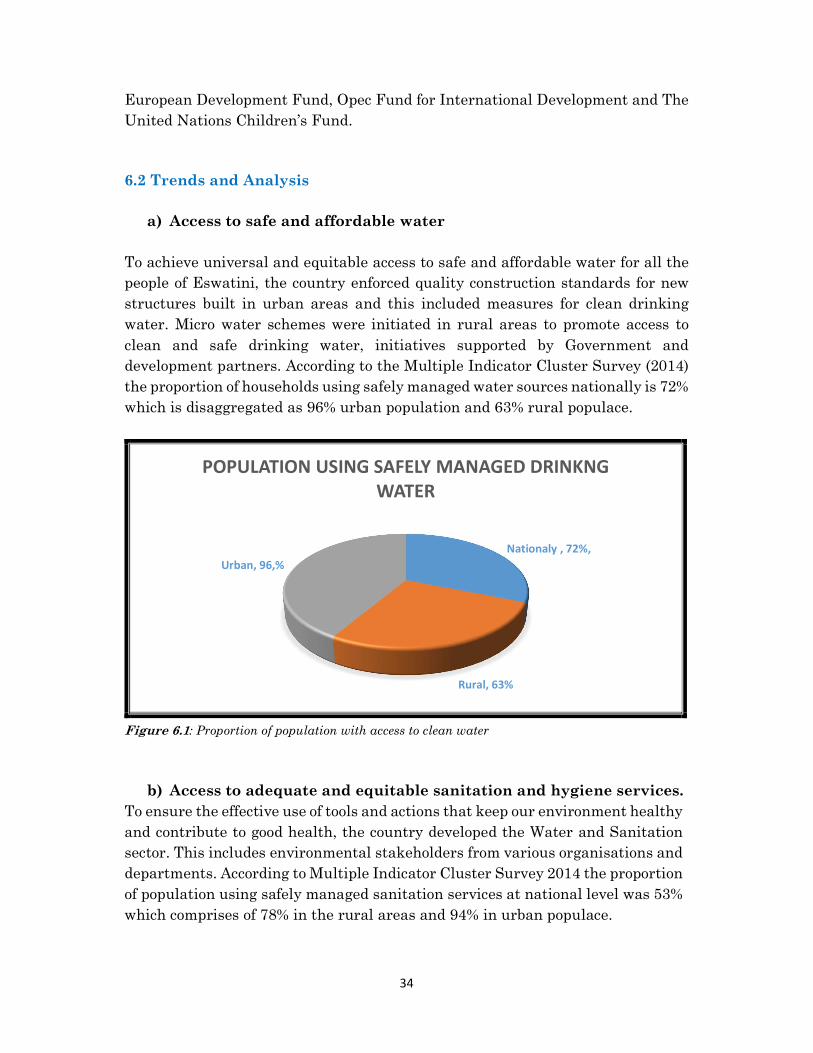
34
European Development Fund, Opec Fund for International Development and The
United Nations Children’s Fund.
6.2 Trends and Analysis
a) Access to safe and affordable water
To achieve universal and equitable access to safe and affordable water for all the
people of Eswatini, the country enforced quality construction standards for new
structures built in urban areas and this included measures for clean drinking
water. Micro water schemes were initiated in rural areas to promote access to
clean and safe drinking water, initiatives supported by Government and
development partners. According to the Multiple Indicator Cluster Survey (2014)
the proportion of households using safely managed water sources nationally is 72%
which is disaggregated as 96% urban population and 63% rural populace.
Figure 6.1: Proportion of population with access to clean water
b) Access to adequate and equitable sanitation and hygiene services.
To ensure the effective use of tools and actions that keep our environment healthy
and contribute to good health, the country developed the Water and Sanitation
sector. This includes environmental stakeholders from various organisations and
departments. According to Multiple Indicator Cluster Survey 2014 the proportion
of population using safely managed sanitation services at national level was 53%
which comprises of 78% in the rural areas and 94% in urban populace.
Nationaly , 72%,
Rural, 63%
Urban, 96,%
POPULATION USING SAFELY MANAGED DRINKNG
WATER

35
Figure 6.2: Population using safe sanitation services
The country also monitors the hand washing policy and aims to end open
defecation by 2022.
c) Improving the quality of water
The country established the water quality control department to monitor the
proportion of bodies of water with good ambient water quality and to ensure that
water bodies are compliant with set water quality standards. The latest annual
water quality laboratory reports indicate that the proportion of treated waste
water from industries and urban areas is about 75%. Furthermore, all river waters
are within ambient conditions.
6.3 Challenges and Improvement measures
a) Absence of rural water supply services legislation.
b) The absence swap coordination unit leads to poor coordination in the sector.
c) Lack of monitoring and evaluation unit within the department of water
affairs to monitor underground water quantity and quality.
d) Agricultural practices contribute to water pollution e.g. the use of farm
chemicals for crops and animals.
e) Inadequate water harvesting technics.
f) Water and sanitation access to rural areas remain low.
g) Mushrooming of informal settlements which affects the provision of WASH
services.
6.5 Emerging issues
0
20
40
60
80
100
Nationaly Rural Urban
Sanitation 53 78 94
Pe
rce
nta
ge
s
Population Using Safe Sanitation Services

36
a) Climate change affects the water sector and results in prolonged water
stress.
b) Water harvesting technologies need to be adopted such as using renewable
energy to harvest water, building more water dams for water and learning
from other countries.
c) There is need to develop the wetlands policy.
d) The reclassification of sanitation by introducing shared facilities as an
unimproved sanitation criteria.
e) There is a need to move from plastics to bio-degradable material (to
promote dry toilets).
6.6 Lessons learned
- Climate smart agricultural practices should be used to save water.
- There is need to protect and properly manage the ecological infrastructure
e.g. wetlands.
- Environmental law enforcement is necessary to ensure effective and
efficient policy implementation at all levels.
- Strengthening of coordination in the sector.
- There is need to strengthen coordination and regulation of water
distribution programmes and projects within the country and ensure
periodic reporting on progress.
6.7 Action taken to address existing gaps and challenges
a) Public Private Partnerships approach is currently being piloted in the
country on portable water supply services.
b) Reviewed the rural water supply projects procurement system for improved
service delivery.
6.8 Areas for support:
- Expansion of the SADC Hydrological Cycle Observation System (HYCOS)
to improve in real time hydrological/river flow measurements.
- Geo-referenced Water point mapping which gives us a clear distinction
between access and coverage.
- Water quality monitoring equipment and reagents especially for rural
water supply.
- Sanitation and hygiene mapping and creating awareness on the use of
biodegradable material e.g. dry toilets.
- Infrastructure development e.g. fully fledged laboratories.
- Increase portable water supply coverage to ‘leave no one behind’.

37
6.9 Key messages
- Climate change mitigation measures should be mainstreamed in the water
sector strategic plans for sustainable water supply.
- Water harvesting technologies should be strengthened from household level
to ensure sustainability of both surface and underground water.
- The use of biodegradable material in sanitation and hygiene protects
underground water quality.
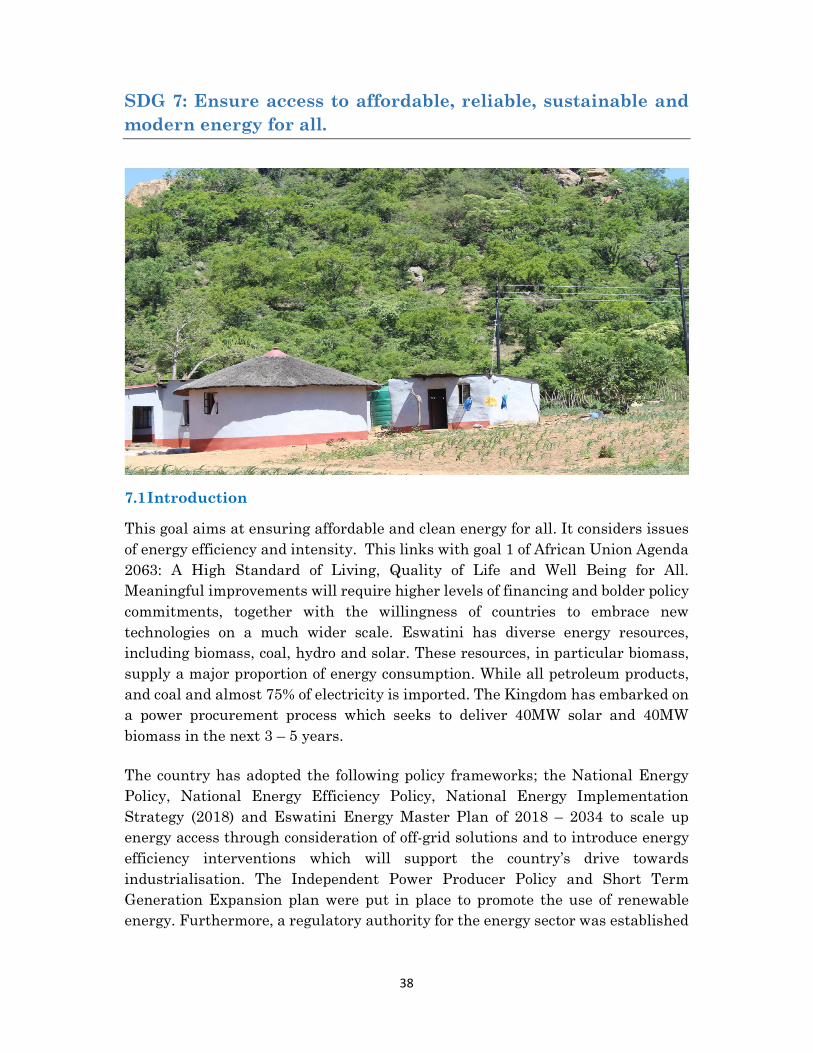
38
SDG 7: Ensure access to affordable, reliable, sustainable and
modern energy for all.
7.1 Introduction
This goal aims at ensuring affordable and clean energy for all. It considers issues
of energy efficiency and intensity. This links with goal 1 of African Union Agenda
2063: A High Standard of Living, Quality of Life and Well Being for All.
Meaningful improvements will require higher levels of financing and bolder policy
commitments, together with the willingness of countries to embrace new
technologies on a much wider scale. Eswatini has diverse energy resources,
including biomass, coal, hydro and solar. These resources, in particular biomass,
supply a major proportion of energy consumption. While all petroleum products,
and coal and almost 75% of electricity is imported. The Kingdom has embarked on
a power procurement process which seeks to deliver 40MW solar and 40MW
biomass in the next 3 – 5 years.
The country has adopted the following policy frameworks; the National Energy
Policy, National Energy Efficiency Policy, National Energy Implementation
Strategy (2018) and Eswatini Energy Master Plan of 2018 – 2034 to scale up
energy access through consideration of off-grid solutions and to introduce energy
efficiency interventions which will support the country’s drive towards
industrialisation. The Independent Power Producer Policy and Short Term
Generation Expansion plan were put in place to promote the use of renewable
energy. Furthermore, a regulatory authority for the energy sector was established

39
called the Eswatini Energy Regulatory Authority to ensure sustainable access to
affordable, reliable and modern energy.
Implementing this goal is a collective effort from Government and development
partners. External support was received from the African Development Bank
Energy Sector Technical Assistance Programme for sound investment in
electricity supply infrastructure and the International Renewable Energy Agency
(IRENA) for developing a long term energy planning programme.
7.2 Trends Analysis
a) Access to affordable, reliable and modern energy
The country has put in place means to ensure equitable and affordable access to
clean energy for people living in both urban and rural areas. The Rural electricity
programme has two resource envelopes that run in parallel to improve access to
electricity for the rural population. Government provides 90% funding for rural
electricity schemes and other partners provide 100% funding for extension of the
electricity grid to rural communities. According to the Annual Energy reports the
proportion of household with access to electricity nationally increased from 69% in
2014 to 78% in 2018. This growth is further disaggregated in the figure below:
Figure 7.1 Proportion of household with access to electricity
The power grid system has stabilized through the introduction of the 3 phased
system and electricity procurement means have been automated to ensure access.
0
10
20
30
40
50
60
70
80
90
National Rural Urban
2016 69 55 84
2018 78 66 88
Pe
rce
nta
ge
s
Population with Access to Electricity

40
b) Improving energy efficiency
The country has developed a number of strategies on the demand side of
management to improve energy efficiency. The aim was to reduce the amount of
energy required to provide products and services. However, the energy intensity
measure of energy inefficiency showed an increase in total primary energy from
1042.72 ktoe in 2015 to 1069.97 ktoe, meaning that energy per unit of GDP
increased from 0.0261 to 0.0264. This indicates a high price or cost of converting
energy into GDP.
7.3 Challenges
a) Energy data collection affected by strained resources and reluctance by
stakeholders to provide information.
b) Electricity prices are on the rise which affects electricity affordability.
c) Awareness on LPG needs to be scaled up to address negative perceptions.
d) Local mines should be re-opened and terms should be favourable to
investors for power production purposes.
7.4 Emerging issues
a) Government is trying to stop the use of incandescent lights and other
electric appliances and to switch to more efficient technologies.
b) Procurement process for 40W solar and 40MW biomass underway and
interested investors encouraged to participate.
c) High capital costs for renewable energy projects.
7.6 Lessons learned
a) Instalment of less efficient energy technologies is cheap but costly in terms
of energy consumption over time as compared to the instalment of more
efficient technologies.
b) ESERA needs to build more awareness on sustainable energy production
and consumption and avail more opportunities in the sector.
c) The country needs to establish more energy generation opportunities for
electricity in order to reduce costs and overreliance on other countries.
d) There is a key role for local financiers and investors to play a role in the
development of the energy sector.
7.5 Describe what actions have been taken to address existing gaps and
challenges
a) Reviewing of electricity laws.
b) Formulation of regulations on energy efficiency.
c) Working with Eswatini Standards Authority to develop standard
specifications for electrical appliances.

41
d) Establishment Solar plant 13.5 MW in Lavumisa.
e) Development of energy efficiency building codes through working with the
energy regulator and construction departments.
7.6 Areas for support
a) Funding for projects to increase local generation of electricity.
b) Technical support for collecting and analysing energy data.
c) Technical studies for exploring clean cooking technologies at the residential
level
7.7 Key messages
a) The use of clean energy efficient technologies is the way to go.
b) Alternative energy production technologies should be considered.
c) Improve efficiency in local production of electricity.
e) Financiers and investors have a key role to play in developing the sector

42
SDG 8: Promote sustained, inclusive and sustainable economic
growth, full and productive employment and decent work for
all.
8.1 Introduction
This goal is about inclusive and sustainable economic growth, full and productive
employment and decent work for all. This is in-line with goal 4 of Agenda 2063:
Transformed Economies and Job Creation. The target for Least Developed
Countries for this Goal is to achieve at least 7% growth in per capita gross domestic
product (GDP) per year. The World Bank (2016) calculates that Eswatini requires
a minimum growth rate of 5% per annum in real GDP, or a growth rate of 2.3%
per annum in real per capita GDP to reduce poverty and inequality. Eswatini
aspires to achieve a high standard of living by emphasising sustainable and
inclusive economic growth through science, technology, and innovation, driven by
light scale manufacturing, commercialising small-scale agriculture, and
promoting artisanal, large scale mining and local entrepreneurs.
The country revised its National Decent Work Policy (2015) to align to new
developments in the labour sector, hence the National Decentralisation Policy
(2018) is in place. The Decent Work Country Programme (2019 – 2023) is currently
under development. The Labour Force survey was conducted on the country’s
human resource to provide information for decision makers on labour market
related issues. To promote sustainable economic growth, Government recently
launched the National Development Plan for the medium term 2019/20 –
2021/2022. This was aimed at addressing development challenges by pursuing

43
economic recovery in all the sectors. The Kingdom of Eswatini Strategic Road Map
2018 -2023 for short term economic recovery interventions was developed to
ensure a quick turnaround in some strategic sectors. The National Micro Small
and Medium Enterprises policy 2018 is in place.
8.2 Trends Analysis
a) Sustain per capita economic growth in accordance with national
circumstances.
Revised estimates for GDP growth indicate that the economy grew by 1.3% in
2016, an upward revision from the September 2016 estimate of -0.6%, but
remained marginally lower than the revised estimates of 1.5% growth in 2015. The
improvement in economic performance mainly benefited from outputs in the
secondary sector. The actual growth rate of real GDP remained constant from 2015
to 2017 and stood at 1.9%. The actual growth rate of real GDP improved at a
declining rate from 0.4% in 2015 to 0.62% in 2018. The GDP per capita grew from
$2798 in 2015 to $4071 in 2018 mainly due to a decline in population.
b) Achieve higher levels of economic productivity through
diversification, technological upgrading and innovation.
Economic growth in a country can be attributed either to increased employment
or more production on average by those employed. The statistics on labour is a key
measure of economic and labour market performance. The annual growth rate of
real GDP per employed increased by 1% between 2015 and 2017. Performance on
the different economic sectors is demonstrated in the figure below:
Primary Secondary Tertiary
2015 -4.9 0.8 1.1
2017 -4.2 3.1 2
-6
-5
-4
-3
-2
-1
0
1
2
3
4
Re
al
GD
P G
row
th r
ate
Real GDP growth rate per sector

44
Figure 8.1: Annual growth rate of real GDP per sector
c) Promote productive activities, creation of decent jobs,
entrepreneurship, creativity and innovation, and encourage the
formalization and growth of micro-, small-and medium-sized
enterprises.
The quality of employment in the economy is applicable to all countries. There was
an increase of about 10% in the proportion of informal employment in non-
agriculture sector nationally when comparing the 2013 and 2016 Labour Force
Survey Reports, from 54.3% in 2013 to 65.2% in 2016. About 67,582 (sixty-seven
thousand five hundred and eighty two) Micro Small and Medium Enterprises
(MSME) were established and 14,765 (fourteen thousand seven hundred and
sixty-five) were registered. The Financial Inclusion Strategy (2016) has improved
access to Finance for MSME, including the informal sector.
d) Full and productive employment and decent work for all.
Working population by sex and age.
The working age population is most pronounced between ages 25 and 34 at 37.9%
for females and 45.6% for males. The ages 65 and above category has the least
number of working population (Labour force Survey 2016) as shown below:
Figure 8.3 Working population by age and sex
Unemployment by sex and age
The Labour force survey 2016 indicates a decline in national unemployment by
almost 5% between 2013 and 2016, from 28.1% to 23%. This was a result of the
implementation of government’s poverty reduction initiatives aimed at
empowering rural communities to achieve sustainable livelihoods. There are
15-24 25 -34 35 -44 45 -54 55 -64 65+
Females 34.7 37.9 17.5 6 2.5 1.5
Males 32.5 45.6 14.2 5.2 2 0.5
0
5
10
15
20
25
30
35
40
45
50
Pe
rce
nta
ge
Working Population

45
programmes and funds in place to reduce youth unemployment, such as the Youth
Enterprise fund and Junior Achievement Awards. The table below shows the
proportions of unemployed persons by age groups.
Table 8.1: Unemployed persons by Sex and Age
2013 2016 2013 2016
Age
group
Males
(percentages)
Males
(percentages)
Females
(percentages)
Females
(percentages)
15-24 33 34.7 32 32.5
25 -34 40.7 37.9 41.7 45.6
35 -44 14.4 17.5 14.9 14.2
45 -54 8.4 6 8.2 5.2
55 -64 2.6 2.5 2.4 2
65+ 0.9 1.5 0.7 0.5
Labour Force survey 2013 and 2016.
8.4 Challenges
a) Ease of doing business is not sufficient in the country.
b) In spite of the current poverty reduction initiatives in place, youth
unemployment remains high.
c) Dwindling economy with overreliance on SACU receipts.
d) Disability mainstreaming is still a challenge especially in education and in
employment opportunities.
e) Retirement has a knock on effect on the employment rate.
f) Firm workers are paid low salaries.
g) Inadequate budget for conducting socio-economic and labour related
surveys.
h) Vulnerability to external shocks leading to poor and slow implementation
of programmes and policies.
8.5 Emerging Issues
a) Climate change issues need more adaptive and responsive strategies.
b) Current and future trade agreements that might have a negative impact on
the country’s economy.
8.6 Lessons learned
a) The skills in the market should be aligned to national policies.
b) Analyze the skill set of the country to inform policy direction.
c) Need for business mentorship for SMMEs.
d) Need for improved coordination and collaboration among stakeholders to
improve economic growth.

46
8.7 Actions taken to address existing gaps and challenges
a) The National Development Strategy was revised and renamed the Strategy
for Sustainable Development and Inclusive Growth.
b) Kingdom of Eswatini Strategic Roadmap 2018/9 to 2022/3 is in place.
c) The National Development Plan 2018/19 to 2022/3 is in place.
d) Some poverty reduction funds (e.g. rural development fund, Youth
Enterprise) have been revised and the monitoring aspect strengthened.
e) Capacity buildings to strengthen SMME development is continuously done.
f) The Financial Inclusion Strategy has strengthened access to finance for
SMME development.
8.8 Areas for support
a) Develop the Labour Market Information System.
b) Conduct the Labour Force Surveys at least annually.
c) Capacity building for MSME on International Standards.
d) Support to conduct the Economic Census every five years to update the GDP
base year.
e) Support to develop mentorship programmes.
8.9 Key Messages
a) Introduce Technical and Vocational Education Training at grassroots level
to expedite the economy.
b) Countries should move towards setting better minimum wages to ensure
decent lives for all.
c) Increase support MSME development to drive economic growth.
d) Job creation especially for the youth.

47
SDG 9: Build resilient infrastructure, promote inclusive and
sustainable industrialization and foster innovation.
9.1 Introduction
Goal 9 is about resilient infrastructure, inclusive and sustainable
industrialisation, and innovation. This conforms to goal 10 of the African Union
Agenda 2063: World Class Infrastructure criss-crosses Africa. The country has a
public investment programme in place that addresses public policy issues across
sectors in terms of infrastructure development needs. The current focus is on
increasing the coverage of its strategic rail and road network and reinforcing
participation in regional infrastructural development initiatives, such as the
Regional Indicative Strategic Development Plan (SADC). To improve water
resources development and water harvesting infrastructure, feasibility studies for
dam constructions are currently ongoing. Completed projects include Maguga and
Lubovane dams.
For effective and efficient implementation of the Information Communication
and Technology sector, the country is reviewing the National Information
Communication Infrastructure Policy of 2006. The Royal Science and
Technology Park Act of 2012 was enacted to establish Phocweni (Innovation
and Technology) park and Nokwane (Bio-Technology) park. Furthermore, the
Electronic Act of 2012 was enacted to establish the Information
Communications Technology regulator called Eswatini Communications
Commission to regulate the ICT sector.
The National Transport Policy and Masterplan are in place for a robust
transport sector. The Road Outspan Act was developed to regulate the road
infrastructure. Finally, the Construction Industry Council was established to
regulate the construction industry. Together these policies aim towards
building resilient and sustainable infrastructure.

48
The National Industrial Development Policy 2015 – 2020 is in place. Special
Economic Zones for Foreign Direct Investment sites were allocated in
Matsapha Industrial area. A new development site at Sidvokodvo has been
identified as an area for expansion.
9.2 Trends Analysis
a) Develop quality, reliable, sustainable and resilient infrastructure,
including regional and trans-border infrastructure
The basic role of transport infrastructure is to generate connections between
geographically separated locations for both commercial and individual needs. The
implementation of the capital programme in the country was affected by the
adverse fiscal situation. The proportion of gazetted roads network was very
insignificant as shown by the figure below:
Figure 9.1 Proportion of gazetted road network accessible all year round
Although the progress in implementing the Transport Master plan is limited, the
quality of roads have improved and accessibility for persons living with disabilities
increased. Guide blocks along the feeder roads and disability friendly traffic lights
along busy town streets have been put in place.
b) Passenger and freight volumes, by rail and air transport
The county has two major parastatals for air and rail transport, namely: the
Eswatini Civil Aviation Authority, an organisation set up to promote safe, secure,
regular and efficient air transport services from Eswatini to the republic of South
Africa; and the Eswatini Railway, an organization that provides transport services
Paved Unpaved Feeder
2015 1398 1825 2067
2017 1404 1825 2061
0
500
1000
1500
2000
2500
Kil
om
etr
es
Roads Infratructure

49
for import and export of commodities as well as transit cargo. The table below
shows data on passenger and freight volumes by rail and air transport obtained
from the Ministry of Public Works and Transport Annual Reports:
Table 9.1 Passenger and freight volumes, by rail and air transport
2016 2017
Air Transport passengers 56 785 56 755
Rail transport Exports(sugar , cane
fruits, coal and containers)
239 000 tonnes
224 000 tonnes
Rail Imports (P.O.L/TC, cement ,
wheat, containers)
250 000 tonnes
265 000 tonnes
Transit traffic (magnetite, rock
phosphate, fuel and other ores)
7019 000 tonnes 7628 000 tonnes
c) Population covered by a mobile network, by technology.
The country is covered by the 2G and 3G network. The 4G has been licensed and
has been deployed
9.3 Challenges
a) The physical infrastructure does not respond to the prioritised needs of the
country to the achievement of a certain economic goal.
b) The available infrastructures for the disabled needs to be rolled out to all
areas.
c) Lack of schools which are conducive for the disabled at regional level.
d) General maintenance of existing road networks and other public
infrastructure is a challenge.
e) The current industrial area is now saturated and there is a need to
decentralise.
f) There is not much value addition in the manufacturing sector.
g) Lack of funding for Research and Development (R&D) for innovation,
infrastructure and industrialization.
h) Currently internet costs are relatively high, thus eliminating inclusive and
innovative growth and acting as one of the major challenges for investment
in the country.
i) Dwindling FDI.
j) Turnaround time for procurement process is lengthy.
k) High utility costs makes investment difficult for operators to engage in
business.

50
9.4 Emerging Issues
a) One of our major exports through the rail network has been coal for thermal
production but it is now under threat as there is now a growing concern
globally over its use because of its high carbon emissions and the
environment impact these have.
b) High traffic volumes putting pressure on the road infrastructure emanating
from grey imports and heavy trucks.
9.5 Lessons learned
a) Previously, industrial land was being sold but Government has since
prioritized leasing the land which has led to more efficient industrial
activity.
9.6 Actions that have been taken to address existing gaps and challenges
a) RSTP, ICT parks and special economic zones establishment.
b) The 5 - 7% levy is now charged on imported vehicles in addition to the 15%
VAT charge.
c) Introduced the pro-base road programme (200km annually).
9.6.1 Areas for support
a) Full implementation of structures such as RSTP.
b) Building more inclusive schools to support people living with disabilities.
c) Investment in Research and Development (R&D) and ICT infrastructures.
d) Industry driven training that will support industrialization.
e) Securing funding to link east -south roads, which will link parts of
Shiselweni – Lubombo – Manzini.
9.6.2 Key messages
a) Decentralize infrastructure and promote innovation nationally.

51
SDG13: Take urgent action to combat climate change and its
impacts.
13.1 Introduction
The Eswatini Environment Action Plan consists of strategies to address
environmental problems, including climate change. This corresponds to goal 7 of
the African Union Agenda 2063: Environmentally sustainable climate resilient
economies and communities. Agriculture forms the base of the economy, as a large
part of the manufacturing sector is agro-based. Therefore, diversification of
economic activities is necessary if the country is to reduce its level of vulnerability
to climate change. The health sector is likely to be adversely affected by climate
change due to an increase in vector-borne diseases resulting from increased
temperature and precipitation. Water resources and biodiversity have been
recognized as resources at risk from climate change. The First National
Communication Report of 21 May 2002, adaptation options were identified to
address these issues.
The climate is generally sub-tropical with wet and hot summers and cool and dry
winters. However, the country is predisposed to natural disasters that disrupt this
seasonal pattern. There was a severe drought during the period of 1989 until 1994,
and the region has also experienced tropical cyclones and storms. Climate change
is likely to affect the occurrence and scale of these disasters and their associated
impacts.
Climate Change increases climate related disaster risks, particular in terms of
extreme weather events resulting in increased vulnerability and exposure. This
disrupts livelihoods, leads to loss of life and results in non-functional social and
economic systems.

52
13.2 Trends
a) Strengthen resilience and adaptive capacity to climate-related
hazards and natural disasters
The Sendai framework for Disaster Risk Reduction (DRR) 2015 – 2030 calls for
national governments to adopt and implement national DRR strategies with their
own targets, indicators and timeframes. Eswatini reviewed its National Disaster
Risk Reduction Policy and developed a National Resilience Strategy and Disaster
Risk Reduction Plan of Action (2017 – 2021). DRR has been mainstreamed into
the National Development Plan (2019/20 – 2021/2022) and the Seasonal Multi-
Hazard Contingency Plan (2015, 2016, 2017 and 2018) was reviewed.
The most common type of disaster in the country is drought. This is annually
monitored by the Vulnerability Assessment Committee (VAC). The number of
persons affected by draught declined by almost 3% between 2015 and 2017. The
disaster loss and damages accounting system was established to strengthen
records management systems.
b) Integrate climate change measures into national policies,
strategies and planning
The country developed the National Climate Change Policy and Strategy 2016 and
the National Climate Change Strategy and Action Plan (2014-2019). A technical
needs assessment was drawn from the Climate Change Policy and Strategy geared
to strengthening institutional, systemic and individual capacity-building on
climate change mitigation, adaptation and impact reduction, including the
deployment of technologies that will help fast-track this goal. Furthermore, the
Kingdom is currently preparing the Fourth National Communication (TNC) with
the technology transfer needs and actions.
c) Improve education, awareness-raising on climate change
mitigation, adaptation, impact reduction and early warning
To strengthen DRR awareness in the education sector, disaster issues were
integrated in the revised education policy. The Emergency Education Action Plan
is in place. Finally, DRR key concepts have been integrated into curricula for both
primary and tertiary institutions (MSc in Climate Change and Sustainable
Development (UNESWA) and professional certificate on DRR).
There is a Multi-Hazard Early Warning System forum, which involves a number
of stakeholders that introduce and update the climate curriculum at schools. There
are elements of climate change that have been mainstreamed in the schools
curricula. They have updated the Junior Certificate Geography Syllabus.

53
13.3 Challenges
a) Raising awareness takes long because it involves behavioural change.
b) Insufficient resources to finance DRR initiatives and projects against
available comprehensive plans and programmes.
c) Lack of National Strategy for Disaster Risk Reduction (DRR) that can be
owned by all sectors. The strategy has to succeed the obsolete National
Action Plan (NAP) for DRR 2008-2015.
d) Lack of National Monitoring and Evaluation Framework for DRR to
generate evidence to influence policy.
e) Weak mainstreaming of DRR into sector budgets, although achievements
have been attained in mainstreaming DRR into sector plans.
f) Weak synergies between DRR and Climate Change Adaptation.
13.4 Emerging issues
a) Traditional technology can mitigate some challenges but no-one is investing
in them.
b) Review of National DRR policy to align it to the focus of global policy
framework.
c) Cash based transfer concept now used to transfer disaster assistance.
d) Integration of Science, Technology and Innovation (STI) to DRR for hazard
mapping and analysis (use of unmanned aerial vehicles/Drones and
Amphibian Vehicles).
e) Integration of indigenous knowledge management systems for DRR.
f) Proliferation of research studies in relation to DRR in the country.
13.5 Lessons learned
a) Traditional farming methods were better.
b) Need to motivate farmers to increase production through climate smart
technologies.
c) DRR financing windows (external and internal) are diminishing.
Government can’t adequately finance DRR programmes due to her liquidity
crisis while donor community cannot cope with the requests at global level.
d) Vulnerability in Eswatini is socially constructed (caused by human actions)
besides climate change and other drivers.
e) Transboundary cooperation with neighbouring countries through Strategic
Partnership Agreements (SPA) is a cornerstone for DRR.
13.6 Areas for support
a) To conduct awareness on climate smart technologies and practices.

54
b) Capitalisation and operationalization of the Disaster Emergency Response
Fund as established by the Disaster Management Act 2006.
13.7 Key messages
a) Build capacity for government officials on climate smart technologies.
b) Promote climate change technologies since it is a cross cutting issue.
c) Making DRR an integral component to national development planning and
development practice.
55
SDG 16: Promote peaceful and inclusive societies for
sustainable development, provide access to justice for all and
build effective, accountable and inclusive institutions at all
levels.
16.1 Introduction
Despite the knowledge that the Kingdom of Eswatini is a peaceful country, to
achieve the SDGs the country needs to address corruption, crime and human
rights violations. This is in-line with African Union Agenda 2063 goal 13: Preserve
Peace, Security and Stability. It is important that governments, non-government
organizations, private sector, civil society, communities and individuals work
together to implement lasting solutions to reduce violence, deliver justice, combat
corruption and ensure inclusive participation at all times. This will ensure that
people everywhere are free of fear from all forms of violence and feel safe as they
go about their lives, no matter what their ethnicity, faith or sexual orientation is.
Government has strengthened the sector by putting in place some policies and
programmes to ensure peaceful communities. These include the enactment of the
Human Trafficking and Smuggling Act 9 of 2009 and the legislative framework
for sexual offences and domestic violence has been strengthened by the enactment
of the Sexual Offences and Domestic Violence (SODV) Act of 2018. Furthermore,
the Human Rights and Integrity Commission and Anti-Corruption Commission
unit were established. A multi sectoral task team was put in place to combat crime
and a One-stop centre for domestic violence cases was established. Finally, child
friendly courts and digitalized vital (court processes, remote remand, digital
collection of evidence) services have been rolled out in all of the administrative
regions.

56
16.2 Trends analysis
a) Reducing all forms of violence and related death rates
Security from violence is a pre-requisite for individuals to enjoy a safe and active
life and for societies to develop freely. Violence and related death rates is a
composite indicator constructed by measuring two types of death, intentional and
conflict. Eswatini has very insignificant cases of conflict-related deaths of about
0.0017%. However the number of victims of intentional homicide are evident and
on the rise and most murder cases have a similar pattern of missing body parts
which could be associated with ritual killings. Others were through irresponsible
parenting e.g. drowning of toddlers. The population in Eswatini is 1,093,238
according to the 2017 Population Census report. The information below is for the
entire population. Monitoring intentional homicides is necessary to better assess
their causes and consequences and, in the longer term, to develop effective
prevention measures. The Table below shows the trend analysis from annual
Police Reports.
Table 16.1 Number of victims of intentional homicide in the entire population
By Age 2016 2017
0 – 17 years 9 13
18 - 24 years 18 24
25 years and above 85 96
By Gender
Males 83 100
Females 29 33
Total number of deaths 112 133
Royal Eswatini Police Annual Reports
e) End abuse, exploitation, trafficking and all forms of violence
against and torture of children.
The Human trafficking and Smuggling department was established and an Anti-
Human traffic task force is in operation for effective monitoring of human
trafficking. Human trafficking is a major violation of the victim’s human rights,
dignity and inclusion to society. It has an impact on a person’s health and
opportunities, it creates economic inequalities and it is a threat to personal
security. The study on the Drivers of Violence against children in Eswatini (2015)
was done to inform the proportion of children aged 1-17 years who experienced

57
any physical punishment and/or psychological aggression by caregivers and of
young women aged 18-29 years who experienced sexual violence.
f) Promote the rule of law at the national and international levels and
ensure equal access to justice for all
This entails the number of victims of violent crime (physical or sexual assault) in
the previous 12 months who reported their last incident to competent authorities
or through other officially recognized conflict resolution mechanisms. Competent
authorities includes police, prosecutors or other authorities with competencies to
investigate certain crimes (such as corruption or fraud). Trends in reporting rates
of violent crime can be used to monitor public trust and confidence in the security
system on the basis of actual behaviour and not perceptions. The National
Surveillance System on Violence Annual Report gave the following trend analysis.
Figure 16.1 Annual number of reported cases of violence
g) Silencing of the guns
As a means to significantly reduce illicit financial and arms flows, strengthen the
recovery and return of stolen assets and combat all forms of organized crime, the
country strengthened its operations and initiatives to recover illegal firearms. The
Annual Police Reports show that there was an increase in the number of seized
small arms and light weapons that are recorded and traced.
0
5000
10000
15000
2015 2016
Reported cases 7729 10504
Reported cases
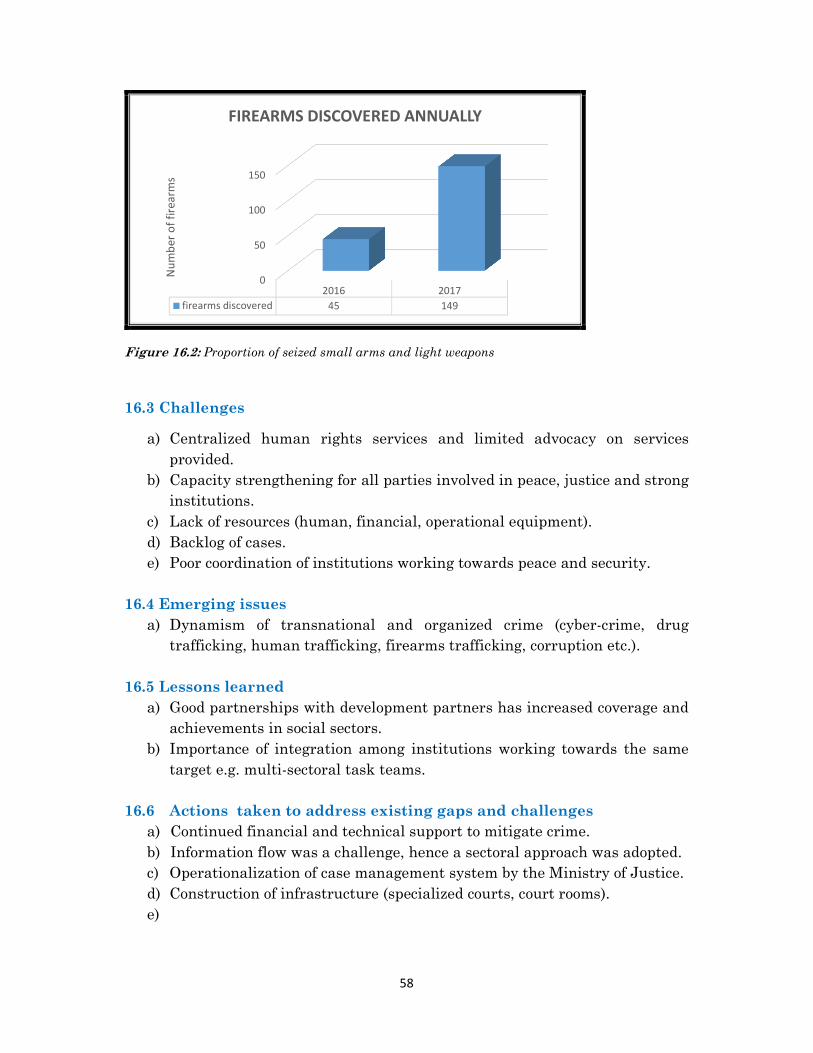
58
Figure 16.2: Proportion of seized small arms and light weapons
16.3 Challenges
a) Centralized human rights services and limited advocacy on services
provided.
b) Capacity strengthening for all parties involved in peace, justice and strong
institutions.
c) Lack of resources (human, financial, operational equipment).
d) Backlog of cases.
e) Poor coordination of institutions working towards peace and security.
16.4 Emerging issues
a) Dynamism of transnational and organized crime (cyber-crime, drug
trafficking, human trafficking, firearms trafficking, corruption etc.).
16.5 Lessons learned
a) Good partnerships with development partners has increased coverage and
achievements in social sectors.
b) Importance of integration among institutions working towards the same
target e.g. multi-sectoral task teams.
16.6 Actions taken to address existing gaps and challenges
a) Continued financial and technical support to mitigate crime.
b) Information flow was a challenge, hence a sectoral approach was adopted.
c) Operationalization of case management system by the Ministry of Justice.
d) Construction of infrastructure (specialized courts, court rooms).
e)
0
50
100
150
2016 2017
firearms discovered 45 149
Nu
mb
er
of
fire
arm
s
FIREARMS DISCOVERED ANNUALLY

59
16.7 Areas for support
a) Strengthen technical capacity of the Human Rights and Integrity
Commission.
b) All government ministries to partner with civil society in ensuring peace
and stability
c) Strengthen the implementation of sector wide development plans to
improve planning, monitoring and evaluation of programs and
interventions.
d) Support prevention and response to violence combating interventions.
e) Evidence generation and documentation to inform planning, budgeting and
decision making.
f) Infrastructure development (forensics laboratory, court rooms, specialized
courts).
g) Financial and technical support for an integrated justice system.
16.8 Key messages
a) Interrogate emerging issues impacting on peace safety and justice.
b) Develop a comprehensive strategy to mitigate against crimes of violence
and organized crimes.
c) Improve coordination within institutions working towards good
governance.
60
SDG17: Strengthen the means of implementation and
revitalize the Global Partnership for Sustainable
Development.
17.1 Introduction
A successful sustainable development agenda requires partnerships between
governments, the private sector and civil society. Continental financial and monetary
institutions established and functional. This is in-line with African Union Agenda
2063 goal 9: At the global level, it was agreed that serious action is needed to
mobilize, redirect and unlock the transformative power of trillions of dollars of
private resources across the globe to deliver on sustainable development
objectives. It was further established that long-term investments, including
foreign direct investment, are needed in critical sectors (such as sustainable
energy, infrastructure and transport, as well as information and communications
technologies), especially in developing countries. The public sector’s primary role
is this transformative process was considered to be to set a clear direction. The
review and monitoring of frameworks, regulations and incentive structures that
enable long term investments were to be retooled to attract more investments and
reinforce sustainable development.
In late 2017, Cabinet approved the National Strategy for Sustainable
Development and Inclusive Growth as the national development framework that
aligns regional and global development frameworks and conventions after a
review process. The Aid Policy of 2000 was revised and finalised to inform
development of the National Development Cooperation Policy 2019. This will serve
as a guide to all relevant agencies of Government, development partners, civil
society organizations and other stakeholders on coordination and management of
development cooperation resources.
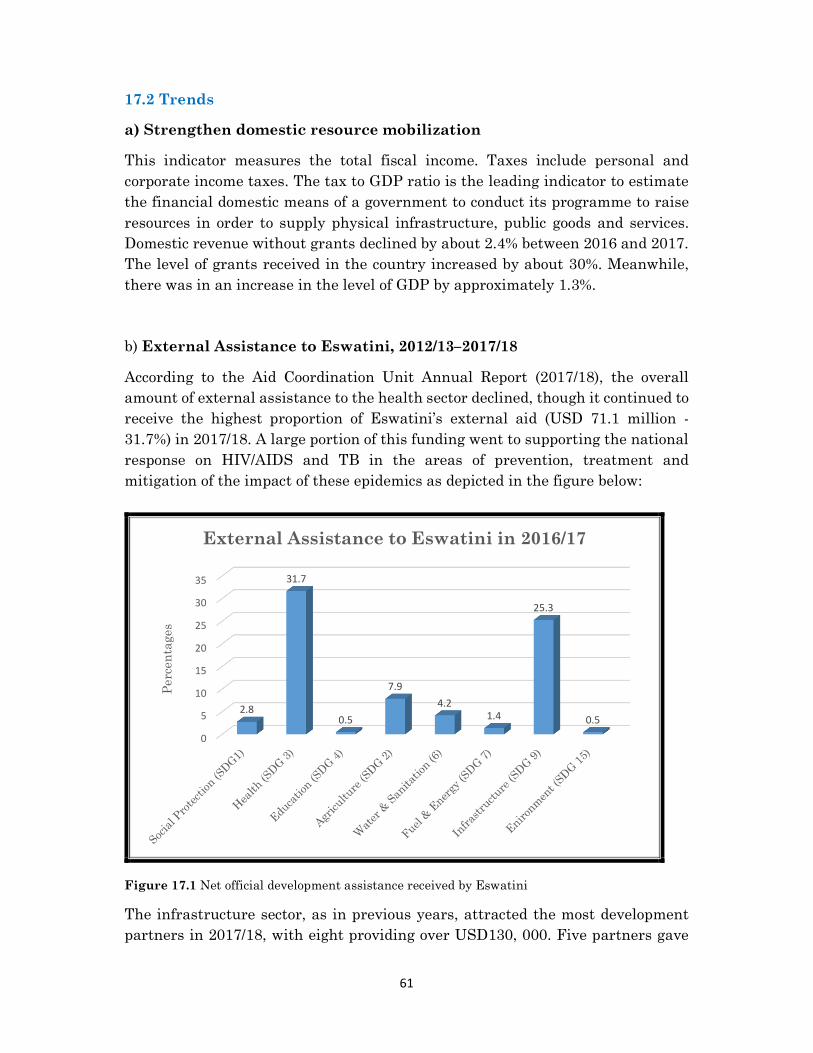
61
17.2 Trends
a) Strengthen domestic resource mobilization
This indicator measures the total fiscal income. Taxes include personal and
corporate income taxes. The tax to GDP ratio is the leading indicator to estimate
the financial domestic means of a government to conduct its programme to raise
resources in order to supply physical infrastructure, public goods and services.
Domestic revenue without grants declined by about 2.4% between 2016 and 2017.
The level of grants received in the country increased by about 30%. Meanwhile,
there was in an increase in the level of GDP by approximately 1.3%.
b) External Assistance to Eswatini, 2012/13–2017/18
According to the Aid Coordination Unit Annual Report (2017/18), the overall
amount of external assistance to the health sector declined, though it continued to
receive the highest proportion of Eswatini’s external aid (USD 71.1 million -
31.7%) in 2017/18. A large portion of this funding went to supporting the national
response on HIV/AIDS and TB in the areas of prevention, treatment and
mitigation of the impact of these epidemics as depicted in the figure below:
Figure 17.1 Net official development assistance received by Eswatini
The infrastructure sector, as in previous years, attracted the most development
partners in 2017/18, with eight providing over USD130, 000. Five partners gave
0
5
10
15
20
25
30
35
2.8
31.7
0.5
7.9
4.2
1.4
25.3
0.5
Perc
en
tages
External Assistance to Eswatini in 2016/17
62
more than USD130, 000 in the health sector while the social protection, capacity
building and agriculture sectors each had four active partners. The fuel and energy
sector had only one active partner providing over USD130, 000 in 2017/18,
17.3 Successes
a) Benefits from the South-south cooperation that exists.
b) GEF in the country has been established.
c) Host of SADC University.
d) Implementation of projects with little or no ineligible expenses.
e) Public Finance Management Act of 2017 enacted to boost donor confidence
on government accountability.
17.4 Challenges
a) Status of middle income country has seen more agencies go out.
b) There is a delay in the adoption and implementation of the regulations of
the Public Finance Management Act of 2017.
c) At times, donor’s interest is not in synchrony with government’s priorities.
d) Some sustainability projects suffers from donor fund discontinuation
prematurely.
e) Lack of strategic planning to facilitate a proper handover from donors to
government with regard to joint funded projects.
f) Failure to comply with mandate given to us by donors.
g) Lack support for information technology infrastructure.
h) Some development partner’s flows are not captured in the ACMS
monitoring and evaluation system.
i) Lack of a robust process for sharing information on external financed
interventions between government ministries.
17.5 Emerging Issues
a) The incentive package for attracting FDI has not resulted in significant
inflows of investment.
b) Environmental issues are escalating whereas the country has not been able
to attract development assistance to the sector. .
c) The regulatory framework requires a review to attract development
assistance.
17.6 Lessons learnt
a) There is need to harmonize the policy environment in line with the
necessary conditions to attract investment in the country
b) Delays in approving the new aid policy have been an obstacle.

63
c) Capacity is a challenge in implementing policies and programmes resulting
in the need to supplement with technical assistance.
17.7 Actions taken to address existing gaps and challenges
a) Donor and government dialogues to re-evaluate obligations.
b) PFM enacted to improve accountability, transparency and to curb
corruption.
c) Introduction of integrated financial management system to improve budget
allocation and expenditure tracking.
17.8 Areas for support
a) ICT infrastructure.
17.9 Key messages
a) There is a need to create an enabling policy environment for the
implementation of SDGs in the country to guide development partners.

64
CHAPTER 5: CHALLENGES
Implementation of the SDGs in the country has been met with a number of
challenges identified as follows:
a) Resources for implementation
SDGs implementation is based on the principle that domestic resources should be
utilized not necessarily dependent of foreign resources particularly financial
resources. The prevailing fiscal situation in the country is such that there are very
limited resources for effective implementation.
b) Capacity for adaptation and resource mobilization
Development sphere is dynamic and faced with emerging issues that require
capacities or skills for adaption to be at the core as new tools are being put in place.
Such capacities come at a price which is not a favourable position for the country
currently.
c) Timely and quality data
Policy or decision making, planning, programming and budgeting are all
dependent on availability of timely and quality statistics to provide the situation
on the ground. Research by its nature is expensive and so are the studies or
surveys that need to be undertaken. The studies compete for resources with other
priorities for the country resulting in time lags for availability of the much needed
and critical data.
d) Public investment
Public investment is paramount for the country’s development in that returns
from such investments should provide domestic revenue, among others. The
shrinking resources envelop for the Kingdom resulted in budget for such an
investment becoming a residual from recurrent budget.
e) Monitoring tools
Tools for monitoring and evaluation of progress made the implementation of the
goals needs strengthening as well as measuring impact thereof. This will inform
the process if progress is on the right direction towards achievement of the goal or
targets or if there is need to re-strategize.
f) Targeting
Beneficiaries to social protection floors come in different forms. It becomes
necessary to ensure that targeting is done in an effective manner. Such support is
at a huge cost to government and in light of the limited resources, it is important
65
to ensure that the benefits from such an investment are positive and the cost of
providing the service does not out way the support.
g) MIC status of the country
The Middle Income Country status of the country has negative impact to
development of the country. Development programme of the country is supported
through partnerships with development partners, in terms of loans, grants etc.
This status has resulted in the inability to access some loans at favourable
conditions which has brought about negative effects.

66
CHAPTER 6: LESSONS LEARNT
a) Mainstreaming of the goals into national development
Implementation of the SDGs requires that they be mainstreamed into national
development frameworks. They are not a stand-alone phenomenon but are a
means of fast tracking implementation of national development programme as
such should be integrated to foster efficiency.
b) Prioritisation
Given limited resources available for implementing the goals against competing
national priorities, it is very important to identify areas of highest priority that
will yield high returns at the shortest turn-around time with multiplier effect on
other goals for visible change in development.
c) Targeting
The high levels of poverty in the country demands a vibrant that social protection
programmes to cater for the basic needs of the poor and marginalized groups of
the population. Such floors thrive on the core characteristic of being sustainable.
This is dependent on efficiency in the identification of intended beneficiaries. Only
when targeting has been done right that such support could be sustainable.
d) Capacity building / strengthening
Implementation of the goals entails building of capacity in areas where it does not
exist and strengthening where it is limited as there is need for adaptation to new
development tools as they foster effective means. Such tools include climate
change adaptation tools and SDGs based planning and budgeting. The nature of
development is dynamic and as such demands reorientation of skills over time
through technology and innovation.

67
CHAPTER 7: CONCLUSION
The analysis of the current situation of data availability for the global SDGs which
was conducted in collaboration with stakeholders revealed an information base
against which to monitor and assess indicators. The findings showed the
availability of information in the various sectors which was very minimal. This
limitation is shared by most developing countries and hence the need for the global
community to assist Eswatini in achieving the 2030 development Agenda.
Most sector experts data collection and analysis skill needs to be strengthened to
ensure quality statistics are reported on a timely basis. Furthermore sector
experts need to be furnished with appropriate data collection tools and equipment.
The Central Statistics Office should be reinforced with more personnel, skill,
equipment and financial resources to conduct national surveys and biannual
projections of SDGs indicators. Hence the need for government to set aside enough
resources to augment data capacities and for the implementation of the SDG.
Capacity building and forming partnerships with both local and international
stakeholders are of paramount importance if the country is to attain the SDG for
the country to learn how other developing countries have mainstreamed the SDGs
development agenda, to share experiences and solutions on driving this agenda
forward to ensure that all the Sustainable Development Goals are achieved. It is
imperative to revive the sector wide approach through the SDGs lens. This will
enable sectors to produce sector development plans and report implementation
twice a year.
Finally, the success of this development agenda will depend on collective effort
between government, development partners, civil society, private sector and the
nation at large. The results will improve the livelihood of the nation from grass
root level as economic wellbeing will improve and people will gradually be
entangled from the vicious poverty cycle. This will lead to an improvement in
national income per capita which will result in increased gross domestic products
since the country will adopt new cost effective and efficient technologies for
production, channelling the country to self-sufficiency in the medium term.