the language of science and readability: correlations
TRANSCRIPT
The Language of Science and
Readability: Correlations between
Linguistic Features in TIMSS Science
Items and the Performance of Different
Groups of Swedish 8th Grade Students
Tomas Persson*,Department of Education, Uppsala University, Uppsala, Sweden
AbstractThis exploratory study examines how linguistic features of the Swedish TIMSS 2011 grade 8
science items correlate with results from different groups of students. Language use in different
science subjects is analysed using four characteristic meaning dimensions of scientific language:
Packing, Precision, Presentation of information, and Personification within the text, along with
established measures of readability and information load.
For each subject, one or more of the meaning dimensions show statistically significant correlations
with students’ performances with small to medium effect sizes. The results show that higher
packing is positively correlated with students’ results in earth science, negatively correlated in
physics, and has no significant correlations in biology or chemistry. Placing items in everyday
contexts reduces the likelihood of the items being answered correctly, and skilled readers are aided
by higher precision in items, while less skilled readers seem unaffected. Many meaning dimensions
that influence high performers’ results do not influence those of low performers, and vice versa.
The use of meaning dimensions is shown to be an enriching complementary method for analysing
language use in science, as it connects the language use in items to student performance, while
established measures do not.
Keywords: science education; scientific language; readability formulas; assessment;
student achievement
Received: October 2015; Accepted: March 2016; Published: May 2016
1. Introduction
Drawing conclusions about students’ scientific understanding from answers to test
questions is not an easy task. Most teachers know that there are many different
ways � other than those intended � for students to interpret questions. Research on
*Correspondence to: Tomas Persson, Department of Education, Uppsala University, Box 2136,
SE-750 02 Uppsala, Sweden. Email: [email protected]
Nordic Journal of Literacy Research
#2016 Tomas Persson. This is an Open Access article distributed under the terms of the Creative Commons
Attribution 4.0 International License (http://creativecommons.org/licenses/by/4.0/), allowing third parties to copy and
redistribute the material in any medium or format and to remix, transform, and build upon the material for any purpose,
even commercially, provided the original work is properly cited and states its license.Citation: Tomas Persson. ‘‘The Language of Science and Readability: Correlations between Linguistic Features in TIMSS
Science Items and the Performance of Different Groups of Swedish 8th Grade Students.’’ Nordic Journal of Literacy Research,Vol. 2, 2016, pp. 1�27. http://dx.doi.org/10.17585/njlr.v2.186 1

tests has shown that incorrect responses do not necessarily indicate a lack of
knowledge about a concept (e.g. Harlow & Jones, 2004; Oakland & Lane, 2004;
Rodrigues, Haladyna, & Downing, 2002; Schoultz, 2000). It can be caused by poorly
constructed questions, students’ lack of vocabulary, poor reading skills, or
misinterpretations of (elements within) questions. Consequently, that which is
measured is influenced by the reading demands the questions have, rendering it
necessary to investigate the relationship between students’ results and the reading
demands of the questions.
This study analyses approximately 200 science items and 5,500 students’
answers from the 2011 Swedish version of the international study TIMSS-the
Trends in International Mathematics and Science Study by the International
Association for the Evaluation of Educational Achievement (IEA) (Mullis, Martin,
Ruddock, O’Sullivan, & Preuschoff, 2009). The understanding of the interaction
between language use and student performance can be improved by examining
how characteristic meaning dimensions of science, that is, the Packing, Precision,
Personification, and Presentation of information (see Persson, af Geijerstam &
Liberg, in press), in items from different scientific subject areas, correlate with the
performance of different student groups. Items are also analysed using established
measures of readability and information load. The results from this study can
therefore help teachers adapt their teaching in specific subjects to better suit various
student needs when learning science. This study can also help broaden the
theoretical base of how readability formulas can be designed by introducing
a quantitative method based on a social semiotic perspective to analyse the
language use in short science items. As English is the target language for most
readability studies, with few large-scale studies existing in Swedish (Heimann
Muhlenbock, 2013), testing a method that is not confined to one language can
contribute not only to Swedish readability research but also to readability research in
general.
2. Aims of the study
By analysing science items with meaning dimensions in addition to more established
readability measures, this study intends to highlight some of the ways that language
use in different kinds of items correlates with the performance of different groups of
students taking the test. Using students’ results and items from the Swedish version
of TIMSS 2011, this study will answer the following research questions:
How do meaning dimensions in the language used in items in different science
subject areas correlate with how different groups of 8th grade students succeed in
answering these items?
What differences can be found when comparing results from this analysis using
meaning dimensions with corresponding results from established measures of
readability and information load?
Tomas Persson
2

3. Previous research
3.1. Relationships between the reader and text
Using three data sets (2000, 2003, and 2006) from the Program for International
Student Assessment (PISA) (OECD, n.d.), an international study, Cromley (2009)
found large correlations (e.g. 0.859, 0.876, and 0.842 for Sweden) between students’
performances in science and their reading scores. Three explanations were
hypothesized: reading comprehension causes scientific proficiency; scientific profi-
ciency causes reading comprehension; or that a third factor causes both reading
comprehension and scientific proficiency.
Although I am not able to test the three primary hypotheses with these data, I leantoward the third explanation: that background knowledge, reading comprehensionstrategies, general vocabulary, inference, and other products of extensive readingexperience also drive higher science proficiency. (Cromley, 2009, p. 115)
Cromley concludes that one way to improve results on science tests might be to
improve students’ comprehension of written science texts. Advocating the concept of
disciplinary literacy, Shanahan and Shanahan (2012) argue that it is the differences
between the disciplines that create texts with different requirements for readers. To
be a successful reader, students must understand how to use different approaches to
reading and writing in different disciplines, as opposed to acquiring some sort of
general reading skill. Teaching that focuses on general literacy skills and abilities
that can be applied across content areas is suitable for younger children, but as
students get older, reading and writing instruction should become increasingly
disciplinary, addressing the specific reading demands of different disciplines or
subjects (Shanahan & Shanahan, 2008). As many linguistic features are specific to
particular discourses, it is more beneficial for students to be given an understanding
of specific features in the discourses they will encounter than to search for
overarching, universally applicable teaching items (Hyland & Tse, 2007).
Schoultz (2000) has shown that interpreting science items is a major problem for
students. This may be due to single technical terms that students do not understand,
or highly abstract examples that are difficult to connect to the response options. Some
students may have the necessary skills and strategies to solve a problem, but if they do
not understand the question as such, they will probably not be able to answer it
correctly. Harlow and Jones (2004) found that ambiguous language use in TIMSS
created opportunities for different interpretations, resulting in answers that did not
always reflect students’ actual knowledge. Items must therefore minimize ambiguity,
be at a suitable language level, and be comprehensible to all participants (Harlow &
Jones, 2004). Furthermore, students may not understand that certain questions are
scientific questions when they are placed in an everyday context (Schoultz, 2000).
Studying students’ group discussions when solving PISA items, Serder and Jakobsson
(2014/2015) found that students distanced themselves from scientific language use in
everyday situations, often expressed as fictitious students in the test.
The language of science and readability
3

Regarding the performance of students in Sweden on the international tests, a
decline in the past 10�15 years has been identified in most areas tested. Moreover,
except for 4th grade reading, the results in science and reading for Swedish students
have declined more for low performers than for high performers, but in recent years,
the number of students performing at higher levels in reading has also decreased. In
science, however, such decreases do not reach significant levels (Skolverket, 2012a,
2012b, 2012c, 2013). An analysis of TIMSS 2007 chemistry item responses showed
that, compared with low/average performers, high performers wrote longer answers
with a more frequent use of passives, technical terms, and colloquial words with
specific scientific meanings (Kokkinakis & Frandberg, 2013). Comparing changes in
attitudes towards science between 1995 and 2007, it was found that in 2007, high
performers in Sweden*especially boys*were more negative, with both high- and
low-performing boys finding science more boring (Adolfsson, 2011). Adolfsson
also found that Swedish boys are more positive towards physics and chemistry,
and girls are more positive towards biology. Furthermore, high performers have
positive attitudes towards studies and their own abilities, and devote more time to
reading and less to TV, Internet, and computer games (Skolverket, 2012b, 2012c).
On the contrary, in 2007 low performers thought they performed better in
all subjects compared with how low performers thought they did in 1995 (Adolfsson,
2011).
The international studies, PISA and Progress in International Reading
Literacy Study (PIRLS), show that girls are better readers than boys in almost
all participating countries (Skolverket, 2012a, 2013). In Sweden, there were
also large differences between boys and girls regarding science results in TIMSS
1995 and 2003, but not in 2007. The only detectable difference in 2011 was in
biology, in favour of girls (Skolverket, 2012b). In PISA 2012, Swedish girls
outperformed boys in science for the first time since the start of PISA in 2000
(Skolverket, 2013).
The text format looks different in different contexts, which may also impact
performance. In TIMSS and many other tests, the main item formats are multiple
choice (select correct answer) and constructed response (write own answer), which can
(or does) measure different skills or processes (Hogan & Murphy, 2007). Using the
TIMSS 1995 items, Olsen, Turmo, and Lie (2001) showed that even minor changes
to wording and/or changing an item’s format can have a large impact on student
response patterns. Sweden was among the top three countries regarding strong
connections between gender and item format in the TIMSS 1995 science items
(Hastedt & Sibberns, 2005). Analysing TIMSS 2003, Eriksson (2005) found that
boys performed as well as girls in multiple choice items in biology, and girls performed
as well as boys in constructed response items in physics, with Sweden again among the
top three countries when ranking the importance of item format and gender. Several
surveys show that boys seem to benefit from multiple choice items and girls from
constructed response items, but other aspects may also contribute to these results
(e.g. Eriksson, 2005; Hastedt & Sibberns, 2005).
Tomas Persson
4
3.2. The text, readability and meaning dimensions
Different ways of capturing the complexity of a text have been developed, and starting
in the 1920s, text complexity began to be calculated using formulas, resulting in over
200 formulas by the 1980s (DuBay, 2007). Most readability formulas use at least two
quantitatively measured qualities of language: vocabulary and syntax. Vocabulary is
often measured by counting syllables/letters or using word frequencies; syntax is
often determined by sentence length (Oakland & Lane, 2004). Most formulas are
regression formulas, where parameters are given different weights (Heimann
Muhlenbock, 2013). The Flesch Reading Ease and Flesch-Kincaid Grade Level formulas
(Kincaid, Fishburne, Rogers, & Chissom, 1975) exemplify weighting, as both use the
number of words per sentence and syllables per word, but they are multiplied by different
weights. The formula’s resulting number corresponds with either a grade in school
(e.g. Flesch-Kincaid Grade Level) or has to be interpreted with a table (e.g. Flesch
Reading Ease) (DuBay, 2007). The Swedish language has long been limited to
the table-interpreted formula LIX, LasbarhetsIndeX [readability index] (Heimann
Muhlenbock, 2013), using the percentage of long words (�6 characters) per word
added to the average number of words per sentence (Bjornsson, 1968). The three
readability formulas above are all included as an optional choice when conducting
grammar and spelling checks in Microsoft Word 2010.
Computer-based text analysis can be considered more objective and reliable than
manual analysis (Graesser, McNamara, & Kulikowich, 2011), but traditional
readability formulas have disadvantages whether they are calculated by computers
or not, as they measure features on a general surface level (e.g. word and sentence
length) and not on a language-specific structural level (Graesser et al., 2011;
Oakland & Lane, 2004). More sophisticated computer linguistic analysis tools are
available, but they still have problems with texts for which the programme has not
been developed, allowing for systematic errors. Another problem is that computer-
based analysis cannot measure coherence: if the sentences of a coherent text are
shuffled to become incoherent, the two texts still earn the same score (Torvatn,
2004). Therefore, manual checking cannot be discarded as obsolete yet. Other
problems occur when text samples are too short, causing values to fluctuate in
unpredictable ways. Many readability formulas use sentence length, since it is one of
the best predictors of a text’s readability (Dubay, 2007), but sentence length alone
might not be enough to measure a text’s readability (Bailin & Grafstein, 2001).
Authors and publishers became aware of readability issues in the late 1970s, when
the majority of school textbooks analysed with readability formulas were found to be
at reading levels that were too high (Wellington & Osborne, 2001). However, writing
for easy-to-read formulas instead of readers has its drawbacks: omitting logical
connectives and reducing sentence length can produce staccato sentences with
stilted, non-fluent, or incoherent prose (Wellington & Osborne, 2001). Laursen
(2006) shows that the use of short sentences and passages in a Danish school science
textbook makes the text look easy, but making connections between passages
and sentences is very hard. There is a trade-off to consider here: text difficulty may
The language of science and readability
5
rise in shorter texts, as background information becomes limited and idea density
increases.
Another type of language measure concerning density is Lexical Density, calculated
as the number of content words: nouns, verbs, adjectives, some adverbs, either per
non-embedded clause (Halliday & Matthiessen, 2004) or per total words (Eggins,
1994). Two well-established Swedish measures are Nominal Ratio, the number of
nouns, prepositions, and participles divided by the number of verbs, pronouns, and
adverbs, and Simple Nominal Ratio, nouns divided by verbs (Einarsson, 1978). These
two measures are based on the fact that a dense language has many nouns, while a
less dense language (e.g. spoken language) has many verbs (Graesser et al., 2011).
Nouns and verbs can be considered complementary in this regard: high proportions
of verbs in texts indicate a low proportion of nouns and vice versa (Heimann
Muhlenbock, 2013). Another measure indicating text complexity is the Nouns per
Pronouns ratio (Heimann Muhlenbock, 2013).
Many of these measures are thus developed empirically, rather than firmly placed
within a theoretical framework. Within the context of this study, typical features of
language used in written science texts have instead been investigated from a social
semiotic perspective, as developed in systemic functional linguistics (SFL) (e.g.
Halliday & Matthiessen, 2004). From this perspective, linguistic features are
perceived as serving to create three main types of meaning: ideational meaning,
through which the content of a text is expressed, interpersonal meaning, which
expresses personal relationships in the text and with the reader/listener, and textual
meaning, in order to express how the text is structured in terms of how information
is organised and presented. Linguistic features that are characteristic of a scientific
language are therefore thought to fulfil these functions to create meaning. Linguistic
features found in earlier research (see e.g. Graesser et al., 2011; Halliday & Martin,
1993; Lemke, 1990; Schleppegrell, 2004; Veel, 1997) to be characteristic of language
use in written science texts will therefore be regarded from an SFL perspective. From
this perspective, it could be concluded that linguistic features typical of written
science texts serve to pack the information and make it more precise (i.e. dimensions
of ideational meaning), to downgrade personal relationships (i.e. dimensions of
interpersonal meaning), and to present the information in more complex ways
(i.e. dimensions of textual meaning). The Packing, Precision, Personification, and
Presentation of information are thus considered central meaning dimensions of
scientific language. In accordance with earlier research, different linguistic features
are used in the analysis to indicate these dimensions (see Table 1).
Packing is expressed through long words and nouns (including nominalizations)
indicating the information density. Linguistic features that operate as different types
of modifiers express the level of Precision in the language. Personification reflects
personal relationships within the text and between the text and the reader.
Presentation reflects the complexity of how the information is presented to the reader.
To demonstrate how meaning dimensions are calculated, the calculation of
Packing in chemistry item S032679 from TIMSS 2011 is shown below. The original
English phrasing is: Write down one thing you might observe that shows that energy has
Tomas Persson
6

been released during a chemical reaction (Foy, Arora, & Stanco, 2013). The Swedish
version is: Beskriv en sak som du kan observera som visar att energi har frigjorts vid
en kemisk reaktion (Skolverket, 2014). This can be directly translated to: Describe
one thing that you can observe that shows that energy has [been] released by a
chemical reaction. With 17 words in the Swedish version, Packing is given by the
normalized value (i.e. z-scores) of 3/17 nouns (sak, energi, reaktion) added to the
normalized value of 4/17 long words (beskriv, observera, frigjorts, reaktion) divided
by two (as there are two linguistic features added together). Normalizations are
needed, for example, because there are always nouns present in an item, but
usually*although not in this example*not as many long words, and without
normalization, the sheer number of nouns could drown any contribution of long
words. Normalization thus allows linguistic features of different ‘concentrations’ to
be added together.
In accordance with earlier research, with higher degrees of Packing, Precision,
Personification, and Presentation, it is expected to be harder for students to solve items.
Using meaning dimensions to analyse TIMSS 2011 science items, Persson et al.
(in press) found that physics items often have low levels of Packing and high levels of
Precision, while the reverse is the case with biology items. Earth science items were
shown to have very low levels of Personification, especially compared with physics
items. Higher levels of Presentation were often found in chemistry items. These
findings are summarized in Table 2, which shows how language use in each subject
differs from the average language use in all TIMSS science items together
(deviation). Table 2 also shows how widespread language use is for each meaning
dimension between the items within each subject (dispersion).
This study thus aims to fill a gap in earlier research by placing a method for
automated quantitative analysis of scientific texts within a theoretical framework,
while also making use of a large amount of empirical material to investigate possible
correlations between linguistic features and the results of different groups of
students.
4. Theoretical framework
Students’ encounters with the text, their reading and solving of tasks, are
viewed through the lens of the didactically based reception-theoretical perspective
Table 1. Linguistic features building up meaning dimensions
Meaning dimension Linguistic feature (per words in the item)
Packing Nouns� long words
Precision Adjectives�adverbs�counting words�descriptive namesa�participles
Personification (1st, 2nd, 3rd person) pronouns�proper names
Presentation Passives� subordinate clauses
aSingle letters or numbers denoting entities: [solution] B, [image] 1.
The language of science and readability
7

(N.B. ‘didactic’ in the continental European ‘educational’ sense, not in the
Anglo-American ‘sententious’ way, cf. Hopmann, 2007). The didactically based
reception-theoretical perspective is founded on the didactical triangle’s cornerstones:
who (student), what (intended content), and how (practices in the teaching
situation) creates a didactical platform for the use of reception theory, where the
encounter between the reader (who) and the text (what) in a specific reading
situation (how) is in focus (Liberg, Folkeryd, af Geijerstam, & Edling, 2002). In
reception theory (e.g. McCormick, 1994), readers are not considered passive
receivers of content; they are seen as actively creating meaning by using their
experiences and prior knowledge. From this perspective, a text is not cognitively
demanding in itself (Schleppegrell, 2004); it depends on the relationship between the
reader and the text in the situation where the encounter is taking place (e.g. Liberg
et al., 2002; Sweet & Snow, 2003). As shown in the earlier research above, important
characteristics of the reader in this relationship concern his/her socio-cultural
background, reading experience, knowledge and interest in the subject area, and
experience with participation in contexts in which the subject is taught. Aspects of
interest regarding the text include the cognitive domains of the content, vocabulary
(e.g. everyday versus subject-specific), how dense or packed and precise the
information is, how personal relationships are expressed, and how the information
is presented or organised on both micro level (clause level) and macro level (genre).
Based on the didactical platform, reception theory makes it possible to interpret
the meaning-making and the result of the meaning-making that occurs in a
student’s encounter with the meaning that is offered through the text (cf. Langer,
2011; Liberg, Geijerstam, & Folkeryd, 2011). The present study is particularly
focused on achievement level as a characteristic of students combined with the four
meaning dimensions as expressed in the language used in the TIMSS 2011 science
items.
Table 2. Overview of subjects’ deviations from TIMSS 2011 average language use regarding
meaning dimensions in all Swedish science items and the measurements dispersions
Meaning dimensions
Language usePacking Precision Personification Presentation
in subject Deviation Dispersion Deviation Dispersion Deviation Dispersion Deviation Dispersion
Biology � H, (S) � L, (S) � A, S 0 A, S
Chemistry 0 H 0 H � H, S � H, S
Earth science 0 A 0 H � (NA), S 0 A, S
Physics � L, (S) � H � H, S 0 A, S
Deviations from average language use in TIMSS: �: above; �: below; 0: close to average.
Dispersions of measurements: H: high; L: low; A: average; (NA): too few valid measurements.
S: skewed distribution (i.e. many low scores); (S): slightly skewed distribution.
Tomas Persson
8

5. Data
The empirical data comprises the Swedish TIMSS 2011 8th grade science items, test
scores, and students’ background data. TIMSS is considered to cover 96% of the
components of Swedish science curricula in use at the time of the test (Skolverket,
2006).
The analysis excludes students who did not answer any science items (i.e. who
only responded to mathematical items). Items consisting of several parts using the
same leading text were merged to make sure the linguistic features were only counted
once. The resulting 197 items were separated into subjects (Table 3) and item types
(Table 4).
In this study, student responses coded by the IEA as ‘not reached’ are not
considered existing answers. Responses coded as ‘omitted’ are considered faulty
responses. The use of actual student responses (i.e. not imputing statistically
estimated responses calculated from students’ actual responses), results in the
number of responses to items, ranging from 624 to 803 (Table 5) Students were
separated into girls and boys, and their overall performance in science was separated
into 1st and 4th quartiles (low/high-performing 25%).
6. Method
Responses belonging to different student groups All students, Boys, Girls, First quartile
(B36% correct responses) and Fourth quartile (�62.96% correct responses) were
identified (Table 5). Per cent right scores were calculated by dividing each group’s
Table 3. Item separation into subjects
Subjects Number of items
Biology 69
Chemistry 44
Earth science 35
Physics 49
Total 197
Table 4. Item separation into item types
Item typea Number of items
Constructed response, CR 86
Multiple choice, MC 108
Total 194
aThree merged items with both MC and CR parts are
excluded from the analysis.
The language of science and readability
9

average score on a given item by the item’s maximum score, thus enabling
comparisons of items with different maximum points.
Values for the four meaning dimensions Packing, Precision, Personification and
Presentation were calculated for each item by dividing linguistic features (Table 1) by
the number of words in the item (compensating for differences in text length); they
were then standardized (enabling the addition of features with different concentra-
tions), added together, and finally divided by the number of features added.
As Shapiro�Wilk tests indicated that the linguistic features used were unlikely to
be normally distributed, use of multiple regression analysis or Pearson correlation
was not suitable for this kind of data. Instead, the meaning dimensions were
individually tested for bivariate correlations with each student group’s per cent of
correct scores using a two-tailed Spearman’s rank correlation test. The data were
split into subjects and item formats and analysed again for correlations. The number
of items was not large enough to allow for splitting into subjects and item formats at
the same time.
Using the original (i.e. non-standardized) values for linguistic features, one
linguistic surface feature (number of words), one readability formula (LIX), and
four measures of information load that are compatible with Swedish (Nominal Ratio,
Simple Nominal Ratio, Nouns per Pronouns, Lexical Density) were also tested for
correlations with the same method used for meaning dimensions. The Nouns per
Pronouns ratio was calculated using all pronouns, and Lexical Density was calculated
as content words (nouns, proper and descriptive names, adjectives, adverbs,
participles, non-auxiliary verbs) per word.
7. Results in light of the theoretical framework
This section presents and interprets the results from the didactically based reception-
theoretical perspective (Liberg et al., 2002). The results from the correlation analysis
are shown in six tables: all subject areas combined, each of the four subjects, and also
for constructed response items. A table for multiple choice items is not presented
here, as no significant correlations were found. Each table shows the five student
Table 5. Number of students responding
Number of responses per item
Student group Number of students Proportion of girls (%) Min. Max. Average
All 5,516 48.1 624 803 783
Boys 2,857a � 301 426 406
Girls 2,654a � 316 401 376
1st quartile 1,378 47.0 97 298 194
4th quartile 1,384 45.9 117 290 197
aSmaller than the total number of students when added together, due to missing data.
Tomas Persson
10

groups and the four meaning dimensions; other measures are included only if
statistically significant correlations are found (full versions of all tables without the
excluded results can be found at the end of the article). When interpreting the
strength of the relationships between the variables, a correlation coefficient size of
0.1 can generally be regarded as a small effect accounting for 1% of the variance, 0.3
as a medium effect accounting for 9% of the variance, and 0.5 as a large effect
accounting for 25% of the variance (Field, 2013). When conducting tests, there is a
risk of falsely indicating results as significant. With a level of significance set at 0.05,
1 result out of 20 can be expected to be significant purely by chance, even with
random data. Although some results in this study are also significant at higher levels
(pB0.01 and pB0.005) and therefore less likely to be caused by such errors, this is a
limitation that must be considered when interpreting the results presented in the
tables. The number of items decreases when separated into subjects and types, and
responses decrease due to the use of actual student responses and the separation of
students into groups, thus making it harder to have enough data to reach significant
levels. Still, there are almost 100�300 responses for each item, even for the smallest
partitions (Table 5).
The didactically based reception-theoretical perspective (Liberg et al., 2002)
makes it possible to interpret results for the complex issue of encounters between
students with certain prerequisites and the TIMSS items. Important prerequisites for
students include experience with reading, which is closely linked to performance in
science (cf. Cromley, 2009), interest in the subject (cf. Adolfsson, 2011), knowledge
of the subject, and the ability to read and use characteristic linguistic features of the
subject (cf. Kokkinakis & Frandberg, 2013). Important features of the TIMSS items
include how dense or packed the information is, how precise it is, how it is presented,
and how it connects with a reader on a personal level.
7.1. All subject areas in science
Packing, measured in this study by the use of nouns and long words, does not show
any significant correlations for all subject areas combined (Table 6). On the contrary,
increased levels of Precision, that is, the use of different types of modifiers, have
significant positive correlations with results for both girls and high performers. As
both groups are likely to be better readers (Skolverket, 2012a, 2012b, 2012c, 2013),
increased Precision is interpreted as beneficial to skilled readers. Less skilled readers
are likely to be found among low performers, who are interpreted as being impeded
by texts with an increased number of words, as shown in Table 6.
Higher levels of both Personification and Presentation are interpreted (in accordance
with earlier research) as negatively influencing performance for many of the groups.
Girls are an exception to this when it comes to Presentation, which is interpreted to be
the result of the fact that girls are generally better readers and thus better able to
handle more complex text structures. Furthermore, increased levels of Personification
have a negative correlation for all groups except high performers. In this study,
Personification is measured by the use of proper names and personal pronouns, which
provide items with an everyday context and/or establish personal relationships with
The language of science and readability
11

readers. Placing scientific tasks in everyday contexts, as indicated by the use of
proper names and pronouns denoting fictitious students, is therefore interpreted as
annoying for many students, or as obscuring the scientific problem (cf. Schoultz,
2000; Serder & Jakobsson, 2014/2015). To a minor extent, this might be influenced
by pronouns in phrases such as ‘Explain your answer’ in constructed response items.
However, the only significant correlation found regarding Personification in con-
structed response items is for low performers (Table 7). A possible interpretation of
this is that low performers are more negatively influenced by the request to explain
and justify their chosen answer than other groups. As significant correlations are not
shown by Nouns per Pronouns, this indicates that, rather than linking all kinds of
pronouns to who/what is being referenced (cf. Graesser et al., 2011), linking personal
pronouns is what students find especially difficult.
Table 6. All subject areas combined
Spearman’s rank
correlation Correlation coefficient (significance level)
All items, N�197 Packing Precision Personification Presentation Number of words
All students,
N�5,516
0.041 (0.564) 0.135 (0.059) �0.188** (0.008) �0.162* (0.023) �0.081 (0.257)
Girls, N�2,654 0.027 (0.707) 0.146* (0.041) �0.157* (0.027) �0.137 (0.054) �0.061 (0.397)
Boys, N�2,857 0.055 (0.442) 0.127 (0.076) �0.201*** (0.005) �0.180* (0.011) �0.091 (0.204)
1st quartile,
N�1,378
0.119 (0.096) 0.068 (0.345) �0.287*** (0.000) �0.144* (0.043) �0.165* (0.021)
4th quartile,
N�1,384
0.036 (0.611) 0.153* (0.031) �0.108 (0.130) �0.171* (0.016) �0.066 (0.357)
Bivariate correlations between students’ per cent right and meaning dimensions and number of words.
*Correlation is significant at the 0.05 level (2-tailed), **at the 0.01 level (2-tailed), ***at the 0.005 level
(2-tailed), all boldface.
Table 7. Constructed response items
Spearman’s rank correlation Correlation coefficient (significance level)
Constructed response items, N�86 Packing Precision Personification Presentation
All students, N�5,516 �0.003 (0.977) 0.185 (0.089) �0.137 (0.209) �0.171 (0.116)
Girls, N�2,654 0.001 (0.991) 0.223* (0.039) �0.139 (0.202) �0.151 (0.164)
Boys, N�2,857 0.005 (0.965) 0.168 (0.123) �0.126 (0.247) �0.198 (0.068)
1st quartile, N�1,378 �0.029 (0.789) 0.246* (0.022) �0.216* (0.046) �0.089 (0.418)
4th quartile, N�1,384 0.052 (0.635) 0.101 (0.352) �0.051 (0.642) �0.237* (0.028)
Bivariate correlations between students’ per cent right and meaning dimensions.
*Correlation is significant at the 0.05 level (2-tailed), all boldface.
Tomas Persson
12

7.2. Biology and chemistry
There are some similarities between the overall results for all subject areas and the
results in biology (Table 8) and chemistry (Table 9). In both subject areas, and in the
overall results, there are no significant correlations for Packing, even though, on
average, there are high levels of Packing in biology items and average levels in
chemistry items (see Table 2). The nouns and long words used in these subject areas
are thus interpreted as having neither a negative nor a positive influence on the
studied students’ scores.
In biology (Table 8), Precision again shows no significant correlation for many of
the groups. Girls are the only group in biology with significant correlations in
Precision. As with all subject areas combined, Presentation shows significant negative
correlations for all groups except girls. One interpretation of these results is that girls
are better readers. Girls also favour biology (Adolfsson, 2011) with slightly better
Table 8. Biology items
Spearman’s rank correlation Correlation coefficient (significance level)
Biology items, N�69 Packing Precision Personification Presentation
All students, N�5,516 �0.127 (0.299) 0.199 (0.101) �0.077 (0.532) �0.249* (0.039)
Girls, N�2,654 �0.161 (0.187) 0.269* (0.025) �0.029 (0.812) �0.180 (0.139)
Boys, N�2,857 �0.079 (0.518) 0.150 (0.220) �0.109 (0.373) �0.288* (0.016)
1st quartile, N�1,378 0.009 (0.939) 0.149 (0.221) �0.202 (0.097) �0.270* (0.025)
4th quartile, N�1,384 �0.059 (0.628) 0.154 (0.205) �0.065 (0.596) �0.281* (0.019)
Bivariate correlations between students’ per cent right and meaning dimensions.
*Correlation is significant at the 0.05 level (2-tailed), all boldface.
Table 9. Chemistry items
Spearman’s rank
correlation Correlation coefficient (significance level)
Chemistry items,
N�44 Packing Precision Personification Presentation Number of words
All students,
N�5,516
0.156 (0.313) 0.353* (0.019) �0.264 (0.083) �0.157 (0.307) �0.088 (0.569)
Girls, N�2,654 0.117 (0.448) 0.322* (0.033) �0.222 (0.148) �0.158 (0.307) �0.075 (0.628)
Boys, N�2,857 0.163 (0.291) 0.336* (0.026) �0.269 (0.078) �0.144 (0.350) �0.112 (0.471)
1st quartile,
N�1,378
0.099 (0.521) 0.171 (0.267) �0.391** (0.009) �0.085 (0.584) �0.301* (0.047)
4th quartile,
N�1,384
0.132 (0.394) 0.409** (0.006) �0.112 (0.470) �0.209 (0.174) 0.043 (0.782)
Bivariate correlations between students’ per cent right and meaning dimensions and number of words.
*Correlation is significant at the 0.05 level (2-tailed), **at the 0.01 level (2-tailed), all boldface.
The language of science and readability
13

performances in that subject (Skolverket, 2012b), which could also help explain
these correlations. Furthermore, on average, there are low levels of Personification in
biology (see Table 2), which may contribute to the absence of a significant
correlation with students’ scores.
Regarding chemistry (Table 9), the effect sizes reach medium levels for all
significant correlations. Increased levels of Precision show a positive correlation for
all groups except low performers. On the contrary, in accordance with results for all
subject areas combined, low performers’ results show a negative influence with
increased levels of Personification and increased text length. One possible explanation
for low performers not being able to benefit from increased Precision and the negative
influence from increased Personification and text length, could be that low performers
are likely to be less skilled readers. Although chemistry items generally have higher
levels of both Personification and Presentation (see Table 2), only one significant
(negative) correlation is shown, and it is for low performers regarding Personification.
7.3. Earth science and physics
The results for earth science (Table 10) and physics (Table 11) stand in contrast to
the overall results for all subject areas, as well as for the results for biology and
chemistry. The only meaning dimension that shows a significant correlation in earth
science and physics is Packing. In earth science, this correlation is positive, while in
physics it is negative.
The positive correlation in earth science is identified for both Packing and LIX for
most groups of students. This is probably due to both measures using the variable
long words per words. Such significant positive correlation, with medium effect sizes
for all student groups in focus in this study were unexpected, since longer words are
Table 10. Earth science items
Spearman’s rank
correlation Correlation coefficient (significance level)
Earth science items,
N�35 Packing Precision Personification Presentation
LIX
(readability index)
All students,
N�5,516
0.380* (0.024) 0.238 (0.168) �0.214 (0.217) �0.140 (0.422) 0.381* (0.024)
Girls, N�2,654 0.365* (0.031) 0.258 (0.135) �0.235 (0.174) �0.102 (0.559) 0.384* (0.023)
Boys, N�2,857 0.406* (0.016) 0.242 (0.161) �0.199 (0.251) �0.170 (0.329) 0.387* (0.022)
1st quartile,
N�1,378
0.419* (0.012) 0.124 (0.477) �0.226 (0.192) �0.210 (0.226) 0.313 (0.067)
4th quartile,
N�1,384
0.386* (0.022) 0.333 (0.050) �0.188 (0.280) �0.023 (0.894) 0.431** (0.010)
Bivariate correlations between students’ per cent right and meaning dimensions and a readability measure.
*Correlation is significant at the 0.05 level (2-tailed), ** at the 0.01 level (2-tailed), all boldface.
Tomas Persson
14

Table 11. Physics items
Spearman’s rank correlation Correlation coefficient (significance level)
Physics items, N�49 Packing Precision Personification Presentation Lexical density Nouns per pronouns
All students, N�5,516 �0.288* (0.045) �0.179 (0.218) �0.073 (0.620) �0.072 (0.623) �0.366** (0.010) �0.247 (0.088)
Girls, N�2,654 �0.291* (0.043) �0.178 (0.221) �0.020 (0.893) �0.081 (0.581) �0.350* (0.014) �0.284* (0.048)
Boys, N�2,857 �0.282* (0.049) �0.175 (0.228) �0.102 (0.487) �0.071 (0.627) �0.371** (0.009) �0.222 (0.126)
1st quartile, N�1,378 �0.070 (0.631) �0.052 (0.722) �0.246 (0.089) �0.014 (0.925) �0.183 (0.207) �0.160 (0.273)
4th quartile, N�1,384 �0.311* (0.030) �0.161 (0.269) 0.005 (0.972) �0.088 (0.548) �0.386** (0.006) �0.248 (0.086)
Bivariate correlations between students’ per cent right and meaning dimensions and measures of information load and text complexity.
*Correlation is significant at the 0.05 level (2-tailed), **at the 0.01 level (2-tailed), all boldface.
The
langu
age
ofscien
ceand
readability
15

expected to make items harder to solve. Explaining this further requires identifica-
tion and further analysis of the characteristics of the long words.
On the contrary, in physics, both Packing and Lexical Density show significant
negative correlations for all groups except low performers. Why low performers do
not show such correlations must be investigated further. The Nouns per Pronouns
ratio shows its only significant correlation here, indicating that nouns*the linguistic
feature shared with Packing*are of special importance here. As Precision and
Personification do not show significant correlations, any linguistic features shared with
Lexical Density are unlikely to cause high levels of significance for Lexical Density, that
is, adjectives, adverbs, participles, and descriptive and proper names. If this is not
caused by small contributions from different parts of speech that, in combination,
reach significant levels, this implicates nouns and/or non-auxiliary verbs as negatively
influencing student performances. This may indicate that verbs in physics function in
a way that is not captured by the meaning dimensions, as meaning dimensions
consider of nouns and verbs as complementary and therefore only measure nouns.
8. Discussion
A previous study (Persson et al., in press) showed that the use of linguistic features
expressing the four meaning dimensions varies among the different scientific subjects
(biology, chemistry, earth science, and physics) in TIMSS 2011. The present study
problematizes whether or not these differences are significant for different groups of
students in their encounters with the TIMSS items, by interpreting correlations
between meaning dimensions and students’ test results using the didactically based
reception theory (Liberg et al., 2002). To conclude, the results of the present study
generally indicate that each subject area has one prominent meaning dimension
demonstrating significant correlations for several of the studied student groups. In
this respect, biology is characterized by the Presentation of information, where the
significant negative correlations found are interpreted as indicating an obstacle to all
groups studied except girls. In chemistry items, the Precision of information shows
significant positive correlations of medium effect size, which is interpreted as
supporting all groups studied except low performers. Earth science shows significant
positive correlations of medium effect size regarding the Packing of information,
which is interpreted as supporting all groups studied. Finally, physics is characterized
by significant positive correlations of small to medium effect sizes, where a low level
of Packing of information is interpreted as an obstacle for all groups studied except
low performers.
Regarding the different groups of students, differences are found between boys
and girls (cf. Skolverket, 2012b) in all subject areas combined, and in biology, where
girls are interpreted as being aided by Precision and unaffected by negative influences
from Presentation. Increased levels of Precision in constructed response items are also
interpreted as an aid for girls (Table 7). Although Swedish students have historically
shown large correlations between results, gender, and item type (cf. Eriksson, 2005;
Hastedt & Sibberns, 2005), this is the only significant correlation found in this study
Tomas Persson
16

regarding gender and item type. As previously stated, these differences might be
explained by the fact that girls are better readers and have a more positive attitude
towards biology.
It is noteworthy that the meaning dimensions with a significant influence on the
results of low performers often have no influence on high performers, while other
meaning dimensions influencing the results of high performers do not influence low
performers. The only exceptions are Presentation in all subject areas combined and in
biology, and Packing in earth science. This indicates that the two groups behave
differently and therefore might benefit from differentiated teaching focusing on
different characteristics of the scientific language.
Packing and Precision are both part of ideational meaning, but their differences in the
results of this study indicate that they are truly different dimensions of ideational
meaning. This demonstrates the complexity of language use and the need to separate
linguistic features with different functions in the text from each other. Packing also
shows contradictory results, with medium-sized effects for both physics and earth
science, but negative correlations with students’ results in physics and positive
correlations in earth science, the latter of which is probably influenced by the use of
some fairly long words. The interpretation of the results also shows that high levels of
Precision aid skilled readers rather than being an obstacle to less skilled readers. This
indicates a specific need for less skilled readers that teachers must address. Higher
levels of Personification reduce the likelihood of items being answered correctly
(Table 6) for all groups except high performers. This might be interpreted as high
performers being able to ‘accept’ the placement of scientific problems in an everyday
context, without being distracted or annoyed by the use of personal pronouns or
names of fictitious places or students, as indicated by previous research (cf. Serder &
Jakobsson, 2014/2015). However, the use of names and personal pronouns is
uncommon in TIMSS items, which might explain the lack of significant results
when separating items into subjects; there are simply too few items containing such
features. Why proper names and personal pronouns have these negative consequences
and whether they also have them in other reading situations in school science is an area
for further investigation, as this has serious implications for the formulation of science
texts. Presentation, the use of subordinated clauses and passives, negatively influences
student performances in all subject areas combined and in biology. As discussed
above, girls’ positive attitudes towards biology and higher reading proficiency can
explain why girls do not show the same negative correlations as other groups.
The established measures showed surprisingly few statistically significant correla-
tions. The two Nominal Ratios did not show any significant correlations; Nouns per
Pronouns only showed one. Lexical Density showed correlations in physics, with larger
effect sizes and higher levels of significance than Packing, thus apparently capturing
the information load in physics items as well. Increased item length was not expected
to only cause difficulties for low performers, and furthermore, when broken down
into subject, only in chemistry. Perhaps most TIMSS items are too short for text-
length-related difficulties to be manifested for the other groups and in the other
subjects. This method comparison shows that the use of meaning dimensions can be
The language of science and readability
17

regarded as an enriching and complementary method to traditional automated text
analysis methods, at least for the analysis of shorter science items similar to those
used in TIMSS.
When looking at correlation coefficients, it is possible to jump to conclusions; for
example, Table 8 shows that high performers are more negatively influenced by
Presentation in biology than low performers. Reception theory is helpful here,
pointing to other aspects that might be important, as in the case of low performers.
They may be more influenced by other aspects, such as a lack of prior knowledge in
the subject area or lack of interest in biology, which takes precedence over any
presence of passives and subordinations in items. In the same way, the lack of
significant results for Presentation in chemistry (Table 9) does not imply that it is
irrelevant for students. Rather, one interpretation could be that chemistry has other
issues that overshadow additional complications caused by complex presentations of
content. As the statistical saying goes: absence of proof is not proof of absence.
Therefore, significant results should be interpreted as indications of language-
related aspects influencing students’ results, which teachers should be aware of in
order to be able to take appropriate actions. A lack of significant results, or
significant results with small effect sizes, does not mean that a specific linguistic
feature is not an issue for students taking a test or reading a text. It just means that
there are other, more significant pitfalls for students.
9. Conclusion
This study thus begins to fill a gap found in previous research, while also contributing
to the concept of disciplinary literacy in science (cf. Shanahan & Shanahan, 2008,
2012). Many aspects influence student test scores. A linguistic analysis cannot
provide explanations as to why students answer questions the way they do, but it can
contribute to the discussion of students’ abilities to solve items, such as the ones found
on TIMSS featured in this study. Focusing on only one of many other reading
situations in school, this study shows the possibility of using meaning dimensions to
capture some of the linguistic difficulties students experience when answering science
questions.
The diversity of the results for the various subjects indicates not only differences in
language use among the scientific subjects but also the influence of language use on
different groups of students. By acknowledging the importance of the linguistic
features of different types of texts, teachers can take appropriate actions to facilitate
students’ understanding of how scientific texts are written, both in general and in
specific subjects, and thereby presumably also improve student performances. The
people responsible for choosing and creating texts intended for use in schools can also
be helped by an increased understanding of the possibilities and limitations of using
different kinds of readability measures. However, further investigations must be
carried out not only on similar tests but also in other reading situations (e.g. textbooks,
instructions, teachers’ notes) to deepen the understanding of this study’s findings.
Tomas Persson
18

This study has shown the strength of using a sociosemiotic perspective to design
readability formulas, as the meaning dimensions manage to identify significant
correlations between the differences in language use in various subjects and results
for different student groups, while many established measures were unable to do so.
References
Adolfsson, L. (2011). Attityder till naturvetenskap: Forandringar av flickors och pojkars attityder till biologi, fysik och
kemi 1995 till 2007 [Attitudes towards science: changes of girls’ and boys’ attitudes towards biology,
physics and chemistry 1995 to 2007]. Studies in science and technology education, 43. Umea:
Institutionen for naturvetenskapens och matematikens didaktik, Umea universitet.
Bailin, A., & Grafstein, A. (2001). The linguistic assumptions underlying readability formulae: A critique.
Language & Communication, 21(3), 285�301. doi: http://dx.doi.org/10.1016/S0271-5309(01)00005-2
Bjornsson, C. H. (1968). Lasbarhet. Solna: Liber.
Cromley, J. G. (2009). Reading achievement and science proficiency: International comparisons from the
programme on international student assessment. Reading Psychology, 30(2), 89�118. doi: http://dx.doi.org/
10.1080/02702710802274903
DuBay, W. H. (2007). Smart language: Readers, readability, and the grading of text. BookSurge Publishing.
Eggins, S. (1994). An introduction to systemic functional linguistics. London: Continuum.
Einarsson, J. (1978). Talad och skriven svenska. Lund: Ekstrand Sociolingvistiska studier.
Eriksson, N. (2005). Prestationsskillnader mellan flickor och pojkar i NO: en studie av uppgiftsformatets
betydelse i TIMSS 2003. Umea: Institutionen for beteendevetenskapliga matningar, Umea universitet.
Field, A. (2013). Discovering statistics using IBM SPSS statistics: And sex and drugs and rock ‘n’ roll. London: Sage.
Foy, P., Arora, A., & Stanco, G. M. (Eds.). (2013). Timss 2011 user guide for the international database. Released items.
Science*eighth grade. TIMSS & PIRLS International Study Center, Lynch School of Education, Boston:
Boston College and International Association for the Evaluation of Educational Achievement (IEA).
Graesser, A. C., McNamara, D. S., & Kulikowich, J. M. (2011). Coh-metrix: Providing multilevel analyses
of text characteristics. Educational Researcher, 40(5), 223�234. doi: http://dx.doi.org/10.3102/
0013189X11413260
Halliday, M. A. K., & Martin, J. R. (1993). Writing science: Literacy and discursive power. Pittsburgh, NJ:
University of Pittsburgh Press.
Halliday, M. A. K., & Matthiessen, C. M. I. M. (2004). An introduction to functional grammar (3th ed.). London:
Arnold.
Harlow, A., & Jones, A. (2004). Why students answer TIMSS science test items the way they do. Research in
Science Education, 34, 221�238. doi: http://dx.doi.org/10.1023/B:RISE.0000033761.79449.56
Hastedt, D., & Sibberns, H. (2005). Differences between multiple choice items and constructed response items
in the IEA TIMSS surveys. Studies in Educational Evaluation, 31(2), 145�161. doi: http://dx.doi.org/10.
1016/j.stueduc.2005.05.007
Heimann Muhlenbock, K. (2013). I see what you mean: Assessing readability for specific target groups. Data
linguistica. No. 24, Institutionen for svenska spraket, Gothenburg: University of Gothenburg.
Hogan, T. P., & Murphy, G. (2007). Comparative review: Recommendations for preparing and scoring
constructed-response items: What the experts say. Applied Measurement in Education, 20(4), 427�441. doi:
http://dx.doi.org/10.1080/08957340701580736
Hopmann, S. (2007). Restrained teaching: The common core of didaktik. European Educational Research
Journal, 6(2), 109�124. doi: http://dx.doi.org/10.2304/eerj.2007.6.2.109
Hyland, K., & Tse, P. (2007). Is there an ‘‘academic vocabulary?’’ TESOL Quarterly, 41, 235.
Kincaid, J. P., Fishburne, R. P., Rogers, R. L., & Chissom, B. S. (1975). Derivation of new readability formulas
[Automated Readability Index, Fog Count, and Flesch Reading Ease formula] for Navy enlisted personnel
(No. RBR-8-75). Millington, TN: Naval Technical Training Command.
Kokkinakis, S. J., & Frandberg, B. (2013). Hogstadieelevers anvandning av naturvetenskapligt sprakbruk i
kemiamnet i TIMSS. Utbildning & Demokrati, 22(3), 53�68.
Langer, J. A. (2011). Envisioning knowledge: Building literacy in the academic disciplines. New York, NY: Teachers
College Press.
Laursen, H. P. (2006). Den sproglige dimension i naturfagsundervisningen*fokus pa tekstbogen (ogsa) i det
flersprogede klasserum. MONA, 2, 27�46. Institut for Naturfagenes Didaktik, Københavns Universitet.
The language of science and readability
19
Lemke, J. L. (1990). Talking science: Language, learning, and values. Norwood, NJ: Ablex.
Liberg, C., af Geijerstam, A., & Folkeryd, J. W. (2011). Scientific literacy and students’ movability in science
texts. In C. Linder, L. Ostman, D. A. Roberts, P. O. Wickman, G. Erickson, & A. MacKinnon (Eds.),
Exploring the landscape of scientific literacy (pp. 74�89). New York, NY: Routledge.
Liberg, C., Folkeryd, J. W., af Geijerstam, A., & Edling, A. (2002). Students’ encounter with different texts in
school. In K. Naucler (Ed.), Papers from the Third Conference on Reading and Writing (pp. 46�61). Working
Papers no 50, Lund: Lund University, Department of Linguistics.
McCormick, K. (1994). The culture of reading and the teaching of English. Manchester: Manchester University Press.
Mullis, I. V., Martin, M. O., Ruddock, G. J., O’Sullivan, C. Y., & Preuschoff, C. (2009). TIMSS 2011
assessment frameworks. Boston, MA: Boston College.
Oakland, T., & Lane, H. B. (2004). Language, reading, and readability formulas: Implications for developing
and adapting tests. International Journal of Testing, 4(3), 239�252. doi: http://dx.doi.org/10.1207/
s15327574ijt0403_3
OECD (n.d.). Retrieved from http://www.oecd.org/pisa/aboutpisa/
Olsen, R. V., Turmo, A., & Lie, S. (2001). Learning about students’ knowledge and thinking in science through
large-scale quantitative studies. European Journal of Psychology of Education, 16(3), 403�420.
Persson, T., af Geijerstam, A., & Liberg, C. (in press). Features and functions of scientific language(s)*The
example TIMSS 2011. Nordic Studies in Science Education.
Rodrigues, M. C., Haladyna, T. M., & Downing, S. M. (2002). A review of multiple-choice item-writing
guidelines for classroom assessment. Applied Measurement in Education, 15(3), 309�334. doi: http://dx.doi.
org/10.1207/S15324818AME1503_5
Schleppegrell, M. J. (2004). The language of schooling; a functional linguistics perspective. London: Lawrence
Erlbaum Associates.
Schoultz, J. (2000). Att samtala om/i naturvetenskap: Kommunikation, kontext och artefakt. Linkoping studies in
education and psychology. No 67. Linkoping: Linkopings Universitet.
Serder, M., & Jakobsson, A. (2014/2015). ‘‘Why bother so incredibly much?’’: Student perspectives on PISA
science assignments. Cultural Studies of Science Education, 10(3), 833�853. doi: http://dx.doi.org/10.1007/
s11422-013-9550-3
Shanahan, T., & Shanahan, C. (2008). Teaching disciplinary literacy to adolescents: Rethinking content-area
literacy. Harvard Educational Review, 78(1), 40�59, 279.
Shanahan, T., & Shanahan, C. (2012). What is disciplinary literacy and why does it matter? Topics in Language
Disorders, 32(1), 7�18. doi: http://dx.doi.org/10.1097/TLD.0b013e318244557a
Skolverket. (2006). Med fokus pa matematik och naturvetenskap: en analys av skillnader och likheter mellan
internationella jamforande studier och nationella kursplaner. Stockholm: Skolverket.
Skolverket. (2012a). PIRLS 2011 Lasformagan hos svenska elever i arskurs 4 i ett internationellt perspektiv. No. 381.
Stockholm: Skolverket.
Skolverket. (2012b). TIMSS 2011 Svenska grundskoleelevers kunskaper i matematik och naturvetenskap i ett
internationellt perspektiv. No. 380. Stockholm: Skolverket.
Skolverket. (2012c). Hogpresterande elever, hoga prestationer och undervisningen. No. 379. Stockholm: Skolverket.
Skolverket. (2013). PISA 2012 15-aringars kunskaper i matematik, lasforstaelse och naturvetenskap. No. 398.
Stockholm: Skolverket.
Skolverket. (2014). TIMSS 2011 Uppgifter i naturvetenskap, arskurs 8. No. 403. Stockholm: Fritzes.
Sweet, A. P., & Snow, C. E. (2003). Rethinking reading comprehension. New York: Guilford.
Torvatn, A. C. (2004). Tekststrukturens innvirkning pa leseforstaelsen. En studie av fire læreboktekster for
ungdomstrinnet og sju elevers lesing av dem. Høgskolen i Hedmark Rapport nr. 13 Trondheim: Norges
teknisk-naturvitenskaplige Universitet.
Veel, R. (1997). Learning how to mean-scientifically speaking: Apprenticeship into scientific discourse in the
secondary school. In F. Christie & J. R. Martin (Eds.), Genre and Institutions: Social processes in the
workplace and school (pp. 161�195). London: Cassell.
Wellington, J., & Osborne, J. (2001). Language and literacy in science education. Buckingham: Open University
Press.
Tomas Persson
20

Appendix
Table 6. (full version). All subject areas combined. Bivariate correlations between students’ percent right and meaning dimensions, number of
words, readability and information load measures. Significant values are boldface.
All items,
N�197
(N�194 for
Nouns per
Pronouns)
Spearman’s
rank
correlation Packing Precision Personification Presentation
Number of
words
LIX
(readability
Index)
Content
words per
words
Nominal
ratio
Simple
nominal
ratio
Nouns per
pronouns
All students,
N�5,516
Correlation
coefficient
0.041 0.135 �0.188** �0.162* �0.081 0.093 0.040 0.079 0.079 0.057
Sig. (2-tailed) 0.564 0.059 0.008 0.023 0.257 0.196 0.579 0.268 0.269 0.433
Girls,
N�2,654
Correlation
coefficient
0.027 0.146* �0.157* �0.137 �0.061 0.101 0.023 0.060 0.058 0.043
Sig. (2-tailed) 0.707 0.041 0.027 0.054 0.397 0.159 0.747 0.401 0.414 0.548
Boys,
N�2,857
Correlation
coefficient
0.055 0.127 �0.201*** �0.180* �0.091 0.085 0.057 0.094 0.091 0.072
Sig. (2-tailed) 0.442 0.076 0.005 0.011 0.204 0.233 0.427 0.189 0.203 0.317
1st quartile,
N�1,378
Correlation
coefficient
0.119 0.068 �0.287*** �0.144* �0.165* 0.100 0.089 0.092 0.111 0.048
Sig. (2-tailed) 0.096 0.345 0.000 0.043 0.021 0.161 0.212 0.198 0.119 0.509
4th quartile
N�1,384
Correlation
coefficient
0.036 0.153* �0.108 �0.171* �0.066 0.116 0.014 0.104 0.094 0.089
Sig. (2-tailed) 0.611 0.031 0.130 0.016 0.357 0.106 0.844 0.147 0.191 0.216
*Correlation is significant at the 0.05 level (2-tailed). ** Correlation is significant at the 0.01 level (2-tailed). *** Correlation is significant at the 0.005 level (2-tailed).
The
langu
age
ofscien
ceand
readability
21

Table 7. (full version). Constructed response items. Bivariate correlations between students’ percent right and meaning dimensions, number of
words, readability and information load measures. Significant values are boldface.
Constructed
response items,
N�86
Spearman’s
rank
correlation Packing Precision Personification Presentation
Number
of words
LIX
(readability
index)
Content
words per
words
Nominal
ratio
Simple
nominal
ratio
Nouns per
pronouns
All students,
N�5,516
Correlation
coefficient
�0.003 0.185 �0.137 �0.171 �0.043 0.111 0.067 0.103 0.086 0.046
Sig. (2-tailed) 0.977 0.089 0.209 0.116 0.693 0.310 0.539 0.346 0.429 0.678
Girls,
N�2,654
Correlation
coefficient
0.001 0.223* �0.139 �0.151 �0.016 0.124 0.051 0.116 0.092 0.046
Sig. (2-tailed) 0.991 0.039 0.202 0.164 0.885 0.257 0.640 0.287 0.400 0.680
Boys,
N�2,857
Correlation
coefficient
0.005 0.168 �0.126 �0.198 �0.056 0.103 0.088 0.104 0.090 0.045
Sig. (2-tailed) 0.965 0.123 0.247 0.068 0.610 0.348 0.420 0.342 0.409 0.688
1st quartile,
N�1,378
Correlation
coefficient
�0.029 0.246* �0.216* �0.089 �0.035 0.081 0.067 0.073 0.065 0.061
Sig. (2-tailed) 0.789 0.022 0.046 0.418 0.752 0.459 0.540 0.502 0.553 0.583
4th quartile,
N�1,384
Correlation
coefficient
0.052 0.101 �0.051 �0.237* �0.051 0.151 0.048 0.167 0.128 0.082
Sig. (2-tailed) 0.635 0.352 0.642 0.028 0.639 0.164 0.658 0.124 0.240 0.460
*Correlation is significant at the 0.05 level (2-tailed).
Tom
as
Persson
22

Table 8. (full version). Biology items. Bivariate correlations between students’ percent right and meaning dimensions, number of words, readability
and information load measures. Significant values are boldface.
Biology items,
N�69
(N�67 for
nouns per
pronouns)
Spearman’s
rank
correlation Packing Precision Personification Presentation
Number
of words
LIX
(readability
index)
Content
words per
words
Nominal
ratio
Simple
nominal
ratio
Nouns per
pronouns
All students,
N�5,516
Correlation
coefficient
�0.127 0.199 �0.077 �0.249* �0.020 �0.111 �0.054 0.128 0.100 0.085
Sig. (2-tailed) 0.299 0.101 0.532 0.039 0.869 0.365 0.659 0.295 0.412 0.492
Girls,
N�2,654
Correlation
coefficient
�0.161 0.269* �0.029 �0.180 0.012 �0.099 �0.091 0.083 0.050 0.058
Sig. (2-tailed) 0.187 0.025 0.812 0.139 0.920 0.418 0.459 0.497 0.681 0.639
Boys,
N�2,857
Correlation
coefficient
�0.079 0.150 �0.109 �0.288* �0.039 �0.101 �0.016 0.166 0.131 0.123
Sig. (2-tailed) 0.518 0.220 0.373 0.016 0.747 0.409 0.893 0.174 0.282 0.322
1st quartile,
N�1,378
Correlation
coefficient
0.009 0.149 �0.202 �0.270* �0.132 �0.036 0.052 0.196 0.173 0.149
Sig. (2-tailed) 0.939 0.221 0.097 0.025 0.281 0.767 0.670 0.107 0.155 0.230
4th quartile,
N�1,384
Correlation
coefficient
�0.059 0.154 �0.065 �0.281* �0.043 �0.018 �0.056 0.155 0.140 0.110
Sig. (2-tailed) 0.628 0.205 0.596 0.019 0.723 0.883 0.648 0.205 0.253 0.377
*Correlation is significant at the 0.05 level (2-tailed).
The
langu
age
ofscien
ceand
readability
23
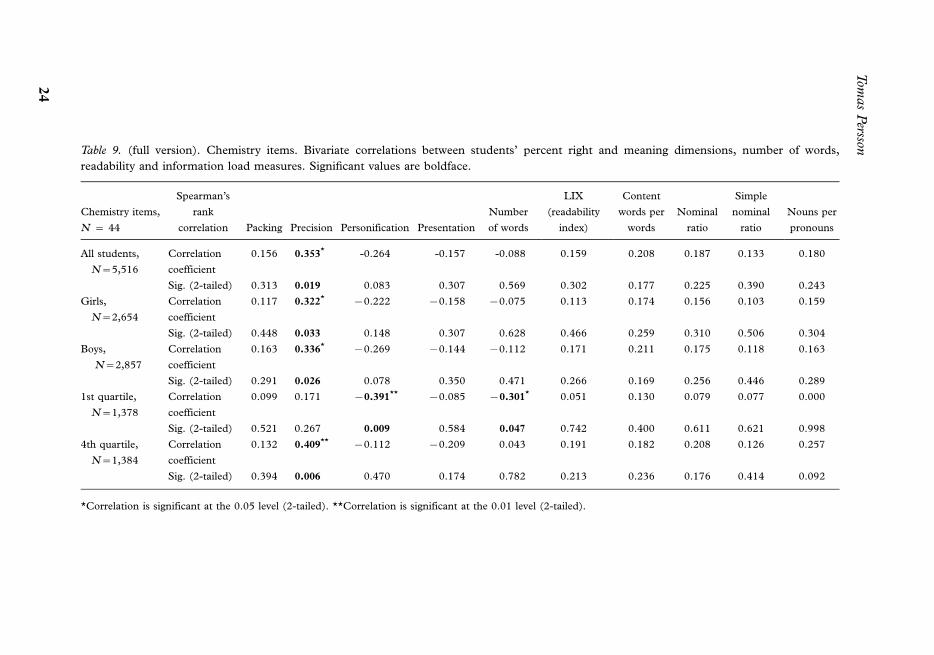
Table 9. (full version). Chemistry items. Bivariate correlations between students’ percent right and meaning dimensions, number of words,
readability and information load measures. Significant values are boldface.
Chemistry items,
N � 44
Spearman’s
rank
correlation Packing Precision Personification Presentation
Number
of words
LIX
(readability
index)
Content
words per
words
Nominal
ratio
Simple
nominal
ratio
Nouns per
pronouns
All students,
N�5,516
Correlation
coefficient
0.156 0.353* -0.264 -0.157 -0.088 0.159 0.208 0.187 0.133 0.180
Sig. (2-tailed) 0.313 0.019 0.083 0.307 0.569 0.302 0.177 0.225 0.390 0.243
Girls,
N�2,654
Correlation
coefficient
0.117 0.322* �0.222 �0.158 �0.075 0.113 0.174 0.156 0.103 0.159
Sig. (2-tailed) 0.448 0.033 0.148 0.307 0.628 0.466 0.259 0.310 0.506 0.304
Boys,
N�2,857
Correlation
coefficient
0.163 0.336* �0.269 �0.144 �0.112 0.171 0.211 0.175 0.118 0.163
Sig. (2-tailed) 0.291 0.026 0.078 0.350 0.471 0.266 0.169 0.256 0.446 0.289
1st quartile,
N�1,378
Correlation
coefficient
0.099 0.171 �0.391** �0.085 �0.301* 0.051 0.130 0.079 0.077 0.000
Sig. (2-tailed) 0.521 0.267 0.009 0.584 0.047 0.742 0.400 0.611 0.621 0.998
4th quartile,
N�1,384
Correlation
coefficient
0.132 0.409** �0.112 �0.209 0.043 0.191 0.182 0.208 0.126 0.257
Sig. (2-tailed) 0.394 0.006 0.470 0.174 0.782 0.213 0.236 0.176 0.414 0.092
*Correlation is significant at the 0.05 level (2-tailed). **Correlation is significant at the 0.01 level (2-tailed).
Tom
as
Persson
24

Table 10. (full version). Earth science items. Bivariate correlations between students’ percent right and meaning dimensions, number of words,
readability and information load measures. Significant values are boldface.
Earth Science items,
N�35
(N�34 for nouns
per pronouns)
Spearman’s
rank
correlation Packing Precision Personification Presentation
Number
of words
LIX
(readability
index)
Content
words per
words
Nominal
ratio
Simple
nominal
ratio
Nouns per
pronouns
All students,
N�5,516
Correlation
coefficient
0.380* 0.238 �0.214 �0.140 �0.057 0.381* 0.277 0.115 0.210 0.130
Sig. (2-tailed) 0.024 0.168 0.217 0.422 0.744 0.024 0.108 0.509 0.225 0.464
Girls,
N�2,654
Correlation
coefficient
0.365* 0.258 �0.235 �0.102 �0.001 0.384* 0.255 0.121 0.206 0.138
Sig. (2-tailed) 0.031 0.135 0.174 0.559 0.996 0.023 0.140 0.488 0.235 0.436
Boys,
N�2,857
Correlation
coefficient
0.406* 0.242 �0.199 �0.170 �0.067 0.387* 0.289 0.143 0.240 0.165
Sig. (2-tailed) 0.016 0.161 0.251 0.329 0.701 0.022 0.092 0.412 0.166 0.352
1st quartile,
N�1,378
Correlation
coefficient
0.419* 0.124 �0.226 �0.210 �0.105 0.313 0.289 0.122 0.241 0.098
Sig. (2-tailed) 0.012 0.477 0.192 0.226 0.547 0.067 0.092 0.483 0.163 0.582
4th quartile,
N�1,384
Correlation
coefficient
0.386* 0.333 �0.188 �0.023 �0.037 0.431** 0.334 0.172 0.204 0.221
Sig. (2-tailed) 0.022 0.050 0.280 0.894 0.834 0.010 0.050 0.322 0.239 0.209
*Correlation is significant at the 0.05 level (2-tailed). **Correlation is significant at the 0.01 level (2-tailed).
The
langu
age
ofscien
ceand
readability
25

Table 11. (full version). Physics items. Bivariate correlations between students’ percent right and meaning dimensions, number of words, readability
and information load measures. Significant values are boldface.
Physics items,
N�49
Spearman’s
rank
correlation Packing Precision Personification Presentation
Number
of words
LIX
(readability
index)
Content
words per
words
Nominal
ratio
Simple
nominal
ratio
Nouns per
pronouns
All students,
N�5,516
Correlation
coefficient
�0.288* �0.179 �0.073 �0.072 �0.103 �0.002 �0.366** �0.252 �0.254 �0.247
Sig. (2-tailed) 0.045 0.218 0.620 0.623 0.483 0.987 0.010 0.080 0.079 0.088
Girls,
N�2,654
Correlation
coefficient
�0.291* �0.178 �0.020 �0.081 �0.078 0.020 �0.350* �0.255 �0.261 �0.284*
Sig. (2-tailed) 0.043 0.221 0.893 0.581 0.596 0.894 0.014 0.077 0.070 0.048
Boys,
N�2,857
Correlation
coefficient
�0.282* �0.175 �0.102 �0.071 �0.135 �0.035 �0.371** �0.241 �0.245 �0.222
Sig. (2-tailed) 0.049 0.228 0.487 0.627 0.356 0.812 0.009 0.095 0.090 0.126
1st quartile,
N�1,378
Correlation
coefficient
�0.070 �0.052 �0.246 �0.014 �0.052 0.183 �0.183 �0.207 �0.154 �0.160
Sig. (2-tailed) 0.631 0.722 0.089 0.925 0.720 0.207 0.207 0.153 0.291 0.273
4th quartile,
N�1,384
Correlation
coefficient
�0.311* �0.161 0.005 �0.088 �0.194 �0.062 �0.386** �0.214 �0.203 �0.248
Sig. (2-tailed) 0.030 0.269 0.972 0.548 0.182 0.674 0.006 0.141 0.163 0.086
*Correlation is significant at the 0.05 level (2-tailed). ** Correlation is significant at the 0.01 level (2-tailed).
Tom
as
Persson
26

Table 12. (full version). Multiple choice items. Bivariate correlations between students’ percent right and meaning dimensions, number of words,
readability and information load measures. Significant values are boldface.
Multiple choice
items,
N�108
Spearman’s
rank
correlation Packing Precision Personification Presentation
Number
of words
LIX
(readability
index)
Content
words per
words
Nominal
ratio
Simple
nominal
ratio
Nouns per
pronouns
All students,
N � 5,516
Correlation
coefficient
�0.088 0.050 0.113 �0.028 �0.042 �0.002 �0.083 �0.038 �0.070 0.045
Sig. (2-tailed) 0.364 0.610 0.243 0.771 0.666 0.986 0.394 0.697 0.472 0.642
Girls,
N � 2,654
Correlation
coefficient
�0.080 0.040 0.125 �0.019 �0.042 0.019 �0.079 �0.061 �0.086 0.025
Sig. (2-tailed) 0.412 0.678 0.197 0.847 0.670 0.841 0.414 0.532 0.378 0.794
Boys,
N � 2,857
Correlation
coefficient
�0.097 0.056 0.117 �0.037 �0.036 �0.027 �0.079 �0.023 �0.068 0.064
Sig. (2-tailed) 0.316 0.568 0.228 0.707 0.715 0.783 0.418 0.817 0.488 0.509
1st quartile,
N � 1,378
Correlation
coefficient
0.000 �0.130 0.075 �0.018 �0.181 �0.014 �0.028 �0.022 �0.051 0.015
Sig. (2-tailed) 1.000 0.180 0.438 0.852 0.061 0.884 0.772 0.825 0.598 0.876
4th quartile,
N � 1,384
Correlation
coefficient
�0.086 0.159 0.103 �0.024 �0.023 0.032 �0.069 �0.008 �0.032 0.078
Sig. (2-tailed) 0.375 0.100 0.287 0.804 0.815 0.745 0.479 0.935 0.739 0.422
No significant correlations found at the 0.05 level (2-tailed).
The
langu
age
ofscien
ceand
readability
27