the latin american plastics industry market composition ... · the latin american plastics industry...
TRANSCRIPT

The Latin American Plastics Industry Market Composition &
Capital Spending Survey
Presented by:TECNOLOGÍA DEL PLÁSTICO
October, 2014

CONTENTS1.
Latin American Market Overview
2.
Buying Intention Survey
3.
Conclusions

1. LATIN AMERICAN MARKET OVERVIEW
Market Trend Evolution: Plastics Machinery and Molds Imports
Top Exporters of Plastics Machinery and Molds to Latin America
Top Latin American Buyers of Plastics Machinery and Molds
Market Trend Evolution: Raw Materials Imports
Top Exporters of Raw Materials to Latin America
Top Latin American Buyers of Plastics Raw Materials
What does Latin America represent out of the global US exports of plastics
machinery & materials?

Market Trend Evolution: Plastics Machinery and Molds Imports
(USD’000)
* Source: ALADI, the Latin American Integration Association. Figures only include 10 top Latin American economies. Figures based on the limited number of product categories included in this report.
• In terms of Machinery the region showed the following share of imports in 2013:- Injection Machinery: 35%- Others: 22%- Extrusion: 14%- Blow Molding: 8% - Vacuum Molding: 4%- Parts: 22%
• The region grew 21% between 2010 and 2013

Top Exporters of Machinery to Latin America2013‐
(USD’000)
* Source: ALADI, the Latin American Integration Association. Figures only include 10 top Latin American economies. Figures based on the limited number of product categories included in this report.
Germany leads as the top exporting country to Latin America with a 21.3% share of total imports, followed by
China’s 16.9% and USA’s 15.3% share of imports.

Top Exporters of Molds to Latin America2013‐
(USD’000)
* Source: ALADI, the Latin American Integration Association. Figures only include 10 top Latin American economies. Figures based on the limited number of product categories included in this report.
The USA leads as the top exporting country to Latin America with a 24.8% share of total imports, followed by
China’s 19% and South Korea’s 9.4% share of
imports.

Top Latin American Buyers of Plastics Machinery and Molds 2013
* Source: ALADI, the Latin American Integration Association. Figures only include 10 top Latin American economies.Figures based on the limited number of product categories included in this report.
• Mexico is the largest single importing country in Latin America with a significant 58% of the total, followed by Brazil with 24% and ROLA with 18%.
• According to ANIPAC, Mexico beats Brazil in total plastics demand (consumption plus exports), due the higher exports by Mexican companies.
• Brazil has 3X the number of plastics transformers of Mexico, but these companies have lower investments in machinery and equipment, and as such production capacity.

Market Trend Evolution: Raw Materials Imports(USD’000)
* Source: ALADI, the Latin American Integration Association. Figures only include 10 top Latin American economies.Figures based on the limited number of product categories included in this report.
• Polyethylene, PET, Polypropylene and PVC represented 73% of the total imports in 2013.
• In contrast, other materials for more specialized processes such as Polystyrene, Acrylic Polymers, Polyamides, Amino Resins, Silicones and Polymers of Vinyl Acetate represent and important 28% of the market.
• The region is adopting locally more and more their state-of- the-art plastics processing needs!
• Material exports to Latam grew 24.7% between 2010 and 2013!

Top Exporters of Plastics Raw Materials to Latin America2013‐
(USD’000)
* Source: ALADI, the Latin American Integration Association. Figures only include 10 top Latin American economies.Figures based on the limited number of product categories included in this report.
With a 50% share, The USA is the single largest
exporter of plastics raw materials to Latin America

Top Latin American Buyers of Plastics Raw Materials 2013
* Source: ALADI, the Latin American Integration Association. Figures only include 10 top Latin American economies. Figures based on the limited number of product categories included in this report.
Mexico is the largest single importing country in
America Latina of plastics raw materials with a 40% of the total, followed by Brazil with 26%. The rest of Latin
America represents a significant 34% of material
imports.

USA MATERIALS & MACHINERY EXPORTS TO LATAM ‐
USDC
* Source: ALADI, the Latin American Integration Association. Figures only include 10 top Latin American economies. Figures based on the limited number of product categories included in this report.
USA plastics resins, machinery, parts and mold exports to Latin America have grown for four
consecutive years since the global recession hit in 2009, showing a full recovery of the region. Total
USA exports to Latam
reached US$ 13 billion in the 21 product categories tracked in this chart!
Based on July ‘14 exports, the region is bound for growth in 2014!
PRODUCT CATEGORIES / USD EXPORTS 2009 2010 2011 2012 2013 2014 through July3901 Polymers Of Ethylene, In Primary Forms $2,537,487,749 $3,247,766,934 $3,515,463,088 $3,710,623,794 $4,109,491,896 $2,515,308,7373902 Polymers Of Propylene Or Other Olefins, Prim Forms $1,034,437,450 $1,383,456,796 $1,599,599,083 $1,511,285,582 $1,648,374,410 $970,294,0643903 Polymers Of Styrene, In Primary Forms $524,451,216 $697,066,374 $786,102,937 $786,435,210 $764,321,892 $431,910,1333904 Polymers Of Vinyl Chloride Etc., In Primary Forms $693,972,147 $944,467,751 $1,199,484,395 $1,124,456,391 $1,290,442,271 $739,826,3943905 Polymers Of Vinyl Acetate & Oth Vinyl Polym, Pr Fm $179,745,628 $203,342,669 $214,951,227 $234,644,783 $221,529,487 $114,779,6353906 Acrylic Polymers In Primary Forms $453,102,659 $639,881,828 $787,636,087 $768,113,198 $849,946,775 $459,306,0773907 Polyethers, Expoxides & Polyesters, Primary Forms $1,222,268,232 $1,623,969,793 $1,795,850,184 $2,063,322,486 $2,118,194,217 $1,278,161,9213908 Polyamides In Primary Forms $250,483,670 $398,629,070 $463,076,252 $512,151,542 $539,523,968 $327,685,6613909 Amino‐resins, Phenolics & Polyurethanes, Prim Form $344,330,720 $457,765,430 $508,149,473 $508,773,053 $476,448,879 $332,876,0463910 Silicones, In Primary Forms $185,830,716 $235,785,972 $240,962,673 $269,331,660 $282,906,475 $164,234,4773911 Petro Resins, Polysulfides Etc Nesoi, Primary Form $212,608,596 $290,249,318 $281,499,480 $251,944,247 $258,248,049 $169,513,2753912 Cellulose And Chemical Deriv Nesoi, Primary Forms $199,468,646 $191,001,078 $186,085,338 $191,251,732 $193,251,464 $104,858,6853915 Waste, Parings And Scrap, Of Plastics $26,923,383 $38,225,876 $39,158,810 $37,455,958 $39,484,783 $22,891,5148477109025 Inject‐molding Mach For Processing Thermoplastics (no) $67,210,551 $46,746,434 $41,680,662 $48,697,999 $45,204,090 $35,941,1438477200030 Extruders, Single Screw, For Thermoplastics (no) $3,046,014 $5,465,902 $3,034,512 $13,650,926 $7,106,974 $6,056,1258477200060 Extruders For Processing Thermoplastics, Nesoi (no) $5,791,025 $30,649,051 $13,311,431 $12,427,972 $27,022,551 $6,059,6508477300000 Blow‐molding Machines (no) $15,406,072 $13,757,696 $10,974,411 $18,830,762 $18,561,881 $5,070,6498477400100 Vacuum‐mold Mach & Oth Thermoforming Machine Nesoi (no) $8,986,451 $11,488,681 $19,839,100 $19,384,809 $18,780,895 $6,899,8348477900010 Parts Of Injection‐molding Machines (x) $56,447,975 $66,976,308 $63,831,097 $59,375,850 $62,553,999 $36,145,6688477900020 Parts Of Extruders For Rubber Or Plastics (x) $12,117,137 $11,726,965 $16,428,138 $17,719,783 $12,281,168 $12,907,5958477900030 Parts Of Blow‐molding Machines (x) $3,211,703 $7,226,308 $9,144,658 $5,971,472 $4,533,076 $3,778,281
TOTALS $8,037,327,740 $10,545,646,234$11,796,263,036 $12,165,849,209$12,988,209,200 $7,744,505,564VARIATION 31% 12% 3% 7%

USA SHARE OF EXPORTS TO LATAM FROM ITS GLOBAL MACHINARY EXPORTS2013‐
(USD’000)
* Source: ALADI, the Latin American Integration Association. Figures only include 10 top Latin American economies. Figures based on the limited number of product categories included in this report.
2013 USA plastics resins, machinery, parts and molds exports to
Latin America
reached closed to US$13 billion, representing 37% of the USA worldwide exports,
based on the 21 product categories tracked in the prior chart.
Latin America is a key and trusted trading partner of US exporters!
TOTAL US EXPORTS / USD 2009 2010 2011 2012 2013 2014 As of July
TOTAL LATIN AMERICA $8,037,327,740 $10,545,646,234 $11,796,263,036 $12,165,849,209 $12,988,209,200 $7,744,505,564
TOTAL US EXPORTS $25,088,073,369 $32,222,751,014 $35,434,952,398 $34,646,755,622 $35,551,376,075 $21,370,787,430
VARIATION 32% 33% 33% 35% 37% 36%
2. BUYING INTENTION SURVEY
Methodology and reachPlant Capacity Utilization Size of companies by number of employeesMain Markets/Sectors Served 2014‐2015 Projected Investment DistributionInvestment Intentions by Product SegmentBuying Intentions By Country of Origin

METHODOLOGY AND REACH
• E‐mail survey sent to 8,888
Latin
American subscribers of
TECNOLOGIA DEL PLASTICO
magazine.
• Limited to one answer by
company. In‐depth questionnaire.
• The survey obtained 1,094
valid
responses from 23
Latin American
countries, representing a 12%
response rate.

2013 Capacity utilization
Base: 897
• A healthy 38% of companies reported capacity usage of 80% or more.
• Only 13% of companies reported capacity usage of less than 50%
• In Mexico, the investment in capital goods has remained above US$1.6 billion annually since 2005, which confirms the continuing technology renovation and higher productivity of this key Latam country. (ANIPAC)

Size of Latin American Plants Included in the Survey By Number of Employees
Base: 897
• 28% of the sample was comprised of companies with 101+ employees
• 30% was comprised of companies between 21- 100 employees
• 42% was comprised of companies with 20 or less employees

Main Markets/Sectors Served
Base: 1094
• Latin American plastics processors in this sample concentrate mainly in recycling (24%), followed by flexible packaging (22%), products for industrial facilities (19%), rigid packaging (17%), construction (17%) and autoparts (14%).
• In Mexico, the imports of capital goods rose to exceed 2 billion dollars in 2012 and 2,2 billion in 2013.
• This growth can be attributed in part to investments made in the automotive industry, due to new OEM’s and autopart manufacturing plants opening in the past few years (i.e. Honda, VW, Nissan, BMW, Audi, Mazda and others), as well as major Tier-1 suppliers (i.e. Hella, Faurecia, ABC Group, Valeo)
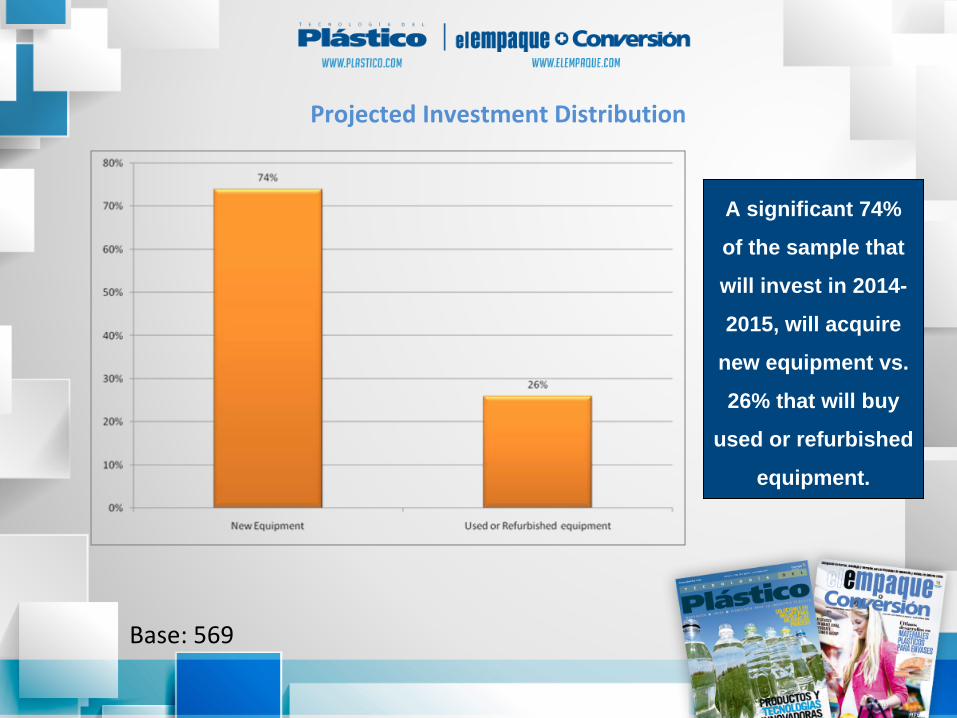
Projected Investment Distribution
Base: 569
A significant 74%
of the sample that
will invest in 2014-
2015, will acquire
new equipment vs.
26% that will buy
used or refurbished
equipment.

Base: 1094
Plastic transformation processes of the companies involved in the survey
The results of the Survey emulate the same pattern that results from the
actual import figures from
ALADI.

Companies who want to invest in equipment / machinery during the
next 12 months (2014‐2015)
Base: 1094
A healthy 69% of the Sample indicated their intention to invest in capital equipment in the next 12 months!

Buying Intention: Auxiliary Equipment
Base: 628
• 57% of the sample indicated their intention to buy Auxiliary Equipment.
• Recycling equipment reported the highest buying intention of the sample.
• All product references show strong 2 percentage digit buying intentions.

Buying Intention: Extrusion Lines
Base: 239
• 22% of the sample indicated their intention to buy Extrusion Equipment.
• The extrusion was one of the first processes used by the Mexican plastics industry and currently accounts for about 31% of the total volume of processed plastics. (ANIPAC)
• In Mexico, the imports of extrusion machinery has grown and now represents 17% of the machinery market in the country. (ANIPAC)

Buying Intention: Hydraulic Injection Molding Systems
Base: 229
• 21% of the sample indicated their intention to buy Hydraulic Injection Molding Equipment.
• In Mexico, around 30% of the total production of plastic components is obtained by plastics injection molding process. (ANIPAC)
• Machinery for injection molding represents the largest category of imports from primary plastics processing machinery. (ANIPAC)

Buying Intention: Molds
Base: 386
• 35% of the sample indicated their intention to buy Molds.
• In Mexico, the molds for injection molding represent over 90% of total imports of molds and tooling. (ANIPAC)
• According to ANIPAC, in 2012 there was an increase in the value of imports of molds and tooling in Mexico, due to a significant increase in injection molds for products/parts of more than 5 kg. (ANIPAC)
• In 2013, the same situation reached a record of more than twice the value recorded in 2000. (ANIPAC)
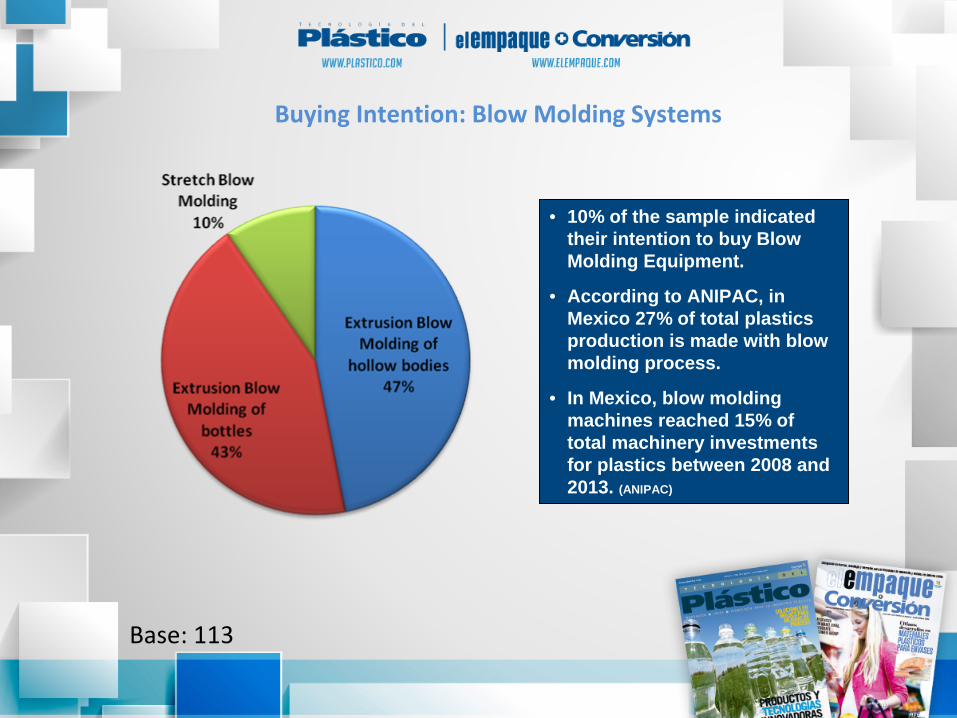
Buying Intention: Blow Molding Systems
Base: 113
• 10% of the sample indicated their intention to buy Blow Molding Equipment.
• According to ANIPAC, in Mexico 27% of total plastics production is made with blow molding process.
• In Mexico, blow molding machines reached 15% of total machinery investments for plastics between 2008 and 2013. (ANIPAC)

Buying Intention: Thermoforming Systems
Base: 68
• 6% of the sample indicated their intention to buy Thermoforming Equipment.
• In Mexico, 3% of the total production of plastics derive from thermoforming processes. (ANIPAC)
• Imports of thermoforming machinery and vacuum forming machinery correspond to no more than 6% of the value of total imports. (ANIPAC)

Base: 569
Buying Intention By Country of Origin
Asian suppliers are the preferred choice with
59% of the buyers indicating they intend to buy from Asia, followed by 36% from Europe and
35% from the USA or Canada.

Conclusions: Positive Market Behavior
38% of the sample reported plant capacity utilization of +80%, showing healthy production levels in the region!
69% of the sample indicated they had the intention to invest in
Capital Equipment in the next 12 months.
Recycling equipment (34%), Feeders & loaders (32%), heating & cooling systems (28%) and measuring & quality
control systems (23%) topped the list of auxiliary equipment the
sample intents to buy in 12 months.
Blown film (37%), pipe and profiles (29%) and solid sheet (14%)
topped the list of extrusion lines the sample
indicated they would buy in the next 12 months.
110‐400 tons (39%), 30 to 100 tons (23%) and 410 to 800 tons (19%) topped the list of hydraulic injection
molding machines the sample indicated they would buy in the next
12 months.
74% of the sample indicated they would buy NEW equipment. Good news for new equipment manufacturers!
A significant 59% of the Buying Intention survey sample expressed interest in buying Asian equipment, vs. 35%
from the USA or Canada and 36% from Europe.
All indicators showed growth for Plastics Machinery, Molds and Material imports from Latin America in 2013!
Mexico is the top importer of Equipment, Molds and Materials in the region!
Latin America represents 37% of the total US exports to the plastics industry!

Conclusions & Final remarks: Latin is going green!
Latin American plastics processors in this sample concentrate mainly in the recycling (24%),
followed by flexible packaging (24%), products for industrial facilities (19%), rigid packaging
(17%), construction products (17%), households products (16%) and autoparts
(14%).
A significant 30% of the sample is involved in recycling processes. Green
mentality is catching
up in Latin America.
According to ANIPAC, the recycling of plastics in Mexico has grown significantly and has
become an indispensable thriving industry.
In 2012, in Mexico recycled about 1.6 million tons of plastic, equivalent to 21.3% of plastic
waste generated.

THANK YOU!¡GRACIAS!
For additional information contact
our Associate Publisher Giovana
Reyes at:
704‐396‐6412
www.plastico.com/media‐kit