the lifetime impacts and costs of childhood … d4.7_final.pdf · dr. benedetta contoli, dr. maria...
TRANSCRIPT

LIFETIME IMPACT AND COST OF CHILDHOOD OBESITY IN EUROPE (PART 2) 1
THE LIFETIME IMPACTS AND COSTS OF CHILDHOOD OBESITY OVERWEIGHT IN EUROPE PART 2:
DATA AND DATA DOCUMENTATION
CHALLENGES AND LESSONS
FUTURE DEVELOPMENTS
Deliverable D4.7
Work Package WP 4: Evidence (the economic rationale for action on childhood obesity)
Responsible Partner: IPH IRL
Contributing partners: HZZO & HZJZ (Croatia), ATEITH & AHEPA (Greece), UCC-CHDR (IRL & NIR), ISS (Italy), MS (Portugal), NIMCH (Romania), NIJZ (Slovenia)
JANPA – Joint Action on Nutrition and Physical Activity (Grant agreement n° 677063) has received funding from the European Union’s Health Programme (2014-2020)

LIFETIME IMPACT AND COST OF CHILDHOOD OBESITY IN EUROPE (PART 2) 2
The content of this Deliverable represents the views of the author only and is his/her sole
responsibility; it cannot be considered to reflect the views of the European Commission
and/or the Consumers, Health, Agriculture and Food Executive Agency or any other body of
the European Union.
The European Commission and the Agency do not accept any responsibility for use that may
be made of the information it contains.

LIFETIME IMPACT AND COST OF CHILDHOOD OBESITY IN EUROPE (PART 2) 3
GENERAL INFORMATION
Joint Action full title Joint Action on Nutrition and Physical Activity
Joint Action acronym JANPA
Funding This Joint Action has received funding from the European Union’s Health Programme (2014-2020)
Grant Agreement Grant agreement n°677063
Starting Date 01/09/2015
Duration 27 Months
DOCUMENT MANAGEMENT
Deliverable D4.7
WP and Task WP4 and Task 4.4
Leader IPH IRL
Other contributors ATEITH, AHEPA (Greece) UCC-CHDR (IRL), NIMCH (Romania), NIJZ (Slovenia)
Due month of the deliverable M27
Actual submission month End of JANPA
Type
R: Document, report DEC: Websites, patent fillings, videos, etc. OTHER
R
Dissemination level PU: Public
PU

LIFETIME IMPACT AND COST OF CHILDHOOD OBESITY IN EUROPE (PART 2) 4
ROLES
COUNTRY ORGANISATION ROLE
Croatia HZZO
Vesna Kufrin
Zlatko Boni (past)
HZIZ
Sanja Music Milanovic
Country liaison, Data collation
Croatian Team Co-Leader
Croatian Team Co-Leader
Country liaison, Data collation
Croatian Team Co-Leader
Greece
ATEITH
Maria Hassapidou
Anna Kokkinopoulou
AHEPA
Themistoklis Tzotzas
Despoina Komninou
Hara Dimitroula
Country liaison , Data collation
Greek Team Co-Leader
Data collation
Greek Team Co-Leader
Data collation
Data collation
Data collation
Ireland
(Republic of Ireland)
IPH-IRL
Kevin Balanda
WP4 Lead Team
WP4 Leader, D4.6 Author
UK HEALTH FORUM
Laura Webber
Sub-contractor (to IPH-IRL)
Pre-modelling data processing
Simulation modelling and cost
estimation
Ireland
(Republic of Ireland &
Northern Ireland)
UCC CHDR
Ivan J Perry
IPH-IRL
Kevin Balanda
Country liaison
Irish Team Leader
Country liaison, Data collation
WP4 Team Leader
Italy ISS
Angela Spinelli
Laura Lauria
Country Liaison, Data collation
Italian Team Co-Leader
Italian Team Co-Leader
Portugal MS
Pedro Graça
Andrea Costa
Country liaison
Portuguese Team Co-Leader
Portuguese Team Co-Leader

LIFETIME IMPACT AND COST OF CHILDHOOD OBESITY IN EUROPE (PART 2) 5
Gisele Camara Data collation
Romania
NIMCH
Michaela Iuliana Nanu, National
Institute for Mother and Child
Health, Bucharest
Ioana Nanu, National Institute for
Mother and Child Health,
Bucharest
Country liaison, Data collation
Romanian Team Co-Leader
Romanian Team Co-Leader
Slovenia
National Institute of Public Health
- NIJZ
Mojca Gabrijelcic Blenkus,
National Institute of Public Health
(NIJZ), Ljubljana
Aleš Korošec, National Institute of
Public Health (NIJZ), Ljubljana
Country liaison, Data collation
Slovenian Team Co-Leader
Slovenian Team Co-Leader

LIFETIME IMPACT AND COST OF CHILDHOOD OBESITY IN EUROPE (PART 2) 6
ACKNOWLEDGEMENTS
International Scientific
Advisory Group
Associate Prof Jennifer Baker, Institute of Preventive Medicine in
Denmark and the University of Copenhagen. Denmark
Dr Margherita Caroli, Nutrition Unit, Department of Prevention,
Azienda Sanitaria Locale Brindisi. Italy
Dr Anne Dee, Health Service Executive. Republic of Ireland
Dr Tony Fitzgerald, Department of Statistics and & Department of
Epidemiology & Public Health. University College Cork. Republic of
Ireland
Prof David Madden, School Of Economics, University College Dublin.
Republic of Ireland
Dr Martin O’Flaherty, University of Liverpool. England
Dr Pepijn Vemer, Department of Pharmacoepidemiology &
Pharmacoeconomy, University of Groningen. Netherlands
Greece e-GOVERNMENT CENTER FOR SOCIAL SECURITY SERVICES (IDIKA S.A.)
Mathioudakis Kostas, Department of Electronic Prescriptions
HELLENIC STATISTICAL AUTHORITY
Eleni Katsorhi, Department for Statistical Information Provision
CANCER REGISTRY OF CRETE (CRC)
Dimitra Sifaki-Pistolla, School of Medicine, University of Crete
MINISTRY OF HEALTH
Ioanna Kontele, Dpt. of Public Health
Irene Grimani, Dpt. of Health Data Processing and Analysis
Italy Dr. Roberto Da Cas, Dr. Giuseppe Traversa National Centre for Drug Research and Evaluation, Istituto Superiore di Sanità Dr. Luigi Palmieri, Dr. Chiara Donfrancesco, Dr. Simona Giampaoli Department of Cardiovascular, Dismetabolic and Ageing-associated diseases, Istituto Superiore di Sanità; Dr. Daniela Pierannunzio, Dr. Valentina Minardi, Dr. Gianluigi Ferrante, Dr. Benedetta Contoli, Dr. Maria Masocco, Mr. Massimiliano Caldora National Center for Disease Prevention and Health Promotion, Istituto Superiore di Sanita

LIFETIME IMPACT AND COST OF CHILDHOOD OBESITY IN EUROPE (PART 2) 7
Dr. Claudio Cricelli, Dr. Francesco Lapi, Dr. Serena Pecchioli Italian College of General Practitioners and Primary Care
Portugal Carla Lopes, The National Food, Nutrition and Physical Activity Survey (IAN AF), Faculdade de Medicina da Universidade do Porto
Carla Rêgo e Margarida Nazareth, EPACI study
Carlos Dias, The National Health Examination Survey 2013-2016 (INSEF), Instituto Nacional de Saúde Doutor Ricardo Jorge, I.P.
Joana Sousa, Escola Superior de Tecnologia da Saúde de Lisboa (ESTeSL)
Julian Perelman, Universidade Nova de Lisboa / Escola Nacional de Saúde Pública
Margarida Gaspar de Matos, HBSC Portugal study
Rita Horgan, trainee nutritionist at Directorate-General of Health
Vanessa Silva, Administração Central do Sistema de Saúde, I.P.
Pedro Barras, Administração Central do Sistema de Saúde, I.P.
Slovenia National Institute of Public Health – NIJZ, Health Data Unit Blaženka Jeren, Nevenka Kelšin, Miloš Kravanja, Mojca Simončič, Poldka Suhadolc, Metka Zaletel, Ana Zgaga, Irena Zupanc,
National Institute of Public Health – NIJZ, Health Survey and Health Promotion Unit Sonja Paulin, Tatjana Kofol Bric, National Institute of Public Health – NIJZ, Prevention and Promotion Programes Unit Rade Pribakovič Brinovec National Institute of Public Health – NIJZ, Health Care System Unit Sabina Sedlak
Faculty of Sport, University of Ljubljana,
Gregor Starc, for providing SLOfit data
Collaborating Partners
Ursula O’Dwyer, Department of Health, Republic of Ireland
Cliodha Foly-Nolan, safefood, Republic of Ireland
EU Joint Research Centre (EU JRC)
WHO Europe

LIFETIME IMPACT AND COST OF CHILDHOOD OBESITY IN EUROPE (PART 2) 8
CONVENTIONS AND DEFINITIONS
Adult 18 or more years
Adult Healthy Weight (HW) 18.5 ≤ BMI < 25.0
Adult obesity (OB)1 Defined by WHO cut-off point (30.0 ≤ BMI)
Adult Overweight (OW) 25.0 ≤ BMI < 30.0
Advanced study A more involved participation in WP4
Adult Underweight (UW) BMI < 18.52
Basic study A less involved participation in WP4
Body Mass Index (BMI)
Two BMI categories will be used throughout the life course:
Healthy weight (HW)
Obese/Overweight (OB/OW)
Bottom-up methods Methods used to estimate impact-related and cost-related model
inputs and outputs that are based on analysis of disease and
healthcare data in cross-sectional studies or longitudinal studies
that also include BMI data
Child 0-17 years
Childhood age categories for
reporting
Age categories for children that are used in the tables of model
outputs:
Younger children: 0 – 6 years
Older children: 7 -11 years
Adolescents: 12 – 17 years
Childhood obesity Based on an individual’s BMI at age 18 years as they exit childhood
(using IOTF cut-off points).
Closed Cohort Simulation
Model (CCSM)
A simulation model that takes an initial cohort (representative of
the population at the time), ages them and simulates their
experiences throughout their lives. No additional entries or exits
from the cohort (except by death of existing cohort members) are
allowed. A broad approach to burden of disease and cost of illness
studies; their primary interest is in the current and future
experiences of the initial cohort and not the whole population
living in any future year.
Current year 2015
1 WHO defines three sub-categories of obesity: these are not considered in this study because of lack of data.
Obesity category I (OB-I): 30.0 ≤BMI < 35.0)
Obesity category II (OB-II): 35.0 ≤ BMI < 40.0)
Obesity category III (OB-III): 40.) ≤ BMI
2 Underweight individuals are included in the Healthy Weight (HW) category

LIFETIME IMPACT AND COST OF CHILDHOOD OBESITY IN EUROPE (PART 2) 9
Current value Cost expressed in 2016 euros
Direct healthcare costs Costs that result from outpatient and inpatient health services
(including surgery), laboratory and radiological tests, and drug
therapy.
Discounting
Discounting of future disease and disability and costs (because
people tend to devalue future disease and disability and costs
compared to present) is considered to be best practice.
Effect metric
Describes the effect of a reduction in mean childhood BMI
Excess metric
Describes an excess in some impact-cost indicator (e.g. direct
healthcare costs) that can be associated with current childhood
obesity/overweight.
Friction-cost approach An alternative approach for estimating value of productivity losses
(see Human-capital l approach)
Globcan IARC / WHO data portal for cancer statistics
(http://globocan.iarc.fr/Default.aspx)
Human-capital approach The approach used while estimating value of losses (see Friction-Loss approach)
Impact-cost indicators Indicators that capture the impacts and costs that are incur as a
result of childhood obesity and overweight
Indirect healthcare costs Healthcare costs that are borne by the patient, their family and
community. They are not included in the JANPA costing model.
IOTF cut-off points
IOTF (now called World Obesity Federation) cut-off points used to
categorise childhood BMI. They apply to 2–17 year olds and map to
WHO’s adult BMI cut-off points
Lifetime BMI trajectory Lifetime trajectory of an individual’s annual BMI values throughout
their life
Life Expectancy at birth (LE) Measured in the year of birth
Obesity or overweight
(OW/OB)
A generic term used for a group of individuals who are either
overweight or obese (Jonoula et al)
Obesity-related impacts
Two types of consequences of childhood obesity and overweight
are considered:
Health impacts (diseases, disability and death)
Societal impacts (adult productivity losses and lifetime
income loss)
per case
Based on the number of cases of a disease and not the underlying
population size
Population Attributable
Fraction (PAF)
The proportion of an impact that would be avoided if a particular
risk factor was eliminated
Open Cohort Simulation
Model (OCSM)
A simulation model that takes an initial cohort (representative of
the population at the time), ages its members and simulates their
experiences throughout their lives. Additional entries (births and
immigration) and exits (emigration) are allowed to join as the
cohort ages so that the boosted cohort remains representative of

LIFETIME IMPACT AND COST OF CHILDHOOD OBESITY IN EUROPE (PART 2) 10
the whole population living in any future years. A broad approach
to burden of disease and cost of illness studies; the primary
interest here is in the current and future experiences of the whole
population in a particular year
Presenteeism Not covered in the JANPA costing model. It is reduced productivity
while attending work that is associated with obesity-related
disease or disability.
Private costs Costs incurred privately by patients, their families and
communities and not by the health and social care system
Relative Risk (RR) Also Odds Ratio (OR)
Sensitivity analysis
To represent the uncertainties inherent in data and modelling
assumptions
Societal costs These are the other resources that society and its citizens and
communities forego as a result of a health condition
Societal economic perspective
Includes impacts experienced and cost incurred by society and its
communities
Start-year First year of the simulation (2015)
Stochastic models Statistical models that operate probabilistically with random model
parameters having known distributions. For example:
The virtual individuals (virtual cohort) are sampled from a
theoretical population that has a pre-specified population
distribution. At least asymptotically, the sample and the
population of interest have the same distribution
Transition probabilities and other model inputs are
random variables unknown and sampled from pre-
assigned distributions
Top-down methods Methods used to estimate impact-related and cost-related model
inputs and outputs that are based on the application of Population
Attributable Fractions (PAFs) to national disease and healthcare
data
Years of Life Lost (YLL) Years of life lost up to an individual’s national life expectancy in
their birth year
zBMI scores Because cut-off points for overweight and obesity vary with age,
gender-specific standardised z-score cut-off points will be used to
define BMI status at different ages.

LIFETIME IMPACT AND COST OF CHILDHOOD OBESITY IN EUROPE (PART 2) 11
TABLE OF CONTENTS
ROLES ............................................................................................................................... 4
ACKNOWLEDGEMENTS ..................................................................................................... 6
CONVENTIONS AND DEFINITIONS ..................................................................................... 8
TABLE OF CONTENTS ...................................................................................................... 11
SUMMARY ..................................................................................................................... 14
BACKGROUND ............................................................................................................................................ 14
CHALLENGES AND LESSONS .................................................................................................................. 15
RECOMMENDATIONS .............................................................................................................................. 15
CONCLUSION .............................................................................................................................................. 16
1. INTRODUCTION .......................................................................................................... 17
1.1 THE JANPA COSTING MODEL ......................................................................................................... 17
1.2 PROJECT STATUS ............................................................................................................................... 18
1.3 OUTLINE OF THIS DOCUMENT ...................................................................................................... 19
2. GLOBAL DATA DOCUMENTATION ............................................................................... 20
3. CROATIA .................................................................................................................. 22
3.1 LOCAL CONTEXT ................................................................................................................................ 22
3.2 LOCAL EVIDENCE ............................................................................................................................... 24
3.2.1 Childhood Obesity / Overweight ............................................................................................ 24
3.2.2 Childhood Impacts .................................................................................................................. 25
3.2.3 Inequalities.............................................................................................................................. 25
3.3 DATA DOCUMENTATION ................................................................................................................ 25
3.4 DATA ...................................................................................................................................................... 30
CROATIAN REFERENCES ........................................................................................................................ 31
4. GREECE .................................................................................................................... 33
4.1 LOCAL CONTEXT ................................................................................................................................ 33
4.2 LOCAL EVIDENCE ............................................................................................................................... 36
4.2.1 Childhood Obesity / Overweight ............................................................................................ 36
4.2.2 Childhood Impacts .................................................................................................................. 37
4.2.3 Adult Impacts .......................................................................................................................... 37
4.2.4 Lifetime Costs.......................................................................................................................... 38
4.2.5 Inequalities ............................................................................................................................. 39

LIFETIME IMPACT AND COST OF CHILDHOOD OBESITY IN EUROPE (PART 2) 12
4.3 DATA DOCUMENTATION ................................................................................................................ 40
4.4 DATA ...................................................................................................................................................... 45
GREEK REFERENCES ................................................................................................................................ 46
5. REPUBLIC OF IRELAND ............................................................................................. 33
5.1 LOCAL CONTEXT ................................................................................................................................ 49
5.2 LOCAL EVIDENCE ............................................................................................................................... 52
5.2.1 Childhood Obesity / Overweight ........................................................................................... 52
5.2.2 Childhood Impacts .................................................................................................................. 53
5.2.5 Inequalities.............................................................................................................................. 53
5.3 DATA DOCUMENTATION ................................................................................................................ 54
5.3.1 Irish Disease Data Quality Scores ............................................................................................ 54
5.4 DATA ...................................................................................................................................................... 58
REPUBLIC OF IRELAND AND NORTHERN IRELAND REFERENCES........................................... 60
6. ITALY ....................................................................................................................... 62
6.1 LOCAL CONTEXT ................................................................................................................................ 62
6.2 LOCAL EVIDENCE ............................................................................................................................... 64
6.2.1 Childhood Obesity / Overweight ............................................................................................ 64
6.2.2 Childhood Impacts .................................................................................................................. 65
6.2.5 Inequalities.............................................................................................................................. 66
6.3 DATA DOCUMENTATION ................................................................................................................ 66
6.4 DATA ...................................................................................................................................................... 75
ITALIAN REFERNCES ............................................................................................................................... 75
7. NORTHERN IRELAND .......................................................................................................................... 78
7.1 DATA DOCUMENTATION ................................................................................................................ 78
7.2 DATA ...................................................................................................................................................... 81
8. PORTUGAL............................................................................................................... 84
8.1 LOCAL CONTEXT ................................................................................................................................ 84
8.2 LOCAL EVIDENCE ............................................................................................................................... 88
8.2.1 Overweight / Obesity .............................................................................................................. 88
8.2.2 Childhood Impacts .................................................................................................................. 90
8.2.5 Inequalities ...................................................................................................................................... 91
8.3 DATA DOCUMENTATION ................................................................................................................ 91
8.4 DATA ...................................................................................................................................................... 91
PORTUGUESE REFERENCES .................................................................................................................. 92
9. ROMANIA ................................................................................................................ 94

LIFETIME IMPACT AND COST OF CHILDHOOD OBESITY IN EUROPE (PART 2) 13
9.1 LOCAL CONTEXT ................................................................................................................................ 94
9.2 LOCAL EVIDENCE ............................................................................................................................... 95
9.2.1 Childhood Obesity / Overweight ............................................................................................ 95
9.2.2 Childhood Impacts .................................................................................................................. 96
9.2.3 Adult Impacts .......................................................................................................................... 97
9.2.5 Inequalities.............................................................................................................................. 97
9.3 DATA DOCUMENTATION ................................................................................................................ 97
9.4 DATA ................................................................................................................................................... 103
9.5 COMMENTS ....................................................................................................................................... 104
ROMANIAN REFERENCES .................................................................................................................... 106
10. SLOVENIA .............................................................................................................. 109
10.1 LOCAL CONTEXT .......................................................................................................................... 109
10.2 LOCAL EVIDENCE ......................................................................................................................... 110
10.2.1 Childhood Obesity / Overweight ........................................................................................ 110
10.2.2 Childhood Impacts .............................................................................................................. 111
10.3 DATA DOCUMENTATION ........................................................................................................... 111
10.4 DATA ............................................................................................................................................... 114
SLOVENIAN REFERENCES ................................................................................................................... 116
11. CHALLENGES AND LESSONS, RECOMMENDATIONS AND CONCLUSIONS ................... 117
11.1 CHALLENGES AND LESSONS ..................................................................................................... 117
11.2 RECOMMENDATIONS .................................................................................................................. 119
11.3 CONCLUSIONS ............................................................................................................................... 120

LIFETIME IMPACT AND COST OF CHILDHOOD OBESITY IN EUROPE (PART 2) 14
SUMMARY
BACKGROUND
Cohort Simulation Cohort Models were developed to estimate the lifetime impacts and costs attributable to childhood obesity/overweight as well as the effects of 1% and 5% reductions in mean childhood BMI in participating countries. Deliverable D4.6 “The Lifetime Impacts and Costs Of Childhood Obesity Overweight In Europe. Part 1” described the modelling methodology; the data and research requirements and the final results for Republic of Ireland and Northern Ireland.
During the JANPA WP4 , data was collated from six particpating countries (Croatia, Greece, Republic of Ireland, Italy, Romania and Slovenia) and Northern Ireland (with additional funding from safefood (www.safefood.eu)). Initial modelling was completed for the seven countries and finalised for the Republic of Ireland and Northern Ireland. At the date of publication, initial model outputs for Croatia, Greece, Italy, Romania and Slovenia were still under review. Portuguese data collation was suspended. Progress is summarised in the figure below.
Figure: JANPA WP4 status (30 November 2017 – end of JANPA)
COUNTRY DATA COLLATION
PRE-SIMULATION
DATA PROCESSING
SIMULATION MODELLING
POST-SIMULATION
REVIEW
REPORTING
CROATIA (HRV) GREECE (GRC) REPUBLIC OF
IRELAND (IRL) ITALY (ITA) NORTHERN IRELAND
(NIR) PORTUGAL (PTG) ROMANIA (ROM) SLOVENIA (SVN)
Finalised
In progress
This report, Deliverable D4.7 “The Lifetime Impacts And Costs Of Childhood Obesity
Overweight In Europe. Part 2”, describes
Collated data for the seven countries (Croatia, Greece, Republic of Ireland, Italy,
Northern Ireland, Romania and Slovenia);
The challenges encountered and lessons learnt during the post-simulation review
of the model outputs
Recommendations for future development of the JANPA costing model

LIFETIME IMPACT AND COST OF CHILDHOOD OBESITY IN EUROPE (PART 2) 15
CHALLENGES AND LESSONS
JANPA WP4 encountered a number of significance challenges a number of which only emerged
during the project. These challenges concerned both scientific issues (Conceptual challenges, Data
demands, Software implementation, Documentation) and organisational issues (Organisationally
complex, Challenging communications, Inadequately resourced).
RECOMMENDATIONS
Recommendations about modelling methodology and data and research requirements are included
in Deliverable D4.6.
With regard to the future development of the JANPA costing model we recommend sharing it with
the OECD so that its management and development can be incorporated in their ongoing project to
improve on the modelling capacity on the economics of prevention / public health.
This would include:
Conducting an independent scientific review of the JANPA costing model and how it was developed
Developing stand-alone dedicated software, written in open source code, to fully implement
the JANPA costing model and making it available to all researchers
Conducting a detailed sensitivity audit and validation of the JANPA costing model once the open source code is available
Deploying the JANPA costing model in all European countries for which good-quality data are available, building on the OECD economics of public health project, for the next two years (2018-2019) with a dedicated European budget. This would include the six countries for which data has already been collated (Croatia, Greece, Italy, Portugal, Romania and Slovania)
Organising a high-level European conference in 2020, for example at the European Parliament, to draw comprehensive conclusions based on these estimates.
Exploring the extension of the JANPA (childhood obesity/overweight) costing model to other childhood risk factors that have significant short term and long term consequences that are, in part, mediated through a similar adult risk factor. Early uptake of smoking and alcohol are two examples.

LIFETIME IMPACT AND COST OF CHILDHOOD OBESITY IN EUROPE (PART 2) 16
CONCLUSION
JANPA WP4 was a very ambitious project. It is the first lifetime costing study of childhood
obesity/overweight that developed and applied a standard modelling methodology in more than
one country. JANPA WP4 had eight participating countries.
JANPA WP4 encountered significant challenges but nevertheless established that reliable estimates
of the lifetime impacts and costs of childhood obesity/overweight could be obtained in more than
one country (see Deliverable D4.6). These estimates highlight the staggering human impact and
financial costs of childhood obesity/overweight and the substantial savings that could follow from a
modest change in mean childhood BMI.
The recommendations, incorporating the lessons learnt, plot a practical way of dealing with these
challenges. If implemented, the other valuable data that have been collated in all participating
countries during JANPA WP4 can be converted into reliable and meaningful estimates in those
countries as well as other EU countries.
Finally, the JANPA costing methodology is applicable to other childhood risk factors which,like
childhood obesity/overweight, have significant short term and long term consequences that are, in
part, mediated through a similar adult risk factor (like adult obesity/overweight). In particular,
the early uptake of alcohol or smoking has several conceptual similarities with childhood obesity.

LIFETIME IMPACT AND COST OF CHILDHOOD OBESITY IN EUROPE (PART 2) 17
1. INTRODUCTION
1.1 THE JANPA COSTING MODEL
The modelling objectives of JANPA WP4 were to:
1. Estimate the lifetime impacts and costs of childhood obesity/overweight in eight European countries
2. Describe how these impacts and costs are expected to occur over time. 3. Assess the effect of reducing the mean population childhood BMI by 1% and 5%.
Evidence reviews were used to develop the JANPA costing model based on a “closed cohort
simulation model (CCSM)” that can be deployed in a country to estimate the lifetime impacts and
costs (direct healthcare costs and societal costs) attributable to childhood obesity/overweight as
well as the effects of 1% and 5% reductions in mean childhood BMI.
A country’s Closed Cohort Simulation Model (CCSM) takes a cohort of virtual children representative of their childhood population in 2015; models their lifetime BMI trajectories using historical BMI data, and records the mortality and morbidity, the (direct) healthcare costs and societal costs they experience over their lifetimes as a result of their modelled BMI trajectories. A range of impacts-costs are recorded over a period of 90 years of follow-up from 2015 to 2105.
Figure: Closed Cohort Simulation Model (CCSM)

LIFETIME IMPACT AND COST OF CHILDHOOD OBESITY IN EUROPE (PART 2) 18
Six broad phases are required to deploy the JANPA costing model in a country:
1. Data Collation
2. Pre-modelling Data Processing
3. Simulation Modelling
4. Cost Estimation
5. Post-Modelling Review
6. Reporting.
Further details can be found in Deliverable D4.6.
1.2 PROJECT STATUS
Data was collated from six particpating countries (Croatia, Greece, Republic of Ireland, Italy, Romania and Slovenia) and Northern Ireland (with additional support from safefood (www.safefood.eu)). Portuguese data collation was not completed. Final results for Republic of Ireland and Northern Ireland were published in Deliverable D4.6. Initial modelling was completed for the remaining five countries but, at the date of publication, model outputs were withheld because of issues identified durung the Post-simulation reviews. Progress is summarised in the figure below
Figure: JANPA WP4 Project status (30 November 2017)
COUNTRY DATA COLLATION
PRE-SIMULATION
DATA PROCESSING
SIMULATION MODELLING
POST-SIMULATION
REVIEW
REPORTING
CROATIA (HRV) GREECE (GRC) REPUBLIC OF
IRELAND (IRL) ITALY (ITA) NORTHERN IRELAND
(NIR) PORTUGAL (PTG) ROMANIA (ROM) SLOVENIA (SVN)
Finalised
In progress

LIFETIME IMPACT AND COST OF CHILDHOOD OBESITY IN EUROPE (PART 2) 19
1.3 OUTLINE OF THIS DOCUMENT
Following an introduction to the JANPA WP4 (childhood obesity) costing model in Chapter 1:
Data and its documentation that relates to all participating countries is outlined in Chapter 2
Then, in Chapter 3 to Chapter 10, we present that data and its documentation that relates to
each of the particpating countries (Croatia, Greece, Republic of Ireland, Italy, Northern
Ireland, Portugal, Romania and Slovenia).
Finally, in Chapter 11 we give an overview of the challenges and lessons learnt during the
JANPA WP4 and make recommendations about any future development of the JANPA
(childhood obesity) costing models.
As we noted in Section 1.2, by the end of JANPA on 30 November 2017, the work in the particpating countries was at different stages. Consequently, only the data and their documentation that are finalised in each country are provided in a country’s chapter. The country chapters start with local context and evidence that supplements the international material in Deliverable D4.6. Data and its documentation for each country is categorised according to the phase of the workflow it relates to: 1) Data Collation, 2) Pre-modelling Data Processing, 3) Disease Modelling, 4) Cost Estimation, 5) Post-Modelling Review or 6) Reporting. Nearly all the data used in the JANPA costing model are aggregated and collected from public sources. However, when the data was requested we did not indicate that it would be made availbale on-line. Since most models were still under review at the end of JANPA on 30 November 2017, a country’s data could be made available, with the country’s permission, on-line on the JANPA website (www.janpa.eu ).

LIFETIME IMPACT AND COST OF CHILDHOOD OBESITY IN EUROPE (PART 2) 20
2. GLOBAL DATA DOCUMENTATION
This chapter includes some details of some of the initial simulation models that are still being
reviewed in the post-simulation review phase.
In existing UKHF software, all country models have an initial cohort has 20,000,000 virtual
individuals. THis was not changed for the JANPA costing model.
The table below gives survivorship (sourced from initial Model Output Workbooks).
Table 2.1 Percentage of original cohort of children alive at the end of 2105 and after 91 years
follow up (Initial models under review) except Republic of Ireland and Northern Ireland)
Sex
In initial cohort (2015)
Alive at end of
2105 % alive at end of 2105
IRL Male 10219024 288927 2.83%
Female 9780976 683861 6.99%
Persons 20000000 972788 4.86%
NIR Male 10262464 463102 4.51%
Female 9737536 751491 7.72%
Persons 20000000 1214593 6.07%
SVN Male 10294365 476131 4.63%
Female 9705635 893294 9.20%
Persons 20000000 1369425 6.85%
ROM Male 10294693 339901 3.30%
Female 9705307 479081 4.94%
Persons 20000000 818982 4.09%
ITA Male 10295105 483127 4.69%
Female 9704895 1122650 11.57%
Persons 20000000 1605777 8.03%
GRC Male 10239415 143414 1.40%
Female 9760585 560275 5.74%
Persons 20000000 703689 3.52%
CRO Male 10277810 1218507 11.86%
Female 9722190 2024528 20.82%
Persons 20000000 3243035 16.22%

LIFETIME IMPACT AND COST OF CHILDHOOD OBESITY IN EUROPE (PART 2) 21
These surviving individuals are aged between 91 years and 108 years at the end of 2015. Of concern,
particularly in Croatia (CRO), Italy (ITA), and Slovenia (SVN), are the very large percentage of
individuals, (particularly females) who are alive after 91 years follow-up. These country models were
under review when the JANPA project ended.

LIFETIME IMPACT AND COST OF CHILDHOOD OBESITY IN EUROPE (PART 2) 22
3. CROATIA
3.1 LOCAL CONTEXT
In Croatia, The Ministry of Health is responsible for planning and evaluation, public health
programmes, and the regulation of capital investments in health care providers in public ownership.
In addition, one of their tasks is creating and maintaining links with other ministries and sectors
concerning all health-related issues.
Croatian health system does not function exclusively according to one financing model. It is the
combination of the Bismarck model (based on the social insurance i.e. contributions that the citizens
pay out of their salaries), and the Beveridge model (based on budget revenue), all because of the
revenue deficit as per Beveridge financing model exclusively.
The Croatian Health Insurance Fund (HZZO) is the sole insurer in the mandatory health insurance
system, which provides universal health insurance coverage to the whole population. In accordance
with the European Directive on Cross-Border Healthcare (Directive 2011/21/EU), HZZO was
appointed by the Ministry of Health as National Contact Point, in charge of providing information on
the rights of insured persons to the healthcare in another Member State, all in accordance with
European Union Regulations. HZZO provides both mandatory and voluntary health insurance.
Mandatory insurance is social insurance which means that it is in its biggest part financed through a
special tax on employees’ salaries (15% contribution), and it enables the universal use of health
services for all categories of population, under equal conditions. Every citizen of the Republic of
Croatia and foreigners with approved permanent residence are obliged to apply for mandatory
health insurance. Mandatory health insurance covers the following: primary health care, specialist-
consiliary healthcare, hospital healthcare, medicines defined by the HZZO list of medicines, right to
prosthodontic help and prosthodontic substitutes and other aids, right to healthcare abroad (under
certain conditions), right in case of injury at work or occupational disease, salary compensation
during the time of temporary inability to work (sick leave), compensation of transportation costs in
relation to the realization of the right to healthcare, maternity and parental supports. Voluntary
health insurance can be supplemental, additional or private. Supplemental health insurance is
provided by HZZO and by other registered insurance companies. Along with supplemental health
insurance, those companies can also provide additional and private health insurance and certain
rights that are not covered by mandatory health insurance. After the accession of Croatia to the
European Union, Croatian citizens got a wider spectrum of possibilities for treatment in EU Member
States. A universal price of supplemental insurance policy for all population categories has been
introduced, thus making the HZZO supplemental insurance more accessible to its insurants.
MAIN POLICIES:
The main policy regarding health is the Health Care Act (Official Gazette No. 150/08, 155/09, 71/10,
139/10, 22/11, 84/11, 154/11 - Uredba, 12/12, 35/12 - odluka Ustavnog suda RH, 70/12, 144/12 -
Uredba, 82/13, 159/13, 22/14 - odluka Ustavnog suda RH, 154/14, 70/16 - Uredba) 2012. This Act
regulates the principles of health care organization, the rights and obligations of health care users,

LIFETIME IMPACT AND COST OF CHILDHOOD OBESITY IN EUROPE (PART 2) 23
types and responsibilities of health care institutions (at various levels of care) and establishes the
principles of monitoring of health care institutions. Public health activities for the protection and
improvement of health, disease prevention, early detection, timely treatment, medical care and
rehabilitation. Public health activities are also defined by this Act. Main carrier and the coordinator
of public health activities at the national level is the Croatian Institute of Public Health, while county
level activities are coordinated and implemented by County Public Health Institutes.
The Mandatory Health Insurance Act of Foreigners (Offical Gazette No. 80/13, 15/18) 2013 regulates
the scope of the right to health care and other rights and obligations of persons insured under the
MHI scheme, supervision, financing, organization, and tasks of the HZZO and the conclusion of
contracts between the HZZO and health care providers and suppliers of medical goods.
Measures of Health Care (Official Gazette 126/2006) represent a set of measures to preserve and
improve health of every member of the community.
The provision and financing of services are largely public, although private providers and insurers
also operate in the health sector. Provision of health care services in specific areas of care is
regulated in separate legal acts. The key acts include: the Medical Practice Act, the Pharmacy Act,
the Nursing Act and the Dental Care Act (all in force since 2003 with amendments in 2008 and/or
2013); the Midwifery Act of 2008; the Physical Therapy Activities Act of 2008; and the Act on the
Health Care Technical Services of 2009. The quality of health care services is regulated in the Act on
Quality of Health and Social Care of 2011 and the provision of voluntary health insurance by the
Voluntary Health Insurance Act of 2006 (with amendments in 2008 and 2010).
STRATEGIES:
National Health Care Strategy 2012-2020 (Official Gazette 116/12). The fundamental framework of
the National Health Care Strategy 2012 – 2020 is formed by the Health Care Act. As the main
document directing development in the future period, the Strategy makes the basis for bringing
policies and decisions in health care, including decisions on distribution of budgetary funds in the
health care sector. It forms a basis for drawing up new planning and operative documents, as well as
for evaluating and revising the existing ones that elaborate development measures and concrete
activities in individual health care segments (e.g. human resources, hospital system, palliative care,
public health etc.).
The Strategic Plan for Public Health Development 2013-2015 is an integral part of the National
Strategy for Health Care 2012-2020 and the umbrella document of the Public Health of the Republic
of Croatia defining the development priorities, objectives, activities and responsibilities of the
relevant partners. New Strategic Plan for the period 2017-2020 in currently being developed.
ACTION PLANS:
Action Plan for the Prevention and Control of Noncommunicable Diseases 2015-2020 issued by the
Ministry of Health is based on a series of international and Croatian strategic documents on
prevention of chronic non-communicable diseases.

LIFETIME IMPACT AND COST OF CHILDHOOD OBESITY IN EUROPE (PART 2) 24
PUBLIC HEALTH PROGRAMMES:
National health promotion programme “Living Healthy” administered by the Ministry of Health and
the Croatian Institute of Public Health and County Public Health Institutes has a goal to inform,
educate and raise awareness among the citizens of the Republic of Croatia of all ages on positive
aspects of healthy lifestyles – healthy nutrition, physical activity, obesity prevention, decreasing
overweight, decreasing morbidity from chronic non-communicable (cardiovascular diseases,
tumours, type 2 diabetes, chronic obstructive pulmonary disease, mental illness), promotion of
physical, sexual and reproductive, and mental health. Due to its comprehensiveness, “Living
Healthy” is composed of five components, Health Education, Health and Physical Activity, Health and
Nutrition, Health and the Workplace, and Health and the Environment. In the implementation of this
National Programme intersectorial bodies, government authorities and other institutions also take
part.
School Fruit and Vegetables Scheme aims to increase the consumption of fruit and vegetables and
decrease the consumption of food rich in trans-fatty acids, sugar and salt at school to encourage
healthier eating habits, in the context of declining consumption of fresh fruit and vegetables and
increasing incidence of child obesity.
The School Milk Scheme is intended to encourage consumption of dairy products among school-
children.
National Cancer Screening Programmes administered by the Ministry of Health and the Croatian
Institute of Public Health and County Public Health Institutes aims at early detection of cancer. The
aim of preventive screening programmes is early detection, and reduction in morbidity and mortality
of colon, cervical and breast cancer, improvement in the quality of life and the health of the entire
Croatian population.
3.2 LOCAL EVIDENCE
We give a summary of the four systematic reviews (conducted by the Croatian Team with additional
support for safefood) along with local materials provided by the Croatian Team in the “Local
Materials Survey”
3.2.1 Childhood Obesity / Overweight
Information on the prevalence of overweight and obesity in Croatia was found in eight sources.
Three are considered here. Sample sizes are generally small and samples are not nationally
representative. A study of children aged 3 to 7 in Osijek conducted in 2011 (Farkas et al., 2015)
estimated that about 24% of boys and 16% of girls were overweight or obese (WHO cut-points).
Among children aged 6-7 from a small nationally representative sample surveyed in 2003-2004,
about 22% of boys and 20% of girls were overweight or obese (Juresa et al., 2012). In Zagreb, a
survey of adolescents aged 15 to 19 resulted in estimates of overweight and obesity of 23% among
boys and 13% among girls (Petranowic et al., 2014). Croatia collected data for COSI for the first time
in the autumn of 2015; these results are not yet published.

LIFETIME IMPACT AND COST OF CHILDHOOD OBESITY IN EUROPE (PART 2) 25
3.2.2 Childhood Impacts
Nine papers from Croatia examined health impacts of overweight/obesity during childhood. Two of
these examined trends in the incidence of type 1 diabetes in children. Stipancic et al. (2008)
estimated a 9% average annual increase in incidence for the period 1995-2003, while Putarek et al.
(2015) estimated a 6% average annual increase from 2004-2012. While not empirically linked to
rates of overweight or obesity, they nonetheless show a worrying trend.
Two papers examined cardio-metabolic risk factors. Ille et al. (2012) found, in a sample of children
and adolescents, all with BMI > 90th percentile, that 10.4% had impaired glucose tolerance, 17.3%
had increase cholesterol, and 30.1% had elevated triglyceride levels. Musil et al. (2012) reported
significant associations between raised blood pressure and overweight/obesity among 8th grade
adolescents.
A further three sources examined associations between BMI and musculo-skeletal/motor and
aerobic function. Delas et al. (2008) tested adolescents (mean age 13 years) on speed, power,
reaction time and balance. Among overweight/obese boys tested, motor performance was
significantly lower on all tests than healthy weight boys except balance, while in girls, only lower leg
repetitive movement was significantly lower. Bozanic et al. (2011) reported lower performance on
tests of speed and agility among overweight and obese 7 year-old children of both sexes compared
to healthy weight children. Kunjesic et al. (2015) found that higher BMI was significantly associated
with lower aerobic capacity among children aged 7 to 11 years.
Croatia is the only country for which information was located on two further areas – idiopathic
intracranial hypertension (IIH), and hormonal/reproductive health. In a clinical sample of children
(mean age 10.7 years), Sindicic Dessardo et al. (2010) reported that 75% of children suffering from
IIH were overweight or obese. Bralic et al. (2012) reported a significant association between early
onset of menarche and overweight/obesity3.
3.2.3 Inequalities
Five studies on inequalities were found for Croatia. Two of these confirmed associations between
parental and child BMI (Bralic et al., 2005; Petricevic et al., 2012), a further two indicated the
protective effects of breastfeeding (Mandic et al. 2011; Skledar & Milosevic, 2015), and the fifth
found a higher prevalence of overweight and obesity in children of lower birth order, and in families
with fewer children and lower levels of parental education (Juresa et al., 2012).
3.3 DATA DOCUMENTATION
Phase 1: Data Collation
3 Early onset of menstruation is a risk factor for breast cancer (Collaborative Group on Hormonal Factors in Breast Cancer,
2012).

LIFETIME IMPACT AND COST OF CHILDHOOD OBESITY IN EUROPE (PART 2) 26
20171130 Phase 1 (Croatia) Data Calculations (1).xlsx
20171130 Phase 1 (Croatia) Data Calculations (2).xlsx
20171130 Phase 1 (Croatia) Data Collation Workbook.xlsx
20171130 Phase 1 (Croatia) Data Sources.xlsx
Phase 2: Pre-simulation Data Processing
20171130 Phase 2 (Croatia) Data Documentation (Part 1).xlsx
20171130 Phase 2 (Croatia) Data Documentation (Part 2).docx
Phase 3: Simulation Modelling
Phase 4: Cost Estimation
Phase 5: Post Simulation Review
20171130 Phase 5 (Croatia) Model Outputs Workbook - DISC.xlsm
20171130 Phase 5 (Croatia) Model Outputs Workbook - UNDISC.xlsm
Table. Phase 1: Croatian Disease Data Quality Scores
1 2 3 4 5 6
No acceptable
data
Must be
estimated
from other
data1
International
proxy
"Approximate"
data only2
Not
applicable
(non-fatal
disease)
Acceptable
data
1. For disease parameters: prevalence, incidence, survival mortality)
2. "Approximate" data only:
ICD code mismatch
Hospital data used for prevalence or incidence
Self-reported BMI
Regional (sub-national) data

LIFETIME IMPACT AND COST OF CHILDHOOD OBESITY IN EUROPE (PART 2) 27
Adult diseases
Disease Mortality Incidence Survival Prevalence
Oesophageal
Cancer
Croatian Bureau
of Statistics Globocan
Eurocare 5
Database Globocan
Colorectal
Cancer
Croatian Bureau
of Statistics
C18 to C21
Globocan
Eurocare 5
Database
C18 to C21
Globocan
Liver Cancer
Croatian Bureau
of Statistics
C22
Globocan
Eurocare 5
Database
C22
Globocan
Gallbladder
Cancer
Croatian Bureau
of Statistics
C23 to C24
Globocan
Eurocare 5
Database Globocan
Pancreatic
cancer
Croatian Bureau
of Statistics Globocan
Eurocare 5
Database Globocan
Cancer-Breast,
post-
menopausal
(females only
aged 50+)
Croatian Bureau
of Statistics Globocan
Eurocare 5
Database Globocan
Endometrial
cancer
Croatian Bureau
of Statistics
C54
Globocan
C54
Eurocare 5
Database
C54
Globocan
Ovarian
Cancer
Croatian Bureau
of Statistics Globocan
Eurocare 5
Database Globocan
Prostate
cancer (males
only)
Croatian Bureau
of Statistics Globocan
Eurocare 5
Database Globocan
Kidney Cancer
Croatian Bureau
of Statistics
C64 to C66
Globocan
Eurocare 5
Database Globocan
Urothelial
Cancer (males
only)
Croatian Bureau
of Statistics Globocan
Eurocare 5
Database Globocan
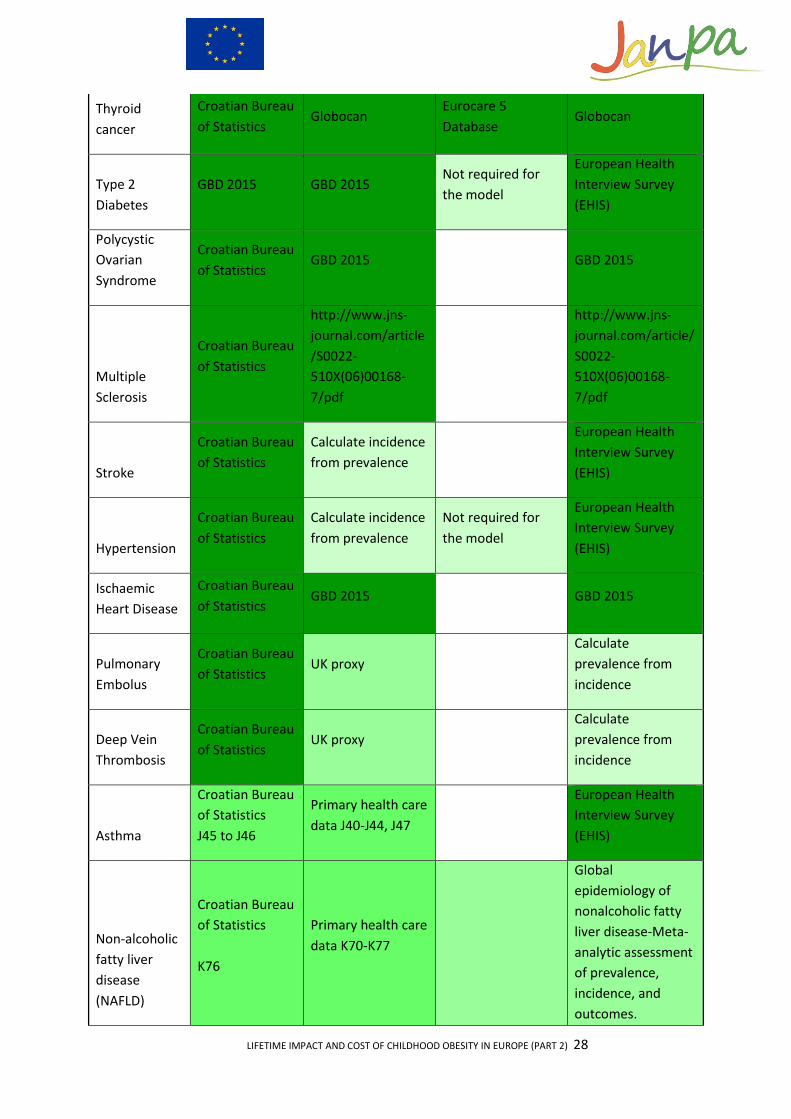
LIFETIME IMPACT AND COST OF CHILDHOOD OBESITY IN EUROPE (PART 2) 28
Thyroid
cancer
Croatian Bureau
of Statistics Globocan
Eurocare 5
Database Globocan
Type 2
Diabetes
GBD 2015 GBD 2015 Not required for
the model
European Health
Interview Survey
(EHIS)
Polycystic
Ovarian
Syndrome
Croatian Bureau
of Statistics GBD 2015 GBD 2015
Multiple
Sclerosis
Croatian Bureau
of Statistics
http://www.jns-
journal.com/article
/S0022-
510X(06)00168-
7/pdf
http://www.jns-
journal.com/article/
S0022-
510X(06)00168-
7/pdf
Stroke
Croatian Bureau
of Statistics
Calculate incidence
from prevalence
European Health
Interview Survey
(EHIS)
Hypertension
Croatian Bureau
of Statistics
Calculate incidence
from prevalence
Not required for
the model
European Health
Interview Survey
(EHIS)
Ischaemic
Heart Disease
Croatian Bureau
of Statistics GBD 2015 GBD 2015
Pulmonary
Embolus
Croatian Bureau
of Statistics UK proxy
Calculate
prevalence from
incidence
Deep Vein
Thrombosis
Croatian Bureau
of Statistics UK proxy
Calculate
prevalence from
incidence
Asthma
Croatian Bureau
of Statistics
J45 to J46
Primary health care
data J40-J44, J47
European Health
Interview Survey
(EHIS)
Non-alcoholic
fatty liver
disease
(NAFLD)
Croatian Bureau
of Statistics
K76
Primary health care
data K70-K77
Global
epidemiology of
nonalcoholic fatty
liver disease-Meta-
analytic assessment
of prevalence,
incidence, and
outcomes.

LIFETIME IMPACT AND COST OF CHILDHOOD OBESITY IN EUROPE (PART 2) 29
https://www.ncbi.nl
m.nih.gov/pubmed/
26707365
Gallbladder
Disease
Croatian Bureau
of Statistics
K80, K81, K85
Hospital discharge
data GBD 2015
Psoriasis
Croatian Bureau
of Statistics
https://www.ncbi.n
lm.nih.gov/pubme
d/2609862
https://goo.gl/xzCS
kd
GBD 2015
Gout
Croatian Bureau
of Statistics
M10
Primary health care
data M05-M14
zero deaths - so
assume prob
survival = 1
http://www.tandfo
nline.com/doi/pdf/
10.3109/02813432.
2015.1132886?nee
dAccess=true
Osteoarthritis
–
Gonarthrosis
Knee Pain
Croatian Bureau
of Statistics
M17
Primary health care
data M15-M19
zero deaths - so
assume prob
survival = 1
GBD 2015
Chronic Back
Pain
Croatian Bureau
of Statistics
M54
Primary health care
data M50-M54
zero deaths - so
assume prob
survival = 1
European Health
Interview Survey
(EHIS)
Hypertension
in pregnancy
Croatian Bureau
of Statistics
Primary health care
data O13-O14
zero deaths - so
assume prob
survival = 1
Childhood diseases
Diseases Mortality Incidence Survival Prevalence
Wheezing disorders
ISAAC study http://erj.ersjournals.com/content/38/S

LIFETIME IMPACT AND COST OF CHILDHOOD OBESITY IN EUROPE (PART 2) 30
uppl_55/p4132
Metabolic syndrome
https://www.hindawi.com/journals/ije/2016/1823561/
Hyperlipidemia
Depression Slovenia proxy - using pharma data??
Musculoskeletal pain
Primary health care data M50 - M54
Obstructive sleep apnoea
proxy https://www.ncbi.nlm.nih.gov/pmc/articles/PMC3004499/#B8
High blood pressure
Not required for the model
Not required for the model
CRO-KOP study http://www.collantropol.hr/antropo/article/view/459/164
Type 2 diabetes
Not required for the model
Primary health care data E10-E14
Not required for the model
Asthma Croatian Bureau of Statistics
Primary health care data - Bronchitis, emphysema, asthma and other chronic obstructive pulmonary disease (J40-J44, J47)
ISAAC study http://erj.ersjournals.com/content/38/Suppl_55/p4132
Non-alcoholic fatty liver disease
Croatian Bureau of Statistics
Primary health care data K70-K77
http://bmcpediatr.biomedcentral.com/articles/10.1186/1471-2431-13-40
3.4 DATA
Phase 1: Data Collation
20171130 Phase 1 (Croatia) Data Collation Workbook.xlsx
Phase 2: Pre-simulation Data Processing
Data not available (see Data Documentation files)
Phase 3 and 4: Simulation Modelling and Cost Estimation

LIFETIME IMPACT AND COST OF CHILDHOOD OBESITY IN EUROPE (PART 2) 31
20171130 Phase 3&4 (Croatia) Initial Model Output Workbook.xlsx
Phase 5: Post Simulation Review
20171130 Phase 5 (Croatia) Initial Resturctured Model Output Workbook.xlsx
20171130 Phase 5 (Croatia) Initial Core tables and Graphs Workbook.xlsx
Phase 6: Reporting
20171130 (Croatia) Final Restructured Model Output Workbook.xlsx
20171130 (Croatia) Final Combined Model Outputs SAS Dataset.ssd
20171130 (Croatia) Final Combined Model Outputs Worksheet.xlsx
20171130 (Croatia) Final Core Tables and Graphs Workbook.xlsx
UNDISCOUNTED and DISCOUNTED versions of thesae data files are available .
As a result of the feedback loops include in the workflow, the software was sometimes rerun with
corrected inputs. Only the final model outputs from the simulation software are listed.
CROATIAN REFERENCES
Bozanic, A., Beic, J., & Mumanovic, D. (2011). “OVERWEIGHT AND OBESITY AS LIMITATION FACTORS OF AGILITY AND STRENGTH DEVELOPMENT.” Proceedings of the 6
th International Scientific Conference on
Kinesiology Zagreb, September, pp. 207-210.
Bralic, I., Tahirovic, H., Matanic, D., Vrdoljak, O., Stojanovic-Spehar, S., Kovacic, V., & Blazekovic-Milakovic, S. (2012). “Association of early menarche age and overweight/obesity.” Journal of Pediatric Endocrinology and Metabolism 25(1-2): 57-62.
Bralic, I., Vrdoljak, J., & Kovacic, V. (2005). “Associations between parental and child overweight and obesity.” Collegium Antropologicum 29: 481-486.
Delas, N., Tudor, A., Ruzic, L., & Sestan, B. (2008). “Obesity indicators and athletic performance in 11-15 year-old children.” Hrvatski Športskomedicinski Vjesnik 23(1): 35-44.
Farkas, D., Tomak, Z., Petric, D., & Novac, D. (2015). “Anthropometric characteristics and obesity indicators among preschool children in an urban area in Croatia.” Graduate Journal of Sport, Exercise & Physical Education Research 3: 13-27.
Ille, J., Furic-Cunko, V., Cigrovski, A, Bogdanic, A., Rojnic Putarek, N., Radica, A., & Dumic, M. (2012). “Incidence of glucose and lipid metabolism disorders in overweight children and adolescents in Croatia.” Endocrine Abstracts 29: 1269.
Juresa, V., Musil, V., Majer, M., Ivankovic, D., & Petrovic, D. (2012). “Behavioral Pattern of Overweight and Obese School Children.” Collegium Antropolicum 36 Suppl 1: 139-146.
Kunjesic, M., Badric, M., & Prskalo, I. (2015). “RELATIONS BETWEEN OBESITY INDICATORS AND AEROBIC CAPACITY OF PUPILS.” Sport SPA 12(1): 17-24.
Mandic, Z., Piricki, A.P., Kenjeric, D., Hanicar, B., & Tansic, I. (2011). “Breast vs. bottle: differences in the growth of Croatian infants.” Maternal & Child Nutrition 7: 389-396.
Musil, V., Majer, M., & Juresa, V. (2012). “Elevated Blood Pressure in School Children and Adolescents –
Prevalence and Associated Risk Factors.” Collegium Antropologicum 36 Suppl 1: 147-155.

LIFETIME IMPACT AND COST OF CHILDHOOD OBESITY IN EUROPE (PART 2) 32
Petranovic, M.Z., Thomas, Z., Narancic, N.S., Skaric-Juric, T., Vecek, A., & Milicic, J. (2014). “A six decades long
follow-up on body size in adolescents from Zagreb, Croatia (1951-2010).” Economics & Human Biology 13: 155-
164.
Petricevic, N., Puharic, Z., Posavic, M., Simetin, I.P., & Franelic, I.P. (2012). “Family history and parental recognition of overweight in Croatian children.” European Journal of Pediatrics 171: 1209-1214.
Putarek, N.R., Ille, J., Uroic, A.S., Skrabic, V., Stipancic, G., Krnic, N., Radica, A., Marjanac, I., Severinski, S., Svigir, A., Bogdanic, A., & Dumic, M. (2015). “Incidence of type 1 diabetes mellitus in 0 to 14-yr-old children in Croatia – 2004 to 2012 study.” Pediatric Diabetes 16: 448-453.
Sindicic Dessardo, N., Dessardo, S., Sasso, N., Sarunic, A.C., & Dezulovic, M.S. (2010). “Pediatric Idiopathic Intracranial Hypertension: Clinical and Demographic Features.” Collegium Antropologicum 34 Suppl 2: 217-221.
Skledar, M.T., & Milosevic, M. (2015). “BREASTFEEDING AND TIME OF COMPLEMENTARY FOOD INTRODUCTION AS PREDICTORS OF OBESITY IN CHILDREN.” Central European Journal of Public Health 23: 26-31.
Stipancic, G., La Grasta Sabolic, L., Malencia, M., Radica, A., Skrabic, V., & Tiljak, M.K. (2008). “Incidence and trends of childhood Type 1 diabetes in Croatia from 1995 to 2003.” Diabetes Research & Clinical Practice 80: 122-127.

LIFETIME IMPACT AND COST OF CHILDHOOD OBESITY IN EUROPE (PART 2) 33
4. GREECE
4.1 LOCAL CONTEXT
Main policies
- School food policy (mandatory) - Physical activity in kindergartens and schools (mandatory) - Restrict marketing and advertising in school canteens.
The Greek school canteen policy aims to protect and promote health of the sensitive student
population by creating a supportive school environment that promotes healthy eating. The
policy clearly defines the food and drink list allowed to be sold and served by the school
canteens, whereas marketing or advertising of products not listed above in the school canteens
is prohibited.
Main strategies
- To create a national program aiming to promote healthy eating and lifestyle in schools and halt childhood obesity increase, in collaboration with all Ministries. The national program will be based and will use the experience and the results collected from previous projects .It will also use the educational material that has been produced by the ministry of health and the ministry of education.
- To promote the collaboration of different health professionals, such as doctors, nutritionists, psychologists and physical activity trainers in prevention and treatment programs, in order to result in more trustworthy results.
Main action plans
- The EU Action Plan on Childhood Obesity 2014-2020 - The European Food and Nutrition Action Plan 2015-2020 - Physical activity strategy for the WHO European Region 2016-2025 - Promote breastfeeding (WHO baby-friendly hospitals) - The Ministries are sensitive regarding the childhood obesity epidemic, therefore they co-
fund projects related to the prevention or reduction of childhood obesity with the EU. Examples of some projects are the following.
o The Ministry of Health supports Rhea mother-child cohort, o The Ministry of Rural Development and Food supports EU School Milk Programme
and EU School Fruit Scheme o The Ministry of Education, Research and Religious Affairs supports Kids’ Athletics
and EU School Fruit Scheme o The Ministry of Culture and Sports supports the program:” Be active.”

LIFETIME IMPACT AND COST OF CHILDHOOD OBESITY IN EUROPE (PART 2) 34
Main public health programs for childhood obesity
- ADONUT study; from 2010 to 2012 measuring children aged 12-18 years, assessing overweight and obesity and nutritional status.
- COSI study; Greece firstly participated in the 2009/2010 round until today measuring children aged 7 and 9 years old every 3 years.
- GRECO study; in 2009 measuring children aged 10-12 years, assessing overweight and obesity and nutritional status.
- Vyronas study; from 2004 to 2005 measuring children aged 12-17 years, assessing overweight and obesity and nutritional status.
- FETA project; from 2011 to 2014 measuring children aged 12-18 years, assessing overweight and obesity and nutritional status.
- National Epidemiological Survey; from 2010 to 2012 measuring children aged 6 to 12 years assessing overweight and obesity ,clinical and nutritional status.
Main public health programs for adult obesity.
- EHIS; in 2014 measuring people above 18 years old, assessing overweight and obesity and clinical and nutritional status.
- ATTICA; from 2001 to 2002, participants above 20 years old, assessing overweight and obesity and nutritional status.
- HYDRIA; from 2012 to 2014, participants above 18 years old, assessing overweight and obesity and nutritional status.
Main public bodies involved in health promotion and prevention issues
- The Hellenic Ministry of Health is the main policy-making authority. It decides on health policy issues and national health strategies, sets priorities, determines the funding for activities, and allocates resources, while it proposes legislative changes and undertakes the implementation of laws and/or reforms.
- The Directorate for Nutrition, the Department for Nutrition Policy has responsibilities such as:
o Development of regular reports with data about nutrition and nutrition-related diseases (e.g. prevalence data on obesity and diabetes).
o Development of national nutrition policy, as well as dietary guidelines and patterns for the population in Greece.
- The Department for Actions on Nutrition Issues has responsibilities such as: o Determining standards for food provided in school canteens, in collaboration with
other organisations. o Planning, implementing and overseeing prevention programmes concerning
nutrition. - The seven Health Region Administrations (YPEs) are responsible for implementing national
priorities at the regional level, coordinating regional activities and organising and managing the delivery of health and welfare services.
- The National Council for Public Health (ESYDY) is an independent authority consisting of experts in epidemiology, health promotion and public health, and is responsible for the scientific supervision and coordination of public health organisations for the monitoring and promotion of the health of the population.

LIFETIME IMPACT AND COST OF CHILDHOOD OBESITY IN EUROPE (PART 2) 35
- The National Organization for Health Care Services Provision (EOPYY) is a public corporate body which provides health services to insured active members and pensioners, as well as their family dependents.
- At the prefectural level, public health directorates of the Prefectural Authorities include health prevention and promotion departments, with competences such as the implementation of immunization and preventive medicine programmes, the implementation of programmes to protect mothers and children, the implementation of programmes for chronic ailments and illnesses not easily susceptible to treatment, as well as health education activities.
- Health centres provide services which include prevention (mainly immunization) and health promotion.
- Municipalities are responsible for running several public health programmes and for the provision of primary health care services and health prevention and promotion programmes (e.g. services in the municipal health clinics, the open care centres (KAPIs) and the programme “Home Assistance” for the elderly).
- The Centre for the Control and Prevention of Diseases (KEELPNO) is responsible for the control of communicable diseases and HIV/AIDS.
- The Institute of Child Health (IYP) is responsible for research, educational and preventive activities relating to children.
- The National Centre for Diabetes Mellitus (EKEDI) is responsible for the monitoring and coordination of research, prevention and treatment of diabetes mellitus.
- The Hellenic Food Authority (EFET) is the main body responsible for inspection of foodstuffs in Greece.
- The purpose of the National School of Public Health (ESDY) is to offer postgraduate and further education to graduates of universities and technical colleges, to carry out scientific research and to provide services related to public health, health promotion, health service administration and social policy.
Other organisations involved in health promotion and prevention issues
- Institute of Preventive Medicine, Environmental and Occupational Health Prolepsis - National Network of Health Promoting Hospitals (HPH) - National Network of Healthy Municipalities Cities - Health Promotion - Hellenic Medical Association for Obesity - Hellenic Dietetics Association - Dietitians & Nutritionists Association of Greece - Hellenic Society for Clinical Nutrition and Metabolism - Hellenic Foundation of Gastroenterology and Nutrition - Hellenic Heart Foundation - Hellenic Cardiology Foundation - Hellenic Society of Internal Medicine - Hellenic Endocrine Society - Hellenic Paediatric Association - Paediatric Association of Northern Greece - Internal Medicine Society of Northern Greece - Atherosclerosis Society of Northern Greece - Hellenic Diabetes Association - Northern Greece Diabetes Association - Hellenic Society of Lipidology and Atherosclerosis - Hellenic Society for the Study of Obesity, Metabolism and Nutrition Disorders - IBFAN Greece

LIFETIME IMPACT AND COST OF CHILDHOOD OBESITY IN EUROPE (PART 2) 36
- Child Health Institution
4.2 LOCAL EVIDENCE
4.2.1 Childhood Obesity / Overweight
Local materials from Greece resulted in 34 published sets of prevalence estimates since 2000. Four
are considered here. A systematic review by Kotanidou et al. (2013) identified 25 papers (covering
31 studies) that assessed prevalence of overweight and obesity in children aged 1 to 12 (using IOTF
cut-points, surveys conducted between 2004 and 2010). Meta-analysis indicated that 10.2% (CI95%:
9.8-10.7%) of Greek children were obese, 23.7% (CI95%: 22.7-24.8%) were overweight and the
combined prevalence of overweight and obesity was approximately 34% (CI95%: 32.7-35.3%).
Analysis by gender showed that 11.0% of boys and 9.7% of girls were obese, while 24.1% of boys and
23.2% of girls were overweight.
Among children aged 1 to 5 (from five regions in Greece surveyed in 2003-2004; Manios et al., 2007),
about 19% of boys and 24% of girls were overweight or obese. A survey conducted six years later
(2009-2010) in pre-schoolers of same age in the city of Thessaloniki, identified 22% boys and 20%
girls as overweight or obese ( Hassapidou et al, 2015).In a nationally representative sample of 8 and
9 year-olds (surveyed in 2007; Tambalis, 2010), similar percentages of boys (39%) and girls (38%)
aged 8 to 9 were overweight or obese. These results are similar to those reported for round 2 of
COSI (ages 7 and 9; Wijnhoven et al., 2014a)4. Among adolescents, a first representative panhellenic
study conducted in 2003 (Tzotzas et al, 2008) showed that 29% of boys and 17% of girls aged 13 to
19 were overweight or obese. A second nationally representative survey in 2010-2012
(Grammatikopoulou et al., 2014), demonstrated increasing prevalence: 37 % of boys and 25% of girls
were overweight or obese.In this study, rates of overweight and obesity in adolescents were highest
at ages 12-14, but among adolescents at all ages, they exceeded 33% in boys and 20% in girls5.
Trends
Five sources examining trends in prevalence were located for Greece (Papadimitriou et al., 2006;
Tambalis et al., 2010; Roditis et al., 2009; Kotanidou et al., 2013; Kleanthous et al., 2016; the
narrative review by Roditis et al. is not considered in detail here). One of these sources (Kotanidou et
al., 2013) is a systematic review of prevalence in children 1 to 12 , which indicated, on the basis of 25
papers (31 sets of estimates, all using the IOTF cut-points), that increases in prevalence between
2001-2003 have been followed by a period of stabilisation from 2003-2010. The results of analyses
by Tambalis et al. (2010), which examined trends in overweight and obesity among 8 and 9 year-old
children from nationally representative surveys conducted annually between 1997 and 2007 are
partially consistent with those of Kotanidou et al. (2013). Tambalis et al. (2010) reported a
stabilising in prevalence of obesity (IOTF cut-points) among both boys (at around 12.2-12.3%) and
girls (around 11.2-11.3%) from 2004 to 2007. However, prevalence of overweight showed an
4 Results for round 3 of COSI are not yet published for Greece. 5 This study also included estimates of abdominal obesity (using cut-points of the International Diabetes Federation, IDF). Across all adolescents, about 9% of boys and 9% of girls were classified as being abdominally obese. Rates of abdominal obesity peaked in boys at age 13 and in girls at age 12, thereafter showing small declines with increasing age.

LIFETIME IMPACT AND COST OF CHILDHOOD OBESITY IN EUROPE (PART 2) 37
increasing trend during the same time period (from 21.2% to 26.5% in boys and 22.1% to 26.7% in
girls).
Trends in the Attica region have been examined in two papers. Papadimitriou et al. (2006) reported
increases in the prevalence of overweight and obesity among children aged 6 to 11 between 1994
and 2005, but these were not statistically significant. Kleanthous et al. (2016) compared the
prevalence of overweight and obesity among children in Grades 1, 4, 7 and 10 in 2009 and 2012
(using the IOTF criteria) and found that rates of overweight and obesity declined significantly in both
boys and girls over the 2.5 year time period.
In summary, trends in the prevalence of child overweight and obesity in Greece show rapid increases
in both children and adolescents during the 1990s and early 2000s, followed by a slowing down of
increases in prevalence, and some evidence of stabilisation in young children but not in adolescents,
since around 2004.
Limitations of this report are the heterogeneity of the studies included and their cross-sectional
design, making difficult to accurately determine secular trends in the prevalence of childhood
obesity in Greece. Moreover, the data on predisposing factors does not enable us to draw
conclusions on possible causes. Finally, it would be urgent to investigate whether the current
financial crisis in Greece has a deteriorating or a protective effect in the obesity prevalence.
4.2.2 Childhood Impacts
The following paragraph deals with associated (or predisposing) factors for obesity and not with
impacts; it has to be placed into the previous chapter, just after the Trends paragraph.
Associated factors
Twenty-four studies on this topic were found for Greece. Consistent findings emerged for higher
prevalence of overweight and obesity associated with lower parental education, boys, Greek-born
(rather than foreign-born) children, higher parental BMI, lower dietary quality, skipping breakfast,
less frequent meals, lower levels of physical activity, and higher levels of sedentary activity. Results
concerning variations in prevalence by rural and urban areas are not entirely consistent: this may be
due to the regional nature of some samples and/or more complex associations between local
environment and overweight/obesity. For example, Farajian et al. (2011) found that some aspects of
children’s diet were associated with rates of overweight/obesity, while dietary quality in turn varied
depending on urban/rural environment. Chalkias et al.’s (2013) analyses of children’s environments
indicated that areas characterised by low education and income levels, high population densities and
limited recreation facilities were associated with higher prevalence.
4.2.3 Adult Impacts
The impacts of overweight and obesity on adult Greek population are described in many
publications. Concerning the cardio-metabolic health, the ATTICA cohort study examined the

LIFETIME IMPACT AND COST OF CHILDHOOD OBESITY IN EUROPE (PART 2) 38
incidence of cardiovascular disease (CVD) and cardiovascular risk factors in the Attica region
(Panagiotakos et al, 2015; Koloverou et al 2014; Panagiotakos et al, 2009). The 10-year incidence of
fatal and non- fatal CVD (coronary heart disease, acute coronary syndromes, stroke) was 19.7% in
men and 11.7% in women, the 10-year incidence of type 2 diabetes was 13.4% in men and 12.4% in
women, while the 5-year incidence of hypertension was 8.8% in men and 10.8% in women. HYDRIA
study examined the prevalence of chronic diseases in a representative sample of the Greek adult
population and found that the prevalence of acute myocardial infarction was 2.8%, of stroke was
1.9%, of diabetes was 11.4%, of hypertension was 41.7% and of asthma was 8.6%.
Reliable data covering cancer epidemiology in Greek adults come from the Globocan project that
was carried out by the International Agency for Research on Cancer. The 5-year prevalence of
obesity- associated cancers in Greece was estimated to 19.5% for breast cancer, 10.8% for colorectal
cancer, 11.8% for prostate cancer, 9.5% for bladder cancer, 3.2% for endometrial cancer, 3.2% for
kidney cancer, 2.2% for ovarian cancer, 1.1% for liver cancer, 1% for thyroid cancer, 0.9% for
pancreatic cancer, 0.4% for gallbladder cancer and 0.2% for oesophageal cancer. Regarding the
musculoskeletal disorders related to obesity, the prevalence of symptomatic knee and hip
osteoarthritis was 6% and 0.9% respectively in the general adult population (Andrianakos et al,
2006), the prevalence of gout was 4.75% (Anagnostopoulos et al, 2010), while the prevalence of low
back pain was 15% (Billis et al, 2017).
4.2.4 Lifetime Costs
In Greece, the economic burden of obesity alone has not been calculated yet in terms of productivity
losses, costs of disability and other sickness related costs. Some limited data come from studies on
obesity related illnesses, such as type 2 diabetes, hypertension and cardiovascular diseases
(Athanasakis et al., 2010; Migdalis et al., 2015; Boubouchairopoulou et al, 2014; Holstenson et al.,
2011).
An estimation of the annual direct cost of treating type 2 diabetes had first been calculated by
Athanasakis et al. (2010) presenting an average cost of € 1,297 per patient. However, costs for
comorbidities and hospitalizations due to diabetic complications were not included. In another
study, Migdalis et al. (2015) calculated most of the cost components reflecting more accurately the
real burden of diabetes which was estimated at € 7,111 total annual cost per patient excluding
disability pensions. The cost for comorbidities was the largest percentage (48%) averaging at € 3,353
followed by the cost of diabetic and non-diabetic medication at € 2,506 (36%). Therefore, type 2
diabetes alone is a costly disease accounting for approximately 6.3 billion Euros, a significant
percentage of the total National Health System budget.
The lack of a centralized patient record database has been encountered as the major limitation for
adequate and reliable data collection and analysis. In 2012, a national electronic database system
was established in Greece and has started collecting data which have not yet been analyzed. The
present report would be the first document to attempt national health data analysis calculating most
of the lifetime costs for obesity associated diseases. In this way, obesity control, starting from
childhood, has to be recognized as a primary goal which would contribute to healthy and active
aging and offer significant potential for economic and societal gain.

LIFETIME IMPACT AND COST OF CHILDHOOD OBESITY IN EUROPE (PART 2) 39
4.2.5 Inequalities
A relatively large number of sources on impacts of childhood overweight/obesity were retrieved for
Greece. Nineteen of these covered aspects of cardio-metabolic health. Of these, 10 examined
multiple risk factors associated with the metabolic syndrome (Kollias et al., 2011; Mazaraki et al.,
2011; Hatzis et al., 2012; Kollias et al., 2013; Mirkopoulou et al., 2010; Manios et al., 2004; Sakka et
al., 2015; Papadopoulou-Alataki et al., 2004; Lydakis et al., 2012; Sakou et al., 2015). For example, in
a sample of 17 year-olds, Mirkopoulou et al. (2010) reported that central obesity increased the
chances of impaired fasting glucose (eight-fold) and doubled the prevalence of dyslipidaemia and
elevated serum cholesterol. Among younger children (age 4-7 years) all with a waist circumference >
90th percentile, Hatzis et al. (2012) found 77% had an increment in at least one risk factor for
atherogenesis. The factors with the highest prevalence were overweight (18.1%) and obesity (9.9%)
followed by hyperlipidemia (about 15%) and hypertension (7.7%). Mazaraki et al. (2011) reported a
significant negative relationship between BMI and albumin to creatinine ratio, (ACR, an indicator of
risk of diabetes and hypertension) among adolescents aged 12-17 years.
Three more of these 19 papers examined blood pressure (BP) (Mavrakanas et al., 2009;
Angelopoulos et al., 2009; Kollias et al., 2009). For example, Mavrakanas et al. (2009) reported that
7.9% of a sample of children aged 4-7 years had elevated systolic or diastolic BP (≥95th percentile),
and that this was more common in obese children, from 17.8% to 27.5% depending on the method
used to define obesity.
Two papers examining the associations between insulin resistance/impaired glucose tolerance found
strong, significant associations with measures of adiposity in children (Xekouki et al., 2007; Manios
et al., 2007). For example, among children aged 10 to 12 years, insulin resistance (IR) was 5-10 times
higher in obese compared to healthy weight children (Manios et al., 2007).
The four remaining papers covering aspects of cardio-metabolic health examined liver abnormalities
and iron deficiency. Papandreou et al. (2008, 2012) reported a prevalence of around 42% for non-
alcoholic fatty liver disease among a sample of obese children and adolescents aged 8-15 years.
Moschonis et al. (2012) and Manios et al. (2013) reported associations between adiposity and iron
deficiency. For example, among children aged 9 to 13 years, Manios et al. (2013) reported odds
ratios for iron deficiency and iron deficiency anaemia were 2.46 and 3.13 in obese boys and 2.05 and
3.28 in obese girls relative to healthy weight children6.
Spathopoulos et al. (2009) examined lung function among children aged 6-11 years and found that
BMI remained an independent risk factor for reduced lung function, asthma and atopy. Trikaliotis et
al. (2011) found that overweight Greek pre-school children were at a significantly higher risk of
dental caries (with a mean of 1.88 caries in the overweight group compared with 0.74 caries in the
healthy weight group).
6 It is thought that sub-clinical inflammation plays a central role in the association between iron deficiency and overweight;
i.e. hepcidin levels are higher in obese individuals and are linked to subclinical inflammation; this may reduce iron
absorption and blunt the effects of iron fortification (Cepeda-Lopez et al., 2010).

LIFETIME IMPACT AND COST OF CHILDHOOD OBESITY IN EUROPE (PART 2) 40
Three sources from Greece concerned psychological/emotional impacts of childhood
overweight/obesity (Pervanidou et al., 2013, 2015; Koroni et al., 2009). For example, in a sample of
110 obese and 31 healthy weight children (mean age 11.2 years), Pervanidou et al. (2013) found that
obese children were 3.1 and 2.3 times more likely to report state and trait anxiety, respectively, and
3.6 times more likely to report depressive symptoms, than healthy weight children of the same age.
Greece was the only country for which a study on academic performance was retrieved. In a sample
of children aged 10 to 12 and using multiple regression, Vassiloudis et al. (2014) found that academic
performance was significantly associated with BMI, dietary quality, TV viewing, sleep, physical
activity, parents' education, mother's ethnicity and family income. Note, however that academic
performance in this study was based on teachers’ ratings rather than standardised test results.
4.3 DATA DOCUMENTATION
Table. Phase 1: Greek Disease Data Quality Scores
1 2 3 4 5 6
No acceptable
data
Must be
estimated
from other
data1
International
proxy
"Approximate"
data only2
Not
applicable
(non-fatal
disease)
Acceptable
data
1. For disease parameters: prevalence, incidence, survival mortality)
2. "Approximate" data only:
ICD code mismatch
Hospital data used for prevalence or incidence
Self-reported BMI
Regional (sub-national) data
Adult diseases
DISEASE MORTALITY INCIDENCE SURVIVAL PREVALENCE
Oesophageal Cancer
EUROSTAT Globocan Cancer Registry of Crete
Globocan
Colorectal Cancer
C18 to C21 EUROSTAT
C18 to C21 Globocan
Cancer Registry of Crete
C18 to C21 Globocan
Liver Cancer
C22 EUROSTAT
C22 Globocan
Cancer Registry of Crete
C22 Globocan

LIFETIME IMPACT AND COST OF CHILDHOOD OBESITY IN EUROPE (PART 2) 41
Gallbladder Cancer
C23 to C24 Globocan
C23 to C24 Globocan
Cancer Registry of Crete
Globocan
Pancreatic cancer
EUROSTAT Globocan Cancer Registry of Crete
Globocan
Cancer-Breast, post-menopausal (females only aged 50+)
EUROSTAT Globocan Cancer Registry of Crete
Globocan
Endometrial cancer
EUROSTAT C54 Globocan
Cancer Registry of Crete
Ovarian Cancer EUROSTAT Globocan
Cancer Registry of Crete
Globocan
Prostate cancer (males only)
EUROSTAT Globocan Cancer Registry of Crete
Globocan
Kidney Cancer EUROSTAT
C64 to C66 Globocan
Cancer Registry of Crete
Globocan
Urothelial Cancer (males only)
EUROSTAT Globocan Cancer Registry of Crete
Globocan
Thyroid cancer EUROSTAT Globocan
Cancer Registry of Crete
Globocan
Type 2 Diabetes
Not required for the model
ATTICA 5 year and 10 year incidence
Not required for the model
HYDRIA prevalence based on prescription medication https://www.researchgate.net/publication/304491483_The_prevalence_and_treatment_patterns_of_diabetes_in_the_Greek_population_based_on_real
Polycystic Ovarian Syndrome
proxy data - assume zero deaths
have prevalence
Proxy data - assume zero deaths (so prob survival = 1)
https://www.ncbi.nlm.nih.gov/pubmed/10566641
Multiple Sclerosis
WHO Global Health Estimates; and Hellenic statistical authority
https://www.ncbi.nlm.nih.gov/pubmed/18382116
https://www.ncbi.nlm.nih.gov/pubmed/18382116
Stroke
Includes I60 to I69 EUROSTAT I60-I69, G450, G451, G452, G454, G458, G459 Directorate
ATTICA Incidence (5 yr incid) of fatal or non-fatal CVD (coronary heart disease, acute coronary syndromes, stroke, or other
HYDRIA

LIFETIME IMPACT AND COST OF CHILDHOOD OBESITY IN EUROPE (PART 2) 42
of Population and Labour Market Statistics
CVD)
Hypertension
Not required for the model
ATTICA 5 year and 10 year incidence
Not required for the model
HYDRIA
Ischaemic Heart Disease
Excludes I46 & I50 EUROSTAT
ATTICA Incidence (5 yr incid) of fatal or non-fatal CVD (coronary heart disease, acute coronary syndromes, stroke, or other CVD)
HYDRIA - Acute Myocaridal Infarction EHIS - CHD/Angina; heart attack
Pulmonary Embolus
Hellenic Statistical authority
have prevalence based on hospital discharge?? Global proxy https://www.ncbi.nlm.nih.gov/pmc/articles/PMC2020806/#R6
Hospital discharge data http://www.statistics.gr/en/statistics/-/publication/SHE12/-
Deep Vein Thrombosis
Hellenic Statistical authority
Global proxy https://www.ncbi.nlm.nih.gov/pmc/articles/PMC2020806/#R6
have incidence
Asthma
Hellenic Statistical authority
have prevalence HYDRIA
Non-alcoholic fatty liver disease (NAFLD)
Hellenic Statistical authority
have prevalence
https://www.researchgate.net/publication/6452830_High_prevalence_of_elevated_liver_enzymes_in_blood_donors_Associations_with_male_gender_and_central_adiposity
Gallbladder Disease
Hellenic Statistical authority
Hospital discharge data http://www.statistics.gr/en/statistics/-/publication/SHE12/-
Hospital discharge data http://www.statistics.gr/en/statistics/-/publication/SHE12/-

LIFETIME IMPACT AND COST OF CHILDHOOD OBESITY IN EUROPE (PART 2) 43
Psoriasis
proxy data - assume zero deaths
have prevalence
Proxy data - assume zero deaths (so prob survival = 1)
http://www.pagepress.org/journals/index.php/ar/article/view/ar.2011.e1/html_93
Gout
M10 WHO Global Health Estimates
have prevalence zero death - prob survival = 1
https://www.ncbi.nlm.nih.gov/pmc/articles/PMC2890601/
Osteoarthritis – Gonarthrosis Knee Pain
proxy data - assume zero deaths
have prevalence
Proxy data - assume zero deaths (so prob survival = 1)
ESORDIG study. https://www.ncbi.nlm.nih.gov/pubmed/17143985
Chronic Back Pain
proxy data - assume zero deaths
have prevalence
Proxy data - assume zero deaths (so prob survival = 1)
European Health Interview Survey (EHIS) Billis et al https://goo.gl/0R3nHr
Hypertension in pregnancy
proxy data - assume zero deaths
have prevalence
Proxy data - assume zero deaths (so prob survival = 1)
http://www.sciencedirect.com/science/article/pii/S0020729214000174
Childhood diseases DISEASE MORTALITY INCIDENCE SURVIVAL PREVALENCE
Wheezing disorders
proxy data - assume zero deaths
have prevalence
Proxy data - assume zero deaths (so prob survival = 1)
https://www.ncbi.nlm.nih.gov/pmc/articles/PMC1934355/
Metabolic syndrome
proxy data - assume zero deaths
have prevalence
Proxy data - assume zero deaths (so prob survival = 1)
https://www.ncbi.nlm.nih.gov/pubmed/21816444
Hyperlipidemia proxy data - assume zero deaths
have prevalence
Proxy data - assume zero deaths (so prob survival = 1)
https://www.ncbi.nlm.nih.gov/pmc/articles/PMC3475909/
Depression proxy data - assume zero deaths
have prevalence
Proxy data - assume zero deaths (so prob survival = 1)
https://www.ncbi.nlm.nih.gov/pmc/articles/PMC4768597/
Musculoskeletal pain
proxy data - assume zero deaths
have prevalence
Proxy data - assume zero deaths (so prob survival = 1)
https://www.ncbi.nlm.nih.gov/pubmed/16882567
Obstructive sleep apnoea
proxy data - assume zero deaths
have prevalence
Proxy data - assume zero deaths (so prob survival = 1)
https://www.ncbi.nlm.nih.gov/pubmed/15114550

LIFETIME IMPACT AND COST OF CHILDHOOD OBESITY IN EUROPE (PART 2) 44
High blood pressure
Not required for the model
have prevalence Not required for the model
https://www.ncbi.nlm.nih.gov/pmc/articles/PMC3475909/?report=printable http://www.nature.com/jhh/journal/v23/n6/full/jhh2008166a.html http://www.nature.com/ejcn/journal/v60/n10/full/1602442a.html#tbl1 http://www.rrh.org.au/articles/subviewnew.asp?ArticleID=1150 https://www.ncbi.nlm.nih.gov/pubmed/18025822
Type 2 diabetes Not required for the model
have prevalence Not required for the model
based on prescription medication https://www.researchgate.net/publication/304491483_The_prevalence_and_treatment_patterns_of_diabetes_in_the_Greek_population_based_on_real
Asthma Hellenic Statistical authority
have prevalence
https://www.ncbi.nlm.nih.gov/pmc/articles/PMC1934355/ https://www.ncbi.nlm.nih.gov/pubmed/19253125
Non-alcoholic fatty liver disease
Hellenic Statistical authority
have prevalence
NAFLD in obese children https://www.researchgate.net/publication/229327166_Are_Dietary_Cholesterol_Intake_and_Serum_Cholesterol_Levels_Related_to_Nonalcoholic_Fatty_Liver_Disease_in_Obese_Children

LIFETIME IMPACT AND COST OF CHILDHOOD OBESITY IN EUROPE (PART 2) 45
4.4 DATA
Phase 1: Data Collation
20171130 Phase 1 (Greece) Data Calculations (1).xlsx
20171130 Phase 1 (Greece) Data Calculations (2).xlsx
20171130 Phase 1 (Greece) Data Collation Workbook.xlsx
20171130 Phase 1 (Greece) Data Sources.xlsx
Phase 2: Pre-simulation Data Processing
20171130 Phase 2 (Greece) Data Documentation (Part 1).xlsx
20171130 Phase 2 (Greece) Data Documentation (Part 2).docx
Phase 5: Post Simulation Review
20171130 Phase 5 (Greece) Model Outputs Workbook - DISC.xlsm
20171130 Phase 5 (Greece) Model Outputs Workbook - UNDISC.xlsm
UNDISCOUNTED and DISCOUNTED versions of the data files are available
As a result of the feedback loops include in the workflow; thesoftware was sometimes rerun with
corrected inputs. Only the final model outputs from the simulation software are listed.

LIFETIME IMPACT AND COST OF CHILDHOOD OBESITY IN EUROPE (PART 2) 46
GREEK REFERENCES
Anagnostopoulos, I., Zinzaras, E., Alexiou, I., Papathanasiou, A.A., Davas, E., Koutroumpas, A., Barouta, G., & Sakkas, L.I. (2010) “The prevalence of rheumatic diseases in central Greece: a population survey.” BMC Musculoskeletal Disorders 11: 98.
Andrianakos, A.A., Kontelis, L.K., Karamitsos, D.G., Aslanidis, S.I., Georgountzos, A.I., Kaziolas, G.O., Pantelidou, K.V., Vafiadou, E.V., & Dantis, P.C.; ESORDIG Study Group (2006) “Prevalence of symptomatic knee, hand and hip osteoarthritis in Greece. The ESORDIG study.” The Journal of Rheumatology 33(12): 2507-13.
Angelopoulos, P.D., Milionis, H.J., Grammatikaki, E., Moschonis, G., & Manios, Y. (2009). “Changes in BMI and blood pressure after a school based intervention: The CHILDREN study.” European Journal of Public Health 19(3): 319-325.
Athanasakis, K., Ollandezos, M., Angeli, A., Gregoriou, A., Geitona, M.,& Kyriopoulos, J. (2010). “Estimating the direct cost of type 2 diabetes in Greece: the effects of blood glucose regulation on patient cost.” Diabet Med. 27(6): 679-84.
Billis, E., Koutsojannis, C., Matzaroglou, C., Gliatis, J., Fousekis, K., Gioftso, G., Papandreou, M., McCarthy, C., Oldham, J.A., & Tsepis, E. (2017) “Association of low back pain on physical, sociodemographic and lifestyle factors across a general population sample within Greece.” Journal of Back and Musculoskeletal Rehabilitation 30(2): 279-290.
Boubouchairopoulou, N., Karpettas, N., Athanasakis, K., Kollias, A., Protogerou, A.D., Achimastos, A., & Stergiou, G.S. (2014). “Cost estimation of hypertension management based on home blood pressure monitoring alone or combined office and ambulatory blood pressure measurements.” J AM Hypertens 8(10): 732-8.
Chalkias, C., Papadopoulos, A.G., Kalogeropoulos, K., Tambalis, K., Psarra, G., & Sidossis, L. (2013). "Geographical heterogeneity of the relationship between childhood obesity and socio-environmental status: Empirical evidence from Athens, Greece." Applied Geography 37: 34-43.
Farajian, P., Risvas, G., Karasouli, K., Pounis, G.D., Kastorini, C.M., Panagiotakos, D.B., & Zampelas, A. (2011). "Very high childhood obesity prevalence and low adherence rates to the Mediterranean diet in Greek children: the GRECO study." Atherosclerosis 217(2): 525-530.
The Globocan project. http://globocaniarc.fr/Pages/fact_sheets_population.aspx (accessed 31/05/2017).
Grammatikopoulou, M. G., Poulimeneas, D., Gounitsioti, I.S., Gerothanasi, K., Tsigga, M., & Kiranas, E.;ADONUT Study Group (2014). "Prevalence of simple and abdominal obesity in Greek adolescents: the ADONUT study." Clinical Obesity 4(6): 303-308.
Hassapidou, M., Daskalou, E., Tsofliou, F., Tziomalos, K., Paschaleri, A., Pagkalos, I., & Tzotzas, T. (2015)
“Prevalence of overweight and obesity in preschool children in Thessaloniki, Greece.” Hormones (Athens)
14(4): 615-22.
Hatzis, C. M., Papandreou, C., Vardavas, C.I., Athanasopoulos, D., Balomenaki, E., & Kafatos, A.G. (2012). "Atherogenic risk factors among preschool children in Crete, Greece." Indian Journal of Endocrinology & Metabolism 16(5): 809-814.
Holstenson, E., Ringborg, A., Lindgren, P., Coste, F., Diamand, F., Nieuwlatt, R., & Crijns, H. (2011) “Predictors
of costs related to cardiovascular disease among patients with atrial fibrillation in five European countries.”
Eurospace 13(1): 23-30.
HYDRIA study, Health and Nutrition survey of the Greek population http://www.hydria-nhns.gr/images/hydria-
results-eng.pdf (accessed 31/05/2017).
Kleanthous, K., Dermitzaki, E., Papadimitriou, D.T., Papaevangelou, V., & Papadimitriou, A. (2016). "Overweight and obesity decreased in Greek schoolchildren from 2009 to 2012 during the early phase of the economic crisis." Acta Paediatrica 105(2): 200-205.
Kollias, A., Antonodimitrakis, P., Grammatikos, E., Chatziantonakis, N., Grammatikos, E.E., & Stergiou, G.S. (2009). “Trends in high blood pressure in Greek adolescents.” Journal of Human Hyptertension 23: 385-390.
Kollias, A., Skliros, E., Stergiou, G.S., Leotsakos, N., Saridi, M., & Garifallos, D. (2011). “Obesity and associated

LIFETIME IMPACT AND COST OF CHILDHOOD OBESITY IN EUROPE (PART 2) 47
cardiovascular risk factors among schoolchildren in Greece: a cross-sectional study and review of the literature.” Journal of Pediatric Endocrinology and Metabolism 24: 929-938.
Kollias, A., Psilopatis, I., Karagiaouri, E., Glaraki, M., Grammatikos, E., Grammatikos, E.E., Garoufi, A., & Stergiou, G.S. (2013). “Adiposity, Blood Pressure, and Carotid Intima-Media Thickness in Greek Adolescents.” Obesity 21(5): 1013-1017.
Koloverou, E., Panagiotakos, D.B., Pitsavos, C., Chrysohoou, C., Georgousopoulou, E.N., Pitarake, E., Metaxa, V.,
& Stefanadis, C.; ATTICA Study Group. (2014) “10-year incidence of diabetes and associated risk factors in
Greece: the ATTICA study (2002-2012).” The Review of Diabetic Studies 11(2): 181-9.
Koroni, M., Garagouni-Areou, F., Roussi-Vergou, C.J., Zafiropoulou, M., & Piperakis, S.M. (2009). "The
stigmatization of obesity in children. A survey in Greek elementary schools." Appetite 52(1): 241-244.
Kotanidou, E.P., Grammatikopoulou, M.G., Spiliotis, B.E., Kanaka-Gantenbein, C., Tsigga, M., & Galli-Tsinopoulou, A. (2013). "Ten-Year obesity and overweight prevalence in Greek children: A systematic review and meta-analysis of 2001-2010 data." Hormones 12(4): 537-549.
Lydakis, C., Stefanaki, E., Stefanaki, S., Thalassinos, E., Kavousanaki, M., & Lydaki, D. (2012). "Correlation of blood pressure, obesity, and adherence to the Mediterranean diet with indices of arterial stiffness in children." European Journal of Pediatrics 171(9): 1373-1382.
Manios, Y., Costarelli, V., Kolotourou, M., Kondakis, K., Tzavara, C., & Moschonis, G. (2007). "Prevalence of obesity in preschool Greek children, in relation to parental characteristics and region of residence." BMC Public Health 7: 178.
Manios, Y., Moschonis, G., Chrousos, G.P., Lionis, C., Mougios, V., Kantilafti, M., Tzotzola, V., Skenderi, K.P., Petridou, A., Tsalis, G., Sakellaropoulou, A., Skouli, G., & Katsarou, C. (2013). "The double burden of obesity and iron deficiency on children and adolescents in Greece: the Healthy Growth Study." Journal of Human Nutrition & Dietetics 26(5): 470-478.
Manios, Y., Yiannakouris, N., Papoutsakis, C., Moschonis, G., Magkos, F., Skenderi, K., & Zampelas, A. (2004). "Behavioral and physiological indices related to BMI in a cohort of primary schoolchildren in Greece." American Journal of Human Biology 16(6): 639-647.
Mavrakanas, T.A., Konsuola, G., Patsonis, I., & Merkouris, B.P. (2009). “Childhood obesity and elevated blood pressure in a rural population of northern Greece.” Rural and Remote Health 9: 1150.
Mazaraki, A., Tsioufis, C., Dimitriadis, K., Tsiachris, D., Stefanadi, E., Zampelas, A., Richter, D., Mariolis, A., Panagiotakos, D., Tousoulis, D., & Stefanadis, C. (2011). "Adherence to the Mediterranean diet and albuminuria levels in Greek adolescents: data from the Leontio Lyceum ALbuminuria (3L study)." European Journal of Clinical Nutrition 65(2): 219-225.
Migdalis, I., Rombopoulos, G., Hatzikou, M., Manes, C., Kypraios, N., & Tentolouris N. (2015). “The cost of Managing Type 2 Diabetes Mellitus in Greece: A Retrospective Analysis of 10-year Patient Level Data “The HERCULES Study”.” International Journal of Endocrinology 1: 1-7.
Mirkopoulou, D., Grammatikopoulou, M.G., Gerothanasi, K., Tagka, A., Stylianou, C., & Hassapidou, M. (2010). “Metabolic indices, energy and macronutrient intake according to weight status in a rural sample of 17-year-old adolescents.” Rural & Remote Health 10(4): 1513.
Moschonis, G., Chrousos, G.P., Lionis, C., Mougios, V., &Manios, Y.; Healthy Growth Study Group. (2012). "Association of total body and visceral fat mass with iron deficiency in preadolescents: the Healthy Growth Study." British Journal of Nutrition 108(4): 710-719.
Panagiotakos, D.B., Georgousopoulou, E.N., Pitsavos, C., Chrysohoou, C., Metaxa, V., Georgiopoulos, G.A., Kalogeropoulou, K., Tousoulis, D., & Stefanadis, C.; ATTICA Study Group (2015) “Ten-year (2002-2012) cardiovascular disease incidence and all-cause mortality, in urban Greek population: the ATTICA Study.” International Journal of Cardiology 180(1): 178-84.
Panagiotakos, D.B., Pitsavos, C., Chrysohoou, C., Skoumas, I., & Stefanadis, C. (2009) “Prevalence and five-year incidence (2001-2006) of cardiovascular disease risk factors in a Greek Sample: The ATTICA study.” Hellenic Journal of Cardiology 5(50): 388-95.
Papadimitriou, A., Kounadi, D., Konstantinidou, M., Xepapadaki, P., & an Nicolaidou, P. (2006). “Prevalence of Obesity in Elementary Schoolchildren Living in Northeast Attica, Greece.” Obesity 14: 1113-1117.
Papadopoulou-Alataki, E., Papadopoulou-Legbelou, K., Doukas, L., Karatzidou, K., Pavlitou-Tsiontsi, A., & Pagkalos, E. (2004). "Clinical and biochemical manifestations of syndrome X in obese children." European Journal of Pediatrics 163(10): 573-579.

LIFETIME IMPACT AND COST OF CHILDHOOD OBESITY IN EUROPE (PART 2) 48
Papandreou, D., Karabouta, Z., Pantoleon, A., & Rousso, I. (2012). "Investigation of anthropometric, biochemical and dietary parameters of obese children with and without non-alcoholic fatty liver disease." Appetite 59(3): 939-944.
Papandreou, D., Malindretos, P., & Rousso, I. (2010). "Risk factors for childhood obesity in a Greek paediatric population." Public Health Nutrition 13(10): 1535-1539.
Papandreou, D., Rousso, I., Malindretos, P., Makedou, A., Moudiou, T., Pidonia, I., Pantoleon, A., Economou, I., & Mavromichalis, I. (2008). "Are saturated fatty acids and insulin resistance associated with fatty liver in obese children?" Clinical Nutrition 27(2): 233-240.
Pervanidou, P., Bastaki, D., Chouliaras, G., Papanikolaou, K., Kanaka-Gantenbein, C., & Chrousos, G. (2015). “Internalizing and externalizing problems in obese children and adolescents: associations with daily salivary cortisol concentrations.” Hormones 14(4): 623-631.
Pervanidou, P., Bastaki, D., Chouliaras, G., Papanikolaou, K., Laios, E., Kanaka-Gantenbein, C., & Chrousos, G.P. (2013). "Circadian cortisol profiles, anxiety and depressive symptomatology, and body mass index in a clinical population of obese children." Stress 16(1): 34-43.
Roditis, M.L., Parlapani, E.S., Tzotzas, T., Hassapidou, M., & Krassas, G.E. (2009). “Epidemiology and Predisposing Factors of Obesity in Greece: From the Second World War Until Today.” Journal of Pediatric Endocrinology & Metabolism 22: 389-405.
Sakka, S., Siahanidou, T., Voyatzis, C., Pervanidou, P., Kaminioti, C., Lazopoulou, N., Kanaka-Gantenbein, C., Chrousos, G.P., & Papassotiriou, I. (2015). "Elevated circulating levels of lipoprotein-associated phospholipase A2 in obese children." Clinical Chemistry & Laboratory Medicine 53(7): 1119-1125.
Sakou, I.I., Psaltopoulou, T., Sergentanis, T.N., Karavanaki, K., Karachaliou, F., Ntanasis-Stathopoulos, I., Tzanninis, S., Sdogou, T., Greydanus, D., & Tsitsika, A. (2015). “Insulin resistance and cardiometabolic risk factors in obese children and adolescents: a hierarchical approach.” Journal of Pediatric Endocrinology & Metabolism 28 (5-6): 5589-596.
Spathopoulos, D., Paraskakis, E., Trypsianis, G., Tsalkidis, A., Arvanitidou, V., Emporiadou, M., Bouros, D., & Chatzimichael, A. (2009). "The effect of obesity on pulmonary lung function of school aged children in Greece." Pediatric Pulmonology 44(3): 273-280.
Tambalis, K.D., Panagiotakos, D.B., Kavouras, S.A., Kallistratos, A.A., Moraiti, I.P., Douvis, S.J., Toutouzas, P.K., & Sidossis, L.S. (2010). "Eleven-year prevalence trends of obesity in Greek children: first evidence that prevalence of obesity is leveling off." Obesity 18(1): 161-166.
Trikaliotis, A., Boka, V., Kotsanos, N., Karagiannis, V., & Hassapidou, M. (2011). “dmfs and BMI in pre-school Greek children. An epidemiological study.” European Archives of Paediatric Dentistry 12(3): 176-178.
Tzotzas, T., Kapantais, E., Tziomalos, K., Ioannidis, I., Mortoglou, A., Bakatselos, S., Kaklamanou, M., Lanaras, L., & Kaklamanos, I. (2008). "Epidemiological survey for the prevalence of overweight and abdominal obesity in Greek adolescents." Obesity 16(7): 1718-1722.
Vassiloudis, I., Yiannakouris, N., Panagiotakos, D.B., Apostolopoulos, K., & Costarelli, V. (2014). "Academic performance in relation to adherence to the Mediterranean diet and energy balance behaviors in Greek primary schoolchildren." Journal of Nutrition Education & Behaviour 46(3): 164-170.
Wijnhoven, T. M., van Raaij, J.M., Spinelli, A., Starc, G., Hassapidou, M., Spiroski, I., Rutter, H., Martos, E., Rito, A.I., Hovengen, R., Peréz-Farinós, N., Petrauskiene, A., Eldin, N., Braeckevelt, L., Pudule, I., Kunesova, M., & Breda, J. (2014a). "WHO European Childhood Obesity Surveillance Initiative: Body mass index and level of overweight among 6-9-year-old children from school year 2007/2008 to 2009/2010." BMC Public Health 14.
Xekouki, P., Nikolakopoulou, M., Papageorgiou, A., Livadas, S., Voutetakis, A., Magiakou, M.A., Chrousos, G.P., Spiliotis, B.E., & Dacou-Voutetakis, C. (2007) “Glucose Dysregulation in Obese Children: Predictive, Risk, and Potential Protective Factors.” Obesity 15(4): 860-869.

LIFETIME IMPACT AND COST OF CHILDHOOD OBESITY IN EUROPE (PART 2) 49
5. REPUBLIC OF IRELAND
5.1 LOCAL CONTEXT
The pictures of obesity-- its prevalence, causes, and human outcomes—are similar across the
Republic of Ireland and Northern Ireland, although their financial costs and losses differ. Each
government has responded to the epidemic with a similar multi-departmental, multi-sector strategy
policy that is aimed at prevention across the lifetime.
Republic of Ireland Context: The government of the Republic of Ireland has very actively promoted
partnership among government bodies and across sectors. It has developed and funded internal
programs and outside agencies with a remit to address the obesity epidemic and has initiated and
funded internal and external: investigations into the scale of the problem in Ireland, into the best
interventions to address and prevent obesity, and into the financial and lifetime costs of overweight
and obesity to the person and society. The Government’s current range of initiatives rely on the
multi-sectorial approach outlined in Healthy Ireland (HI) – A Framework for Improved Health and
Well-Being 2013-2025 (Department of Health, 2013). The approach was adopted by the Irish
Government to serve as a tool to frame multi-sector action in response to not only the obesity
epidemic, but to Ireland’s changing health and wellbeing profile of increased life expectancy, rising
morbidity trends, and increasing associated costs. The framework includes arrangements that
promote cooperation among the health sector and other areas of Government and public services.
The framework also focuses on research and evidence to ensure goals, programmes, policy, and
programming decisions are based on robust evidence, best practice approaches, and integrated with
service delivery to maximise impact. The Healthy Ireland team evaluated Ireland’s health status in
the Healthy Ireland Survey 2015 and specifically evaluated Weight Management and found the same
profound and rising weight epidemic (Department of Health, 2015) that existed in 2013 when the
program started.
The HSE has incorporated Healthy Ireland into the health services strategy. Healthy Ireland in the
Health Services – National Implementation Plan 2015-2017 describes a 3-pronged strategy aimed at
health service reform, reducing the burden of chronic disease, and improving staff and well-being.
Reducing overweight and obesity are listed among the plan’s strategic priorities (HSE, 2015). The
Government has continued it’s ideal of agency collaboration with the 2016 Program for a
Partnership Government that sets out the agreed government program between Fine Gael, the
Independent Alliance, and some Independent TDs, has listed the implementation of a national
obesity plan among the key public health interventions it will make. The program will include a focus
on child health and targeted investment in the early years that will include a Prevention and Early
Intervention Unit in the Department of Public Expenditure and Reform/Finance focused on early
intervention policies to improve life outcomes. The Government developed the Obesity Policy and
Action Plan 2016-2025 called A Healthy Weight for Ireland aimed at assisting people to achieve
better health and specifically reduce levels of overweight and obesity. This approach is also based on
the Government’s 2013 framework for improved health and well-being, Healthy Ireland. A Healthy
Weight for Ireland covers a 10-year period (2016-2025) setting targets and actions to produce results

LIFETIME IMPACT AND COST OF CHILDHOOD OBESITY IN EUROPE (PART 2) 50
and includes: a sugar levy; a whole school approach; food establishments posting calorie content of
dishes; food industry reducing sugar, fat, and salt; and a code of practice for food and drink
marketing. (Department of Health, 2016) The critical point in the success of the plan relies on the
meaningful application of the Ten Steps Forward by government and non-government bodies. The
Ten Steps Forward:
1. Embed multi-sectoral actions on obesity prevention with the support of government departments and public sector agencies.
2. Regulate for a healthier environment.
3. Secure appropriate support from the commercial sector to play its part in obesity prevention.
4. Inform and empower change through a clear communications strategy.
5. The Department of Health will provide leadership.
6. Mobilise the health services with a focus on prevention.
7. Develop a service model for specialist care for children and adults.
8. Acknowledge the key role of physical activity in the prevention of overweight and obesity.
9. Allocate resources according to need, in particular children and disadvantaged groups.
10. Monitor research and review
The Government has partnered with non-government and external agencies across sectors to
actualize its policies and plans, to continue evaluation of the epidemic, and to advise on policy, and
regularly works with:
Ireland Department of Public Health (IPH) who assisted the Government with policy development
and implementation of A Healthy Weight for Ireland. IPH contributed to the evidence base on a
sugar sweetened drinks tax in 2012, when commissioned by the Department of Health in the
Republic of Ireland to undertake a Health Impact Assessment. With the support of the EC, IPH is
currently evaluating the lifetime impact of childhood overweight and obesity as measured by body
mass index (BMI), on the individual and the society in terms of financial and human costs.
SafeFood has collaborated with IDPH, University College Cork, the European Commission and other
agencies to provide the first estimate of the financial costs of overweight and obesity to Ireland in
2012, and are continuing to advance these investigations with a report of the Lifetime Cost of
Childhood Obesity (2017). In 2013, SafeFood worked with the Special Advisory Group on Obesity
(SAGO) and with the Regional Obesity Prevention Implementation Group (ROPIG) in Northern Ireland
on an obesity awareness public health campaign.
Children and Young People's Services Committees (CYPSC) operate on a county level to secure better
outcomes for children and young people in their area through more effective integration of existing
services and interventions. The Government identified them as a key to plan and co-ordinate
services for children and young people in every country in Ireland. One of CYPSC’s priorities is
obesity prevention and are developing initiatives to raise awareness of the issue of childhood
obesity. (CYPSE, 2017)

LIFETIME IMPACT AND COST OF CHILDHOOD OBESITY IN EUROPE (PART 2) 51
The European Union designed the Action Plan on Childhood Obesity 2014-2020 that aims halting the
rise in people’s ages 0-18 by 2020, requiring the involvement of many stakeholders within each
member state to develop relevant policy.
The Irish Government’s understanding of the complexity of the causes and contributors to the
obesity epidemic has culminated into the multi-sector solution strategy and an active collaboration
stance with internal and external agencies. This has provided a welcoming environment to support
and nurture results-oriented investigations, policy, and programs to bring results.
Northern Ireland Context: The government of Northern Ireland has very actively developed and
implemented programs to address the obesity and overweight epidemic and regularly evaluates
program effectiveness and modifies programs based on program outcomes and new evidence. The
Government’s acknowledgement of the complex solution required to address overweight and
obesity, due to the obesogenic environment, resulted in the current evidence-based, intergrated,
cross-sector, life course policy approach.
Leading up to the current approach, the Government had addressed obesity with Fit Futures, a
nutrition and exercise approach. The 2007 UK-wide Foresight Report, Tackling Obesities: Future
Choices, suggested policy ineffectiveness due to the obesogenic environment requiring
comprehensive interventions. The report also evaluated how to address obesity over the next 40
years. The Department of Health, Social Services and Public Safety (DHSSPS) established the cross-
sectoral Obesity Prevention Steering Group (OPSG) in 2008 to promote Fit Futures and develop a life
course framework to tackle obesity that would replace Fit Futures. A whole system approach to
health became the foundation for A Fitter Future for All - Framework for Preventing and Addressing
Overweight and Obesity in Northern Ireland 2012-2022 and for Making Life Better - A Whole System
Strategic Framework for Public Health 2013 -2023, which is aimed at overall health and wellbeing
and includes tackling obesity as one of its aims. Both programs involve steering committees to
oversee progress and the Public Health Agency to facilitate implementation and delivery. (DHSSPS
2012; 2013) In 2012, various efforts had accomplished: the development of public information
campaigns and supporting materials; delivery of relevant training and support; development of
nutritional guidelines in key settings, particularly schools; community based initiatives on food and
physical activity; the introduction of the curriculum sports programme for primary schools, which
enables pupils to develop their physical literacy skills working with coaches from the GAA and IFA;
support, advice and guidance for professionals; improved support in health care settings, including
physical activity referrals; strengthened code of conduct for advertising high fat, sugar, or salt foods
to children; improved evidence and research base; and work with industry, including progress on
reformulation and improved labelling (DHSSPS).
Additional action include: Healthy Child, Healthy Future (DHSSPS, 2010), a framework for the
Universal Child Health Promotion Programme that involves the family in adopting health-enhancing
behaviours for children age 0-19; Healthy Foods for Health Outcomes (DHSSPS & DE, 2013) that
advocates a whole school approach to all food provided in schools; and the Public Health Agency’s
Obesity Awareness Week. The government also partners with regional government and external
agencies to actualize and extend its policies, including: district councils; schools; leisure centers and
healthy living centers; Regional Obesity Prevention Implementation Group (ROPIG) who developed
an obesity awareness public health campaign; Ireland Department of Public Health, who is currently

LIFETIME IMPACT AND COST OF CHILDHOOD OBESITY IN EUROPE (PART 2) 52
evaluating the lifetime impact of childhood overweight and obesity as measured by body mass index
(BMI), on the individual and the society in terms of financial and human costs; the Food Standards
Agency (FSA); Safefoods, who investigated the financial and healthcare costs to the local economy as
a result of obesity (2011), collaborated with IDPH, UCC, the EC, and other agencies to provide the
first estimate of the financial costs of overweight and obesity to Ireland (2012), and the Lifetime Cost
of Childhood Obesity (2017); and the Chartered Institute of Environmental Health (CIEH) to develop a
healthier eating award for catering establishments across Northern Ireland; and The European
Union, who designed the Action Plan on Childhood Obesity 2014-2020 that aims halting the rise in
peoples ages 0-18 by 2020, requiring the involvement of many stakeholders within each member
state to develop relevant policy.
The Government’s policies aimed at the obesity epidemic are many and varied to address the
multiple causal factors through interventions delivered from multiple sectors of most government
organizations. The integrated environment is hospitable to actualizing these programs.
5.2 LOCAL EVIDENCE
This section should be read in conjunction with the international evidence outlined in Chapter 1.
5.2.1 Childhood Obesity / Overweight
The literature from Ireland provided 18 sets of estimates of the prevalence of overweight and
obesity. Five are considered here. They come from four sources. The first is the Growing Up in
Ireland (GUI) study, a national longitudinal survey of representative samples of children in two
cohorts, and followed every 2-3 years. The Infant Cohort of about 11,150 children was first surveyed
at age 9 months in 2008-2009, while the Child Cohort of about 8,550 children was first surveyed at
age 9 years in 2007-2008. The second is the third round of COSI (2012). Estimates for adolescents
come from a study on second-level students’ participation in sport (Fahey et al. 2005), while the
most recent estimates, based on data collected in 2013-2014, come from the Fluoride and Caring for
Children’s Teeth (FACCT) study (McCarthy et al., 2016a)37.
Among infants aged 9 months who took part in GUI, on the basis of the UK-WHO growth charts,
24.8% of all children were classified as overweight and 15.7% as obese (Mangan & Zgaga, 2014). Also
based on GUI, at age 9, it was reported that 22% of boys and 30% of girls were overweight or obese
(Layte & McCrory, 2011). The FACCT study indicated that 21% of children aged 4-7 years (18% of
boys and 25% of girls), and 26% of adolescents (aged 11-14 years; 23% of boys and 28% of girls)
were overweight and obese.
The COSI results for Ireland for round 3, conducted in 2012 (Heinen et al., 2014) indicated that
among children aged 7, the prevalence of overweight and obesity was higher in girls (22%) than in
boys (17%). These estimates are lower than those from the FACCT study for children aged 4-7 years

LIFETIME IMPACT AND COST OF CHILDHOOD OBESITY IN EUROPE (PART 2) 53
but the gender difference is consistent. At age 9, COSI estimates indicated that prevalence was
similar for girls (22%) and boys (20%).
Fahey et al. (2005) surveyed a representative sample of adolescents aged 13 to 18 in 2004 and
estimated that about one in five (19.9% of boys and 20.4% of girls) was overweight or obese. The
pattern of prevalence followed a U-shape with age, being lowest among adolescents aged 15 and 16.
5.2.2 Childhood Impacts
Three papers from Ireland examined aspects of cardio-metabolic health. Finucane et al. (2008a)
reported that 51% of boys and 49% of girls had systolic BP in hypertensive range (> 95th
percentilefor age, sex and height). Results also showed a clear and continuous increase in systolic BP
with increasing BMI, particularly in boys. This is of significance, since 93% of this sample (aged 2-18
years) was obese. Finucane et al. (2008b) reported significant associations between degree of
obesity, insulin sensitivity and markers of liver steatosis among a sample of obese children and
adolescents (mean age 15.5 years). Carolan et al. (2013) reported that obese children showed
changes in immune cell frequency, inflammatory environment, and regulation of metabolic gene
expression compared to children of healthy weight. These changes have been causally linked to
adult onset of metabolic disease and suggest a future trajectory for the development of type 2
diabetes and premature cardiovascular disease.
Three further papers examined associations between overweight/obesity and musculo-
skeletal/motor function (O’Malley et al., 2012, 2015a, 2015b). For example, in a sample of obese
children and adolescents (mean age 12.2 years), O’Malley et al. (2012) reported moderate negative
correlations were found between body composition and range of motion, flexibility, and strength.
Genu valgum deformity was moderately positively correlated to body mass index.
One source from Ireland examined psychological/emotional impacts. On the basis of a
representative sample of 9 year-olds, Layte & McCrory (2011) reported that self-perceptions relating
to popularity and physical appearance were significantly negatively related to self-perceptions of
weight. The perception of overweight was also significantly associated higher levels of emotional
and behavioural problems.
5.2.5 Inequalities
Nine studies from Ireland that examined inequalities in prevalence were retrieved. One (Williams et
al., 2013) confirmed the presence of a socio-economic gradient at age 3 years, while another study
examining weight gain from birth to three years showed that lower SES was associated with lower
birth weights and highest gains in weight; higher gains in weight were associated with higher
maternal weight gain during pregnancy and no breastfeeding (Layte & Biesma-Blanco, 2014).
Multivariate analyses of children’s BMI at age 9 (Layte & McCrory, 2011; Keane et al., 2012; Perry et
al., 2015) indicated higher prevalence of overweight and obesity among girls, one parent families,

LIFETIME IMPACT AND COST OF CHILDHOOD OBESITY IN EUROPE (PART 2) 54
lower occupational class, lower parental education, lower rates of physical activity, poorer dietary
quality, and, in particular, among children with overweight or obese parents. Walsh and Cullinan
(2015) conducted an analysis of the relative contributions of a range of child and parent
characteristics to the socio-economic gradient at age 9 and found that parental characteristics
accounted for a large majority of this gradient, while child-related measures were not statistically
significant. Other studies confirmed an association between socio-economic deprivation and child
overweight/obesity (Heinen et al., 2014; O’Shea et al., 2014). One study (Fahey et al., 2005) did not
find a significant association between SES and rates of overweight or obesity among adolescents.
However, Fahey et al.’s (2005) analysis was bivariate and used a rather broad measure of SES
(parental occupation, split into 9 groups by sector).
5.3 DATA DOCUMENTATION
Phase 1: Data Collation
20171130 Phase 1 (Ireland) Data Calculations.xlsx
20171130 Phase 1 (Ireland) Data Calculations (2).xlsx
20171130 Phase 1 (Ireland) Data Collation Workbook.xlsx
20171130 Phase 1 (Ireland) Data Sources.xlsx
Phase 2: Pre-simulation Data Processing
20171130 Phase 2 (Ireland) Data Documentation (Part 1).xlsx
20171130 Phase 2 (Ireland) Data Documentation (Part 2).docx
Phase 5: Post Simulation Review
20171130 Phase 5 (Ireland) Model Outputs Workbook - DISC.xlsm
20171130 Phase 5 (Ireland) Model Outputs Workbook - UNDISC.xlsm
5.3.1 Irish Disease Data Quality Scores
1 2 3 4 5 6
No acceptable
data
Must be
estimated
from other
data1
International
proxy
"Approximate"
data only2
Not
applicable
(non-fatal
disease)
Acceptable
data

LIFETIME IMPACT AND COST OF CHILDHOOD OBESITY IN EUROPE (PART 2) 55
1. For disease parameters: prevalence, incidence, survival mortality)
2. "Approximate" data only:
ICD code mismatch
Hospital data used for prevalence or incidence
Self-reported BMI
Regional (sub-national) data
Adult diseases
DISEASE INCIDENCE PREVALENCE SURVIVAL
MORTALITY
Oesophageal Cancer NCRI NCRI NCRI CSO
Colorectal Cancer NCRI request NCRI request NCRI request CSO
Liver Cancer NCRI request NCRI request NCRI request
CSO
Gallbladder Cancer NCRI NCRI
not available CSO
Pancreatic cancer NCRI NCRI NCRI CSO
Cancer-Breast, post-menopausal (females only aged 50+) NCRI - aged 50+ NCRI request NCRI request
CSO - aged 50+
Endometrial cancer NCRI NCRI NCRI request CSO
Ovarian Cancer NCRI NCRI NCRI request CSO
Prostate cancer (males only) NCRI NCRI NCRI CSO
Kidney Cancer NCRI NCRI NCRI request CSO
Urothelial Cancer (males only) NCRI NCRI NCRI CSO
Thyroid cancer NCRI NCRI NCRI CSO
Type 2 Diabetes
Calculate incidence from
http://www.ncbi.nlm.nih.gov/pmc/articles/PMC4748605/
Not required for the model
Not required

LIFETIME IMPACT AND COST OF CHILDHOOD OBESITY IN EUROPE (PART 2) 56
prevalence for the model
Polycystic Ovarian Syndrome
not available not available not available CSO
Adult obesity
not available not available not available CSO
Multiple Sclerosis
UK proxy http://jnnp.bmj.com/content/early/2013/09/19/jnnp-2013-305450.full.pdf
UK proxy http://jnnp.bmj.com/content/early/2013/09/19/jnnp-2013-305450.full.pdf
not available
CSO
Stroke
hospital discharges North Dublin population; first ever stroke
CSO Quarterly National Household Survey Q3 2010 - doc dx IPH estimates - based on self-report from SLAN
Irish Heart Foundation/HSE National Stroke Audit 2015 http://www.irishheart.ie/media/pub/advocacy/research/ihf_national_stroke_audit_2015_web.pdf CSO
Hypertension
Calculate incidence from prevalence TILDA Wave 1 - age 50+
Health Survey for Eng 2014 - UK proxy - age up to 54
Not required for the model
Not required for the model
Ischaemic Heart Disease
Calculate incidence from prevalence
I20; I21; I50 - mixture TILDA and UK data (http://heart.bmj.com/content/early/2015/05/06/heartjnl-2015-307516.full.pdf+html)
calculated from mortality and prevalence CSO
Deep Vein Thrombosis UK proxy UK proxy
not available CSO
Asthma
Calculate incidence from prevalence
CSO Quarterly National Household Survey Q3 2010 QOF - NI zero deaths
CSO
Non-alcoholic fatty liver disease (NAFLD)
not available not available
zero deaths
CSO
Gallbladder Disease HIPE data HIPE data (same as incidence) zero deaths
CSO

LIFETIME IMPACT AND COST OF CHILDHOOD OBESITY IN EUROPE (PART 2) 57
Psoriasis
Global Epidemiology of Psoriasis: A Systematic Review of Incidence and Prevalence; http://www.jidonline.org/article/S0022-202X(15)36098-X/pdf Have incidence
not available
CSO
Gout UK proxy UK proxy zero deaths CSO
Osteoarthritis – Gonarthrosis Knee Pain
Calculate incidence from prevalence
UK proxy zero deaths
CSO
Chronic Back Pain
Calculate incidence from prevalence
CSO Quarterly National Household Survey Q3 2010 zero deaths
CSO
Hypertension in pregnancy
not available not available not available CSO
Pulmonary Embolus UK proxy UK proxy
not available CSO
Childhood diseases
DISEASE INCIDENCE PREVALENCE SURVIVAL
MORTALITY
Wheezing disorders
not available not available not available not available
Metabolic syndrome
not available not available not available not available
Hyperlipidemia
not available not available not available not available
Depression Calculate incidence from prevalence
hospital attendance not available CSO
Musculoskeletal pain
Calculate incidence from prevalence
PRIME-C study not available CSO

LIFETIME IMPACT AND COST OF CHILDHOOD OBESITY IN EUROPE (PART 2) 58
Obstructive sleep apnoea
Calculate incidence from prevalence
proxy https://www.ncbi.nlm.nih.gov/pmc/articles/PMC3004499/#B8
not available CSO
High blood pressure
Calculate incidence from prevalence
Wales proxy Not required for the model
Not required for the model
Type 2 diabetes
Calculate incidence from prevalence
England Proxy Not required for the model
Not required for the model
Asthma Calculate incidence from prevalence
PCRS data as a proxy zero deaths
J45 to J46 EUROSTAT
Non-alcoholic fatty liver disease
Calculate incidence from prevalence
http://bmcpediatr.biomedcentral.com/articles/10.1186/1471-2431-13-40
zero deaths CSO
5.4 DATA
Phase 1: Data Collation
20171130 Phase 1 (Republic of Ireland) Data Collation Workbook.xlsx
Phase 2: Pre-simulation Data Processing
Data not available (see Data Documentation files)
Phase 3 and 4: Simulation Modelling and Cost Estimation
20171130 Phase 3&4 (Republic of Ireland) Initial Model Output Workbook.xlsx
Phase 5: Post Simulation Review
20171130 Phase 5 (Republic of Ireland) Initial Resturctured Model Output Workbook.xlsx
20171130 Phase 5 (Republic of Ireland) Initial Core tables and Graphs Workbook.xlsx
Phase 6: Reporting
20171130 (Republic of Ireland) Final Restructured Model Output Workbook.xlsx
20171130 (Republic of Ireland) Final Combined Model Outputs SAS Dataset.ssd
20171130 (Republic of Ireland) Final Combined Model Outputs Worksheet.xlsx
20171130 (Republic of Ireland) Final Core Tables and Graphs Workbook.xlsx

LIFETIME IMPACT AND COST OF CHILDHOOD OBESITY IN EUROPE (PART 2) 59
UNDISCOUNTED and DISCOUNTED versions of the data files are available
As a result of the feedback loops include in the workflow; the software was sometimes rerun with
corrected inputs (this occurred for the Republice of Irealnd). Only the final model outputs from the
simulation software are listed.
Table is a profile of children, age 0-17, living in the Republic of Ireland in 2015. Most (76.5%)
children are healthy weight with 23.5% either obese or overweight. Percent who are
obese/overweight increases with age. In the 0-5 age group, slightly higher percent of males are
obese/overweight than females. However, this changes in 6-11 year old group and persists in the
12-17 year old group with relatively more obese/overweight females than males.
Table. Phase 5: Profile of Republic of Ireland children (2015)
IRELAND
AGE SEX BMI AT AGE 18 NUMBER PERCENTAGE
0-17 YEARS PERSONS OBESE/OVERWEIGHT 281,751 23.5%
HEALTHY WEIGHT 917,569 76.5%
ALL 1,199,320 100.0%
FEMALES OBESE/OVERWEIGHT 144,292 24.6%
HEALTHY WEIGHT 442,234 75.4%
ALL 586,526 100.0%
MALES OBESE/OVERWEIGHT 137,459 22.4%
HEALTHY WEIGHT 475,335 77.6%
ALL 612,794 100.0%
0-5 YEARS PERSONS OBESE/OVERWEIGHT 86,060 19.9%
HEALTHY WEIGHT 345,532 80.1%
ALL 431,592 100.0%
FEMALES OBESE/OVERWEIGHT 40,129 19.0%
HEALTHY WEIGHT 171,030 81.0%
ALL 211,159 100.0%
MALES OBESE/OVERWEIGHT 45,931 20.8%
HEALTHY WEIGHT 174,502 79.2%
ALL 220,433 100.0%
6-11 YEARS PERSONS OBESE/OVERWEIGHT 95,224 23.3%
HEALTHY WEIGHT 312,982 76.7%
ALL 408,206 100.0%
FEMALES OBESE/OVERWEIGHT 51,495 25.7%
HEALTHY WEIGHT 148,931 74.3%
ALL 200,426 100.0%

LIFETIME IMPACT AND COST OF CHILDHOOD OBESITY IN EUROPE (PART 2) 60
MALES OBESE/OVERWEIGHT 43,729 21.0%
HEALTHY WEIGHT 164,051 79.0%
ALL 207,780 100.0%
12-17 YEARS PERSONS OBESE/OVERWEIGHT 100,467 27.9%
HEALTHY WEIGHT 259,055 72.1%
ALL 359,522 100.0%
FEMALES OBESE/OVERWEIGHT 52,668 30.1%
HEALTHY WEIGHT 122,274 69.9%
ALL 174,941 100.0%
MALES OBESE/OVERWEIGHT 47,799 25.9%
HEALTHY WEIGHT 136,782 74.1%
ALL 184,581 100.0%
REPUBLIC OF IRELAND AND NORTHERN IRELAND REFERENCES
Carolan, E., Hogan, A.E., Corrigan, M., Gaotswe, G., O'Connell, J., Foley, N., O'Neill, L.A., Cody, D., & O'Shea, D.
(2013). "The impact of childhood obesity on inflammation, innate immune cell frequency, and metabolic
microRNA expression." The Journal of Clinical Endocrinology & Metabolism 99(3): E474-E478.
Fahey, T., Delaney, L., & Gannon, B. (2005). School children and sport in Ireland. Dublin: ESRI.
Finucane, F., Pittock, S., Fallon, M., Hatunic, M., Ong, K., Burns, N., Costigan, C., Murphy, N., & Nolan, J. (2008a). "Elevated blood pressure in overweight and obese Irish children." Irish Journal of Medical Science 177(4): 379-381. Finucane, F., Teong, L., Pittock, S., Fallon, M., Hatunic, M., Costigan, C., Murphy, N., Crowley, V., & Nolan, J.
(2008b). "Adverse metabolic profiles in a cohort of obese Irish children." Annals of Clinical Biochemistry 45(2):
206-209.
Heinen, M., Murrin, C. Daly, L., O’Brien, J., Heavey, P., Kilroe, J., O’Brien, M., Scully, H., Mulhern, L.M., Lynam,
A., Hayes, C., O’Dwyer, U., Eldin, N., & Kelleher, C. (2014). The Childhood Obesity Surveillance Initiative (COSI)
in the Republic of Ireland: Findings from 2008, 2010 and 2012. Dublin: Health Service Executive and
Department of Health.
Keane, E., Layte, R., Harrington, J., Kearney, P.M., & Perry, I.J. (2012). "Measured parental weight status and
familial socio-economic status correlates with childhood overweight and obesity at age 9." PloS One 7(8):
e43503.
Layte, R., & Biesma-Blanco, R. (2014). “Social class differences in weight gain from birth to three years.” Paper
presented at the Growing Up in Ireland Research Conference 2014: Dublin, November.
Layte, R. & McCrory, C. (2011). Growing Up in Ireland-National Longitudinal Study of Children: Overweight and
Obesity Among 9-Year-Olds. Dublin: Department of Children and Youth Affairs.
McCarthy, L., Keane, E., Geaney, F., O’Sullivan, M., & Perry, I.J. (2016a). Trends and prevalence of overweight
and obesity in primary school aged children in Ireland from 2002-2015: An update on the existing literature.
Report commissioned by safefood Ireland. Cork: safefood.

LIFETIME IMPACT AND COST OF CHILDHOOD OBESITY IN EUROPE (PART 2) 61
Mangan, L., & Zgaga, L. (2014). “Exploring the association between sleep duration and overweight and obesity
in infants.” Paper presented at the Growing Up in Ireland Research Conference 2014: Dublin, November.
O'Malley, G., Hussey, J., & Roche, E. (2012). "A pilot study to profile the lower limb musculoskeletal health in children with obesity." Pediatric Physical Therapy 24(3): 292-298. O’Malley, G., Elmes, M., Keating, R., Killeen, S., Doyle, S., Murphy, S., & Lennon, O. (2015a). “Exploring the prevalence of musculoskeletal impairments in children and adolescents attending an obesity management service.” Appetite 89: 309. O’Malley, G., Keating, R., Elmes, M., Killeen, Sheridan, N., Murphy, S., & Brinkley, A. (2015b). “Standing balance
and health-related quality of life in children who are obese.” Appetite 89: 309.
O’Shea, B., Ladewig, E.L., Kelly, A., Reulbach, U., & O’Dowd, T. (2014). “Weighing children; parents agree, but
GPs conflicted.” Archives of Disease in Childhood 99: 543-545.
Perry, C., Keane, E., Fitzgerald, A.P., Layte, R., Perry, I.J., & Harrington, J.A. (2015). “The use of a Dietary Quality
Score as a predictor of childhood overweight and obesity.” BMC Public Health 15: 581.
Walsh, B., & Cullinan, J. (2015). “Decomposing socioeconomic inequalities in childhood obesity: Evidence from
Ireland.” Economic & Human Biology 16: 60-72.

LIFETIME IMPACT AND COST OF CHILDHOOD OBESITY IN EUROPE (PART 2) 62
6. ITALY
6.1 LOCAL CONTEXT
The Italian National Health Service was set up in 1978, with universal coverage, solidarity, human
dignity, and health needs as its guiding principles. It is regionally based and organized at the
national, regional, and local levels. Under the Italian constitution, the central government controls
the distribution of tax revenue for publicly financed health care and defines a national statutory
benefits package to be offered to all residents in every region—the “essential levels of care” (livelli
essenziali di assistenza, or LEA). The 19 regions and two autonomous provinces have the
responsibility to organize and deliver health services through local health units. Regions have
significant autonomy in determining the macro structure of their health systems. Local health units
are managed by a general manager appointed by the governor of the region, and deliver primary
care, hospital care, outpatient specialist care, public health care, and health care related to social
care.
MAIN POLICIES
Policy and planning frameworks are the responsibility of the national government through the
Ministry of Health, with an increasingly important role played by the Standing Conference on
Relations between the State, Regions and Autonomous Provinces through agreements knownas
“Pacts for Health” (Patti per la Salute), which are adopted every three years. Every year, the
Standing Conference on Relations between the State, Regions and Autonomous Provinces (with the
presidents of the regions and representatives from central government as its members) sets the
criteria (usually population size and age distribution) to allocate funding to Regions and set the
priorities. Local health units are funded mainly through capitated budgets.
The Conference on Relations between the State, Regions, and Autonomous Provinces, signed the 14
of April 2016 (Rep. 65/CSR), identified the projectual national priorities for 2016 and established a
new approach towards the projectual lines according to the new “Pact for Health” of 2014-2016. It is
emphasized the need for the joint commitment of the Government and the Regions in implementing
important and concrete measures of planning and reorganization of the health system, aiming to
increase its efficiency and to identify strategies for overcoming the differences between territorial
areas (health results, accessibility and quality of services).
STRATEGIES
An important goal in the recent history of Italian public health was achieved with the “Guadagnare
salute” (“Gaining health”) action plan, approved through a decree of the Prime Minister on 4 May
2007. “Gaining health: encouraging healthy choices” is an action plan whose main objectives are to
prevent and change unhealthy behavior and lifestyles; these are the main risk factors for major non-
communicable diseases, which have the highest epidemiological relevance and strongest impact on
public health: cardiovascular diseases, cancer, diabetes mellitus, obesity, chronic respiratory
pathologies, disorders of the muscle-skeletal and gastro-intestinal system, mental health problems.
This initiative, therefore, should be assessed both as a long-term investment to reduce the incidence
of chronic diseases on the national health system and on society, but also as regards its short-term
advantage of attempting to improve the citizens‘ lifestyle by immediately promoting healthy choices

LIFETIME IMPACT AND COST OF CHILDHOOD OBESITY IN EUROPE (PART 2) 63
and correct lifestyles (stop smoking, follow a correct diet, limit the alcohol intake and exercise
regularly). With this new culture of prevention, all individuals become protagonists and accountable
for the quality of their life.
The strategy of “Guadagnare salute” (a transversal government programme) is based on the four
changeable risk factors and major determining factors for the most frequent chronic diseases, by
identifying four subject areas (or specific programmes):
• promoting healthy eating patterns (as regards the risk factor “inappropriate diet”)
• counteracting smoking (as regards the “smoking” risk factor)
• counteracting alcohol abuse (as regards the “alcohol” risk factor)
• promoting physical activity (as regards the “sedentary lifestyle” risk factor).
“Gaining health” indicates strategies across the board, based on actions which involve several social
sectors and institutions, with specific actions to counteract smoking and alcohol abuse as well as to
promote physical activity and a healthy diet, through close cooperation among all institutions and
social organisations involved. Such an approach results from the awareness that most of the
effective actions to prevent risk factors and promote healthy lifestyles are implemented outside the
national health system. In order to act appropriately on the environment-related elements and
socio-economic causes of chronic diseases it is necessary to join forces, working together in
coordinated way.
With the ministerial decree of 26 April 2007 the former Ministry of Health established the “National
Platform on diet, physical activity and smoking” with the task of making suggestions and
implementing actions, in line with the "Gaining health" plan. The Platform is a three-year project
supervised by the Ministry of Health, involving representatives of the central authorities involved, of
the independent regional and provincial governments of Trento and Bolzano and of the associations
which signed the protocols of agreement.
The Platform involved:
• Ministry of Health
• Department for Family Policies of the Council of Ministers‘ Presidency
• Department for Rights and Equal Opportunities of the Council of Ministers‘ Presidency
• Department for Youth Policies and Sports of the Council of Ministers‘ Presidency
• Ministry for Agricultural, Food and Forestry Policies
• Ministry of Education
• Ministry for Economic Development
• Ministry for Economics and Finance
• Ministry of Transport

LIFETIME IMPACT AND COST OF CHILDHOOD OBESITY IN EUROPE (PART 2) 64
• Ministry for the Environment and Protection of Land and Sea
• Conference for Relations between State, independent Regional and Provincial Governments
of Trento and Bolzano
• National Association of Italian Municipalities (Anci )
• Advanced Health Institute (Iss )
• Advanced Institute for Prevention and Safety on the Workplace (Ispesl )
• National Research Institute on Food and Nutrition (Inran )
• Independent Regional and Provincial Government of Trento and Bolzano
• Trade associations in the food sector
• Consumers‘ associations
• The most representative national trade unions, which have signed specific protocols of
agreement with the Ministry of Health
• Associations of independently-chosen General Practitioners and Paediatricians.
FOOD-BASED DIETARY GUIDELINES - ITALY
The Italian National Research Institute on Food and Nutrition (INRAN, Istituto Nazionale di Ricerca
per gli Alimenti e la Nutrizione), now called CRA-NUT, is the institution leading the development and
revisions of the ‘Guidelines for healthy Italian food habits’ as one of its institutional tasks. The Italian
dietary guidelines are based on the Italian recommended dietary allowances (RDAs). The last version
of the RDAs was published in 2014 and the dietary guidelines were revised accordingly in 2017 by
experts from a wide variety of Italian institutions, including universities, research institutes and
scientific societies.
6.2 LOCAL EVIDENCE
6.2.1 Childhood Obesity / Overweight
Estimates from Italy were retrieved from 16 sources. Six are described here. The most important
source of information is the national surveillance system on childhood obesity, OKkio alla SALUTE,
which started in 2007 and has collected data on a sample of more than 45,000 children aged 8-9
years every 2 years (Binkin et al 2010; Spinelli et al 2012; 2015; Nardone et al., 2015). OKkio alla
SALUTE is part of the WHO/Europe Childhood Obesity Surveillance Initiative (COSI) and in 2016
showed a prevalence of 21.3% of overweight children aged 8 and 9 (not including obesity) and 9.3%
of obesity (using the IOTF cutoffs). Gender differences were not very high: 8.8% of girls and 9.7% of
boys were obese. Data show a large regional variation, as confirmed also in Turchetta et al.’s (2012)
systematic review of prevalence of overweight and obesity among children in Italy (aged 6-11,
studies published since 2000). The highest prevalence is found in the South and the lowest in the
North of Italy.

LIFETIME IMPACT AND COST OF CHILDHOOD OBESITY IN EUROPE (PART 2) 65
There are no nationally representative estimates of overweight and obesity among preschool
children. However, a study of two regions of children aged 2 to 6 from Northeast and Southern Italy
(Verona and Messina, surveyed in 2002), overweight and obesity prevalence was estimated at about
23% in boys and 28% in girls (Maffeis et al., 2006).
Trends
Information on trends in prevalence of overweight and obesity in children comes from two sources:
OKkio alla SALUTE (which informs COSI), where prevalence among 8 and 9 year-olds in 2008, 2010,
2012 and 2014 have been compared (Spinelli et al., 2015), and a study examining trends in
overweight and obesity among children and adolescents in Tuscany (Lazzeri et al., 2015).
Spinelli et al. (2015) reported small but statistically significant decreases between 2008 and 2014 in
the prevalence of both overweight (from 23.2% to 20.9%) and obesity (from 12.0% to 9.8%) among 8
and 9 year-olds in the nationally representative OKkio alla SALUTE study (IOTF criteria). In the study
of children and adolescents in Tuscany (2002-2006), results were mixed, depending on the age-
group considered. Prevalence of overweight and obesity decreased only among 11 year-olds. Small
increases were recorded in children aged 9 (from 31.7% to 33.4%) and 13 (from 16.8% to 17.9%),
with the largest increases found among 15 year-olds (from 13.3% to 19.7%) (IOTF cut-offs).
In summary, there is evidence in Italy for a small decrease in the prevalence of both overweight and
obesity rates among children since 2008. Evidence for trends in adolescent overweight and obesity
are limited and provide mixed results.
6.2.2 Childhood Impacts
Most of the sources from Italy – 14 of 15 – examined aspects of cardio-metabolic risk factors. Eight
of these looked at the metabolic syndrome (DiBonito et al., 2015; Capizzi et al., 2011; Caserta et al.,
2010; Valerio et al., 2013; Invitti et al., 2005; Calcaterra et al., 2008; Invitti et al., 2003; Ianuzzi et al.,
2004). For example, in a sample of children aged 0-14 years, Calcaterra et al. (2008) found that the
prevalence of metabolic syndrome (i.e. three or more of BMI > 97th percentile, triglyceride levels >
95th percentile, high density lipoprotein (HDL) cholesterol level < 5th percentile, systolic or diastolic
Blood pressure > 95th percentile, and impaired glucose tolerance) was 0% in normal and overweight
children, 12.0% in moderately obese and 31.1% in severely obese children. Ianuzzi et al. (2004)
reported that, among children/adolescents aged 6-14 years, obese children had significantly higher
BP and plasma concentrations of tryglycerides, cholesterol, glucose, insulin, HOMA and C-reactive
protein than healthy weight children. Carotid intima-media thickness (CIMT) was also significantly
higher in obese children.

LIFETIME IMPACT AND COST OF CHILDHOOD OBESITY IN EUROPE (PART 2) 66
A further four papers examined blood pressure (Turconi et al., 2006, 2007; Barba et al., 2006;
Genovesi et al., 2005). For example, Barba et al. (2006) reported that BMI and waist circumference
were independently associated with systolic BP, after adjusting for parental education and children's
levels of physical activity (sample aged 6-11 years).
Bruno et al. (2010) examined trends in type 1 diabetes among children aged 0-14 years from 1990-
2003 and found that the incidence rate was 12.26 per 100,000 person years and significantly higher
in boys (13.13) than in girls (11.35). Incidence rates increased linearly by 15, 27, 35, and 40% across
four successive birth cohorts studied. Note that this trend is not empirically linked with trends in
prevalence of overweight or obesity in the article. In a sample of obese children and adolescents
aged 3-18 years, Brufani et al. (2010) found that glucose metabolism abnormalities were present in
12.4%. Impaired glucose tolerance (IGT) was the most frequent alteration (11.2%), with a higher
prevalence in adolescents than in children (14.8 vs. 4.1%).
The final source from Italy considered here examined pulmonary/aerobic function. Eight per cent of
all children (aged 6-7 years) reported current wheezing and 6.7% reported current asthma. Elevated
BMI (comparing highest quintile to others) was significantly associated with both current wheeze
(adjusted odds ratio=1.47) and current asthma (adjusted odds ratio=1.61) (Corbo et al., 2008).
6.2.5 Inequalities
Nine studies from Italy examined inequalities. There is strong and consistent evidence for regional
variation in the prevalence of overweight and obesity. Prevalence in the south is much higher than in
the north. Generally, prevalence tends to be highest in Campania and lowest in Bolzano (e.g. Spinelli
et al., 2014). Binkin et al. (2008) reported that this regional variation is not accounted for by
differences in levels of maternal education or employment, nor have any variations by urban/rural
location been reported (Spinelli et al., 2009, 2012). There is some evidence of higher prevalence of
overweight and obesity among boys, though this is not entirely consistent (Spinelli et al. 2009, 2012;
Lombardo et al., 2014). Research from Italy also confirms associations between parental education
and parental BMI and child prevalence of overweight and obesity (as well as rates of weight gain in
children over time: Lombardo et al., 2014; Nardone et al., 2015; Lazzeri et al., 2014; Valerio et al.,
2013). Prevalence is also higher among Italian-born than foreign-born children (Spinelli et al., 2012).
6.3 DATA DOCUMENTATION
Phase 1: Data Collation
20171130 Phase 1 (Italy) Data Calculations (1).xlsx
20171130 Phase 1 (Italy) Data Calculations (2).xlsx

LIFETIME IMPACT AND COST OF CHILDHOOD OBESITY IN EUROPE (PART 2) 67
20171130 Phase 1 (Italy) Data Collation Workbook.xlsx
20171130 Phase 1 (Italy) Data Sources.xlsx
Phase 2: Pre-simulation Data Processing
20171130 Phase 2 (Italy) Data Documentation (Part 1).xlsx
20171130 Phase 2 (Italy) Data Documentation (Part 2).docx
Phase 5: Post Simulation Review
20171130 Phase 5 (Italy) Model Outputs Workbook - DISC.xlsm
20171130 Phase 5 (Italy) Model Outputs Workbook - UNDISC.xlsm
Table. Phase 1: Italian Disease Data Quality Scores (Initial model under review)
1 2 3 4 5 6
No acceptable
data
Must be
estimated
from other
data1
International
proxy
"Approximate"
data only2
Not
applicable
(non-fatal
disease)
Acceptable
data
1. For disease parameters: prevalence, incidence, survival mortality)
2. "Approximate" data only:
ICD code mismatch
Hospital data used for prevalence or incidence
Self-reported BMI
Regional (sub-national) data
Adult diseases

LIFETIME IMPACT AND COST OF CHILDHOOD OBESITY IN EUROPE (PART 2) 68
Disease Mortality Incidence Survival Prevalence
Oesophageal Cancer
EUROSTAT Globocan Eurocare 5 Database
Globocan
Colorectal Cancer
C18 to C21 EUROSTAT
C18 to C21 Globocan
Eurocare 5 Database
C18 to C21 Globocan
Liver Cancer
C22 EUROSTAT
C22 Globocan
Eurocare 5 Database
C22 Globocan
Gallbladder Cancer
C23 to C24 Globocan
C23 to C24 Globocan
Eurocare 5 Database
Globocan
Pancreatic cancer
EUROSTAT Globocan Eurocare 5 Database
Globocan
Cancer-Breast, post-menopausal (females only aged 50+)
EUROSTAT Globocan Eurocare 5 Database
Globocan
Endometrial cancer
EUROSTAT C54 Globocan
Eurocare 5 Database
C54 Globocan
Ovarian Cancer
EUROSTAT Globocan Eurocare 5 Database
Globocan
Prostate cancer (males only)
EUROSTAT Globocan Eurocare 5 Database
Globocan

LIFETIME IMPACT AND COST OF CHILDHOOD OBESITY IN EUROPE (PART 2) 69
Kidney Cancer
EUROSTAT C64 to C66 Globocan
Eurocare 5 Database
Globocan
Urothelial Cancer (males only)
EUROSTAT Globocan Eurocare 5 Database
Globocan
Thyroid cancer
EUROSTAT Globocan Eurocare 5 Database
Globocan
Asthma
J45 to J46 EUROSTAT
Drug Proxy
calculated from prevalence and mortality
EHIS
Chronic Back Pain
ISTAT Calculate incidence from prevalence
EHIS - lower back pain
Deep Vein Thrombosis
ISTAT EU/UK Proxy Zero deaths Calculated from GP cost data
Gallbladder Disease
ISTAT Hospital Discharge Data
Hospital Discharge Data
Gout
M10 WHO Global Health Estimates
Use hospital admissions data??
Calculated from GP cost data

LIFETIME IMPACT AND COST OF CHILDHOOD OBESITY IN EUROPE (PART 2) 70
Hypertension
Not required for the model
Calculate incidence from prevalence
Not required for the model
ISTAT
Hypertension in pregnancy
ISTAT
Use hospital admissions data - this has not been calculated
Zero deaths Calculated from GP cost data
Ischaemic Heart Disease
Excludes I46 & I50 EUROSTAT
Calculate incidence from prevalence
calculated from prevalence and mortality
EHIS
Multiple Sclerosis
WHO Global Health Estimates
Atlas of MS
calculated from prevalence and mortality
Atlas of MS
Non-alcoholic fatty liver disease (NAFLD)
ISTAT
Use hospital admissions data - this has not been calculated
Calculated from GP cost data

LIFETIME IMPACT AND COST OF CHILDHOOD OBESITY IN EUROPE (PART 2) 71
Osteoarthritis – Gonarthrosis Knee Pain
ISTAT
Use hospital admissions data- this has not been calculated
Calculated from GP cost data
Polycystic Ovarian Syndrome
ISTAT
Use hospital admissions data - this has not been calculated
Zero deaths Calculated from GP cost data
Psoriasis
ISTAT
Use hospital admissions data - this has not been calculated
Calculated from GP cost data
Pulmonary Embolus
ISTAT EU/UK/Spain Proxy
Zero deaths Calculated from GP cost data
Stroke
I60 to I69 EUROSTAT
Calculate incidence from prevalence
calculated from prevalence and mortality
EHIS
Type 2 Diabetes
Not required for the model
Calculate incidence from prevalence
Not required for the model
ISTAT PASSI - age 18 to 69

LIFETIME IMPACT AND COST OF CHILDHOOD OBESITY IN EUROPE (PART 2) 72
Childhood diseases
Diseases Mortality Incidence Survival Prevalence
Wheezing disorders
not available not available not available Preschool asthma in Italy
Metabolic syndrome
not available not available not available not available
Hyperlipidemia not available not available not available not available
Depression Use drugs data Use drugs data
Obstructive sleep apnoea
Calculate incidence from prevalence
Prevalence of Obstructive Sleep Apnoea Syndrome in a Cohort of 1,207 Children of Southern Italy https://www.ncbi.nlm.nih.gov/pubmed/11742924

LIFETIME IMPACT AND COST OF CHILDHOOD OBESITY IN EUROPE (PART 2) 73
High blood pressure
Not required for the model
Calculate incidence from prevalence
ISTAT
Type 2 diabetes Not required for the model
Calculate incidence from prevalence
ISTAT

LIFETIME IMPACT AND COST OF CHILDHOOD OBESITY IN EUROPE (PART 2) 74
Asthma J45 to J46 EUROSTAT
Anti-asthma medication prescribing to children in the Lombardy Region of Italy: chronic versus new users http://bmcpulmmed.biomedcentral.com/articles/10.1186/1471-2466-11-48
Anti-asthma medication prescribing to children in the Lombardy Region of Italy: chronic versus new users http://bmcpulmmed.biomedcentral.com/articles/10.1186/1471-2466-11-48 Preschool asthma in Italy: Prevalence, risk factors and health resource utilization http://www.resmedjournal.com/article/S0954-6111(08)00257-6/abstract
Non-alcoholic fatty liver disease
ISTAT
Use hospital admissions data- this has not been calculated
Global Proxy
Musculoskeletal pain
Use hospital admissions data - this has not been calculated
Use hospital admissions data - this has not been calculated

LIFETIME IMPACT AND COST OF CHILDHOOD OBESITY IN EUROPE (PART 2) 75
6.4 DATA
Phase 1: Data Collation
20171130 Phase 1 (Italy) Data Collation Workbook.xlsx
Phase 2: Pre-simulation Data Processing
Data not available (see Data Documentation files)
Phase 3 and 4: Simulation Modelling and Cost Estimation
20171130 Phase 3&4 (Italy) Initial Model Output Workbook.xlsx
Phase 5: Post Simulation Review
20171130 Phase 5 (Italy) Initial Resturctured Model Output Workbook.xlsx
20171130 Phase 5 (Italy) Initial Core tables and Graphs Workbook.xlsx
Phase 6: Reporting
20171130 (Italy) Final Restructured Model Output Workbook.xlsx
20171130 (Italy) Final Combined Model Outputs SAS Dataset.ssd
20171130 (Italy) Final Combined Model Outputs Worksheet.xlsx
20171130 (Italy) Final Core Tables and Graphs Workbook.xlsx
UNDISCOUNTED and DISCOUNTED versions of the data files are available
As a result of the feedback loops include in the workflow; the software was sometimes rerun with
corrected inputs. Only the final model outputs from the simulation software are listed.
ITALIAN REFERENCES
Barba, G., Troiano, E., Russo, P., Strazzullo, P., Siani, A., on behalf of the ARCA Project study group (2006). “Body mass, fat distribution and blood pressure in Southern Italian children: Results of the ARCA project.” Nutrition, Metabolism & Cardiovascular Diseases 16: 239-248.
Binkin, N., Fontana, G., Lamberti, A., Cattaneo, C., Baglio, G., Perra, A., & Spinelli, A. (2010). “A national survey

LIFETIME IMPACT AND COST OF CHILDHOOD OBESITY IN EUROPE (PART 2) 76
of the prevalence of childhood overweight and obesity in Italy.” Obesity Reviews 11: 2-10.
Brufani, C., Ciampalini, P., Grossi, A., Fiori, R., Fintini, D., Tozzi, A., Cappa, M., & Barbetti F. (2010). “Glucose tolerance status in 510 children and adolescents attending an obesity clinic in Central Italy.” Pediatric Diabetes 11: 47–54.
Bruno, G., Maule, M., Merletti, F., Novelli, G., Falorni, A., Ianilli, A., Iughetti, L., Altobelli, E., d’Annunzio, G., Piffer, S., Pozzilli, P., Iafusco, D., Songini, M., Roncarolo, F., Toni, S., Carle, F., Cherubini, V., & the RIDI Study Group (2010). “Age-Period-Cohort Analysis of 1990–2003 Incidence Time Trends of Childhood Diabetes in Italy: The RIDI Study.” Diabetes 59: 2281-2287.
Calcaterra, V., Klersy, C., Muratori, T., Telli, S., Caramagna, C., Scaglia, F., Cisternino, M., & Larizza, D. (2008). “Prevalence of metabolic syndrome (MS) in children and adolescents with varying degrees of obesity.” Clinical Endocrinology 68: 868-872.
Capizzi, M., Leto, G., Petroni, A., Zampetti, S., Papa, R.E., Osimani, M., Spoletini, M., Lenzi, A., Osborn, J., Mastantuono, M., Vania, A., & Buzzetti, R. (2011). “Wrist Circumference Is a Clinical Marker of Insulin Resistance in Overweight and Obese Children and Adolescents.” Circulation 128: 1757-1762.
Caserta, C.A., Pendino, G.M., Alicante, S., Amante, A., Amato, F., Fiorillo, M., Mesisneo, A., Polito, I., Surace, M., Surace, P., Vacalebre, C., Zuin, M., Cotichini, R., Marcucci, F., Rosmini, F., & Mele, A. (2010). “Body mass index, cardiovascular risk factors, and carotid intima-media thickness in a pediatric population in Southern Italy.” Journal of Pediatric Gastroenterology & Nutrition 51(2): 216-220.
Cattaneo A1, Monasta L, Stamatakis E, Lioret S, Castetbon K, Frenken F, Manios Y, Moschonis G, Savva S, Zaborskis A, Rito AI, Nanu M, Vignerová J, Caroli M, Ludvigsson J, Koch FS, Serra-Majem L, Szponar L, van Lenthe F, Brug J (2010). Overweight and obesity in infants and pre-school children in the European Union: a review of existing data. Obesity Review 11(5):389-98.
Corbo, G.M., Forastiere, F., de Sario, M., Brunetti, L., Bonci, E., Bugiani, M., Chellini, E., la Grutta, S., Migliore, E., Pistelli, R., Rusconi, F, Russo, A., Simoni, M., Talassi, F., Galassi, C., & the Sidria-2 Collaborative Group (2008). “Wheeze and Asthma in Children: Associations With Body Mass Index, Sports, Television Viewing, and Diet.” Epidemiology 19(5): 747-755.
Di Bonito, P., Valerio, G., Grugni, G., Licenziati, M.R., Maffeis, C., Manco, M., Miraglia del Giudice, E., Pacifico, L., Pellegrin, M.C., Tomat, M., & Baroni, M.G. for the CARITALY Study Group (2015). “Comparison of non-HDL-cholesterol versus triglycerides-to-HDL-cholesterol ratio in relation to cardiometabolic risk factors and preclinical organ damage in overweight/obese children: The CARITALY Study.” Nutrition, Metabolism and Cardiovascular Diseases 25: 489-494.
Genovesi, S., Giussani, M., Federico, P., Vigorita, F., Arcovio, C., Cavuto, S., & Stella, A. (2005). “Results of blood pressure screening in a population of school-aged children in the province of Milan: role of overweight.” Journal of Hypertension 23(3): 493-497.
Ianuzzi, A., Romano, M.L., Licenziati, M.R., Panico, S., Acampora, C., Rubba, P., Salvatore, V., Trevisan, M., & Auriemma, L. (2004). “Increased carotid intima-media thickness and stiffness in obese children.” Diabetes Care 27(10): 2506-2508.
Invitti, C., Morabito, F., Guzzaloni, G., Veberti, G., & Gilardini, L. (2003). “Prevalence and Concomitants of Glucose Intolerance in European Obese Children and Adolescents.” Diabetes Care 26(1): 118-124.
Invitti, C., Gilardinia, L., Pontiggia, G., Morabito, F., Mazzilli, G., & Viberti, G., (2005). “Period prevalence of abnormal glucose tolerance and cardiovascular risk factors among obese children attending an obesity centre in Italy.” Nutrition, Metabolism & Cardiovascular Diseases 16: 256-262.
Lazzeri, G., Giacchi, M.V., Spinelli, A., Pammoli, A., Dalmasso, P., Nardone, P. Lamberti, A., & Cavallo, F. (2014). “Overweight among students aged 11-15 years and its relationship with breakfast, area of residence, and parents’ education: Results from the Italian HBSC 2010 cross-sectional study.” Nutrition Journal 13: 69.
Lazzeri, G., Panatto, D., Pammolli, A., Azzolini, E., Simi, R., Meoni, V., Giacchi, M.V., Amicizia, D., & Gasparini, G. (2015). "Trends in overweight and obesity prevalence in Tuscan schoolchildren (2002-2012)." Public Health Nutrition 18(17): 3078-3085.
Lombardo, F.L., Spinelli, A., Lazzeri, G., Lamberti, A., Mazzarella, G., Nardone, P. Pilato, V., Buoncristiano, M., & Caroli, M. for the OKkio alla SALUTE Group 2010 (2014). “Severe obesity prevalence in 8- to 9-year-old Italian children: a large population-based study.” European Journal of Clinical Nutrition 1-6.
Maffeis, C., Consolaro, A., Cavarzere, P., Chini, L., Banzato, C., Grezzani, C., Silvagni, D., Salzano, D., de Luca, F., & Tató, L. (2006). “Prevalence of overweight and obesity in 2- to 6-year-old Italian children.” Obesity 14 765-769.
Nardone, P., Spinelli, A., Lauria, L., Buoncristiano, M., Bucciarelli, M., Galeone, D. & Gruppo OKkio alla SALUTE

LIFETIME IMPACT AND COST OF CHILDHOOD OBESITY IN EUROPE (PART 2) 77
(2015). “[Sociodemographic variation in childhood overweight and obesity in Italy in 2014]”. Epidemiologia e Prevenzione 39(1):64.
Spinelli, A., Lamberti, A., Baglio, G., Andreozzi, S., & Galeone, D. (2009). OKkio alla SALUTE: sistema di sorveglianza su alimentazione e attività fisica nei bambini della scuola primaria. Risultati 2008. Roma: Istituto Superiore di Sanità. (Rapporti ISTISAN 09/24).
Spinelli, A., Lamberti, A., Nardone, P., Andreozzi, S., & Galeone, D. (2012). Sistema di sorveglianza OKkio alla SALUTE: Risultati 2010. Roma: Istituto Superiore di Sanità. (Rapporti ISTISAN 12/14).
Spinelli, A., Nardone, P., Buoncristiano, M., Lauria, L., Andreozzi, S., & Galeone, D. (2014). Sistema di sorveglianza OKkio alla SALUTE: dai risultati 2012 alle azioni. Roma: Istituto Superiore di Sanità. (Rapporti ISTISAN 14/11).
Spinelli, A., Nardone, P., Buoncristiano, M., Lauria, L., Andreozzi, S., Galeone, D. & Gruppo OKkio alla SALUTE (2015). [Italy 2014: childhood obesity is decreasing]. Epidemiologia e Prevenzione 39(1):63.
Turchetta, F., Gatto, G., Romano, F., Boccia, A., & La Torre, G. (2012). "Systematic review and meta-analysis of the prevalence of overweight and obesity among school-age children in Italy." Epidemiologia e Prevenzione 36(3-4): 188-195.
Turconi, G., Guarcello, M., Maccarini, L., Bazzano, R., Zaccardo, A., & Roggi, C. (2006). “BMI values and other anthropometric and functional measurements as predictors of obesity in a selected group of adolescents.” European Journal of Nutrition 45: 136-143.
Turconi, G., Maccarini, L., Bazzano, R., & Roggi, C. (2007). “Overweight and blood pressure: results from the examination of a selected group of adolescents in northern Italy.” Public Health Nutrition 11(9): 905-913.
Valerio, G., Maffeis, C., Balsamo, A., Miraglia Del Giudice, E., Brufani, C., Grugni, G., Licenziati, M.R., Brambilla, P., & Manco, M., on the behalf of the Childhood Obesity Group of the Italian Society of Pediatric Endocrinology and Diabetology (2013). “Severe Obesity and Cardiometabolic Risk in Children: Comparison from Two International Classification Systems.” PLoS One 8(12): e83793.

LIFETIME IMPACT AND COST OF CHILDHOOD OBESITY IN EUROPE (PART 2) 78
7. NORTHERN IRELAND
See Chapter 5 for other Northern Ireland context and evidence.
7.1 DATA DOCUMENTATION
Phase 1: Data Collation
20171130 Phase 1 (Northern Ireland) Data Calculations.xlsx
20171130 Phase 1 (Northern Ireland) Data Calculations (2).xlsx
20171130 Phase 1 (Northern Ireland) Data Collation Workbook.xlsx
20171130 Phase 1 (Northern Ireland) Data Sources.xlsx
Phase 2: Pre-simulation Data Processing
20171130 Phase 2 (Northern Ireland) Data Documentation (Part 1).xlsx
20171130 Phase 2 (Northern Ireland) Data Documentation (Part 2).docx
Phase 5: Post Simulation Review
20171130 Phase 5 (Northern Ireland) Model Outputs Workbook - DISC.xlsm
20171130 Phase 5 (Northern Ireland) Model Outputs Workbook - UNDISC.xlsm
Table. Phase 1: Northern Ireland Disease Data Quality Scores
1 2 3 4 5 6
No acceptable
data
Must be
estimated
from other
data1
International
proxy
"Approximate"
data only2
Not
applicable
(non-fatal
disease)
Acceptable
data
1. For disease parameters: prevalence, incidence, survival mortality)
2. "Approximate" data only:
ICD code mismatch

LIFETIME IMPACT AND COST OF CHILDHOOD OBESITY IN EUROPE (PART 2) 79
Hospital data used for prevalence or incidence
Self-reported BMI
Regional (sub-national) data
Adult diseases
DISEASE MORTALITY INCIDENCE SURVIVAL PREVALENCE
Oesophageal Cancer NISRA NICR NICR NICR
Colorectal Cancer NISRA NICR NICR NICR
Liver Cancer
NISRA
NICR C22.0 not available from NICR - adjusted C22 using cancer data from RoI NICR NICR
Gallbladder Cancer NISRA NICR NICR NICR
Pancreatic cancer NISRA NICR NICR NICR
Cancer-Breast, post-menopausal NISRA NICR NICR NICR
Endometrial cancer NISRA NICR NICR NICR
Ovarian Cancer NISRA NICR NICR NICR
Prostate cancer (males only) NISRA NICR NICR NICR
Kidney Cancer NISRA NICR NICR
NI QOF - Chronic kidney disease
Urothelial Cancer (males only) NISRA NICR NICR NICR
Thyroid cancer NISRA NICR NICR data request to NICR
Type 2 Diabetes
Not required for the model
Calculate incidence from prevalence
Not required for the model
RoI Proxy
Polycystic Ovarian Syndrome NISRA
not available not available not available
Multiple Sclerosis NISRA
UK Proxy not available UK Proxy

LIFETIME IMPACT AND COST OF CHILDHOOD OBESITY IN EUROPE (PART 2) 80
Stroke NISRA
NI hosp data - G45, I61, I62, I63, I64
compute from prevalence and mortality
NI QOF - stroke or TIA
Hypertension
Not required for the model
Calculate incidence from prevalence
Not required for the model
NI QOF
Ischaemic Heart Disease
NISRA Calculate incidence from prevalence
compute from prevalence and mortality
NI QOF - CHD, heart failure, Peripheral Arterial Disease, Atrial Fibrillation
Deep Vein Thrombosis NISRA
UK Proxy not available UK Proxy (compute from incidence)
Asthma NISRA
Calculate incidence from prevalence
not available NI QOF - asthma, COPD
Non-alcoholic fatty liver disease (NAFLD) NISRA
not available not available not available
Gallbladder Disease NISRA
NI hosp data not available NI hosp data
Psoriasis NISRA
UK Proxy not available UK Proxy (compute from incidence)
Gout NISRA UK Proxy not available UK Proxy
Osteoarthritis – Gonarthrosis Knee Pain NISRA
Calculate incidence from prevalence
not available
NI QOF -Rheumatoid arthritis
Chronic Back Pain NISRA
Calculate incidence from prevalence
not available NIHSWB - self-reported
Hypertension in pregnancy
not available not available
not available not available
Pulmonary Embolus
NISRA UK Proxy not available UK Proxy (compute from incidence)
Childhood diseases
DISEASE MORTALITY INCIDENCE SURVIVAL PREVALENCE
Wheezing disorders
not available not available not available not available
Metabolic syndrome
not available not available not available not available
Hyperlipidemia
not available not available not available not available
Depression NISRA Calculate incidence from prevalence
not available RoI proxy - hospital attendance
Musculoskeletal pain
NISRA Calculate incidence from prevalence
not available RoI proxy - PRIME-C study
Obstructive NISRA Calculate incidence not available RoI proxy

LIFETIME IMPACT AND COST OF CHILDHOOD OBESITY IN EUROPE (PART 2) 81
sleep apnoea
from prevalence
High blood pressure
Not required for the model
Calculate incidence from prevalence
Not required for the model
Wales proxy
Type 2 diabetes
Not required for the model
Calculate incidence from prevalence
Not required for the model
England Proxy
Asthma J45 to J46 EUROSTAT
Calculate incidence from prevalence
not available PCRS data as a proxy
Non-alcoholic fatty liver disease
NISRA Calculate incidence from prevalence
not available http://bmcpediatr.biomedcentral.com/articles/10.1186/1471-2431-13-40
7.2 DATA
Phase 1: Data Collation
20171130 Phase 1 (Northern Ireland) Data Collation Workbook.xlsx
Phase 2: Pre-simulation Data Processing
Data not available (see Data Documentation files)
Phase 3 and 4: Simulation Modelling and Cost Estimation
20171130 Phase 3&4 (Northern Ireland) Initial Model Output Workbook.xlsx
Phase 5: Post Simulation Review
20171130 Phase 5 (Northern Ireland) Initial Resturctured Model Output Workbook.xlsx
20171130 Phase 5 (Northern Ireland) Initial Core tables and Graphs Workbook.xlsx
Phase 6: Reporting
20171130 (Northern Ireland) Final Restructured Model Output Workbook.xlsx
20171130 (Northern Ireland) Final Combined Model Outputs SAS Dataset.ssd
20171130 (Northern Ireland) Final Combined Model Outputs Worksheet.xlsx
20171130 (Northern Ireland) Final Core Tables and Graphs Workbook.xlsx
UNDISCOUNTED and DISCOUNTED versions of the data files are available

LIFETIME IMPACT AND COST OF CHILDHOOD OBESITY IN EUROPE (PART 2) 82
As a result of the feedback loops include in the workflow; the software was sometimes rerun (this
occourred infor Northern Ireland) with corrected inputs. Only the final model outputs from the
simulation software are listed.
Table is a profile of children, age 0-17, living in Northern Ireland in 2015. Most of the children are
healthy weight (74.2%), with 25.8% overweight or obese (ow/ob). A trend toward increasing ow/ob
with increasing age begins with the 0-5 age group and continues throughout adulthood, also
beginning with the 0-5 age group, increasing proportions of ow/ob females compared to males that
continues throughout adulthood.
Table. Phase 5: Profile of Northern Ireland children
IRELAND
AGE SEX BMI AT AGE 18 NUMBER PERCENTAGE
(0-17 YEARS) PERSONS OBESE/OVERWEIGHT 111,875 25.8%
HEALTHY WEIGHT 320,916 74.2%
TOTAL 432,791 100.0%
FEMALES OBESE/OVERWEIGHT 60,735 28.8%
HEALTHY WEIGHT 149,981 71.2%
TOTAL 210,716 100.0%
MALES OBESE/OVERWEIGHT 51,140 23.0%
HEALTHY WEIGHT 170,935 77.0%
TOTAL 222,075 100.0%
0-5 YEARS PERSONS OBESE/OVERWEIGHT 33,600 22.4%
HEALTHY WEIGHT 116,586 77.6%
TOTAL 150,187 100.0%
FEMALES OBESE/OVERWEIGHT 19,561 26.6%
HEALTHY WEIGHT 53,867 73.4%
TOTAL 73,429 100.0%
MALES OBESE/OVERWEIGHT 14,039 18.3%
HEALTHY WEIGHT 62,719 81.7%
TOTAL 76,758 100.0%
6-11 YEARS PERSONS OBESE/OVERWEIGHT 35,254 24.8%
HEALTHY WEIGHT 106,891 75.2%
TOTAL 142,145 100.0%
FEMALES OBESE/OVERWEIGHT 19,332 28.0%
HEALTHY WEIGHT 49,739 72.0%
TOTAL 69,071 100.0%
MALES OBESE/OVERWEIGHT 15,922 21.8%
HEALTHY WEIGHT 57,152 78.2%
TOTAL 73,074 100.0%
12-17 YEARS PERSONS OBESE/OVERWEIGHT 43,021 30.6%

LIFETIME IMPACT AND COST OF CHILDHOOD OBESITY IN EUROPE (PART 2) 83
HEALTHY WEIGHT 97,438 69.4%
TOTAL 140,459 100.0%
FEMALES OBESE/OVERWEIGHT 21,842 32.0%
HEALTHY WEIGHT 46,375 68.0%
TOTAL 68,217 100.0%
MALES OBESE/OVERWEIGHT 21,179 29.3%
HEALTHY WEIGHT 51,064 70.7%
TOTAL 72,243 100.0%

LIFETIME IMPACT AND COST OF CHILDHOOD OBESITY IN EUROPE (PART 2) 84
8. PORTUGAL
8.1 LOCAL CONTEXT
In Portugal, the Ministry of Health (MoH) is responsible for the development of health policies and their evaluation. Among the institutions administrated by the MoH, the Directorate General of Health (DGH) plans, regulates, coordinates and supervises all health promotion and disease prevention activities and define technical conditions for proper provision of health care. DGH is also responsible for public health programmes, quality and epidemiological surveillance, health statistics reports and studies and the design and implementation of the National Health Plan.
The main function of the MoH is the regulation, planning and management of the National Health Service (NHS). The NHS is a structure through which the Portuguese State assures the constitutional right to health to all citizens of Portugal. It integrates all health care, from health promotion and surveillance to disease prevention, diagnosis, treatment and medical and social rehabilitation. Regional Health Administrations (RHAs) are responsible for the implementation of national health policies and the management of the NHS at regional level. Under RHAs authority and administration are the health care units: Hospitals and Groups of Health Centres, a set of functional units that ensure the provision of primary health care to a population of a geographical area.
Beyond the National Health Plan, General-Directorate of Health (DGH) is also responsible for the
design and implementation of the National Priority Programmes, among which we highlight the
following examples, that are somehow related to nutrition and obesity:
National Programme for the Promotion of Healthy Eating1,2
National Programme for the Promotion of Physical Activity
National Programme for Diabetes
National Programme for Cerebrum and Cardiovascular Diseases
National Programme for Oncological Diseases
National Programme for Respiratory Diseases
National Programme for Mental Health
The National Health Institute Doctor Ricardo Jorge (INSA) is a public organization of the Ministry of Health endowed with scientific, technical, administrative, financial and property of its own. INSA has operating units at its headquarters in Lisbon, two centers in Porto (Centre for Public Health Dr. Gonçalves Ferreira and Medical Center of Genetics Jacinto Magalhães) and Águas de Moura (Centre for Vectors and Infectious Diseases Dr. Francisco Cambournac). INSA is organized in technical and scientific terms in six major departments: • Food and Nutrition Department • Infectious Diseases Department • Epidemiology Department • Human Genetics Department • Health Promotion and non-Communicable Disease Prevention • Environmental Health Department All operative units composing the departments develop multidisciplinary programmes in Public Heath areas, namely performing R&D, health monitoring, training, laboratory external quality assessment and general health services. INSA is responsible for National Health Plan evaluation.

LIFETIME IMPACT AND COST OF CHILDHOOD OBESITY IN EUROPE (PART 2) 85
Other programmes designed and implemented by DGH are closely related to the nutritional status of
children and childhood obesity:
National Programme for Child and Youth’s Health
National Programme for Oral Health
National Programme of School Health
Other institutions out of the health sector also contribute for health promotion and other activities
of the health system, namely in the nutrition and obesity field (e.g. Nutritionists Councils;
Municipalities; Portuguese Association of Nutritionists, Private Social Solidarity Institutions;
Portuguese Association Against Childhood Obesity; Association Of Obese And Ex-Obese Patients In
Portugal; Universities.
MAPICO (Mapping and Dissemination of Good Practices in Community Intervention Projects in the Area of Preventing Obesity and Reducing Prevalence of Pre-Obesity and Infant Obesity in Portugal) is a project developed in the scope of the National Programme for the Promotion of Healthy Eating. The main objective of this project is to carry out a "mapping" of community intervention programs aiming to prevent obesity at the level of primary health care services and also in Portugal schools. In the course of this project, it has been developed a national registry of these interventions, with the aim of disseminating good practices and establishing a national benchmark. (Table 1)
The National Programme for the Promotion of Healthy Eating (PNPAS) was approved in 2012, and has five main goals: (i) to increase knowledge about the food intake of the Portuguese population and about its determinants and consequences; (ii) to modify the availability of certain foods (high in sugar, salt and fat), in schools, workplaces and public spaces; (iii) to inform and empower the population for the purchase, preparation and storage of healthy food, especially the most vulnerable groups; (iv) to identify and promote cross- sectoral actions that encourage the consumption of foods of good nutritional quality in an articulate and integrated way with other sectors, namely agriculture, sport, environment, education, social security and local authorities; and (v) to improve the qualifications and conduct of the different professionals who, owing to their roles, may influence nutritional knowledge, attitudes and behaviours
1.
“The design of PNPAS followed the latest strategic lines suggested by World Health Organization and the European Commission, proposing a cross- sectoral mix of interventions to ensure physical and economic access to healthy eating by creating healthy environments and empowering individuals and communities
1.”

LIFETIME IMPACT AND COST OF CHILDHOOD OBESITY IN EUROPE (PART 2) 86
Table National registry of community intervention programs aiming to prevent obesity (MAPICO)

LIFETIME IMPACT AND COST OF CHILDHOOD OBESITY IN EUROPE (PART 2) 87

LIFETIME IMPACT AND COST OF CHILDHOOD OBESITY IN EUROPE (PART 2) 88
8.2 LOCAL EVIDENCE
8.2.1 Overweight / Obesity
Estimates for pre-obesity and obesity prevalence from Portugal were retrieved from 17 sources and
data are described and analysed here.
Adult
The oldest pre-obesity and obesity prevalence data available for population resident in Portugal
come from a study that dates to 1998/99. It is the National Health Survey 1998/99 that was carried
out in the mainland of Portugal with a representative sample of the adult population aged 18 or
over. Weight and height data were self-reported and pre-obesity and obesity prevalence were,
respectively, 20.3% and 12.9% for men and 16.2% and 14.6% for women 3,4.
In the following National Health Survey, carried out in 2005/06, the prevalence of pre-obesity and
obesity among adult population were, respectively, 20.8% and 16% for men and 16.6% and 17% for
women. This survey included population resident in Portugal (mainland and archipelagos of Madeira
and Azores) and weight and height data were equally self-reported 5.
The last National Health Survey was carried out in 2015 with a representative sample of adult
population from 25 to 74 years old living in Portugal (mainland and islands). Weight and height were
measured and results show that pre-obesity and obesity prevalence more than doubled compared
with previous surveys, being, respectively, 45.5% and 25% for men and 33.2 and 32% for women 6.
Despite this important increase in the prevalence of pre-obesity and obesity in the adult population
resident in Portugal shoed by National Health Surveys, it is important to consider the methodological
differences of these studies.
The other three epidemiological studies considered in the model presented the following results,
respectively for pre-obesity and obesity prevalence of adult population (18+) in Portugal: 45.2% and
15% for men and 34.4% and 13.4% for women (2003/05)7; 53.3% and 11,2% for men and 27.8% and
10.4% (2009)8; 41.8% and 19.7% for men and 31% and 23.7% for women (2015/16)9. All the studies
used measured data for the calculation of BMI. The first one considered just the population of the
mainland and the others all the population resident in Portugal (mainland and islands).
Regardless of some discrepancies, all studies show high prevalence of pre-obesity and obesity in the
adult population living in Portugal, with pre-obesity being more prevalent among men and obesity
more prevalent among women.
It is also evident that obesity prevalence increase with age and is higher in the population groups
with lower levels of education6,9.
Children
The collection and analysis of prevalence data on pre-obesity and obesity during childhood has been
more systematic in Portugal for the 6 to 8 and 11 to 16 age groups due to the international studies

LIFETIME IMPACT AND COST OF CHILDHOOD OBESITY IN EUROPE (PART 2) 89
Childhood Obesity Surveillance Initiative (COSI) and Health Behaviour in School-aged Children
(HBSC)10.
Regarding COSI, weight and height data of children from 6 to 8 years old living in Portugal (mainland
and islands) were measured in school settings. Although some numbers appear to show a trend
towards a reduction in the prevalence of pre-obesity and obesity, these trends were not statistically
confirmed. Table below presents the results of COSI in all the years in which it were carried out11–13.
Contrary to what happens with adults, pre-obesity is more prevalent in girls and obesity in boys.
Table Pre-obesity and obesity prevalence for boys and girls (6-8 years old) in Portugal according
International Obesity Taskforce (IOTF) criteria.
Study Year
COSI
2008 2010 2013
Boys Pre-obesity 20.2% 16.5% 16.5%
Obesity 9.7% 10.1% 8.6%
Girls Pre-obesity 18.1% 17.5% 17.9%
Obesity 8.1% 8.4% 7.7%
Source: Childhood Obesity Surveillance Initiative Portugal, 2008, 2010 and 101311–13.
Regarding HBSC, weight and height data of adolescents from 11 to 16 years old living in Portugal
(mainland) were self-reported and data were analysed according IOTF criteria. The first study was
conducted in 199814, the second in 200215, the third in 200616, the fourth in 201017 and the most
recent in 201418. In the last round, it was observed that, in this age group, girls present more
frequently a normal body mass index (14.4% of girls were pre-obese and 2.3% were obese) and boys
have higher rates of obesity (16% of boys were pre-obese and 3.8% were obese). Older adolescents
present most often a normal body mass index, that is, the older the adolescents in this age group,
the lower the prevalence of obesity18. Table below presents the evolution of the prevalence of pre-
obesity and obesity in adolescents aged 11 to 16 years in Portugal (mainland) during the years of
HBSC study, using IOTF criteria. It is possible to verify that there was no significant change in the
prevalence of adolescent pre-obesity and obesity during these years in Portugal18.
Table Evolution of the prevalence of pre-obesity and obesity in adolescents of both sexes aged 11 to
16 years in Portugal (mainland) during the years of HBSC study.
Study Year
HBSC
1998 2002 2006 2010 2014
Adolescents (both sexes)
Pre-obesity
13.3% 15% 15% 15% 15%
Obesity
2.3% 3.2% 2.9% 3.4% 3%
Source: M. Matos, C. Simões, I. Camacho, et. al., 201518.
Other study conducted in 2007/08 for a PhD thesis presented results slightly higher in the
prevalence of pre-obesity and obesity in adolescents using the same criteria (IOTF): respectively,

LIFETIME IMPACT AND COST OF CHILDHOOD OBESITY IN EUROPE (PART 2) 90
22.9% and 8.8% for boys and 22.4% and 6.9% for girls. In any case, adolescent boys continue to have
higher rates of obesity then girls19.
Regarding infants and pre-school children, three studies were considered for the model with the
following prevalence of pre-obesity and obesity per age group data:
a PhD study, conducted in 2001 with a sub-national sample of Coimbra municipality, using
IOTF criteria – 13.6% and 6.5% for boys and 20.4% and 6.9% for girls of 3 to 5 years old20;
EPACI study, conducted in 2012 with a national (mainland and islands) representative
sample, using World Health Organization criteria – 6.3% and 0.6% for boys and 5.6% and
0.4% for girls of 2 to 3 years old21;
IAN AF study, conducted in 2015/16 with a national (mainland and islands) representative
sample, using World Health Organization criteria – 3.3% and 1.1% for boys and 8.6% and
1.4% for girls of 0 to 4 year old9.
Despite the undoubted importance of studies on the prevalence of overweight and obesity in this
age group from 0 to 5 years old, the methodological differences of these three studies make it
impossible to compare their results.
8.2.2 Childhood Impacts
Seven sources on health and other impacts of child overweight and obesity in childhood were
retrieved for Portugal. Two of these examined the metabolic syndrome in children (aged 7-9 years;
Pedrosa et al., 2010) and adolescents (mean age 13.2 years; Teixera et al., 2001). Pedrosa et al.
(2010) reported that presence of metabolic syndrome (MS), i.e. three or more of abdominal obesity,
high fasting triglycerides, low HDL, high BP, and high fasting glucose, was significantly associated
with higher BMI, while Teixera et al. found that both direct and indirect measures of adiposity were
associated with serum cardiovascular risk factors in boys and girls. Leite et al. (2012) reported that,
among a sample of children/adolescents (mean aged 12.9 years), CIMT was positively associated
with higher BMI, even in moderately overweight ranges, independent of age, gender, systolic blood
pressure and plasma lipid concentrations. Ribeiro et al. (2003) found that systolic and diastolic blood
pressure were significantly and positively related to BMI among a sample of 8-16 year-olds (all at risk
of obesity).
Lopes et al. (2011) found that motor co-ordination was inversely associated with BMI: the strength
of the association increased during childhood but decreased into early adolescence; however at all
ages, overweight and obese children had significantly lower motor co-ordination than healthy
weight children.
Two sources from Portugal examined psychological/emotional impacts (Ferreira Felgueiras, 2011;
Moreira et al., 2013). The study by Moreira et al. is of note since it allows comparisons of healthy
children and adolescents with children/adolescents with various conditions including obesity.
Participants in their study were classified as healthy, with diabetes, asthma, epilepsy, or obesity.
Children with obesity and epilepsy reported the lowest quality of life and highest levels of
psychological problems, and parents of obese children reported the lowest quality of life.

LIFETIME IMPACT AND COST OF CHILDHOOD OBESITY IN EUROPE (PART 2) 91
8.2.5 Inequalities
Thirteen studies from Portugal described inequalities in prevalence. Some regional variations in the
prevalence of overweight and obesity have been reported for Portugal, but these are not as
dramatic as in Italy. Nazareth (2013) reported the highest levels of overweight and obesity among
infants in the North, with lowest rates in the Algarve in the South. Recent COSI results indicate that
prevalence of overweight is higher in Lisbon, the Tagus Valley and the Azores, while rates of obesity
were higher in central regions and Madeira (Rito et al., 2012b, Rito & Graça, 2015). Differences by
urban-rural location were not evident in the COSI results (Rito et al., 2012a). Research by Nogueira
et al. (2013) and Ferrao et al. (2013) suggest that inequalities in prevalence may be related to
specific aspects of children’s local communities, such as poorer built environments and less safe
neighbourhoods. Other studies from Portugal confirm associations between parental BMI, parental
education and children’s overweight and obesity (Bingham et al., 2013, Ramos et al., 2007; Padez et
al., 2005, 2009; Ferreira & Marques-Vidal, 2008), as well as among children who were first-born,
with fewer siblings, and whose mothers gained more weight during pregnancy (Moreira et al., 2007).
8.3 DATA DOCUMENTATION
Phase 1: Data Collation
20171130 Phase 1 (Portugal) Data Calculations.xlsx
20171130 Phase 1 (Portugal) Data Calculations (2).xlsx
20171130 Phase 1 (Portugal) Data Collation Workbook.xlsx
20171130 Phase 1 (Portugal) Data Sources.xlsx
Phase 2: Pre-simulation Data Processing
20171130 Phase 2 (Portugal) Data Documentation (Part 1).xlsx
20171130 Phase 2 (Portugal) Data Documentation (Part 2).docx
Phase 5: Post Simulation Review
20171130 Phase 5 (Portugal) Model Outputs Workbook - DISC.xlsm
20171130 Phase 5 (Portugal) Model Outputs Workbook - UNDISC.xlsm
8.4 DATA
Phase 1: Data Collation
20171130 Phase 1 (Portugal) Data Collation Workbook.xlsx

LIFETIME IMPACT AND COST OF CHILDHOOD OBESITY IN EUROPE (PART 2) 92
Phase 2: Pre-simulation Data Processing
Data not available (see Data Documentation files)
Phase 3 and 4: Simulation Modelling and Cost Estimation
20171130 Phase 3&4 (Portugal) Initial Model Output Workbook.xlsx
Phase 5: Post Simulation Review
20171130 Phase 5 (Portugal) Initial Resturctured Model Output Workbook.xlsx
20171130 Phase 5 (Portugal) Initial Core tables and Graphs Workbook.xlsx
Phase 6: Reporting
20171130 (Portugal) Final Restructured Model Output Workbook.xlsx
20171130 (Portugal) Final Combined Model Outputs SAS Dataset.ssd
20171130 (Portugal) Final Combined Model Outputs Worksheet.xlsx
20171130 (Portugal) Final Core Tables and Graphs Workbook.xlsx
UNDISCOUNTED and DISCOUNTED versions of the data files are available
As a result of the feedback loops include in the workflow; the software was sometimes rerun with
corrected inputs. Only the final model outputs from the simulation software are listed.
PORTUGUESE REFERENCES
Graça P, Gregório MJ, Sousa SM De, Carriço J, Correia A, Salvador C. The Portuguese National Programme for the Promotion of Healthy Eating : 2012 – 2015. Public Heal Panor. 2016;2(2):184-209.
Graça P, Gregório MJ, Mendes de Sousa S, Camolas J. Food policy in Portugal: historical context, opportunities, and threats. Food Sci. 2016:1-10. doi:http://dx.doi.org/10.1016/B978-0-08-100596-5.21166-9 Reference.
Portugal. Ministério da Saúde. INSA. Inquérito Nacional de Saúde 1998/1999 : Dados Gerais. Lisboa; 2001.
Portugal. Ministério da Saúde. INSA. Inquérito Nacional de Saúde 1998/1999 : Informação Síntese. Lisboa; 2001.
Portugal. Ministério da Saúde. INSA. Inquérito Nacional de Saúde 2005/2006 : Dados Gerais. Lisboa; 2007.

LIFETIME IMPACT AND COST OF CHILDHOOD OBESITY IN EUROPE (PART 2) 93
Instituto Nacional de Saúde Doutor Ricardo Jorge. 1o Inquérito Nacional de Saúde Com Exame Físico (INSEF 2015). Lisboa; 2016.
Carmo I, Santos O, Camolas J, et al. Overweight and obesity in Portugal: national prevalence in 2003-2005. Obes Rev. 2008;9(1):11-19. doi:10.1111/j.1467-789X.2007.00422.x.
Poínhos R, Franchini B, Afonso C, et al. Alimentação e estilos de vida da população portuguesa : metodologia e resultados. Aliment Humana. 2009;15(3):43-60.
Faculdade de Medicina da Universidade do Porto/Instituto de Saúde Publica da Universidade do Porto (Carla Lopes, Milton Severo, Andreia Oliveira, Elisabete Ramos SV, Faculdade de Ciências da Nutrição e Alimentação da Universidade do Porto (Duarte Torres SR, Instituto Nacional de Saúde Doutor Ricardo Jorge (Sofia Guiomar LO, et al. Inquérito Alimentar Nacional E de Atividade Física. IAN-AF 2015-2016. Lisboa; 2017.
World Health Organization. Adolescent Obesity and Related Behaviours : Trends and Inequalities in the WHO European Region, 2002-2014. Copenhagen; 2017.
Portugal. Ministério da Saúde. Instituto Nacional de Saúde Doutor Ricardo Jorge. Childhood Obesity Surveillance Initiative - Portugal. Vol INSA, I.P. Lisboa; 2011. doi:10.1111/j.2047-6310.2012.00068.x.
Portugal. Ministério da Saúde. Instituto Nacional de Saúde Doutor Ricardo Jorge. Childhood Obesity Surveillance Initiative: COSI Portugal 2010. Lisboa: INSA, I.P.; 2012.
Portugal. Ministério da Saúde. Instituto Nacional de Saúde Doutor Ricardo Jorge. Childhood Obesity Surveillance Initiative: COSI Portugal 2013. Lisboa; 2013.
Matos MG de, Simões C, Carvalhosa S, Reis C. A Saúde Dos Adolescentes Portugueses. Estudo Nacional Da Rede Europeia HBSC /OMS (1998). Lisboa; 1998.
Matos MG de, Equipa do projeto Aventura Social e Saúde. A Saúde Dos Adolescentes Portugueses (Quatro Anos Depois). Relatório Português Do Estudo HBSC 2002. Lisboa; 2002.
Matos MG de, Simões C, Tomé G, et al. A Saúde Dos Adolescentes Portugueses Hoje E Em 8 Anos. Relatório Preliminar Do Estudo HBSC 2006. Lisboa; 2006. doi:ISSN: 2183-5888.
Matos MG de, Diniz JA, Simões C, Equipa do projeto Aventura Social. Health Behaviour in School-Aged Children: Dados Nacionais 2010 - Abril 2011. Problemas Emergentes E Contextos Sociais. Lisboa; 2011.
Matos MG, Simões C, Camacho I, Reis M, Equipa do projeto Aventura Social. Relatório Do Estudo HBSC 2014: A Saúde Dos Adolescentes Portugueses Em Tempos de Recessão - Dados Nacionais 2014. Lisboa; 2015. doi:978-989-98346-1-3.
Ferreira J. Prevalência de obesidade infanto-juvenil. Associação com hábitos alimentares, actividade física e comportamentos sedentários dos adolescentes escolarizados de Portugal Continental. 2010.
Rito A. Estado nutricional de crianças e oferta alimentar do pré-escolar do município de Coimbra, POrtugal, 2001. 2004.
EPACI Portugal 2012. Alimentação e crescimento nos primeiros anos de vida: a propósito do EPACI Portugal 2012. 2013.

LIFETIME IMPACT AND COST OF CHILDHOOD OBESITY IN EUROPE (PART 2) 94
9. ROMANIA
9.1 LOCAL CONTEXT
In recent years, the Romanian Government has developed through its health and social protection
policies measures designed to reduce the burden of disease in the population by reducing existing
inequalities in health, optimizing resources use and improving administrative and management
capacity at all levels of the health system.
Taking into account the health profile of the population, the Romanian Government has developed
and approved in 2014 the National Health Strategy for 2014-2020. The strategy is the expression of
the recognition of the role of population’s health as a key determinant and as engine of sustainable
development of the society.
Priority areas in the strategy aim early prevention and combat early and high-frequency disease in
adult populations such as circulatory diseases, cancers, or digestive diseases.
Women's and child's health is one of the priority areas of intervention taking in account the deficit
of health care during the prenatal period fact linked with a large number of premature and / or low
birth weight babies. Nutrition of under 2 years old children also raise problems regarding low rates
of exclusive breastfeeding or early diversification. Strengthening primary care by increasing its
capacity to detect early major illnesses with a major impact on the burden of non-communicable
diseases is another priority area. Prioritizing this area is essential for early prevention of overweight
and obesity, taking in account the fact that the foundation of health is often set during the prenatal
period and early childhood.
The strategy is accompanied by a concrete action plan with institutional responsibilities and financial
allocations so that all strategic targets can be monitored and achieved by 2020.
In the past 5 years in Romania there have been accomplished following achievements in the area of
nutrition and physical activity:
New Low and regulations
the National Health Programs 2017 provide and support interventions to adopt a healthy
lifestyle through healthy eating and physical activity
There are changes of existing legislation on food labelling according to the Regulation (EU)
No 1169/
The Ethical Code for Food Product Advertising Targeting Children promote rules for all
institutions involved in marketing food products to children.
Elaboration of the Code on marketing of food and non-alcoholic beverages to children
A New Law frame for development of community care services
Elaboration of educational materials
A new version of the booklet for pregnant women with focus on nutrition in pregnancy and
breastfeeding ,
the Guidelines for a Healthy Diet Food was developped which bring information for a
healthy diet in the form of food pyramid divided into 7 foodgroups
The guide on physical development standards of children and youth as a tool to be used
to assess the physical development of children in school setting was elaborate

LIFETIME IMPACT AND COST OF CHILDHOOD OBESITY IN EUROPE (PART 2) 95
IEC activities
national and local information campaigns for disadvantaged populations were implemented
broadcasting of advisory messages, such as “For a healthy lifestyle, avoid excess salt, sugar
and fat” and “For a healthy lifestyle, exercise for at least 30 minutes every day”,
Brestfeeding is best
Studies
In order to reduce health inequalities, the Ministry of Health funded several studies to assess the use
of preventive and curative medical services, the quality and accessibility of these services for
pregnant women and children including the evaluation of the nutritional status. The aim of these
studies is to collect data to support interventions to improve these services in the benefit of the
entire population.
The assessment of the nutritional status of children in the primary school was performed in the
frame of the COSI project - WHO initiative.
Assessment of the nutritional status of children in the primary school through participation in the
COSI project - WHO initiative.. The impact of these actions on the health profile of the population is
positive in some areas such as infant and maternal mortality, life expectancy, but with the mention
that these actions are not the only factor of influence. For other areas, such as diseases with a high-
risk for disability, non-communicable or chronic (specific to the Romanian population) diseases, the
impact is still not (cannot be) measured in results that reflects significant short term improvement in
the prevalence of these diseases.
Strengthening policies to reduce social inequalities in all areas and implicitly in health can reduce
with time the burden of disease in the population.
9.2 LOCAL EVIDENCE
This section should be read in conjunction with the international context outlined in Section 1.2.
9.2.1 Childhood Obesity / Overweight
Data on prevalence were available from 14 studies identified in Romania. Seven are described here.
Note that reference standards to classify overweight and obese varies across studies.
In 2010, Romania’s national nutrition programme collected data from a representative sample of
infants aged 0-24 months. Nanu et al. (2011) reported that 5.4% of the infants assessed had high
weight for height (WHO growth standards). The results of a survey conducted in 2010-2012 in 14
counties of Romania indicated that 20% of children aged 6-7 years were overweight or obese, and
that 18% of children aged 13-14 were overweight or obese (WHO cut-points; Ardeleanu et al., 2015).

LIFETIME IMPACT AND COST OF CHILDHOOD OBESITY IN EUROPE (PART 2) 96
The results for the third round of COSI for Romania have been published in a national report
(Nicolescu et al., 2013) and discussed at the eighth international meeting for COSI (World Health
Organisation Regional Office for Europe, 2016). Among the 8-9 year-olds surveyed, prevalence of
overweight and obesity was higher among boys than girls: 14.8% of boys were classified as
overweight, and 15.0% obese, compared with 15.7% and 8.0% among girls, respectively
The other four Romanian studies were conducted using regional samples. Mocanu (2013) reported
the results of a study carried out in Northeast Romania among children aged 6 to 10. Across all
children, about 25% of boys and 23% of girls were overweight or obese (IOTF cut-points). No
significant gender differences were found for any age, and prevalence was highest at age 9 in both
sexes. Valean et al. (2009) surveyed children in Northwest Romania and estimated, using the US-CDC
cut-points, that 25% of boys and 17% of girls aged 6-18 were overweight or obese. At all age groups,
there were significantly more overweight and obese boys than girls. There was a large decline in
prevalence with increasing age. For example, 34% of boys in grades 1-4, compared to 16% of boys in
grades 9-12, were overweight or obese. Chirita-Emandi et al. (2012) estimated that, in West
Romania, 30% of boys and 22% of girls aged 6-17 were overweight or obese (IOTF cut-points).
Estimates from South Romania (Bucharest) in children aged 7-19 are similar to those for the West
(IOTF cut-points), with prevalence of overweight and obesity around 29% among boys and 21%
among girls (Barbu et al., 2015).
Trends
There are two sources of information on trends in overweight and obesity among infants and
children from Romania. Nanu et al. (2011) reported a slight increase in the prevalence of increased
weight for height in children 0-24 months old in 2010 compared with 2004 (5.4% compared with
4.2%).
In contrast to other JANPA participants, this research has also highlighted the relatively high
prevalence of underweight children, noting relatively stable trends in underweight over time. For
example, Nanu, Stativa Moldovanu (2006) reported a median birth weight of 3,200g in Romania in
2005, which is below that of other European countries (3,400g). This study also reported that 4.4%
of children under 5 had low weight for height, and about 5% of children aged 6-7 had low weight for
height.
With regard to the evolution of the overweight in the 6-year-olds, there was a rise in the prevalence
of obesity within 10 years. Thus, the indicator WHZ> +2 DS in 2005 had a weight of 3.3% for boys and
4.4 % in girls. In 2016 the BMI weight > +2 DS vs. average is 5.61% boys and 5.44% in girls. Evolution
to overweight is more pronounced in boys than girls (Nanu M, Moldovanu F, 2016 unpublished data)
9.2.2 Childhood Impacts
Four sources on this topic were located for Romania. Unlike other JANPA countries, a positive
association between SES (income) and prevalence of overweight/obesity has been reported in
Romania, after adjusting for aspects of children’s diets and physical and sedentary activity levels
(Mocanu, 2013). The COSI round 3 results for Romania (World Health Organization Regional Office
for Europe, 2016; Nicolescu et al., 2013) indicate quite large regional variations in the prevalence of

LIFETIME IMPACT AND COST OF CHILDHOOD OBESITY IN EUROPE (PART 2) 97
overweight and obesity among children in rural (21.6% overweight/obese), semi-urban (25.0%) and
urban (31.6%) areas. Cosoveanu (2011) reported higher rates of overweight and obesity among
children with higher parental BMI, who were not breastfed and introduced early to solid foods, and
with less healthy diets and less active lifestyles. Morea and Miu (2013) found a positive association
between childhood overweight and obesity and parental BMI (measured as pre-pregnancy maternal
overweight or obesity).
9.2.3 Adult Impacts
Prevalence of overweight in adult population is 31.2% and for obesity is 16, 7% (Bunescu at. Al,
2009)
Similar results were found in another study published in 2015 (Roman et al.,), which shows that
prevalence of overweight and obesity is 52%. The highest prevalence is in Moldavia 57,2% and the
lowest in Banat, Crisana&Transylvania 46%. This regional structure confirms that overweight and
obesity affects mostly the less developed regions (which for Romania is Moldavia), implicitly with
poor populaton and probably the ones with limited access to health care services.
9.2.5 Inequalities
The highest mean BMI is in children from NW, W and SW regions. Below the country mean values
are the children from centre, NE and E region. Bucharest is below country mean value. Mean BMI is
higher in children from urban area than in rural and in boys than in girls.
The mean BMI of 6 years old children is higher in most developed counties compared with the
poorest region of Romania . This diffrences could be explained either trough the decrease of
nutrional deficiencies or un increase of overweight among children in the most developed counties
Mean BMI decreases by number of children in family, being below country mean for families with 3
and more than 3 children. The highest value of BMI and over country mean is in families with higher
educational level and in mother aged over 45 years. (Nanu M, Moldovanu F., 2016 unpublished data)
9.3 DATA DOCUMENTATION
Phase 1: Data Collation
20171130 Phase 1 (Romania) Data Calculations (1).xlsx
20171130 Phase 1 (Romania) Data Calculations (2).xlsx
20171130 Phase 1 (Romania) Data Collation Workbook.xlsx

LIFETIME IMPACT AND COST OF CHILDHOOD OBESITY IN EUROPE (PART 2) 98
20171130 Phase 1 (Romania) Data Sources.xlsx
Phase 2: Pre-simulation Data Processing
20171130 Phase 2 (Romania) Data Documentation (Part 1).xlsx
20171130 Phase 2 (Romania) Data Documentation (Part 2).docx
Phase 5: Post Simulation Review
20171130 Phase 5 (Romania) Model Outputs Workbook - DISC.xlsm
20171130 Phase 5 (Romania) Model Outputs Workbook - UNDISC.xlsm
Table. Phase 1: .Romanian Disease Data Quality Scores
1 2 3 4 5 6
No acceptable
data
Must be
estimated
from other
data1
International
proxy
"Approximate"
data only2
Not
applicable
(non-fatal
disease)
Acceptable
data
1. For disease parameters: prevalence, incidence, survival mortality)
2. "Approximate" data only:
ICD code mismatch
Hospital data used for prevalence or incidence
Self-reported BMI
Regional (sub-national) data
Adult diseases
DISEASE MORTALITY INCIDENCE SURVIVAL PREVALENCE
Oesophageal Cancer
INS (National Institute of Statistics)
morbidity at family doctor's office
calculate from prevalence and mortality
Globocan
Colorectal Cancer
INS (National Institute of Statistics)
morbidity at family doctor's office
calculate from prevalence and mortality
C18 to C21 Globocan
Liver Cancer
have C22 only morbidity at family doctor's office
calculate from prevalence and mortality
C22 Globocan

LIFETIME IMPACT AND COST OF CHILDHOOD OBESITY IN EUROPE (PART 2) 99
have C22 only
Gallbladder Cancer
INS (National Institute of Statistics)
morbidity at family doctor's office
calculate from prevalence and mortality
Globocan
Pancreatic cancer
INS (National Institute of Statistics)
morbidity at family doctor's office
calculate from prevalence and mortality
Globocan
Cancer-Breast, post-menopausal (females only aged 50+)
INS (National Institute of Statistics)
morbidity at family doctor's office
calculate from incidence and mortality
have incidence
Endometrial cancer
INS (National Institute of Statistics)
morbidity at family doctor's office
calculate from prevalence and mortality
C54 Globocan
Ovarian Cancer
INS (National Institute of Statistics)
morbidity at family doctor's office
calculate from prevalence and mortality
Globocan
Prostate cancer (males only)
INS (National Institute of Statistics)
morbidity at family doctor's office
calculate from prevalence and mortality
Globocan
Kidney Cancer
INS (National Institute of Statistics)
morbidity at family doctor's office
calculate from prevalence and mortality
Globocan
Urothelial Cancer (males only)
INS (National Institute of Statistics)
morbidity at family doctor's office
calculate from prevalence and mortality
Globocan
Thyroid cancer
INS (National Institute of Statistics)
morbidity at family doctor's office
calculate from prevalence and mortality
Globocan
Type 2 Diabetes
Not required for the model
morbidity at family doctor's office
Not required for the model
Coronary heart disease and cardiovascular risk factors among people aged 25–65 years, as seen in Romanian primary healthcare http://www.tandfonline.com/doi/full/10.1080/13814780802343141 European Health Interview Survey (EHIS)
Polycystic Ovarian Syndrome
have E28 only
morbidity at family doctor's office have E28 only
calculate from incidence and mortality
have incidence
Multiple Sclerosis
INS (National Institute of
morbidity at family doctor's office
calculate from prevalence and
National Institute of Public Health - total

LIFETIME IMPACT AND COST OF CHILDHOOD OBESITY IN EUROPE (PART 2) 100
Statistics) mortality cases only
Stroke
INS (National Institute of Statistics)
morbidity at family doctor's office
calculate from prevalence and mortality
European Health Interview Survey (EHIS)
Hypertension
Not required for the model
morbidity at family doctor's office
Not required for the model
SEPHAR II http://www.romanianjournalcardiology.ro/wp-content/uploads/2016/01/RRC_art_4-4-22.pdf Coronary heart disease and cardiovascular risk factors among people aged 25–65 years, as seen in Romanian primary healthcare http://www.tandfonline.com/doi/full/10.1080/13814780802343141 European Health Interview Survey (EHIS)
Ischaemic Heart Disease
INS (National Institute of Statistics)
morbidity at family doctor's office
calculate from prevalence and mortality
Coronary heart disease and cardiovascular risk factors among people aged 25–65 years, as seen in Romanian primary healthcare http://www.tandfonline.com/doi/full/10.1080/13814780802343141
Deep Vein Thrombosis
have I80 only
morbidity at family doctor's office have I80 only
calculate from incidence and mortality
have incidence
Asthma
have J45 and J46 combined only
morbidity at family doctor's office have J45 and J46 combined only
calculate from prevalence and mortality
European Health Interview Survey (EHIS)
Non-alcoholic fatty liver disease (NAFLD)
have K76 only
morbidity at family doctor's office have K76 only
calculate from incidence and mortality
have incidence
Gallbladder Disease
have K80, K81, K85 combined only
morbidity at family doctor's office have K80, K81, K85 combined only
calculate from incidence and mortality
have incidence
Psoriasis
INS (National Institute of Statistics)
morbidity at family doctor's office
calculate from prevalence and mortality
National Institute of Public Health

LIFETIME IMPACT AND COST OF CHILDHOOD OBESITY IN EUROPE (PART 2) 101
Gout Have M10 only
morbidity at family doctor's office Have M10 only
calculate from incidence and mortality
have incidence
Osteoarthritis – Gonarthrosis Knee Pain
have M17 only
morbidity at family doctor's office have M17 only
calculate from incidence and mortality
have incidence
Chronic Back Pain
have M54 only
morbidity at family doctor's office have M54 only
calculate from prevalence and mortality
European Health Interview Survey (EHIS)
Hypertension in pregnancy
INS (National Institute of Statistics)
morbidity at family doctor's office
calculate from incidence and mortality
have incidence
Pulmonary Embolus
INS (National Institute of Statistics)
morbidity at family doctor's office
calculate from incidence and mortality
have incidence
Childhood diseases
DISEASE MORTALITY INCIDENCE SURVIVAL PREVALENCE
Wheezing disorders
no deaths Calculate incidence from prevalence
Prob survival = 1 (no deaths)
Prev wheezing ever/last 12 months Paraschiva CHERECHES-PANTA Epidemiological Survey 6 Years Apart: Increased Prevalence of Asthma and Other Allergic Diseases in Schoolchildren Aged 13-14 Years in Cluj-Napoca, Romania https://www.ncbi.nlm.nih.gov/pmc/articles/PMC3150021/pdf/maed-06-10.pdf also have hospital discharges by age - 0 to 4; 5 to 14
Metabolic syndrome
no deaths hospital discharges 0 to 17
Prob survival = 1 (no deaths)
hospital discharges 0 to 17
Hyperlipidaemia
no deaths Calculate incidence from prevalence
Prob survival = 1 (no deaths)
hospital discharges 0 to 4; 5 to 14

LIFETIME IMPACT AND COST OF CHILDHOOD OBESITY IN EUROPE (PART 2) 102
Depression no deaths
0 to 4; 5 to 9; 10 to 14; National Institute for Public Health - new cases
Prob survival = 1 (no deaths)
have incidence
Obstructive sleep apnoea
no deaths
0 to 4; 5 to 9; 10 to 14; G47 National Institute for Public Health - new cases
Prob survival = 1 (no deaths)
hospital discharges 0 to 4; 5 to 14 - G47.3
High blood pressure
Not required for the model
0 to 4; 5 to 9; 10 to 14; 15 to 19 morbidity at family doctor's office have J45 and J46 combined only
calculate from incidence and mortality
have incidence
Type 2 diabetes
Not required for the model
0 to 4; 5 to 9; 10 to 14; 15 to 19 morbidity at family doctor's office have J45 and J46 combined only
15 to 24 have incidence
Asthma 0 to 4; 5 to 9; 10 to 14; 15 to 19
0 to 4; 5 to 9; 10 to 14; 15 to 19 morbidity at family doctor's office have J45 and J46 combined only
calculate from incidence and mortality
prevalence 'asthma ever' in kids age 13 to 14
Non-alcoholic fatty liver disease
0 to 4; 5 to 9; 10 to 14; 15 to 19 - K76 only
0 to 4; 5 to 9; 10 to 14; 15 to 19 - K76 only morbidity at family doctor's office have J45 and J46 combined only
calculate from incidence and mortality
have incidence
Musculoskeletal pain
have M17 only
have M17 only 0 to 4; 5 to 9; 10 to 14; 15 to 19 morbidity at family doctor's office
calculate from incidence and mortality
have incidence

LIFETIME IMPACT AND COST OF CHILDHOOD OBESITY IN EUROPE (PART 2) 103
9.4 DATA
Phase 1: Data Collation
20171130 Phase 1 (Romania) Data Collation Workbook.xlsx
Phase 2: Pre-simulation Data Processing
Data not available (see Data Documentation files)
Phase 3 and 4: Simulation Modelling and Cost Estimation
20171130 Phase 3&4 (Romania) Initial Model Output Workbook.xlsx
Phase 5: Post Simulation Review
20171130 Phase 5 (Romania) Initial Resturctured Model Output Workbook.xlsx
20171130 Phase 5 (Romania) Initial Core tables and Graphs Workbook.xlsx
Phase 6: Reporting
20171130 (Romania) Final Restructured Model Output Workbook.xlsx
20171130 (Romania) Final Combined Model Outputs SAS Dataset.ssd
20171130 (Romania) Final Combined Model Outputs Worksheet.xlsx
20171130 (Romania) Final Core Tables and Graphs Workbook.xlsx
UNDISCOUNTED and DISCOUNTED versions of the data files are available
As a result of the feedback loops include in the workflow; the software was sometimes rerun(this
occurred for Romania) with corrected inputs. Only the final model outputs from the simulation
software are listed.
Table. Phase 5: Profile of Romanian children ((from Initial model which is under review)
)
Age Sex BMI at age 18 Number Percentage
Total Persons Obese/Overweight 846,573 22.1

LIFETIME IMPACT AND COST OF CHILDHOOD OBESITY IN EUROPE (PART 2) 104
(0-17)
Healthy weight 2,986,481 77.9
Total 3,833,054 100.0
Females Obese/Overweight 354,157 19.0
Healthy weight 1,505,892 81.0
Total 1,860,048 100.0
Males Obese/Overweight 492,416 25.0
Healthy weight 1,480,590 75.0
Total 1,973,006 100.0
0-5 Persons Obese/Overweight 185,527 15.8
Healthy weight 990,548 84.2
Total 1,176,076 100.0
Females Obese/Overweight 89,945 7.5
Healthy weight 481,427 40.1
Total 571,372 47.6
Males Obese/Overweight 95,583 8.0
Healthy weight 509,121 42.5
Total 604,704 50.4
6-11 Persons Obese/Overweight 335,567 26.0
Healthy weight 952,929 74.0
Total 1,288,496 100.0
Females Obese/Overweight 146,440 23.4
Healthy weight 480,260 76.6
Total 626,700 100.0
Males Obese/Overweight 189,127 28.6
Healthy weight 472,669 71.4
Total 661,797 100.0
12-17 Persons Obese/Overweight 325,478 23.8
Healthy weight 1,043,004 76.2
Total 1,368,482 100.0
Females Obese/Overweight 117,772 17.8
Healthy weight 544,205 82.2
Total 661,977 100.0
Males Obese/Overweight 207,706 29.4
Healthy weight 498,799 70.6
Total 706,505 100.0
9.5 COMMENTS
There are a few collaboration among different professionals acting in the health system in the area of nutrition and related diseases

LIFETIME IMPACT AND COST OF CHILDHOOD OBESITY IN EUROPE (PART 2) 105
There is a gap in the collaboration between services addressed to children and adults fact which act negatively on the follow up evaluation of nutritional disturbances starting in childhood
Evidence
The following points apply to the Romanian modelling.
There is little collaboration among research institutions in design, implementation and
evaluation of studies regarding obesity
In Romania there are few nutritional studies performed on national representative samples of children
Taking in account all diseases in Romania few impact and cost related studies were performed in the area of obesity in general and children obesity Romania researcher published only few materials in international newspaper.
Data
Limited access different data basis In Romania, data that is recorded at different health care level, is not available for research. This data is recorded using software only serving the needs of the National Health Insurance House and this data cannot be summarised.
Romania was involved only in the last years in international studies regarding childhood obesity ( Cosy study)
There are national registries only for a few diseases and on local basis ( cancer registry ) Regarding the accuracy of primary data, this is not collected by a unitary criteria
Central institutes, such as Health Ministry, Ministry of labour receive processed data and not primary data from the different counties and therefore it is difficult to explore in the existing data in a secondary manner
The following recommendations arose out of the Romanian modelling
Childhood obesity
There is a lack of primary data regarding costs for drugs, treatment, and care for specific
diseases. Currently the available data is available only in processed/aggregated form,
depending on the needs of the National Health Insurance Fund. Availability of primary data
would facilitate analyses which have other goals, as in our case the cost of all diabetes
related to obesity, It is important to inform the policy makers in order to manage the basic
information.
Use of proxy data doesn’t make us sure that this data is necessarily relevant for Romanian
population. We don’t have the possibility to check if they match our specific.
Gaps in the evidence and data
Inequalities in childhood obesity in Romania
Building capacity

LIFETIME IMPACT AND COST OF CHILDHOOD OBESITY IN EUROPE (PART 2) 106
Currently, there is not an institution that centralises costing data such as: drugs costs,
especially at primary care level
ROMANIAN REFERENCES
Ardeleanu, I.S., Nanu, M., Moldovanu, F., Bacalearos, C., & Moculescu, C. (2015). “OVERWEIGHT AND OBESITY
SCREENING OF 6-7 YEARS OLD AND 13-14 YEARSOLD CHILDREN IN 14 COUNTIES FROM ROMANIA”. Paper
presented at IOMC days, December, Bucharest.
Barbu, C. G., Teleman, M. D., Albu, A. I., Sirbu, A. E., Martin, S. C., Bancescu, A., & Fica, S. V. (2015). Obesity and
eating behaviors in school children and adolescents–data from a cross sectional study from Bucharest,
Romania. BMC public health, 15(1), 206.
Bunescu, D. M., Stoffers, H. E., van den Akker, M., & Jan Dinant, G. (2008). Coronary heart disease and
cardiovascular risk factors among people aged 25–65 years, as seen in Romanian primary healthcare. The
European journal of general practice, 14(2), 56-64.
Chereches-Panta P, et al (2011)– Epidemiological survey 6 years apart: increased prevalence of asthma and
other allergic diseases in schoolchildren aged 13-14 years in Cluj-Napoca, Romania (based on Isaac
questionnaire) Maedica. ;6:10–16.)
Chirita-Emandi, A., Puiu, M., Gafecnu, M., & Pienar, C. (2012). “GROWTH REFERENCES FOR SCHOOL AGED
CHILDREN IN WESTERN ROMANIA.” Acta Endocrinologica (Buc)VIII: 133-152.
Chirita-Emandi, A., Puiu, M., Gafencu, M., & Pienar, C. (2013). Arterial hypertension in school-aged children in
western Romania. Cardiology in the Young, 23(2), 189-196.
Cosoveanu, C.S. (2011). Primary obesity in children: Etiopathogenic, clinical and prophylactic aspects.
Unpublished Doctoral Thesis, Faculty of Medicine, University of Medicine and Pharmacy, Craiova
Coşoveanu, S.; Bulucea, D. (2010) Study on the Relationship Between Lifestyle and Obesity in Kindergarden
and Primary School Children, Acta Medica Marisiensis Vol. 56 Issue 4, p322-324
Dumbrava, L.M. Metabolic syndrome and risk factors screening in overweight and obese children and
adolescents, Unpublished Doctoral Thesis available on www.uoradea.ro, Faculty of Medicine, University of
Medicine and Pharmacy, Oradea
Glavce, C. , Milici, N. Roville-Sausse, F., (2011), Mondialisation du comportement alimentaire et l`obesite, 24-
25, Ciuhuta, M., Baciu, A., Luca, E., chapter "L'accomplissement corporel chez les enfants de III e- IV e classes
de l'ecole no.178 de Bucarest", Spineni, D., Glavce, C., David-Rus R., Manuc, D.,Roville-Sausse, F. chapter
"Understanding obesity in romanian children and adolescents: steps to an anthropological perspective":, ISBN:
973-27-2133-9
Kozma,A., Glavce,C., Balaceanu Stolnici, C., (2012), Anthropology and culture, Glavce, C., Radu, E. Sima, A.
Milici, N., Ionescu-Targoviste, C., Iancu, E., Kozma, A., chapter: Anthropological aspects of obesity among adult
population in Romania: 190, ISBN 978-973-748-674-5
Ministry of Health, Romania, Institute for Mother and Child Care Alfred Rusescu, Bucharest, Romania, Center
for Disease Control, Georgia, USA, UNICEF Romania National Nutrition Study of Chidlren under 5 years old -
Final report 1993,

LIFETIME IMPACT AND COST OF CHILDHOOD OBESITY IN EUROPE (PART 2) 107
Mihalache, L. (2010) “Obesity in a rural community from Iasi county” Unpublished Doctoral Thesis available on
www.umfiasi.ro , Faculty of Medicine, University of Medicine and Pharmacy, Iasi
Mocanu, V. (2013). “Prevalence of Overweight and Obesity in Urban Elementary School Children in
Northeastern Romania: Its Relationship with Socioeconomic Status and Associated Dietary and Lifestyle
Factors.” Hindawi Publishing Corporation BioMed Research International, ArticleID537451,
http://dx.doi.org/10.1155/2013/537451.
Morea, M., & Miu, N. (2013). “Metabolic syndrome in children.” Human & Veterinary Medicine5(3): 103-108.
Morea, M., Miu, N., Morea, V. F., & Cornean, R. (2013). Maternal obesity-a risk factor for metabolic syndrome
in children. Clujul Medical, 86(3), 259.
Nanu, M.I., Stativă, E., Moldovanu, F., Stoicescu, S., & Novak, C. (2011). “Chapter 4: Growth and
Development.” Evaluation of interventions’ efficiency of the national programs regarding nutrition of children
under 2 years. Translated version provided by first author.
Neagu, A. (2015). Body image dimensions among romanian adolescents. 52. 41-57.
Nicolescu, R., Cucu, A., Branduse, L., Dumitrache, C., Standescu, C.T., Kassai, V., Drost, M. (2013). Nutritional
status assessment in children from primary school by participation in the European Childhood Obesity
Surveillance Initiative (COSI). Bucharest: Romania National Institute of Public Health.
Olaya, B., Moneta, M. V., Pez, O., Bitfoi, A., Carta, M. G., Eke, C., ... & Mihova, Z. (2015). Country-level and
individual correlates of overweight and obesity among primary school children: a cross-sectional study in
seven European countries. BMC Public Health, 15(1), 475.
Preda, M.P. (2011) “Metabolic syndrome in childhood obesity”, Unpublished Doctoral Thesis available on
www.umfiasi.ro , Faculty of Medicine, University of Medicine and Pharmacy, Iasi
Radu E, Ciotaru L.O, Macovei A. (2007). Retrospection upon anthropological research of obesity in Romania.
Proc Roman Acad Series B1 9:45–50
Roman, G., Bala, C., Creteanu, G., Graur, M., Morosanu, M., Amorin, P., ... & Cadariu, A. A. (2015). Obesity and
health-related lifestyle factors in the general population in Romania: a cross sectional study. Acta
Endocrinologica (1841-0987), 11(1).
SEPHAR II results reported: http://www.romanianjournalcardiology.ro/wp-
content/uploads/2016/01/RRC_art_4-4-22.pdf
Stanescu, A. (coord.), authors: Nanu, R. , Palicari, G., Chauliac, M., Soaita, Constantin, M., National Nutrition
Surveillance Program, Institute of Mother and Child Care "Alfred Rusescu" and UNICEF, 1993-2000,
Stanescu, A., Stativa, E. (coord.), Nanu, M. (coord), authors: Nanu, R., Palicari G., Stativa, E., Vitcu, A. (2006),
Nutritional status of children under 5 years old, ISBN: 973-8411-45-9
Valean, C., Tatar, S., Nanulescu, M., Leucuta, A., & Ichim, G. (2009). Prevalence of obesity and overweight
among school children in Cluj-Napoca. Acta Endo (Buc), 5(2), 213-219.
https://www.saebo.com/stroke-statistics/ (accesed on 08.05.2017)
https://www.hindawi.com/journals/srt/2012/731570/ (accesed on 08.05.2017)
http://chartsbin.com/view/2438 (accesed on 08.05.2017)

LIFETIME IMPACT AND COST OF CHILDHOOD OBESITY IN EUROPE (PART 2) 108
http://actamedicamarisiensis.ro/category/amm-2011-vol-57-no-4/page/2/ (accesed on 08.05.2017)
http://www.insse.ro/cms/en (accesed on July 2016)
http://www.insp.gov.ro (accesed on October 2016)
http://cnsisp.insp.gov.ro (accesed on October 2016)
http://www.cnas.ro (accesed on April 2017)
http://www.ms.ro/ (accesed on October 2016)
http://www.mmuncii.ro
www.bnr.ro
http://www.snmf.ro

LIFETIME IMPACT AND COST OF CHILDHOOD OBESITY IN EUROPE (PART 2) 109
10. SLOVENIA
10.1 LOCAL CONTEXT
Ministry of Health of the Republic of Slovenia is the responsible authority for nutrition and health
enhancing physical activity policies, according to the Act Regulating the Sanitary Suitability of
Foodstuff, Products and Materials Coming into Contact with Foodstuffs (Slovene Official Gazete No.
52/00, 42/02 in 47/04)7. Nutrition council is defined by the law as the main advisory body for the
Minister of Health. New national strategy on Nutrition and health enhancing physical activity was
adopted for the period 2015 – 25 (“Dober tek, Slovenia”)8, based on the extensive evaluation
recommendations of the previous action plan9.
National health care plan 2016-25 “Together for healthy society” (Resolucija o nacionalnem planu
zdravstvenega varstva 2016–2025 »Skupaj za družbo zdravja« (ReNPZV16–25)10 was adopted based
on Health care and health insurance act in 2016 (currently under revision). Plan is defining Health in
all policies approach as the strategic aproach for work with other sectors. In the preparation and
implementation phasess of the national strategy on Nutrition and health enhancing physical activity
was adopted for the period 2015 – 25 number of different sectors were actively involved, such as
agriculture, forestry and food, education, science and sport, infrastructure and transport, labour,
family, social affairs and equal opportunities, economy, defence, finances. Number of other
stakeholders were also involved, including private sector, such as Chamber of Commerce and
Industry in Slovenia11, Chamber of Craft and Small Businesses in Slovenia12 and Slovene Chamber of
Commerce13, and non governmental organizations, such as Slovene Consumers organization,
Slovene Health Association14 and many others.
National Institute of Public Health as the governmental agency15 supports actions in nutrition and
health enhancing physical activity, with translation arguments and setting priorities participatory
and engaging to the policy level while intensively networking with a number of relevant stakeholders
at the national, regional, local and also international level.
On 22nd May 2017 the EU Semerster recommendations were published, for Slovenia you could find
them at the https://ec.europa.eu/info/sites/info/files/2017-european-semester-country-specific-
recommendations-commission-recommendations_-_slovenia.pdf - highlighting majority of the
7 http://www.pisrs.si/Pis.web/pregledPredpisa?id=ZAKO1381 8http://www.mz.gov.si/fileadmin/mz.gov.si/pageuploads/javno_zdravje_2015/resolucija_preh_gib/DTS_brosura__zgibanka_slo_in_angl/brosura_DTS_angl_A4_za_print.pdf 9 http://www.euro.who.int/__data/assets/pdf_file/0012/320520/FNAP-Slovenia-upgraded-2016.pdf?ua=1 10 https://www.uradni-list.si/glasilo-uradni-list-rs/vsebina/2016-01-0999?sop=2016-01-0999 11 https://eng.gzs.si/ 12 http://www.ozs.si/ozseng/Aboutus.aspx 13 http://www.tzslo.si/pic/pdf/broshure_tzslo_en.pdf 14 http://zasrce.si/ 15 http://www.nijz.si/

LIFETIME IMPACT AND COST OF CHILDHOOD OBESITY IN EUROPE (PART 2) 110
above mentioned issues, including the financial stability where lowering of the societal costs of
obesity is also important.
10.2 LOCAL EVIDENCE
10.2.1 Childhood Obesity / Overweight
Fourteen sources on the prevalence of child overweight and obesity were retrieved for Slovenia.
Three are described here. Slovenia is noteworthy in that it has a national monitoring and
surveillance system, SLOfit (http://en.slofit.org/) which has collected data on children’s measured
BMI, triceps skinfold, and a battery of eight motor tests annually since 1987. It covers all of the
population aged 6 to 19 years with sample sizes ranging from about 180,000-190,000 in recent
years. Participation rates are generally a little over 90% of the population. Based on SLOfit data from
201416 (SLOfit database 1989-2015, Laboratory for the Analysis of Somatic and Motor Development,
Faculty of Sport, University of Ljubljana), 26.4% of boys and 22.2% of girls aged 7 to 18 were
classified as overweight or obese. Gender differences became apparent at around age 11 onwards
(with higher prevalence among boys). Prevalence of overweight and obesity peaked among girls at
ages 9-10 (with 26-27% overweight or obese), and among boys at ages 11-12 (with about 30%
overweight or obese), generally decreasing thereafter. Prevalence estimates from Kovac et al.
(2012), also based on SLOfit data from 2011, show similar results to those for 2014.
Among younger children in Slovenia, Sedej et al. (2014) estimated, on the basis of a representative
sample of 5 year-olds, that 17% of boys and a little over 21% of girls were overweight or obese.
Round 2 of the COSI study indicated that overweight and obesity combined ranged from 17% to 26%
in boys aged 6 to 9, and from 18% to 29% in boys aged 6 to 9, with prevalence increasing with age
(Wijnhoven et al., 2014a). The increase of prevalence with age in COSI is consistent with the SLOfit
results. Results for Slovenia for the third round of COSI are not yet published.
Trends
Slovenia’s national monitoring and surveillance system, SLOfit, provides annual data on the BMI of
children aged 7-18 years since 1987. Several papers have been published examining trends on the
basis of the SLOfit data (Kovac et al., 2008, 2012, 2014; Leskosek et al., 2010). For example, Kovac et
al. (2012) examined trends from 1991-2011 on the basis of these data. They found that the
percentage of overweight (IOTF cut-points) increased substantially from 1991 to 2011, from 13.3%
to 19.9% in boys and from 12.0% to 17.2% in girls. Prevalence of obesity also rose even more
dramatically, from 2.7% to 7.5% in boys and from 2.1% to 5.5% in girls. Based on SLOfit data from
2010-201517 (SLOfit database 1989-2015, Laboratory for the Analysis of Somatic and Motor
Development, Faculty of Sport, University of Ljubljana), rates of overweight and obesity (IOTF
criteria) have remained quite stable in recent years with some evidence of a decline in overweight
16 With thanks to Dr Gregor Starc for providing the data.

LIFETIME IMPACT AND COST OF CHILDHOOD OBESITY IN EUROPE (PART 2) 111
and obesity since around 2010. During these years, between 19.0% and 20.4% of boys aged 7 to 18
were overweight, and between 6.9% and 7.5% were obese. Among girls aged 7 to 18 during these
years, between 16.6% and 17.8% were overweight, and 6.1% to 6.6% were obese.
Sedej et al. (2014) examined trends in prevalence among 5 year-olds in 2001, 2003-2005 and 2009
and found that rates of overweight and obesity were stable among both boys and girls during this
time period.
In summary, recent trends among both children and adolescents suggest a stabilisation in the
prevalence of overweight and obesity in Slovenia, along with some evidence of a slight decrease
since around 2010.
10.2.2 Childhood Impacts
In Slovenia, three papers were retrieved. Two of these examined musculo-skeletal/motor
performance and pulmonary/aerobic function (Leskosek et al., 2007; Matejek et al., 2014). For
example, among 7-18 year-olds, Leskosek et al. (2007) reported that the performance in almost all
the fitness tests administered was substantially hindered (or at least had a negative correlation) with
obesity – regardless of the age or sex of the children. The greatest influence of obesity was found in
tests requiring movement of the whole body. The third study (Mocnik et al., 2015) reported an
association between less compliant arteries and childhood obesity and hypertension.
10.3 DATA DOCUMENTATION
Phase 1: Data Collation
20171130 Phase 1 (Slovenia) Data Calculations (1).xlsx
20171130 Phase 1 (Slovenia) Data Calculations (2).xlsx
20171130 Phase 1 (Slovenia) Data Collation Workbook.xlsx
20171130 Phase 1 (Slovenia) Data Sources.xlsx
Phase 2: Pre-simulation Data Processing
20171130 Phase 2 (Slovenia) Data Documentation (Part 1).xlsx
20171130 Phase 2 (Slovenia) Data Documentation (Part 2).docx
Phase 5: Post Simulation Review
20171130 Phase 5 (Slovenia) Model Outputs Workbook - DISC.xlsm
20171130 Phase 5 (Slovenia) Model Outputs Workbook - UNDISC.xlsm

LIFETIME IMPACT AND COST OF CHILDHOOD OBESITY IN EUROPE (PART 2) 112
Table. Phase 1: Slovenia Disease Data Quality Scores
1 2 3 4 5 6
No acceptable
data
Must be
estimated
from other
data1
International
proxy
"Approximate"
data only2
Not
applicable
(non-fatal
disease)
Acceptable
data
1. For disease parameters: prevalence, incidence, survival mortality)
2. "Approximate" data only:
ICD code mismatch
Hospital data used for prevalence or incidence
Self-reported BMI
Regional (sub-national) data
Adult diseases
DISEASE MORTALITY INCIDENCE SURVIVAL PREVALENCE
Oesophageal Cancer
Colorectal Cancer C18; C19-C21
Liver Cancer C22 C22 C22
Gallbladder Cancer C23 & C24
Pancreatic cancer
Cancer-Breast, post-menopausal (females only aged 50+)
Endometrial cancer C54 C54 C54 C54
Ovarian Cancer
Prostate cancer (males only)
Kidney Cancer C64 & C65
Urothelial Cancer (males only)
Thyroid cancer
Type 2 Diabetes Not required for the model
Not required for the model
Polycystic Ovarian Syndrome
calculated from mortality and prevalence

LIFETIME IMPACT AND COST OF CHILDHOOD OBESITY IN EUROPE (PART 2) 113
Multiple Sclerosis
calculated from mortality and prevalence
Stroke
calculated from mortality and prevalence
Hypertension Not required for the model
Not required for the model
Ischaemic Heart Disease
calculated from mortality and prevalence
Deep Vein Thrombosis
calculated from mortality and prevalence
Calculate prevalence from incidence
Asthma
calculated from mortality and prevalence
Non-alcoholic fatty liver disease (NAFLD)
Calculate incidence from prevalence
Gallbladder Disease
calculated from mortality and prevalence
same as incidence
Psoriasis
calculated from mortality and prevalence
Gout
calculated from mortality and prevalence
Osteoarthritis – Gonarthrosis Knee Pain
calculated from mortality and prevalence
Calculate prevalence from incidence
Chronic Back Pain
calculated from mortality and prevalence
Hypertension in pregnancy
calculated from mortality and prevalence
same as incidence
Pulmonary Embolus
calculated from mortality and prevalence
Calculate prevalence from incidence
Childhood diseases
DISEASE MORTALITY INCIDENCE SURVIVAL PREVALENCE
Wheezing disorders not available not available not available not available

LIFETIME IMPACT AND COST OF CHILDHOOD OBESITY IN EUROPE (PART 2) 114
Metabolic syndrome not available not available not available not available
Hyperlipidemia not available not available not available not available
Depression zero deaths Prob survival = 1 if zero deaths
Obstructive sleep apnoea zero deaths Prob survival = 1 if zero deaths
Calculate prevalence from incidence
High blood pressure Not required for the model
Not required for the model
age 15 to 19
Type 2 diabetes Not required for the model
Not required for the model
age 15 to 19
Asthma age 15 to 19
Non-alcoholic fatty liver disease
Calculate incidence from prevalence
Musculoskeletal pain age 0 to 19 - chronic back
pain
Calculate incidence from prevalence
age 15 to 19 - chronic back pain
10.4 DATA
Phase 1: Data Collation
20171130 Phase 1 (Slovenia) Data Collation Workbook.xlsx
Phase 2: Pre-simulation Data Processing
Data not available (see Data Documentation files)
Phase 3 and 4: Simulation Modelling and Cost Estimation
20171130 Phase 3&4 (Slovenia) Initial Model Output Workbook.xlsx
Phase 5: Post Simulation Review
20171130 Phase 5 (Slovenia) Initial Resturctured Model Output Workbook.xlsx
20171130 Phase 5 (Slovenia) Initial Core tables and Graphs Workbook.xlsx
Phase 6: Reporting
20171130 (Slovenia) Final Restructured Model Output Workbook.xlsx
20171130 (Slovenia) Final Combined Model Outputs SAS Dataset.ssd
20171130 (Slovenia) Final Combined Model Outputs Worksheet.xlsx

LIFETIME IMPACT AND COST OF CHILDHOOD OBESITY IN EUROPE (PART 2) 115
20171130 (Slovenia) Final Core Tables and Graphs Workbook.xlsx
UNDISCOUNTED and DISCOUNTED versions of the data files are available
As a result of the feedback loops include in the workflow; the software was sometimes rerun (this
happened for Slovenia) with corrected inputs. Only the final model outputs from the simulation
software are listed.
Table. Phase 5: Profile of Slovenia children (Preliminary: from Initial model which is under review)
Age Sex BMI at age 18 Number Percentage
Total (0-17) Persons Obese/Overweight 100,562 27.8
Healthy weight 261,468 72.2
Total 362,030 100.0
Females Obese/Overweight 46,643 26.5
Healthy weight 129,043 73.5
Total 175,687 100.0
Males Obese/Overweight 53,919 28.9
Healthy weight 132,424 71.1
Total 186,343 100.0
0-5 Persons Obese/Overweight 32,124 24.8
Healthy weight 97,329 75.2
Total 129,453 100.0
Females Obese/Overweight 15,785 1.3
Healthy weight 47,101 3.9
Total 62,886 5.2
Males Obese/Overweight 16,339 1.4
Healthy weight 50,228 4.2
Total 66,567 5.6
6-11 Persons Obese/Overweight 32,822 27.2
Healthy weight 88,031 72.8
Total 120,852 100.0
Females Obese/Overweight 15,538 26.5
Healthy weight 43,151 73.5
Total 58,690 100.0
Males Obese/Overweight 17,283 27.8
Healthy weight 44,879 72.2
Total 62,162 100.0
12-17 Persons Obese/Overweight 35,617 31.9
Healthy weight 76,108 68.1

LIFETIME IMPACT AND COST OF CHILDHOOD OBESITY IN EUROPE (PART 2) 116
Total 111,725 100.0
Females Obese/Overweight 15,320 28.3
Healthy weight 38,791 71.7
Total 54,110 100.0
Males Obese/Overweight 20,297 35.2
Healthy weight 37,317 64.8
Total 57,614 100.0
SLOVENIAN REFERENCES
Kovac, M., Jurak, G., & Leskosek, B. (2012). "The prevalence of excess weight and obesity in Slovenian children and adolescents from 1991 to 2011." Anthropological Notebooks 18(1): 91-103.
Sedej, K., Kotnik, P., Avbelj Stefanija, M., Groselj, U., Sirca Campa, A., Lusa, L., Battelino, T., & Bratina, N. (2014). "Decreased prevalence of hypercholesterolaemia and stabilisation of obesity trends in 5-year-old children: possible effects of changed public health policies." European Journal of Endocrinology 170(2): 293-300.
Wijnhoven, T. M., van Raaij, J.M., Spinelli, A., Starc, G., Hassapidou, M., Spiroski, I., Rutter, H., Martos, E., Rito, A.I., Hovengen, R., Peréz-Farinós, N., Petrauskiene, A., Eldin, N., Braeckevelt, L., Pudule, I., Kunesova, M., & Breda, J. (2014a). "WHO European Childhood Obesity Surveillance Initiative: Body mass index and level of overweight among 6-9-year-old children from school year 2007/2008 to 2009/2010." BMC Public Health 14.
Leskosek, B., Strel, J., & Kovac, M. (2007). “Differences in physical fitness between normal-weight, overweight and obese children and adolescents.” Kinesiologia Slovenica 13(1): 21-30.
Matejek, C., Planincec, J., Fosnaric, S., & Pisot, R. (2014). “Relations of weight status and physical fitness of children in Slovenia.” Zdrav Var 53: 11-16.
Mocnik, M., Nikolic, S., & Varda, N.M. (2015). “Arterial Compliance Measurement in Overweight and Hypertensive Children.” Indian Journal of Pediatrics DOI 10.1007/s12098-015-1965-2.

LIFETIME IMPACT AND COST OF CHILDHOOD OBESITY IN EUROPE (PART 2) 117
11. CHALLENGES AND LESSONS, RECOMMENDATIONS AND
CONCLUSIONS
11.1 CHALLENGES AND LESSONS
JANPA WP4 was a very ambitious project with eight particpating countries and a relatively short
timetable. A more realistic and more structured longer term work programme would have been
useful.
It encountered a number of significance challenges, a number of which only emerged during the
project. These challenges concerned both scientific and organisational issues:
Conceptual challenges
Data demands
Software implementation
Documentation
Organisationally complex
Challenging communications
Inadequately resourced
We outline these in the table below:
Table 11 (a): Challenges encountered
CHALLENGE LESSONS
Conceptual challenges
Lifetime costing studies and closed cohort simulations are relatively new methodologies. They require solutions to conceptual challenges such as:
Summarising risk factor exposures (childhood obesity/overweight) that occur over long period of time
Modelling lifetime BMI trajectories using techniques that incorporate a longitudinal perspective using limited cross-sectional historical data
Data handling protocols that reflect their inherently longitudinal nature
Validation of the model and country findings
A range of statistical issues including the construction of meaningful uncertainty intervals around key metrics
Lesson: A wider properly supported network of researchers to undertake a systematic, longer term approach is needed

LIFETIME IMPACT AND COST OF CHILDHOOD OBESITY IN EUROPE (PART 2) 118
Data demands Micro-simulation models dealing with such complex issues as the impact and costs of childhood obesity/overweight require significant data and research inputs:
These challenges were exacerbated by the diversity in the information systems across the eight participating countries
This diversity resulted in significant data imputation and the associated methodological challenges
The challenges were exacerbated by the fact that the gathering and processing of the requisite data was spread across the organisations
Software implementation The JANPA costing model was implemented in a modification of existing UKHF (sub-contractor to IPH IRL) software because of its wide use.
The existing software has been used primarily for another type of model (what we have called “open cohort simulation models”). It is unclear if some of the fundamental components of the existing software can reflect the longitudinal nature of the JANPA costing model (a “closed cohort simulation model”) in countries whose obesity rates change too dramatically during childhood.
The modifications required were more complex than expected
The lead team at IPH IRL found it difficult to validate the modifications because the existing software and modifications were written in closed source proprietary software
Lesson: Implement model in software written in open source code available to other researchers
Documentation Transparency was one of the key Principles of JANPA WP4 and it was fully supported by CHAFEA and participating countries. This was challenging: :
The complex group of participants involved
The fragmentation of tasks across organisations with different cultures and responsibilities
Implementation of the model in closed source software
Lesson: Ensure systematic approach to project documentation with appropriate resources
Organisationally complex
JANPA WP4 involved a complex group of participants:
Seven teams spanning eight different countries
Software implementation sub-contracted to an independent organisation
Organisations operating in different sectors with different cultures and responsibilities
An eighth country (Northern Ireland) included in the Irish arm with additional funding from safefood (www.safefood.eu)
A diverse lead team in IPH IRL whose membership changed considerably during the project particularly during a period of severe staff cuts
Lesson: Greater support for the managing and co-ordinating these different participants
Challenging communications
Communicating across such a diverse group of participants was challenging:
Discussion of different types of simulation models requires appropriate technical language and terminology. The terms “open” and “closed” cohort simulation models were introduced to help resolve this issue.
Several tasks were challenging without the possibility for direct

LIFETIME IMPACT AND COST OF CHILDHOOD OBESITY IN EUROPE (PART 2) 119
communication with the sub-contractor’s software developers. These included:
o Modification of exiting software o Interpreting model outputs and identifying issues during the Post-
Simulation Review phase o Communicating to the sub-contractor the data and software
issues identified during those reviews o Negotiating changes to the implementation software to deal with
these issues These communication challenges were exacerbated when the lead team at IPH IRL experienced severe staff cuts Lesson: Avoid such fragmentation of the project tasks, pay closer attention to communication, and ensure clear communication between software developers and data analytical staff
Inadequately resourced
For such an ambitious project, human and financial resources and flexibility to adjust to changing circumstances and emerging challenges were always going to be critical.
In hindsight, the initial budgets for the lead team, participating countries and software sub-contract were inadequate
During the project, the scope of the sub-contract was significantly reduced to contain costs. To achieve this, the lead team at IPH IRL 1) took greater responsibility for data processing; 2) reduced the details that were provided in model outputs; and 3) took responsibility for reporting the results of simulations. These changes required protracted negotiation and significant unexpected work for the lead team at IPH IRL.
At a very critical stage of the project, the lead team in IPH IRL experienced severe staff cuts which meant work had to be done by a larger number of less experienced people unfamiliar with the project working on a short term basis
These resource issues, across the participants, led to inevitable delays. Lesson: A dedicated, more realistic budget managed within a larger well-resourced experienced modelling unit is needed
11.2 RECOMMENDATIONS
Recommendations about the modelling methodology and data and research requirements are
included in Deliverable D4.6.
With regard to the future development of the JANPA costing model we recommend sharing the
model with the OECD so that its managment and development can be incorporated in their ongoing
project to improve on the modelling capacity on the economics of prevention / public health.
This would include:

LIFETIME IMPACT AND COST OF CHILDHOOD OBESITY IN EUROPE (PART 2) 120
Conducting an independent scientific review of the JANPA costing model and how it was
developed
Developing stand-alone dedicated software, written in open source code, to fully implement
the model and making it available for use by all researchers
Conducting a detailed sensitivity audit and validation of the JANPA costing model once the
open source code is available
Deploying the JANPA costing model in all European countries for which good-quality data
are available for the next two years (2018-2019) with a dedicated European budget. This
would include the six countries for which data has already been collated (Croatia, Greece,
Italy, Portugal, Romania and Slovenia)
Organising a high-level European conference in 2020, for example at the European
Parliament, to draw comprehensive conclusions based on these estimates.
The JANPA costing model should be refined by incorporating research into the psychosocial
impacts of childhood obesity and their implications for human capital and the economy”.
Exploring the extension of the JANPA (childhood obesity/overweight) costing model to other
childhood risk factors that have significant short term and long term consequences that are,
in part, mediated through a similar adult risk factor. Early uptake of smoking and alcohol are
two examples.
11.3 CONCLUSIONS
JANPA WP4 was a very ambitious project. It is the first lifetime costing study of childhood
obesity/overweight that developed and applied standard modelling methodology in more than one
country. JANPA WP4 had eight participating countries.
JANPA WP4 encountered significant challenges but nevertheless established that reliable estimates
of the lifetime impacts and costs of childhood obesity/overweight could be obtained in more than
one country (see Deliverable D4.6). These estimates highlight the staggering human impact and
financial costs of childhood obesity/overweight and the substantial savings that could follow from a
modest change in mean childhood BMI.
The recommendations, incorporating the lessons learnt, plot a practical way of dealing with these
challenges. If implemented, then other valuable data that have been collated in all participating
countries during JANPA WP4 can be converted into reliable and meaningful estimates in those
countries as well as other EU countries.
Finally, the JANPA costing methodology is applicable to other childhood risk factors that,like
childhood obesity/overweight, have significant short term and long term consequences that are, in
part, mediated through a similar adult risk factor (like adult obesity/overweight). In particular,
the early uptake of alcohol consumption or smoking has several conceptual similarities with
childhood obesity.