the limits to profit-wage redistribution: endogenous
TRANSCRIPT
Institute for International Political Economy Berlin
The limits to profit-wage redistribution: Endogenous regime shifts in Kaleckian models of growth and distribution
Author: Kasper Köhler
Working Paper, No. 112/2018
Editors: Sigrid Betzelt, Eckhard Hein (lead editor), Martina Metzger, Jennifer Pedussel Wu, Martina Sproll, Christina Teipen, Achim Truger, Markus Wissen, Reingard Zimmer


The limits to profit-wage redistribution: Endogenous regime shifts in Kaleckian models of growth and distribution Kasper Köhler Abstract A feature of Kaleckian models of distribution and growth that is often overlooked is that they
describe a nonlinear relation between functional income distribution and demand and
growth, because the size of the multiplier is affected by redistribution from wages to profits
and vice versa. This paper addresses the nonlinearity of the standard post-Kaleckian model
by examining its so-called IS-curves. It is found that changes in functional income distribution
affect the ‘distribution-ledness’ of an economy: redistribution towards wages reinforces the
wage-led or profit-led character of an economy, while redistribution towards profits does
the opposite. In addition, redistribution towards wages can turn an intermediate regime
wage-led. A standard post-Kaleckian model with nonlinear investment behaviour is then
presented. This model yields substantially different IS curves, such that an optimal functional
income distribution can be derived. However, it is found that unlike in the standard model,
this optimum is not the same for the different classes, such that true opposing interests
appear in the model.
JEL classification: B59, E11, E12, E25, O40 Keywords: Distribution, growth, nonlinearity, demand and growth regimes, Kaleckian models Contact: [email protected] Acknowledgements: I would like to thank Eckhard Hein and Marc Lavoie, for their guidance, and Ryan Woodgate and Franz Prante for helpful comments. All remaining errors are my own.

1
1. Introduction
The well-known ‘post-Kaleckian’ growth model, developed independently by Bhaduri and
Marglin (1990) and Kurz (1991), and based on earlier models by Rowthorn (1981), Dutt
(1984) and Taylor (1985), is now commonly used for questions about growth and
distribution in post-Keynesian analysis (Hein, 2017; Lavoie, 2014, Chapter 6). The merit of
this model and its extensions is that they address long-run growth and capacity utilisation,
while incorporating functional income distribution. As a result, a large branch of heterodox
economic literature is concerned with the distinction between ‘wage-led’ and ‘profit-led’
demand and growth regimes, the former referring to a situation in which an increasing profit
share in national income leads to a slowdown in capital accumulation and declining capacity
utilisation, while the opposite holds for the latter. This distinction has in particular been the
basis of a substantial amount of empirical research, often centred around the question of
whether demand and growth are profit-led or wage-led1. However, the interpretation of
demand and growth regimes as static constellations is problematic, since there is no reason
to assume that regimes do not change over time. Moreover, most of the literature on the
post-Kaleckian model has so far ignored the question of the sustainability of demand and
growth regimes: does a profit-led regime remain profit-led after pursuing a profit-led growth
strategy, i.e. after persistent income redistribution from wages towards profits? The same
question can be asked for the wage-led regime. In other words: does the profit share have
an upper (or lower) threshold at which an economy switches from a profit-led growth
regime to a wage-led regime and vice versa, and if so, what factors determine this
threshold? This is the central question that will be addressed in this paper.
The opacity surrounding what exactly determines the demand and growth regime an
economy is in and when such regimes change has fuelled a number of critiques. Of course,
with given investment and saving functions, it is possible to analytically derive the required
conditions for the existence of certain regimes, as Hein (2014, p. 265) does. However, as
Palley (2014b, p. 2) notes, the parameters that determine whether these conditions are
fulfilled are usually seen as ‘deep primitive parameters’; they are regarded as exogenous and
therefore seldom subject to further examination. According to Palley, researchers should be
cautious when basing their policy advice on whether an economy seems to be wage-led or 1 See for example Onaran and Galanis (2013), Stockhammer and Ederer (2008) and Stockhammer, Onaran and Ederer (2008)
2
profit-led, because the currently prevailing regime can be the result of existing policies and
institutions, rather than being fixed and ‘natural’. Such institutional and political factors have
been highlighted especially by Palley (2012; 2013a; 2013b; 2014; 2016), but also by Carvalho
and Rezai (2015), Nikiforos (2016) and Prante (2017).
Blecker (2016) puts forward a different critique of the empirical studies. He argues that
profits are cash flows and affect current investment as such, while having no effect on the
desired capital stock and, therefore, on long run investment. The sensitivity of consumption
to changes in income, on the other hand, is small in the short run, but stronger in the long
run, as Blecker points out. The reason for this is that households tend to respond to
incidental changes in income by increasing or decreasing their saving, while they will change
their consumption patterns in the face of permanent changes. Blecker argues that
economies are therefore more likely to be profit-led in the short run than in the long run;
econometric results suggesting that an economy is profit-led can therefore be misleading.
A third strand of Kaleckian literature is dedicated to the possibility of nonlinear relations
within the post-Kaleckian model. Again, such nonlinearities can complicate or even
invalidate empirical research. In particular, nonlinearities have the potential of making
demand and growth regimes ‘endogenous’, in the sense that the regime depends on
functional income distribution. A threshold as described above then appears, so that
redistribution towards wages or profits can cause a regime to shift when that threshold is
reached. This poses a limit to the ‘virtuous process’ described by Stockhammer (2011), in
which redistribution towards profits in a profit-led regime or towards wages in a wage-led
regime induces high growth. Indeed, it is clear that the profit share cannot rise to 100 per
cent, nor fall to zero per cent: these scenarios are simply irrelevant for a model that seeks to
capture the dynamics of growth and distribution in a capitalist economy, of which both
profits and wages are an inherent component. However, they do raise the question of what
the limits to profit-wage redistribution in a capitalist economy are, and of what factors
determine these limits.
The aim of this paper is therefore twofold: on the one hand, it is to assess the theoretical
potential for regime shifts in the post-Kaleckian model. On the other hand, it is to analyse
the effect of functional income distribution on ‘distribution-ledness’, i.e. the degree to which
an economy is wage-led or profit-led (Nikiforos, 2016). As a result, a considerable amount of
3
attention will be devoted to nonlinearities in the post-Kaleckian model, both systemic and
behavioural.
To keep the exposition clear and focussed, several contributions to and elements of the
literature on wage-led and profit-led regimes will left out of the analysis. Firstly, this applies
to Blecker’s (2016) distinction between short run and long effects. Although his argument is
certainly interesting, it does not concern regime shifts, strictly speaking. Secondly, this paper
will not join the debate on the normal rate of capacity utilisation and the susceptibility of the
Kaleckian models to Harrodian instability, of which Skott (2012) is perhaps the most vocal
exponent. Instead, the Kaleckian hypothesis that the rate of utilisation is an adjusting
variable in the long run will simply be assumed to hold. Finally, the effect of capacity
utilisation on functional income distribution will be disregarded. Although there are
powerful arguments for assuming that this effect matters, I would like to argue that there
are numerous factors that affect functional income distribution, many of them political and
institutional and therefore difficult to incorporate in economic models. Furthermore,
disregarding this feedback effect facilitates a clearer analysis of the effect of functional
income distribution on demand and growth. It will therefore be assumed that the profit
share is a completely exogenous variable, so that the causality runs in only one direction.
The remainder of this paper is structured as follows. The next section outlines a simple
version of the post-Kaleckian model, and discusses the degree to which ‘distribution-ledness’
varies in this model. Section 3 presents a critique of the post-Kaleckian model, aimed at the
sustainability of persistent wage-led and profit-led strategies, with a focus on nonlinear
behavioural equations. In Section 4, a simple post-Kaleckian model with a nonlinear
accumulation function (based on suggestions by Nikiforos, 2016) will be presented and
analysed. Section 5 provides a brief summary and some concluding comments.
2. Distribution-ledness and regime shifts in the standard model
The main result of the post-Kaleckian model is that growth and demand can be either ‘wage-
led’ or ‘profit-led’. The factors determining what regime applies to an economy have been
discussed extensively in the Kaleckian literature. However, while the model is designed for
dynamic analysis, its results are usually interpreted as being static by nature; an economy is
characterised by either profit-led or wage-led growth, and either profit-led or wage-led
capacity utilisation. The way the IS curve in the profit share – capacity utilisation space was

4
originally depicted by Bhaduri and Marglin (1990) can be seen as a symptom of this. The IS
curve shows all dynamic equilibria for a given set of values for the exogenous parameters,
while relating the profit share to capacity utilisation. In other words, it shows the effect of a
change in the profit share on the equilibrium rate of capacity utilisation, keeping everything
else constant. For simplicity, Bhaduri and Marglin produce a linear IS curve, which is upward
sloping for the profit-led regime, and downward sloping in the wage-led case. This curve
thus suggests that a change in functional income distribution has no effect on the extent to
which an economy is profit-led or wage-led.
Few researchers seem to be interested in this: although several authors (e.g. Blecker,
1989) present a nonlinear IS curve, the exact shape of the curve is seldom explicitly
discussed. This is odd because, as will be demonstrated below, the IS curve is only linear in a
very specific case. Furthermore, the fact that the curve is nonlinear in all other cases proves
the relevance of the concept of ‘distribution-ledness’2. Nikiforos (2016) presents a Kaleckian
model in which the ‘degree of distribution-ledness’ changes endogenously; however, the
simple versions of the Kaleckian distribution and growth models already contain the
possibility of changing distribution-ledness, and even – albeit to a very limited extent – the
possibility of regime shifts, as a result of functional income redistribution.
The model used for the analysis in this section is a simple post-Kaleckian growth model,
based on Hein (2014, Chapters 6 & 7). It is set in a world of oligopolistic competition, such
that firms have the power to set prices within certain limits. They do so by marking up unit
labour costs:
! = (1 +&)() , (2.1)
where ! is the price level, & the mark-up, ( the total wage bill and ) total output. The
mark-up is determined by the institutional characteristics of the economy, such as market
concentration and trade union power (Hein, 2014, Chapter 5). Functional income
distribution is therefore regarded as a variable exogenous to the models, determined by the
mark-up of firms:
2 Nikiforos (2016) proposes a mathematical definition of ‘distribution-ledness’, but that definition is somewhat less applicable to the explicit model presented here. Instead, the term will be used here to refer to the degree to which capacity utilisation and/or growth are wage-led or profit-led. In mathematical terms, it thus simply refers to the slope of the IS curve.

5
ℎ = ,!) =
!) −(!) =
(1 +&)( −((1 +&)( = &
1 +&, (2.2)
where ℎ is the profit share in total income and , aggregate profits. Furthermore, it is
assumed that firms operate below full capacity output, so that they can produce more when
demand increases; an increase in demand has a quantity effect rather than a price effect.
Output is completely homogeneous, as are capital and labour. The rate of profit . in this
economy can be decomposed as follows:
. = ,!/ = ,
!)))∗)∗/ = ℎ 12,
(2.3)
where / stands for the (real) capital stock, )∗ for potential output (i.e. full capacity output),
1 for the rate of capacity utilisation and 2 for the capital-potential output ratio. Finally, there
are two behavioural equations, which describe aggregate saving and aggregate investment;
both are normalised by the capital stock for convenience. The saving rate 3 is often
presented as a linear function of the profit share and the rate of utilisation:
3 = 4!/ = 56. = 56ℎ
12 , 0 < 56 ≤ 1, (2.4a)
where 4 stands for aggregate saving and 56 for the propensity to save out of profits. This
function describes the most basic case in which there is no saving out of wages; only
recipients of profit income are assumed to save. However, it can be easily adjusted to
include saving out of wages (4:):
3 = 46 + 4:!/ = 56, + 5:() − ,)
!/ = [5: + (56 − 5:)ℎ]12,
(2.4b)
where 46 is saving out of profits and 5: is the propensity to save out of wages. Although
Bhaduri and Marglin (1990) present an implicit investment function, simply noting that
investment depends on the profit share and the rate of capacity utilisation, I will use the
explicit investment function proposed by Kurz (1991), since this enables a more elaborate
analysis of the demand and growth regimes. This explicit function also includes a constant =:
> = ?/ = = + @1 + Aℎ. (2.5)
In equilibrium, saving and investment must be equal:

6
>∗ = 3∗, (2.6)
so that the equilibrium values for growth and capacity utilisation are:
1∗ = = + Aℎ[5: + (56 − 5:)ℎ]
12 − @
, (2.7)
>∗ =(= + Aℎ)[5: + (56 − 5:)ℎ]
12
[5: + (56 − 5:)ℎ]12 − @
. (2.8)
Under a classical saving assumption (i.e. 5: = 0), this simplifies to:
1∗ = = + Aℎ56ℎ2 − @
, (2.7a)
>∗ =(= + Aℎ)56
ℎ2
56ℎ2 − @
. (2.8a)
For these equilibria to be stable, a Keynesian stability condition must hold:
D3D1 −
D>D1 > 0 → 56
ℎ2 − @ > 0. (2.9)
The first order derivatives with respect to the profit share of the equilibrium values can be
both positive and negative, so that demand and growth can be both wage-led and profit-led:
D1∗Dℎ = −
= 562 + @A
G56ℎ2 − @H
I, (2.7b)
D>∗Dℎ =
562 GAℎ
I 562 − 2@Aℎ − =@H
G56ℎ2 − @H
I . (2.8b)
Since (2.7b) is always negative when (2.8b) is, there are three possible regimes: the wage-led
(or cooperative stagnationist, in the terminology of Bhaduri and Marglin) regime, the
intermediate (or conflictual stagnationist) regime and the profit-led (or exhilarationist)
regime. The intermediate regime is the special case in which capacity utilisation is wage-led,

7
while growth is profit-led. The conditions for profit-led capacity utilisation and growth are,
respectively:
D1Dℎ > 0 → −= 562 > @A
(2.7c)
and
D>Dℎ > 0 → AℎI 562 > 2@Aℎ + =@. (2.8c)
As noted by Bhaduri and Marglin (1990), the IS curve in the profit share and capacity
utilisation space – hereinafter referred to as the utilisation curve – can have two basic
shapes: it can appear both as a rising and as a declining line. However, neither of these
shapes are linear: the slope of both lines is decreasing. In other words, the wage-led or
stagnationist regime becomes less wage-led when the profit share increases, while the
profit-led or exhilarationist regime becomes less profit-led. This is shown below in Figure 2.1.
Mathematically, this result is unsurprising: the profit share only appears in the
denominator of the first order derivative, so that the denominator increases when the profit
share increases and the slope therefore declines. Economically, the reason behind these
shapes is somewhat less obvious, but logical upon closer inspection. A profit-led regime can
arise when a higher profit share leads to a higher rate of capital accumulation by firms. This
1∗
ℎ
1∗
ℎ (a)
(b) Figure 2.1: Utilisation curves of the post-Kaleckian model, wage-led (a) and profit-led (b)

8
can have a strong positive effect on overall capacity utilisation in the economy, because the
increased investment leads to increased employment, and the increased wages that are paid
lead to increased consumption expenditure. This is the process that lies behind the
Keynesian multiplier. However, a higher profit share means a lower wage share: every
increase in employment (and therefore in investment) will therefore lead to lower
consumption expenditure when the profit share is higher. This is shown by the simple
Keynesian investment multiplier: as a higher profit share by assumption leads to a higher
average propensity to save, the multiplier K) = K?/5 decreases. This is also true in a
dynamic context. Redistribution towards profits in the profit-led regime is therefore less
effective when the profit share is higher, while redistribution towards wages in the wage-led
regime is also less effective; the Bhaduri-Marglin model thus suggests that wage-led demand
exhibits increasing marginal returns, whereas profit-led demand suffers from the opposite3.
The story becomes somewhat more complicated, however, when one looks at growth
and capital accumulation as well. As is well-known, the wage-led regime can be either
‘cooperative’ or ‘conflictual’; the former means a higher wage share leads to higher growth
and profit rates, while the latter refers to the opposite (Bhaduri and Marglin, 1990). The
conflictive version of the wage-led regime, which Bhaduri and Marglin connect to the
Marxian ‘profit squeeze’ theory, has been recognised as a separate third regime by others
(e.g. Hein, 2014). This intermediate regime is characterised by wage-led capacity utilisation,
but profit-led growth. The condition for a positive first order derivative of output growth
with respect to the profit share is the same as that of the profit rate:
D>∗Dℎ > 0 → AℎI 562 − 2@Aℎ − =@ > 0, (2.8d)
D.∗Dℎ > 0 → AℎI 562 − 2@Aℎ − =@ > 0. (2.3a)
Since this condition contains the profit share itself, it is clear that the level of the profit share
affects not only the degree of distribution-ledness, but also which regime applies to an
economy. In other words, the character of the regime can change when functional income
distribution changes, which can be seen clearly from the IS curve in the profit share-
3 A similar analysis is presented by Prante (2018).

9
accumulation space (Figure 2.2). In the remainder of this paper, this curve will be referred to
as the growth curve.
Again, two different shapes are possible. Clearly, the shape of the curve does not depend on
the sign of the first order derivative. Instead, the sign of the second order derivative
determines the shape of the curve; a positive second order derivative means that the slope
of the curve is increasing, as in Figure 2.2a, while the opposite means that the growth curve
of Figure 2.2b appears. The condition for shape (a) is thus:
DI>∗DℎI =
2@ 562 G@A + =562 H
G56ℎ2 − @H
M > 0. (2.8e)
Since the stability condition requires that the denominator is positive, this can be simplified
to:
DI>∗DℎI > 0 → @A > −= 562 .
(2.8e*)
This is the exact same condition as for the wage-led demand regime, which is why shape (a)
in Figure 2.2 is labelled the ‘wage-led’ shape, even though it has both an upwards sloping
and a downwards sloping part. In contrast, shape (b), which coincides with the profit-led
demand regime, is unambiguously profit-led. Thus, while growth becomes more profit-led
(or less wage-led) as the profit share increases in the first case (Figure 2.2a), it stays more or
>∗
ℎ
>∗
ℎ (a) (b)Figure 2.2: Growth curves of the post-Kaleckian model, ‘wage-led’ (a) and profit-led (b)

10
less consistently profit-led in the second case (Figure 2.2b). We can thus say that while
redistribution towards profits becomes progressively less effective when it comes to capacity
utilisation, this is not true for the growth and profit rates.
How can these shapes be explained? Clearly, the equilibrium growth rate is affected
positively by the profit share, while the profit share also has an indirect effect through the
rate of capacity utilisation. It is therefore not surprising that profit-led capacity utilisation
coincides with profit-led growth and profit rates, since in that case both the direct and the
indirect effect are positive. Nevertheless, the exact shape of the profit-led growth curve in
Figure 2.2b is not that obvious; it seems to be almost vertical at first, to become a straight
upwards sloping line after bending somewhat. As explained above, the profit-led utilisation
curve flattens because of the lower average propensity to save that results from an
increasing profit share. Since the rate of capacity utilisation is a relatively unimportant
motivator for accumulation in the profit-led regime, the effect of a lower investment
multiplier is not very strong in the profit-led growth curve in Figure 2.2b, so that the slope is
declining only slowly.
The first shape, in Figure 2.2a, can be traced back directly to the shape of the utilisation
curve. Since the effect of functional income redistribution on equilibrium capacity utilisation
diminishes as the profit share increases, through the already discussed declining multiplier
effect, this in turn affects the equilibrium growth rate. As the indirect effect of the profit
share on the accumulation rate declines, the direct effect becomes more prominent,
meaning that after a certain threshold, the direct effect overtakes the indirect effect. The
value of this threshold is determined by the propensity to save, the capital-potential output
ratio and the investment coefficients.
This sheds some new light on the discussion by Bhaduri and Marglin (1990) on
‘cooperative capitalism’. Bhaduri and Marglin argue that the ‘critical analytical condition for
the successful working of this model of cooperative capitalism is that the normalised value of
total profit […] must decrease as the real wage rate decreases and the profit share
correspondingly increases’ (ibid., p. 382, emphasis in the original). When this condition is not
fulfilled, they argue, a situation of ‘profit squeeze’ arises, that is, what is usually called the
intermediate or conflictive regime. However, the analysis above clearly shows that a wage-
led strategy in a wage-led regime will always succeed, as long as it is maintained for long
enough. Even when growth and the profit rate respond in an adverse way at first, the

11
intermediate regime shifts to a full wage-led regime as soon as the profit share falls below
the threshold defined above (that is, when there is no change in the behavioural
parameters). The success of a wage-led strategy thus depends on the perseverance of
policymakers.
Completeness requires one last remark regarding the IS curves of the simple post-
Kaleckian model, which is that a third constellation can arise, besides the two combinations
of capacity and growth curves described above. This is the situation in which the first order
derivative of the utilisation rate and the second order derivative of the growth rate with
respect to the profit share are exactly equal to zero. The condition for this is:
D1∗Dℎ = DI>∗
DℎI = 0 → @A2 = −=56. (2.7d)
In this case, the growth curve is a straight upwards sloping line through the origin (with a
slope equal to A), while the utilisation curve is a flat horizontal line. Capacity utilisation is
thus unaffected by functional income redistribution in this case, while the growth and profit
rate are strongly profit-led. This result simply means that consumption and investment
effects on effective demand cancel each other out completely, and the degree of
distribution-ledness is completely constant.
3. The case for endogenous regime shifts
The analysis in the previous section shows that the standard post-Kaleckian model is rather
versatile. However, some questions about the shapes of the IS curves do remain. First of all,
there is no possible ‘endogenous’ shift from wage-led to profit-led capacity utilisation and
vice versa; that is, changes in the profit share alone cannot cause such a shift. Secondly, it is
unclear what the limits to functional income distribution are: according to the model, wage-
led regimes remain wage-led, even when the wage share approaches 100%, while profit-led
regimes remain profit-led, even when the wage share is almost non-existent. Therefore, this
section presents alternatives to this puzzling characteristic of the model. To this end, the
(nonlinear) IS curve shapes proposed in the literature will be assessed first, after which the
relevance of nonlinear behavioural equations is discussed.

12
3.1 Other proposed IS curve shapes
Several authors have suggested that the utilisation curve may be nonlinear4. Marglin and
Bhaduri (1991, p. 145) extensively discuss the shape of this curve, noting that ‘all discussion
of the shape of the IS schedule is necessarily hypothetical. The truth is that we know
relatively little about its shape even in the neighbourhood in which the economy has actually
been operating and even less about its global shape’. However, they argue that recent
trends can indicate the approximate shape. Moreover, Marglin and Bhaduri offer some
speculative ideas themselves, and provide two potential utilisation curve shapes, shown
below in Figure 3.1.
They also discuss the implications of these shapes: in the case of shape (a), the economy is
wage-led when capacity utilisation is low, and profit-led when it is high. Shape (b) indicates
that the economy is wage-led for low levels of the profit share, and profit-led for high levels.
Unfortunately, Marglin and Bhaduri provide no explanation as to why this would be the case;
it is unclear what the reason for the existence of such dynamics would be, or in what kind of
situation they would arise. Furthermore, even though both IS curves indicate that a change
in functional income distribution can cause a regime shift, the main concern described in the
introduction to this section remains: wage-led economies stay wage-led even when the
4 Authors in the social structure of accumulation (SSA) tradition have also proposed nonlinear relations between profits, demand and growth (see for example Bowles and Boyer, 1988; Gordon, 1995). These auhors are, like many Kaleckians, concerned with the distinction between wage-led and profit-led growth, but take a more institutionalist/Marxist, power-oriented approach.
1∗
ℎ (a)
1∗
(b)
ℎ
Figure 3.1: Utilisation curve shapes, as suggested by Marglin and Bhaduri (1991)
13
wage share approaches unity, while profit-led economies can thrive with a negligible wage
share.
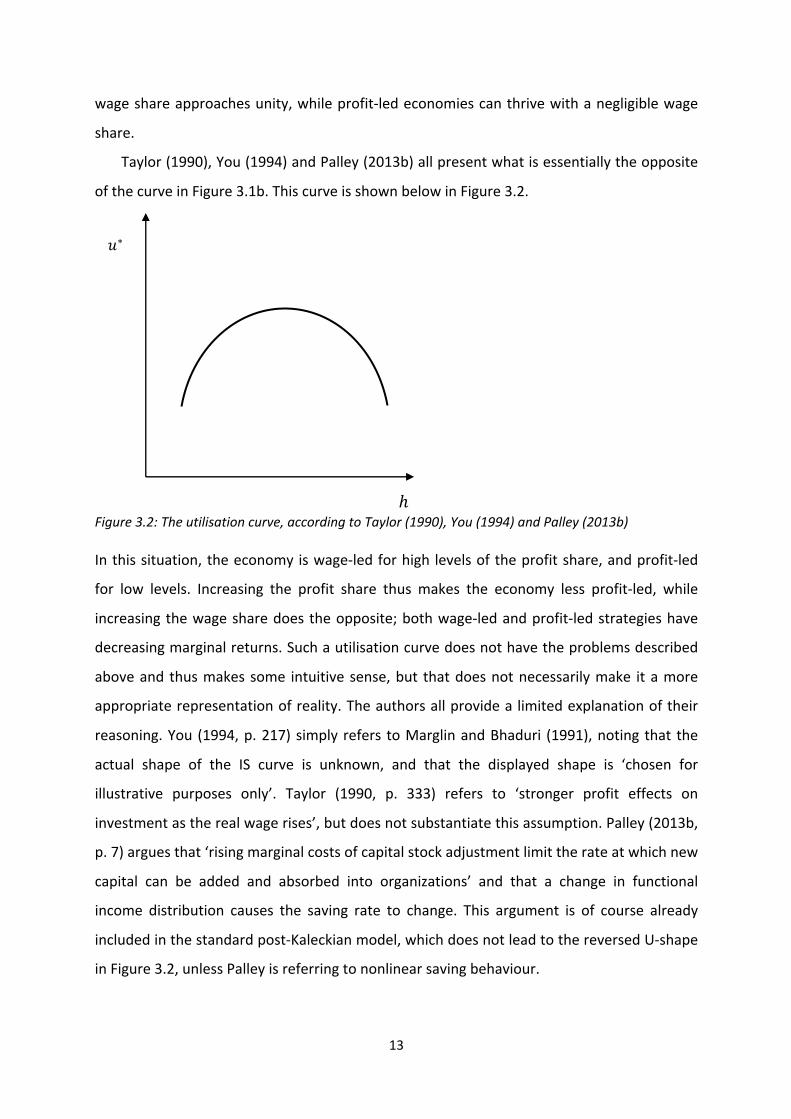
Taylor (1990), You (1994) and Palley (2013b) all present what is essentially the opposite
of the curve in Figure 3.1b. This curve is shown below in Figure 3.2.
In this situation, the economy is wage-led for high levels of the profit share, and profit-led
for low levels. Increasing the profit share thus makes the economy less profit-led, while
increasing the wage share does the opposite; both wage-led and profit-led strategies have
decreasing marginal returns. Such a utilisation curve does not have the problems described
above and thus makes some intuitive sense, but that does not necessarily make it a more
appropriate representation of reality. The authors all provide a limited explanation of their
reasoning. You (1994, p. 217) simply refers to Marglin and Bhaduri (1991), noting that the
actual shape of the IS curve is unknown, and that the displayed shape is ‘chosen for
illustrative purposes only’. Taylor (1990, p. 333) refers to ‘stronger profit effects on
investment as the real wage rises’, but does not substantiate this assumption. Palley (2013b,
p. 7) argues that ‘rising marginal costs of capital stock adjustment limit the rate at which new
capital can be added and absorbed into organizations’ and that a change in functional
income distribution causes the saving rate to change. This argument is of course already
included in the standard post-Kaleckian model, which does not lead to the reversed U-shape
in Figure 3.2, unless Palley is referring to nonlinear saving behaviour.
1∗
ℎ Figure 3.2: The utilisation curve, according to Taylor (1990), You (1994) and Palley (2013b)

14
3.2 Nonlinear behaviour
The IS curves in Section 3 are based on the assumption that the saving and investment
functions are linear; relaxing this assumption would lead to different outcomes. Although
the assumption of linear behavioural equations is standard in the Kaleckian growth
literature, some authors have suggested that nonlinear functions resemble reality more
closely (see for example Nikiforos, 2016). The idea of nonlinear behavioural equations is far
from new; Robinson (1962) assumes that accumulation is a nonlinear function of the rate of
profit, although she provides no strict arguments for the nonlinearity. In an even earlier
paper, Kaldor (1940) argues that both saving and investment are nonlinear functions of
output. He notes that firms are not likely to invest more when capacity utilisation is low,
even when profits increase. Furthermore, when capacity utilisation is at a very high rate,
firms attempting to accumulate at a higher speed will face increasing costs. This notion
strongly resembles Palley’s (2013b) argument mentioned above.
However, contrary to Kaldor’s (1940) investment function, the Kaleckian versions do
explicitly include capacity utilisation and profits, so that Kaldor’s first argument is already
included in the model5. Moreover, it is doubtful whether firms will really slow down
accumulation as a result of increasing costs when capacity utilisation is very high; the
underlying mechanism leading to rising costs (i.e. scarcity driving prices up) should also work
for the output of the firms attempting to invest more, so that investment still constitutes a
profitable business opportunity. And, if this not the case, then this means that the profit
share is declining, which has its own separate effect in the post-Kaleckian investment
function. There is also no clear reason why the financing of investment would become more
difficult with a higher rate of capacity utilisation; if anything, banks are more optimistic and
likely to provide loans in the boom phase of the business cycle, as Minsky (1977) famously
argued.
Nikiforos (2016) provides a more elaborate explanation as to why the behavioural
equations would be nonlinear. He argues that profits matter for investment decisions for
two reasons: because current and recent profits are the best indication firms have for future
profitability and therefore for the success of their investments, and because profits can be
retained, which is crucial for the financing of investment. According to Nikiforos, current 5 It could be argued that there should also be an interaction variable, as Kaldor asserts that the effect of profits on investment is not independent of the effect of capacity utilisation

15
profitability may become (relatively) less relevant as a predictor of future profitability when
the profit share increases, so that the sensitivity of investment to the profit share declines.
Unfortunately, it is unclear why this would be the case; Nikiforos refers to Kalecki
(1971/1943) and asserts that the limited size of a market may become more important for
investment decisions, relative to the profit share. But Kalecki (1971/1943) specifically
mentions that his argument applies to the short period; he does not refer to the medium or
long period that the Kaleckian growth models represent. In the long run, the market size
depends on equilibrium aggregate demand, which itself depends on investment; it is thus
strange to model profitability expectations as less sensitive to current profitability when the
latter increases, because of a limited market size.
However, that does not mean that market size does not play any role in investment
decisions in the long run. Nikiforos’s (2016) second argument is more compelling: he points
out that finance may be no longer constrained by retained earnings when a certain profit
margin is reached. When the profit share becomes very high, firms will have such an
abundance of retained earnings that a further increase does not incentivise firms to invest
more. This is because the market size and thus demand for firms’ output becomes a binding
constraint. Looking at modern day tech firms, this argument makes a lot of sense: companies
such as Apple, which is known for its enormous stock of retained earnings, will not be able to
invest more when their already huge profit margin increases, since they can already invest as
much as they deem fit. The market size thus does not influence the relation between current
and future profitability, but becomes more important relative to retained earnings, as the
latter gradually ceases to constrain investment.
Another reason for a declining effect of profits on investment can be found in the
behavioural response of economic agents to structural changes. In the post-Kaleckian model,
functional income distribution affects aggregate demand through the investment and saving
function. However, a change in the overall propensity to save also has an effect on the
structure of the economy: since an equilibrium position implies that saving and investment
are equal, a higher propensity to save must be accompanied by a higher investment share in
total output. In a long run equilibrium, this means that the production of investment goods
relative to consumption goods increases.
The question then arises whether this affects economic behaviour. Investment decisions
are made before any of the potential cash flows that result from them appear; consumption,

16
on the other hand, is usually done out of wages (or other types of income) that are already
earned6. Investment therefore entails a higher degree of uncertainty; investors make
decisions based on expectations of the future, which is fundamentally uncertain, whereas
consumers (mostly) make decisions based on things that have already happened7.
Investment behaviour is therefore at least partly based on Keynes’s (1936) famous ‘animal
spirits’, and thus somewhat less predictable than consumption behaviour. This explains the
fact that investment is the most volatile component of aggregate demand (Blecker, 2016). A
higher share of investment in total output – or more firms producing machines to make
machines with – thus results in the fact that more firms are basing their investment
decisions on the investment decisions of other firms, and are hence facing high uncertainty.
It seems reasonable to assume that this high level of uncertainty will have a dampening
effect on firms’ animal spirits8. The sensitivity of investment to profits may then be affected
negatively by an increase in the profit share, since the latter causes the economy to shift
from being consumption-based towards being investment-based. Combined with Nikiforos’s
(2016) argument on the smaller role for profits in investment financing when margins are
high, this leads to the assumption of an investment function that is nonlinear with respect to
the profit share, such that its first order derivative is declining when the profit share
increases (i.e. a negative second order derivative).
Besides the investment function, Kaldor (1940) argues that the saving function is
nonlinear as well. According to Kaldor, households save much less when income is very low;
there is some amount of autonomous consumption. On the other hand, those with very high
incomes save much more because some degree of saturation appears at high consumption
levels. Nikiforos (2016) reasons in a similar way regarding the relation between saving and
the profit share. He argues that as the profit share increases, the propensity to save out of
profits increases as well, because ‘no matter how extravagant rich households are, with
respect to their consumption, there is only so much that they consume’ (p. 398). This
6 This is of course not true for credit-based consumption expenditures. However, taking into account consumption credit does not change the fact that for most consumption, income is earned before the actual expenditure takes place, which is not necessarily the case for investment. 7 This is not to say that consumers do not have to deal with uncertainty, or that their consumption decisions are not affected by any form of uncertainty. The point here is not that consumers suffer less from uncertainty than investors; rather, those observing the behaviour of both groups of economic agents, are faced with higher uncertainty regarding the investment decisions of firms. 8 Riddick and Whited (2009, p. 1764) note that ‘the effect of uncertainty on the propensity to save out of cash flow is empirically at least as strong as the effect of finance constraints’.

17
argument closely resembles Keynes’s (1936) absolute income hypothesis. The elaborate
debate about this hypothesis will not be reviewed further here, but some notes on
Nikiforos’s interpretation are in order. As noted before, the propensity to save out of profits
is in the post-Keynesian and Kaleckian literature usually assumed to be higher than the
propensity to save out of wages. There are two reasons for this: part of profit income is
retained by firms, and therefore per definition saved, while the remaining part is distributed
to households. These households are usually richer than those that receive (only) wage
income, and richer households usually save a higher proportion of their income, even if only
because a smaller part of their income is required for basic necessities of life (Hein, 2014, p.
273).
Nikiforos extends this static assumption to a dynamic one: he assumes that the
propensity to save out of profits increases when the profit share increases. The rising profit
share most likely leads to higher personal income inequality. If one assumes that higher
income inequality leads to a larger gap between the propensities to save, then Nikiforos’s
argument makes sense. However, this argument by no means necessarily follows from the
assumption that richer households save a larger part of their income than poorer
households do at a specific point in time. Nikiforos essentially claims that the propensity to
save out of profits is a linear function of the profit share, which is a much more far-reaching
assumption than the standard Kaleckian presupposition. In fact, it is very well possible that
the latter holds, while at the same time the relation between the propensity to save out of
profits and functional income distribution is completely different from what Nikiforos
supposes; this depends on social and cultural norms (Prante, 2017).
Furthermore, Nikiforos’s (2016) theory of the propensity to save seems to disregard his
own theory about the sensitivity of investment to profits. If firms are indeed no longer
constrained by the availability of retained earnings when their profit margin is sufficiently
high, then one would expect these firms to distribute a larger part of their profits. This would
cause the propensity to save out of profits to decrease, which could partly or completely
offset the positive effect described above. As a result, the effect of a change in functional
income distribution on the propensity to save out of profits is uncertain.

18
4. Endogenous regime shifts in a simple Kaleckian model
Nikiforos (2016) proposes a method of incorporating his arguments on nonlinear behaviour
in the saving and investment functions of the post-Kaleckian model. In this section, his
suggestions will be applied partly: the model that will be presented below includes an
altered (nonlinear) investment function, but a standard post-Kaleckian saving function. The
reason for this is that the arguments for a nonlinear investment function are simply stronger
than those for a nonlinear saving function, as was explained in the previous section.
Moreover, even if there is, as Nikiforos suggests, a positive effect of the profit share on the
propensity to save, there may also be a counterbalancing negative effect9.
Another difference between the model presented here and the one by Nikiforos (2016),
is that functional income distribution is treated here as being completely exogenous. This
assumption most likely does not hold in reality, but enables a clearer analysis of the effect of
functional income distribution on growth and effective demand.
4.1 Assumptions and basic characteristics
The model has the same basic characteristics as the simple post-Kaleckian model. For
convenience, the main assumptions are reiterated here:
1) output consists of a homogenous product, which can be used both as an investment
good and as a consumption good;
2) there is no overhead labour;
3) the capital stock does not depreciate;
4) there are no raw materials nor intermediate products;
5) there is no technological progress and there are constant returns to scale, so that the
capital-potential output ratio and the labour-output ratio are both constant;
6) there is only one production technique available, which requires both labour and
fixed capital;
7) firms operate in an environment of oligopolistic competition, and determine their
prices by marking up unit labour costs;
9 Sticking with a linear saving function also simplifies the analysis considerably; introducing a nonlinear saving function as well would make the mathematics much more complicated. The qualitative results, however, would not be very different.

19
8) firms usually operate below full capacity utilisation, so that adjustment to changes in
aggregate demand takes place through quantities rather than prices;
9) output is not constrained by the availability of labour, because there are
unemployment workers willing to provide their labour power;
10) there is no government expenditure;
11) there is no foreign sector, that is, the economy is a closed economy;
12) workers earn wages which they completely spend on consumption; capitalists earn
profits which they partly save.10
At its core, the model consists of the same equations as the standard post-Kaleckian model
presented in Section 2:
. = ℎ 12, (4.1)
ℎ = 1 − 11 +&,
(4.2)
3 = 46!/ = 56. = 56ℎ
12,
(4.3)
> = ?/ = = + @1 + Aℎ, (4.4)
The only change made here is that the coefficient A, which represents the sensitivity of
investment to the profit share, is, following Nikiforos’s (2016) suggestions, now defined as:
so that the accumulation function can be written as:
10 A positive propensity to save out of wages can be introduced in this model; this will be elaborated upon in Section 4.4.
D3D1 −
D>D1 > 0 → 56
ℎ2 − @ > 0. (4.5)
A = AN − AIℎ;AN > AI, (4.6)
> = ?/ = = + @1 + (AN − AIℎ)ℎ = = + @1 + ANℎ − AIℎI.
(4.4a)

20
4.2 Equilibrium and IS curves
The equilibrium rates of capacity utilisation and growth follow from the goods market
equilibrium condition:
Capacity utilisation is profit-led when:
Capital accumulation, growth and the rate of profit are profit-led when:
As becomes clear from these equations, the level of the profit share now partly determines
the regime. Whereas in the standard post-Kaleckian model, a change in functional income
distribution could only turn a conflictive regime in a cooperative regime and vice versa (see
Section 2), such a change can now also turn a wage-led regime profit-led and the other way
around.
The IS curves tell a somewhat more complicated story. As with the standard post-
Kaleckian model, two main constellations can be distinguished. The first constellation, which
I will call the ‘wage-led case’, is shown in Figure 4.1.
> = 3, (4.7)
= + @1 + ANℎ − AIℎI = 56ℎ12,
(4.7a)
1∗ = = + ANℎ − AIℎI
56ℎ2 − @
, (4.8)
>∗ = 3∗ =(= + ANℎ − AIℎI)
56ℎ2
56ℎ2 − @
(4.9)
D1∗Dℎ > 0 → 2@AIℎ − AIℎI
562 − =
562 − @AN > 0. (4.8a)
D>∗Dℎ > 0 → 3@AIℎI +
562 (ANℎ
I − 2AIℎM) > =@ + 2@ANℎ. (4.9a)

21
In this case, the utilisation curve is strictly downwards sloping, as shown in Figure 4.1a, with
a decreasing absolute value of the slope. The wage-led case therefore obtains when the
second order derivative of the equilibrium rate of capacity utilisation with respect to the
profit share is positive:
Figure 4.1b presents the growth curve in the wage-led case. This curve is linked to the
capacity curve in Figure 4.1a, and also appears when condition (4.8b) holds. The shape of
this curve is determined by the same condition as that of the utilisation curve in Figure 4.1a.
The reason for this is that the rate of capacity utilisation appears in the investment function,
such that the shape of the curve in Figure 4.1a directly determines that of the curve in Figure
4.1b.
The second constellation, which will hereinafter be called the ‘dynamic case’, is shown in
Figure 4.2. This constellation arises when the second order derivative of the equilibrium rate
of capacity utilisation with respect to the profit share is negative, i.e.:
These curves have similar, inverted U-type shapes.
DI1∗DℎI > 0 → = 56
I
2I + @AN562 − @
IAI > 0. (4.8b)
DI1∗DℎI < 0 → = 56
I
2I + @AN562 − @
IAI < 0 (4.8c)
1∗
ℎ
>∗
ℎ (a)
(b) Figure 4.1: Utilisation (a) and growth (b) curves in the wage-led case

22
Finally11, a third constellation (here called the ‘unresponsive case’) appears when the second
order derivative is exactly equal to zero, i.e.:
The utilisation curve in that case is a straight, downwards sloping line, while the growth
curve is a parabola with a maximum; this is shown in Figure 4.312.
11 Obviously, there is a fourth case, when AI = 0; the model then becomes standard post-Kaleckian and all the IS curves look the same as before. 12 With the expression for the equilibrium growth rate derived above, the parabola also appears when @ = 0, no matter what the values of the other parameters are (as long as AI ≠ 0). The equilibrium rate of growth is then completely determined by exogenous variables, without any feedback effect of capacity utilisation.
DI1∗DℎI = 0 → = 56
I
2I + @AN562 = @IAI.
(4.8d)
1∗
ℎ
>∗
ℎ (a)
(b) Figure 4.2: Utilisation (a) and growth (b) curves in the dynamic case

23
4.3 Comparative dynamics, distribution-ledness and regime shifts
The equilibrium outcomes of the model provide some interesting insights. First of all, the
utilisation curve in the dynamic case (Figure 4.2a) strongly resembles the one suggested by
Taylor (1990), You (1994) and Palley (2013b). However, as with other versions of the post-
Kaleckian model, this outcome is not unique, and without any knowledge of the real values
of the exogenous parameters, there is no reason to assume that the utilisation curve actually
has this shape, and is not strictly downwards sloping. Therefore, in the remainder of this
subsection, the two different constellations will be analysed separately, without further
considering the borderline third situation of equation (4.8d) and Figure 4.3.
In the wage-led case (Figure 4.1), the utilisation curve is not that different from the
standard post-Kaleckian wage-led curve; the introduction of a nonlinear accumulation
function seems to have a limited effect, and the system is still more strongly wage-led for
low levels of the profit share, owing to the higher investment multiplier. However, the
concomitant, somewhat odd shape of the growth curve in Figure 4.1b shows that growth is
first strongly wage-led, then profit-led, and then wage-led again. Starting from a low profit
share, and redistributing income towards profits thus shifts the regime from wage-led to
intermediate/conflictive and back to wage-led. These strange dynamics can be explained by
the combination of the multiplier effect and the diminishing sensitivity of investment to the
>∗
ℎ
1∗
ℎ (a)
(b) Figure 4.3: Utilisation (a) and growth (b) curves in the unresponsive case

24
profit share. A low profit share means a low average propensity to save, and thus a high
investment multiplier, so that the economy is strongly wage-led; as this effect weakens
when the profit share increases, the direct positive effect of the profit share on investment
takes over. This effect also weakens, but exponentially (by assumption), so that the regime
becomes wage-led again at a higher level of the profit share, albeit less strongly wage-led
than before because of the lower investment multiplier.
Changing the exogenous parameters affects the curves by shifting them, but also by
changing their shapes. Increasing the propensity to save out of profits (56), or the AI variable
has a dampening effect on aggregate demand and therefore shifts the curves downwards,
whereas increasing the constant in the accumulation function (=), the sensitivity of
investment to capacity utilisation (@), the capital-potential output ratio 2 or the sensitivity of
investment to the profit share (AN) has a stimulating effect on aggregate demand, so that the
curves shift upwards. At the same time, an increase in =, @, 2 or AI strengthens the effect of
capacity utilisation on investment13, relative to profits, so that the trough in the growth
curve becomes smaller and the curve itself smoothens to a more unambiguously wage-led
shape; increasing ANor 56 has the opposite effect. Especially 56 strongly affects the shape of
the growth curve, since it determines the investment multiplier as well as the sensitivity of
the investment multiplier to changes in functional income distribution. When the difference
between saving out of profits and saving out wages increases, the trough in the growth
curve deepens. Needless to say, such a deepening or smoothening of the growth curve can
cause the economy to shift from a cooperative to a conflictive wage-led regime. This is
shown in Figure 4.4.
In the dynamic case of Figure 4.2, the effect of the nonlinear investment assumption is
immediately visible. The utilisation curve has an inverted U-shape, instead of the strictly
upwards sloping curve of the profit-led regime in the standard model. Capacity utilisation is
thus profit-led for low levels of the profit share, and wage-led for higher levels. What is
more, the growth curve reveals the same pattern, such that a change in functional income
distribution can in this situation shift the economy from completely wage-led to completely
profit-led. The multiplier effect is of course not absent in this situation; it is the reason why
13 That is, the effect on equilibrium investment. What is meant here is that a higher equilibrium utilisation rate has a stronger effect on investment than a lower rate.

25
the profit-led part of the IS curves is much steeper than the wage-led part14. Furthermore,
the fact that the two curves have a similar shape does not mean that they completely
overlap; therefore, an intermediate (i.e. conflictive) regime is still possible. The next
subsection provides a more elaborate discussion on this.
In the dynamic case, changes in the exogenous parameters have the same dampening
and stimulating effects as in the wage-led case. However, these effects can now be
subdivided in two categories: the curves can shift upwards (=, AN) or downwards (AI), or
they can become steeper (@, 2) or less steep (56). As a result, stimulating (dampening)
changes of the first, curve-shifting kind (‘Type I’, shown in Figure 4.5) make the economy less
(more) wage-led or profit-led, depending on the level of the profit share. Stimulating
(dampening) events of the second kind (‘Type II, shown in Figure 4.6), on the other hand,
increase (decrease) the ‘distribution-ledness’ of the economy. Moreover, such events can
shift the economy from profit-led to wage-led and vice versa, because they move the
maximum of the curve.
14 The wage-led part of the curves appears at higher levels of the profit share, so that the multiplier is smaller and the stimulating or dampening effect of income redistribution more modest.
>∗
ℎ
1∗
ℎ (a)
(b) Figure 4.4: Effects of an increase in the propensity to save out of profits on equilibrium capacity
utilisation (a) and growth (b) in the wage-led case

26
4.4 ‘Optimal’ distribution and conflicting interests
As is well known, Bhaduri and Marglin (1990) sought to provide a general theory of capitalist
economic dynamics, which could explain different political views regarding income
1∗
ℎ
>∗
ℎ Figure 4.5: Stimulating effects of changes in exogenous parameters of Type I on equilibrium capacity
utilisation (a) and growth (b) in the dynamic case
1∗
ℎ
>∗
ℎ Figure 4.6: Stimulating effects of changes in exogenous parameters of Type II on equilibrium capacity
utilisation (a) and growth (b) in the dynamic case

27
distribution. The resulting post-Kaleckian model does exactly that: it presents the possibility
of both wage-led and profit-led outcomes, so that it can potentially be used as an argument
for more than one ideology. However, while different analysts can hold different (mutually
exclusive) assumptions about the functioning of an economy, only one set of assumptions
can be true at a certain point in time. With a given set of fundamental values, that is, the
exogenous parameters in the model, one side of the argument is correct: aggregate demand
and growth are either wage-led or profit-led. In other words, the potential for true
conflicting interests is very limited in the model. A true conflict only arises in the conflictive
regime, when growth and the rate of profit are both profit-led and capacity utilisation is
wage-led; however, increasing the wage share in that case will make capacity utilisation only
more wage-led, while turning growth and the rate of profit-led wage-led as well, so that the
conflict disappears. It could also be argued that some can have an interest in turning the
regime from wage-led to profit-led or vice versa, which is how Marglin and Bhaduri (1990)
interpret Margaret Thatcher’s reform programme.
Opposing interests appear in a different way in the adjusted model presented in this
section. They do not really exist in the wage-led case; there is a set of values for the profit
share in which growth is profit-led, so that the overall regime is conflictive, but a higher
profit rate can be achieved by pursuing a wage-led growth strategy15. Therefore, in a
situation in which all economic agents are aware of this, there are no conflicting interests.
This is not true for the second constellation. Both IS curves in this case are inverted U-
shaped, so that they have a maximum, which suggests that there is an ‘optimal’ functional
income distribution. However, the curves do no completely overlap, such that their
maximums are obtained at different levels of the profit share. Since the maximum of the
growth curve lies to the right of the utilisation curve maximum, firms will prefer a higher
profit share than workers. Three ‘zones’ can therefore be distinguished: the area to the left
of the utilisation curve maximum is profit-led (1), the area between the two maxima is
conflictive (2) and everything to the right of the growth maximum is wage-led (3)16. This is
illustrated in Figure 4.7.
15 Unless the steeply downwards sloping part of the growth curve only exists for negative values of the profit share, so that the curve has an inverted U-shape for real values and there is an optimal profit share from the perspective of firms and rentiers. 16 A similar analysis is performed by Palley (2013b).

28
Letting go of the assumption that workers do not save complicates the story. When there is
a positive propensity to save out of wages, the profit rate is no longer equal to the saving
rate (and therefore, in equilibrium, the accumulation rate) divided by the propensity to save
out profits. As a result, the equilibrium profit rate is no longer necessarily wage-led or profit-
led when the equilibrium accumulation rate is. In fact, the IS curve that shows the
equilibrium profit rate as a function of the profit share (hereinafter the ‘profit curve’) now
has the shape of the dynamic case growth curve in the wage-led case and vice versa, so that
two new constellations appear. The two constellations are illustrated in Figure 4.8 and
Figure 4.9.
1∗
ℎ
>∗
1 2 3
Figure 4.7: Conflicting interests in the dynamic case, with profit-led (1), intermediate/conflictive (2)
and wage-led (3) zones

29
1∗
ℎ
>∗
.∗
Figure 4.8: IS curves in the wage-led case when workers save part of their wages
1∗
ℎ
>∗
.∗
Figure 4.9: IS curves in the dynamic case when workers save part of their wages

30
If one assumes that firms are interested in the profit rate and workers in the utilisation
rate, then some interesting observations can be made. The wage-led case now exhibits
conflicting interests: the optimal profit share for workers is infinitely small, while there is a
finite value for the profit share that is optimal for firms (and their shareholders). The
dynamic case becomes a puzzling case, in which the paradoxical situation arises wherein the
optimal profit share for capitalists is lower than the one for workers – although this is only
true when the steeply downwards sloping part of the profit curve exists for positive values of
the profit share. If it does not, a similar situation as in the wage-led case materialises, such
that capitalists will again prefer a higher profit share than workers.
5. Conclusion
The aim of this paper has been to provide an overview of nonlinearity and regime shifts in
Kaleckian models of distribution and growth. This has been done, on the one hand, by
scrutinising the standard post-Kaleckian model, and, on the other hand, by assessing the
relevance of nonlinear behavioural equations in a post-Kaleckian framework.
The standard post-Kaleckian model has been found to yield nonlinear IS curves, such
that the ‘distribution-ledness’ of an economy changes when functional income distribution
changes. In practise, this means that capacity utilisation becomes less wage-led or less
profit-led, depending on the regime, when the profit share increases. The reason for this is
the higher average propensity to save that results from an increase in the profit share, which
causes the Keynesian multiplier to decrease and therefore all stimulating and dampening
effects on aggregate demand to diminish. As a result, capital accumulation can switch from
wage-led to profit-led when the profit share increases, and vice versa, so that a conflictive
regime can turn into a cooperative regime. This is the first important result of this paper: the
standard post-Kaleckian model suggests that wage-led policies are also successful when the
regime is intermediate/conflictive, as long as they are pursued persistently.
Furthermore, it has been argued that while the results of the post-Kaleckian model may
be credible at a certain point in time, the global shape of the IS curves is rather unrealistic.
The reason for this is that these curves suggest that profit-led economies remain profit-led
even when the profit share approaches unity, while wage-led economies continue to be
wage-led even when the profit share is close to zero. Although it was concluded, as Kalecki

31
(1971/1967) does, that there are no systemic limits to profit and wage shares, such limits
may very well arise for behavioural reasons.
The main arguments for a nonlinear investment function identified here are a decreasing
importance of retained earnings for the financing of investment and high uncertainty in an
investment-based economy. Implementing these ideas in a simple post-Kaleckian model
results in appreciably different dynamics than those of the standard model. Firstly, changes
in functional income distribution can push the model economy from a wage-led regime to a
profit-led regime and vice versa. Secondly, in at least one of the possible constellations,
there is a limit to how high the profit share can be in a profit-led regime, and the same holds
for the wage share in a wage-led regime; surpassing this limit will flip the regime. Finally, the
most important result of this paper is that the inclusion of nonlinear behaviour strengthens
the ‘economic basis for contesting political ideologies’, as the seminal paper by Bhaduri and
Marglin (1990) was titled. The model presented in this paper opens up the possibility of
conflicting interests, even when economic agents have the same beliefs about reality.

32
References
Bhaduri, A. & Marglin, S. (1990). Unemployment and the real wage: The economic basis for
contesting political ideologies. Cambridge Journal of Economics, 14(4), 375-393.
Blecker, R. A. (1989). International competition, income distribution and economic growth.
Cambridge Journal of Economics, 13(3), 395-412.
Blecker, R. A. (2016). Wage-led versus profit-led demand regimes: The long and the short of it.
Review of Keynesian Economics, 4(4), 373-390.
Bowles, S. & Boyer, R. (1988). Labor discipline and aggregate demand: A macroeconomic model. The
American Economic Review, 78(2), 395-400.
Carvalho, L. & Rezai, A. (2015). Personal income inequality and aggregate demand. Cambridge
Journal of Economics, 40(2), 491-505.
Dutt, A. K. (1984). Stagnation, income distribution and monopoly power. Cambridge Journal of
Economics, 8(1), 25-40.
Gordon, D. M. (1995). Growth, distribution, and the rules of the game: Social structuralist macro
foundations for a democratic economic policy. In Epstein, G. A. & Gintis, H. M. (Eds.),
Macroeconomic Policy after the Conservative Era (pp. 335-383). Cambridge: Cambridge
University Press.
Hein, E. (2014). Distribution and Growth after Keynes: A Post-Keynesian guide. Cheltenham: Edward
Elgar.
Hein, E. (2017). Post-Keynesian macroeconomics since the mid 1990s: Main developments. European
Journal of Economics and Economic Policies: Intervention, 14(2), 131-172.
Kalecki, M. (1971/1943). Determinants of investment. In Selected Essays on the Dynamics of the
Capitalist Economy 1933-1970 (pp. 110-123). Cambridge, UK: Cambridge University Press.
Kalecki, M. (1971/1967). The problem of effective demand with Tugan-Baranovski and Rosa
Luxemburg. In Selected Essays on the Dynamics of the Capitalist Economy 1933-1970 (pp.
146-155). Cambridge, UK: Cambridge University Press.
Kaldor, N. (1940). A model of the trade cycle. The Economic Journal, 50(197), 78-92.
Keynes, J. M. (1936). The general theory of employment, interest, and money. Basingstoke: Palgrave
Macmillan.
Kurz, H. D. (1991). Technical change, growth and distribution: A steady-state approach to ‘unsteady’
growth on Kaldorian lines. In Nell, E. J. & Semmler, W. (Eds.), Nicholas Kaldor and Mainstream
Economics: Confrontation or Convergence (pp. 421-448). Basingstoke: Palgrave Macmillan.
Lavoie, M. (2014). Post-Keynesian Economics: New Foundations. Cheltenham: Edward Elgar.
Marglin, S. A. & Bhaduri, A. (1990). Profit squeeze and Keynesian theory. In Marglin, S. A. & Schor, J.

33
B. (Eds.), The Golden Age of Capitalism: Reinterpreting the Postwar Experience (pp. 153-186).
Oxford: Oxford University Press.
Marglin, S. A. & Bhaduri, A. (1991). Profit squeeze and Keynesian theory. In Nell, E. J. & Semmler, W.
(Eds.), Nicholas Kaldor and Mainstream Economics: Confrontation or Convergence (pp. 123-163).
Basingstoke: Palgrave Macmillan.
Minsky, H. P. (1977). The financial instability hypothesis: An interpretation of Keynes and an
alternative to “standard” theory. Challenge, 20(1), 20-27.
Naastepad, C. W. M. & Storm, S. (2007). OECD demand regimes (1960-2000). Journal of Post
Keynesian Economics, 29(2), 211-246.
Nikiforos, M. (2016). Distribution-led growth in the long run. Review of Keynesian Economics, 4(4),
391-408.
Onaran, Ö. & Galanis, G. (2013). Is aggregate demand wage-led or profit-led? A global model. In
Lavoie, M. & Stockhammer, E. (Eds.), Wage-Led Growth: An Equitable Strategy for Economic
Recovery (pp. 71-99). Basingstoke: Palgrave Macmillan.
Palley, T. I. (2012). Wealth and wealth distribution in the neo-Kaleckian growth model. Journal of
Post Keynesian Economics, 34(3), 453-474.
Palley, T. I. (2013a). Cambridge and neo-Kaleckian growth and distribution theory: Comparison with
an application to fiscal policy. Review of Keynesian Economics, 1(1), 79-104.
Palley, T. I. (2013b). Enriching the neo-Kaleckian growth model: Nonlinearities, political economy, and
financial factors (Working Paper No. 335). Amherst: Political Economy Research Institute,
University of Massachusetts Amherst.
Palley, T. I. (2014). Rethinking wage vs. profit-led growth theory with implications for policy analysis
(Working Paper No. 141). Düsseldorf: Institut für Makroökonomie und Konjunkturforschung.
Palley, T. I. (2016). Wage-vs. profit-led growth: The role of the distribution of wages in determining
regime character. Cambridge Journal of Economics, 41(1), 49-61.
Prante, F. J. (2017). Macroeconomic effects of personal and functional income inequality – Theory and
empirical evidence for the US and Germany (Working Paper No. 83/2017). Berlin: Institute
for International Political Economy.
Prante, F. J. (2018). The distribution-sensitive autonomous demand multiplier in Kaleckian models,
manuscript.
Riddick, L. A. & Whited, T. M. (2009). The corporate propensity to save. The Journal of Finance, 64(4),
1729-1766.
Robinson, J. (1962). A model of accumulation. In Essays in the Theory of Economic Growth (pp. 22-
87). Basingstoke: Palgrave Macmillan.
Rowthorn, B. (1981). Demand, real wages and economic growth. In Arestis, P., Skouras, T. &

34
Kitromilides, Y. (Series Eds.), Thames Papers in Political Economy, Autumn 1981. London: Thames
Polytechnic.
Skott, P. (2012). Theoretical and empirical shortcomings of the Kaleckian investment function.
Metroeconomica, 63(1), 109-138.
Stockhammer, E. (2011). Wage-led growth: An introduction. International Journal of Labour
Research, 3(2), 167-187.
Stockhammer, E. & Ederer, S. (2008). Demand effects of the falling wage share in Austria. Empirica,
35(5), 481-502.
Stockhammer, E., Onaran, Ö. & Ederer, S. (2008). Functional income distribution and aggregate
demand in the Euro area. Cambridge Journal of Economics, 33(1), 139-159.
Taylor, L. (1985). A stagnationist model of economic growth. Cambridge Journal of Economics, 9(4),
383-403.
Taylor, L. (1990). Real and money wages, output and inflation in the semi-industrialized world.
Economica, 57(227), 329-353.
You, J. I. (1994). Macroeconomic structure, endogenous technical change and growth. Cambridge
Journal of Economics, 18(2), 213-234.

Imprint Editors: Sigrid Betzelt, Eckhard Hein (lead editor), Martina Metzger, Jennifer Pedussel Wu, Martina Sproll, Christina Teipen, Achim Truger, Markus Wissen, Reingard Zimmer ISSN 1869-6406 Printed by HWR Berlin Berlin November 2018