the lower of cost or market is an exception to the historical cost principle. future potential of...
Post on 21-Dec-2015
214 views
TRANSCRIPT

The lower of cost or market is an exception to the historical cost principle.• Future potential of the asset < original cost:
• Restate asset at market to replace cost.
• Loss charged against revenues of the period.
Ch. 9: Inventory Ch. 9: Inventory Lower of Cost or MarketLower of Cost or Market

Market value is the replacement cost.
- The replacement cost must lie between a ceiling amount and a
floor amount.
- Ceiling is the net realizable value (NRV= selling price less disposal
cost).
- Floor is net realizable value less a normal profit margin.
– The “designated market value” is the “middle” value amongst
the replacement cost, ceiling, and floor
– Designated market value compared against the Cost value to
determine if an LCM write-down is needed.
Lower of Cost or Market Lower of Cost or Market Rules: Ceiling and FloorRules: Ceiling and Floor

Item Replacement Historical Ceiling Floor Final Cost Cost Inv $
A $88,000 $80,000 $120,000 $104,000 $
B $88,000 $90,000 $100,000 $70,000 $
C $88,000 $90,000 $100,000 $90,000 $
D $88,000 $90,000 $87,000 $70,000 $
Lower of Cost or Market: Lower of Cost or Market: Ceiling and Floor ExampleCeiling and Floor Example

Under the direct method:
DR. COGS
CR. Inventory
Under the indirect (allowance) method:
DR. Loss
CR. Allowance (contra- inventory acct.)
Recording the Decline in Recording the Decline in Market ValueMarket Value

The lower of cost or market may be applied:1. Either directly to each item
* most conservative approach* generally required for tax
purposes
2. To each category, or3. To the total of the inventory
Whichever method is selected, it should be consistently applied.
Lower of Cost or Market Lower of Cost or Market ApplicationApplication

LCM ExampleLCM Example
Assume in each case that the selling expenses are $8 per unit and that the normal profit is $5 per unit. Calculate the limits for each case (ceiling and floor). Then enter the amount that should be used for lower of cost or market.
Selling Ceiling Replacement Floor Price Upper Limit Cost Lower Limit Cost LCM
(a) $54 $______ $38 $______ $43 $______
(b) 47 ______ 36 ______ 40 ______
(c) 56 ______ 39 ______ 40 ______
(d) 47 ______ 42 ______ 40 ______

Recording the Decline in Recording the Decline in Market ValueMarket Value
For subsequent increases in inventory value:
o US GAAP prohibits the reversal of writedowns
o IFRS requires the reversal of writedowns
What if the Market Value What if the Market Value Recovers?Recovers?

• Valuation at Net Realizable Value– Controlled market with a quoted price for all
quantities– No significant costs of disposal
• Relative Sales Value – “Basket Purchase”
• Purchase Commitments
Other Valuation IssuesOther Valuation Issues

• Appropriate basis when basket purchases are made.
• Basket purchases involve a group of varying units.
• The purchase price is paid as a lump sum amount.
• The lump sum price is allocated to units on the basis
of their relative sales values.
Valuation Basis: Valuation Basis: Relative Sales ValuesRelative Sales Values

Kirby Company buys three different lots (A, B and C) in a basket purchase, paying $300,000 for all three.
The lots were sold as follows:A ($75,000); B ($150,000) and C ($200,000) for a total of $425,000.
What is the cost of A, B and C and the gross profit for each lot?
Relative Sales Values: Relative Sales Values: ExampleExample

C $200,000 $ 141,176 $ 58,824
Totals $425,000 $300,000 $125,000
Lot Sales Allocated Gross Value Cost Profit
A $75,000 ($75,000/$425,000) x $ 300,000= $ 52,941 $ 22,059
B $150,000 $105,882 $ 44,118
Relative Sales Values: Relative Sales Values: ExampleExample

Relative Sales Values: Relative Sales Values: Example 2Example 2
Adler Realty Company purchased a plot of ground for $800,000 and spent $2,100,000 in developing it for building lots. The lots were classified into Highland, Midland, and Lowland grades, to sell at $100,000, $75,000, and $50,000 each, respectively. Complete the table below to allocate the cost of the lots using a relative sales value method. No. of Selling Total % of Apportioned Cost Grade Lots Price Revenue Total Sales Total Per Lot Highland 20 $ $ $ $ Midland 40 $ $ Lowland 100 $ $ 160 $ $

• Cancellable contracts– No entry or disclosure required
• Formal, non-cancelable contracts – No entry, but disclosure required – If execution of the contract expected to result in
a loss, then must be recordedDR Unrealized loss
CR Est liability on purchase commitment
Purchase CommitmentsPurchase Commitments

• Inventory estimation used when:– a fire or other catastrophe destroys either
inventory or inventory records– taking a physical inventory is impractical– auditors only need an estimate of the
company’s inventory
Inventory Estimation Inventory Estimation TechniquesTechniques
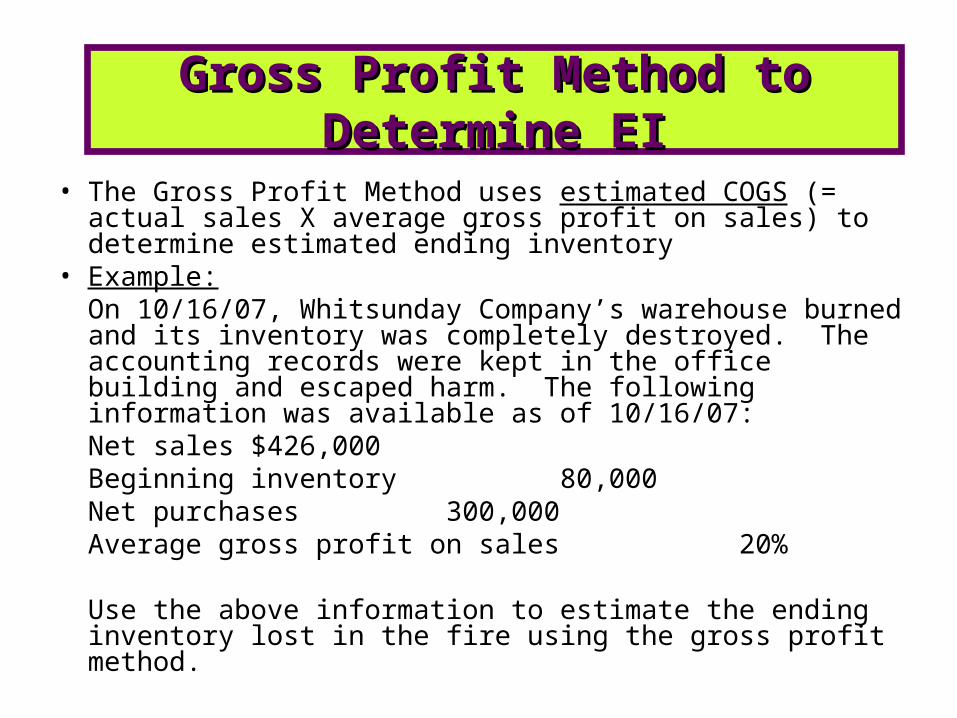
• The Gross Profit Method uses estimated COGS (= actual sales X average gross profit on sales) to determine estimated ending inventory
• Example:On 10/16/07, Whitsunday Company’s warehouse burned and its inventory was completely destroyed. The accounting records were kept in the office building and escaped harm. The following information was available as of 10/16/07:
Net sales $426,000Beginning inventory 80,000Net purchases 300,000Average gross profit on sales 20%
Use the above information to estimate the ending inventory lost in the fire using the gross profit method.
Gross Profit Method to Gross Profit Method to Determine EIDetermine EI

Beginning inventory $80,000
Net purchases 300,000
Cost of goods available for sale 380,000
Estimated cost of goods sold:
Net sales 426,000
Less: Est gross profit (85,200)(340,800)
Estimated ending inventory $39,200
Gross Profit Method to Gross Profit Method to Determine EIDetermine EI

On December 31, 2007 Carr Company's inventory burned. Sales and purchases for the year had been $1,400,000 and $980,000, respectively. The beginning inventory (Jan. 1, 2007) was $170,000; in the past Carr's gross profit has averaged 40% of selling price. Compute the estimated cost of inventory burned.
BI+ Net Purchases= COGA -Estimated COGS: Net Sales less estimated gross profitEstimated Ending inventory
Gross Profit Method Gross Profit Method Example 2Example 2
This inventory estimation technique is used when:• a fire or other catastrophe destroys either inventory or inventory
records• taking a physical inventory is impractical• auditors only need an estimate of the company’s inventory
• Appropriate for retail concerns with:• high volume sales and• different types of merchandise
• Assumes an observable pattern between cost and prices.
Retail Inventory MethodRetail Inventory Method

Steps:1. Determine ending inventory at retail price
2. Convert this amount to a cost basis using a cost-to-retail ratio
BI (at retail) + Net Purchases (at retail) – Net sales = EI (at retail)
EI (at retail) X Cost-to-Retail ratio = estimated “EI” (at cost)
Retail Inventory MethodRetail Inventory Method

Given for the year 2002: at cost at retail Beginning inventory $2,000 $3,000 Purchases (Net) $10,000 $15,000 Sales (Net) $12,000
What is ending inventory, at retail and at cost?
Retail Inventory Method: Retail Inventory Method: ExampleExample

at cost at retail
Beginning inventory $ 2,000 $ 3,000 Purchases (Net) $10,000 $15,000 Goods available for sale $12,000 $18,000 less: Sales (Net) ($12,000) Ending inventory (at retail) $6,000 Times: cost to retail ratio x
Ending inventory at costCOGS
Retail Inventory Method: Retail Inventory Method: ExampleExample