the marketpulse volume 6, issue 3 · 2017 oreli i i ti eproduc i i xpres i ii 1 the marketpulse g...
TRANSCRIPT

© 2017 CoreLogic — Proprietary. This material may not be reproduced in any form without express written permission.i
| The MarketPulse g March 2017 g Volume 6, Issue 3
The MarketPulse
MARCH 2017

© 2017 CoreLogic — Proprietary. This material may not be reproduced in any form without express written permission.ii
Table of Contents | The MarketPulse March 2017 Volume 6, Issue 3
Table of Contents
Single-family Rent Growth Faster in Markets with Low Vacancies ...........1
One-percentage point lower vacancy rate leads to 0.5% faster rent growth
Condo Lending Outlook ............................................................................................... 2
The State of House Flipping in 2016 – Part I ....................................................... 3
At the National Level, Flipping Activity is the Second Lowest Since 2012
The State of House Flipping in 2016 – Part II .....................................................4
Texas and Florida Flipping Activities Were Strong in 2016
Charts & Graphs ......................................................................................................................................................7
Home Price Index ...................................................................................................................................................7
Home Price Index State-Level Detail — Combined Single Family Including Distressed January 2017 ................................................................................................................7
In the News ...............................................................................................................................................................7
Peak Foreclosure Inventory for 10 Largest CBSAs From Their Peak to December 2016 ............................................................................................................ 8
Annual National Completed Foreclosures 2000–2016 ....................................................................... 8
Foreclosure Rates for the Ten States with the Highest Peak Foreclosure Rate ..................... 8
CoreLogic HPI® Market Condition Overview............................................................................................ 9January 2017January 2022 Forecast
Variable Descriptions .........................................................................................................................................10
Housing Statistics
January 2017
HPI® YOY Chg 6.9%
HPI YOY Chg XD 5.8%
NegEq Share (Q4 2016) 6.2%
Cash Sales Share
(as of December 2016)
33.1%
Distressed Sales
(as of December 2016)
7.8%
The MarketPulseVolume 6, Issue 3March 2017Data as of January 2017
News Media Contact
Alyson [email protected]
949.214.1414 (offi ce)

© 2017 CoreLogic — Proprietary. This material may not be reproduced in any form without express written permission. 1
The MarketPulse g March 2017 g Volume 6 Issue 3 | Articles
Single-family Rent Growth Faster in Markets with Low VacanciesOne-percentage point lower vacancy rate leads to 0.5% faster rent growth
By Frank E. Nothaft
Rent growth varies across neighborhoods
and over time. For this reason, rent-growth
expectations are important not just for
families who are deciding whether to rent
or own their home, but also for investors
who are trying to forecast net revenue on
their housing investment.
Looking at the types of properties that
renters live in, about 38 percent are
1-family homes. Another 7 percent are
rental condominiums, typically a unit in a
multifamily structure (Figure 1). And if we
include small multi-unit buildings, then 1- to
4-family houses and rental condominiums
account for more than one-half of our
nation’s rental stock.
The importance of single-family rental
homes and condominiums underscores the
need to understand how rents on these
properties vary with market conditions.
Using CoreLogic’s Single-family Rental
Index, we examined rent growth across
28 metropolitan areas over the last year
and compared these with the rental
vacancy rates in these markets.1 We found
that our rent index grew faster in markets
with low vacancy rates: On average,
for each 1-percentage point decline in
the local vacancy rate, rent growth was
about one-half percentage point faster
during 2016 (Figure 2).
This rent-vacancy relationship is important
for property owners and managers. Not
surprisingly, the type of investors who
own single-family properties are very
different from those that own high rises.2
For example, more than 80 percent of 2- to
4-family rental properties are owned by
individuals, but less than 10 percent of rental
properties with 50-or-more apartments are
owned by individual investors (Figure 3).
We would expect that those metros that
have relatively low vacancy rates in early
2017 will also be the markets with more
rapid rent growth during the coming year.
CoreLogic’s Single-family Rental Index found
1 Information on the Single-family Rental Index can be found here
and here.2 For owners of small rental properties, one tenant’s payment
ability can have a large impact on the property’s rental income.
Tenant screening tools, such as MyRental™ from CoreLogic
(https://www.myrental.com), can help property owners and
managers identify top-quality applicants.
FIGURE 1. COMPONENTS OF THE U.S. RENTAL STOCKOccupied Rental Stock (44 Million Homes)
nothaft: fig 1
Multifamily 35%(5 or more units)
2- to 4-family 16%
Manufactured Housing 4%
Condo/Co-op 7%
One-family 38%
Source: U.S. Census Bureau, 2015 American Housing Survey (1-family includes both detached and attached housing)
FIGURE 2. RENT GROWTH FASTER IN LOW-VACANCY MARKETSRent Growth (percent, 2015Q4 to 2016Q4)
-2%
-1%
0%
1%
2%
3%
4%
5%
6%
7%
2% 3% 4% 5% 6% 7% 8% 9% 10% 11%
Rental Vacancy Rate (percent, 2016 average)
nothaft: fig 2
LinearTrend
Source: CoreLogic Single-family Rental Index, U.S. Census Housing Vacancy Survey, 28 metropolitan areas; line represents a univariate regression
Continued on page 6
Dr. Frank Nothaft
Chief Economist
Frank Nothaft is senior vice president and chief economist for CoreLogic. He leads the Office of the Chief Economist and is responsible for analysis, commentary and forecasting trends in global real estate, insurance and mortgage markets.

© 2017 CoreLogic — Proprietary. This material may not be reproduced in any form without express written permission.2
Articles | The MarketPulse March 2017 Volume 6, Issue 3
FIGURE 1. CONDO 1ST LIEN MORTGAGE ORIGINATIONSBillions
$-
$20
$40
$60
$80
$100
$120
$140
$160
Jan
-05
Sep
-05
May
-06
Jan
-07
Sep
-07
May
-08
Jan
-09
Sep
-09
May
-10
Jan
-11
Sep
-11
May
-12
Jan
-13
Sep
-13
May
-14
Jan
-15
Sep
-15
May
-16
+14%
Source: CoreLogic
FIGURE 2. DAYS ON MARKET
0
20
40
60
80
100
120
140
160
180
Jan-00 Sep-01 May-03 Jan-05 Sep-06 May-08 Jan-10 Sep-11 May-13 Jan-15 Sep-16
Source: CoreLogic
Condo Lending Outlook
By Jacqueline Doty
CoreLogic has taken a look at the state
of condominium lending. Where things
stand now… what’s changing and what’s
not…or at least not changing fast enough
for some participants.
Through November of 2016, lending for
condo purchases was running at an annual
rate of $74 billion, or 8 percent of total
purchase originations. Meanwhile, lending
for condo refi nances was running at
approximately the same rate, which means
that in 2016, when all the numbers are
tallied, condo lending will represent around
7 percent of total mortgage originations.
Overall, condo sales were relatively fl at
through the fi rst half of 2016, coming in at
just under 600,000 condos.
The average sale price was $300,000 in
the fi rst half of 2016, up 3 percent when
compared to the prior year. Days on market
was a very fast 78 days (down from 85 days
a year earlier) thanks to a tight supply of
condos on the market, which was running
at about 4.3 months as of December.
For some time now, CoreLogic has been
forecasting that condos will be a bigger part
of the mortgage origination market. Our
outlook is based on the strong demographic
tailwind of fi rst time millennial homebuyers
and down-sizing baby boomers—two large
cohorts that will be gravitating toward the
condo market. The timing of this potential
condo-buying wave has been harder to
predict. But improving employment growth
and continued relatively low interest rates
should begin to change this picture.
As followers of the Insights blog know, there
are some headwinds to condo lending:
mainly the need for lenders to underwrite
the condo project as well as the borrower.
This requires lenders to understand diff ering
investor eligibility requirements and to
deal with the more than 140,000 condo
associations in the US. All of which can add
time, cost and risk to condo lending.
Lenders, condo owners and borrowers all got
some good news last year when Congress
acted to ease rules that have made FHA
condo loans more diffi cult to get. Specifi cally
the new rules lowered the owner-occupancy
threshold from 50 percent to 35 and made
other changes to bring FHA policies in line
with the less-restrictive approach used by
Fannie Mae and Freddie Mac.
Although condos remain a relatively small
slice of the overall single-family market, this
category plays an oversized role when it
come to aff ordable options for fi rst time
buyers, low-to-medium income borrowers
and graying baby-boomers. ■
Jacqueline Doty
VP, Product Management,
Collateral Risk Solutions
Jacqueline Doty is vice president and product line manager at CoreLogic. She is responsible for strategic planning, research and development of innovative products and solutions to collateral risk management problems. She also oversees the CondoSafe and LoanSafe Appraisal Manager off erings, ensuring these CoreLogic solutions provide an accurate, timely and cost-eff ective method of underwriting collateral. Jacqueline earned a bachelor’s degree in economics from the University of Maryland, College Park, and is a graduate of the Mortgage Bankers Association School of Mortgage Banking.

© 2017 CoreLogic — Proprietary. This material may not be reproduced in any form without express written permission. 3
The MarketPulse g March 2017 g Volume 6 Issue 3 | Articles
Continued on page 6
The State of House Flipping in 2016 – Part IAt the National Level, Flipping Activity is the Second Lowest Since 2012
By Bin He
Flipping is the term used when an investor
purchases a property, renovates and repairs
it, and then re-sells it within a short period of
time for a profit. In a blog series I published
a while back, Is Flipping Coming Back?
Part I and Part II, I concluded that in Q1 2016
flipping activity was well below its historical
high at the national level although there
were geographic variations at the metro
level. Now that 2016 is behind us, it’s time
to revisit this topic to see how things have
changed. A little different from the analysis I
did before, a flipped property is now defined
as a property that is bought and sold within
12 months rather than nine months since we
have observed it takes a longer time to flip a
property. Furthermore, non-disclosure states
are now included in the analysis. We aren’t
able to know its price-related metrics but
it is feasible to derive the share of flipped
properties to sales. In Part I of this series we
will focus on the national-level analysis, and
in Part II we will zoom in on metro areas.
At the national level, the ratio of flips to sales
stands at 4.9 percent in 2016, which is well
below the peak value of 7.5 percent reached
in 2005, as shown in Figure 1. As a matter of
fact, this is the second lowest rate of flipping
activity since 2012, as the lowest since 2012
occurred in 2015 with a flipping percentage
of 4.8. It appears that flipping activity has
slowed in the past two years since the start
of the housing recovery, thanks to a five-year
Bin He
Principal Economist
Bin He is a principal economist with the CoreLogic Decision Analytics & Research Team (DART). Bin leads research and development of the CoreLogic Home Price Index and the CoreLogic Real Estate Analytics Suite. Bin is also responsible for the modeling that powers the CoreLogic RiskModel. Before Bin joined CoreLogic, he was director of Credit Analytics for Radian Guaranty, where he was responsible for the development and implementation of mortgage prepayment and default models.
FIGURE 1. THE RATIO OF FLIPS TO SALES OVER TIME AT NATIONAL LEVEL
0%
1%
2%
3%
4%
5%
6%
7%
8%
1996 1997 1998 1999 2000 2001 2002 2003 2004 2005 2006 2007 2008 2009 2010 2011 2012 2013 2014 2015 2016
He 1: fig 1
Source: CoreLogic Public Records
FIGURE 2. REAL MEDIAN GROSS PROFIT (IN 2016 DOLLARS) PER PROPERTY FLIPPED AND MEDIAN PERCENTAGE GROSS PROFIT ACROSS THE COUNTRY
0%
5%
10%
15%
20%
25%
30%
35%
40%
45%
$0
$10,000
$20,000
$30,000
$40,000
$50,000
$60,000
1996 1997 1998 1999 2000 2001 2002 2003 2004 2005 2006 2007 2008 2009 2010 2011 2012 2013 2014 2015 2016
real median gross profit median %gross profit
He 1: fig 2
Source: CoreLogic Public Records

© 2017 CoreLogic — Proprietary. This material may not be reproduced in any form without express written permission.4
Articles | The MarketPulse g March 2017 g Volume 6, Issue 3
The State of House Flipping in 2016 – Part IITexas and Florida Flipping Activities Were Strong in 2016
By Bin He
In Part I of this blog we discussed flipping
activity in 2016—investors buying homes,
repairing and selling them within a short
period of time for a profit—at the national
level. Here we focus on flipping activity at
the local metro level for 2016. A flipped
property is defined as a property that is
bought and sold within twelve months.
Figure 1 lists the 20 markets, among the
100 largest Core Based Statistical Areas
(CBSAs) that CoreLogic analyzed, with
the highest shares of flipped properties in
2016. Since sale values are not available
for public access in non-disclosure states,
gross profit and percent gross profit are not
available for those CBSAs in these non-
disclosure states. According to CoreLogic
data and analysis, El Paso, TX has the
highest share of flipped properties, followed
by Fort Worth-Arlington, TX and Dallas,
TX. For these 20 CBSAs, the median gross
profit per flipped property ranges from
a low of $29,000 in Birmingham-Hoover,
AL to a high of $130,000 in Los Angeles-
Long Beach-Glendale, CA. The median
percentage gross profit ranges from a low
of 30.7 percent in Birmingham-Hoover, AL
to a high of 66.2 percent in Virginia Beach-
Norfolk-Newport News, VA-NC.
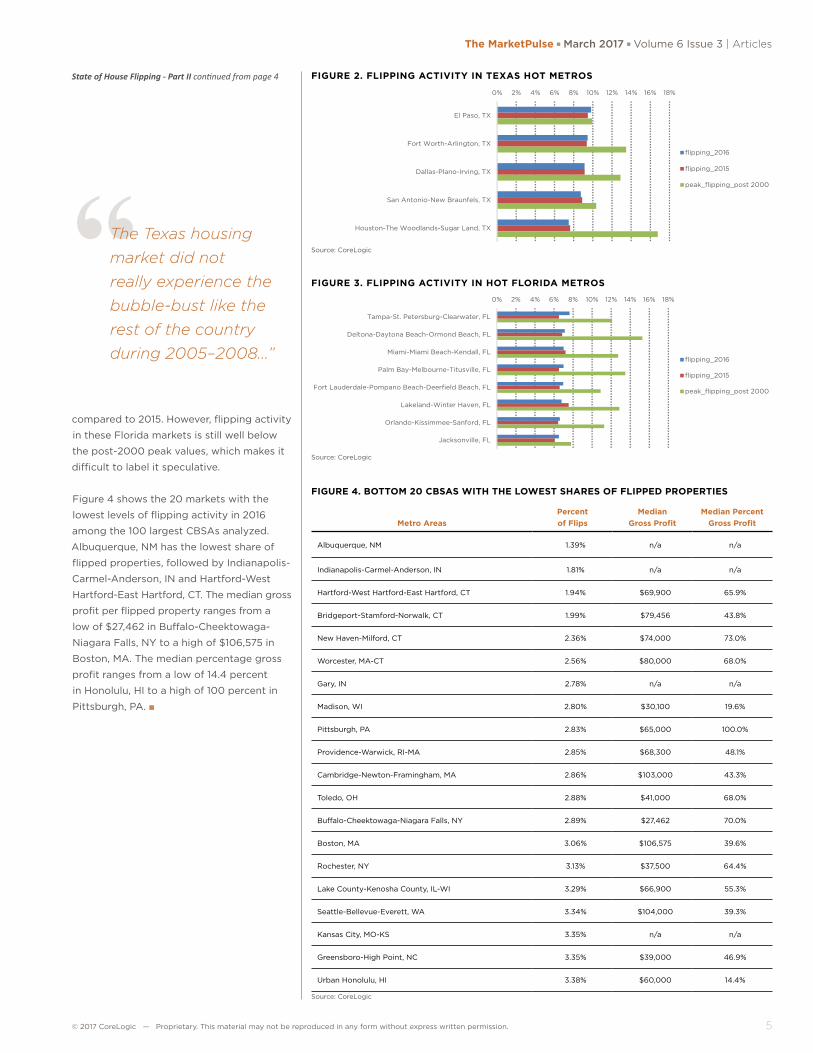
Flipping activity was strongest among Texas
and Florida CBSAs in 2016. Five of the top
10 markets for flipping are in Texas, and
eight of the top 20 markets for flipping
are in Florida. Figure 2 shows that in the
five hot Texas markets flipping activity in
2016 is comparable to activity seen in 2015.
Moreover, in three of those markets, El Paso,
Dallas and San Antonio, flipping activity
in 2016 is not too far from the post-2000
peak values. The Texas housing market did
not really experience the bubble-bust like
the rest of the country during 2005–2008,
and its home price appreciation has been
accelerating. It is worth keeping a close
eye on the Texas market. Figure 3 shows in
all eight hot Florida markets, six of them
had increases in flipping activity in 2016
FIGURE 1. TOP 20 CBSAS WITH THE HIGHEST SHARES OF FLIPPED PROPERTIES IN 2016
Metro AreasPercent of Flips
Median Gross Profit
Median Percent Gross Profit
El Paso, TX 9.82% n/a n/a
Fort Worth-Arlington, TX 9.46% n/a n/a
Dallas-Plano-Irving, TX 9.14% n/a n/a
San Antonio-New Braunfels, TX 8.75% n/a n/a
New Orleans-Metairie, LA 7.93% n/a n/a
Tampa-St. Petersburg-Clearwater, FL 7.64% $55,000 56.4%
Houston-The Woodlands-Sugar Land, TX 7.49% n/a n/a
Virginia Beach-Norfolk-Newport News, VA-NC 7.20% $79,000 66.2%
Deltona-Daytona Beach-Ormond Beach, FL 7.13% $48,000 49.3%
Miami-Miami Beach-Kendall, FL 7.01% $68,000 41.9%
Palm Bay-Melbourne-Titusville, FL 7.01% $56,600 59.3%
Fort Lauderdale-Pompano Beach-Deerfield Beach, FL 6.96% $59,000 42.7%
Fresno, CA 6.95% $62,000 49.0%
Lakeland-Winter Haven, FL 6.80% $49,825 56.5%
Orlando-Kissimmee-Sanford, FL 6.61% $45,000 41.5%
Los Angeles-Long Beach-Glendale, CA 6.52% $130,000 36.2%
Jacksonville, FL 6.51% $54,318 54.2%
Memphis, TN-MS-AR 6.50% $39,900 60.0%
Birmingham-Hoover, AL 6.42% $29,000 30.7%
Phoenix-Mesa-Scottsdale, AZ 6.36% $47,300 32.1%
Source: CoreLogic
Continued on page 5
“According to CoreLogic data and analysis, El Paso, TX has the highest share of flipped properties…”
© 2017 CoreLogic — Proprietary. This material may not be reproduced in any form without express written permission. 5
The MarketPulse g March 2017 g Volume 6 Issue 3 | Articles
FIGURE 4. BOTTOM 20 CBSAS WITH THE LOWEST SHARES OF FLIPPED PROPERTIES
Metro AreasPercent of Flips
Median Gross Profit
Median Percent Gross Profit
Albuquerque, NM 1.39% n/a n/a
Indianapolis-Carmel-Anderson, IN 1.81% n/a n/a
Hartford-West Hartford-East Hartford, CT 1.94% $69,900 65.9%
Bridgeport-Stamford-Norwalk, CT 1.99% $79,456 43.8%
New Haven-Milford, CT 2.36% $74,000 73.0%
Worcester, MA-CT 2.56% $80,000 68.0%
Gary, IN 2.78% n/a n/a
Madison, WI 2.80% $30,100 19.6%
Pittsburgh, PA 2.83% $65,000 100.0%
Providence-Warwick, RI-MA 2.85% $68,300 48.1%
Cambridge-Newton-Framingham, MA 2.86% $103,000 43.3%
Toledo, OH 2.88% $41,000 68.0%
Buffalo-Cheektowaga-Niagara Falls, NY 2.89% $27,462 70.0%
Boston, MA 3.06% $106,575 39.6%
Rochester, NY 3.13% $37,500 64.4%
Lake County-Kenosha County, IL-WI 3.29% $66,900 55.3%
Seattle-Bellevue-Everett, WA 3.34% $104,000 39.3%
Kansas City, MO-KS 3.35% n/a n/a
Greensboro-High Point, NC 3.35% $39,000 46.9%
Urban Honolulu, HI 3.38% $60,000 14.4%
Source: CoreLogic
State of House Flipping - Part II continued from page 4
compared to 2015. However, flipping activity
in these Florida markets is still well below
the post-2000 peak values, which makes it
difficult to label it speculative.
Figure 4 shows the 20 markets with the
lowest levels of flipping activity in 2016
among the 100 largest CBSAs analyzed.
Albuquerque, NM has the lowest share of
flipped properties, followed by Indianapolis-
Carmel-Anderson, IN and Hartford-West
Hartford-East Hartford, CT. The median gross
profit per flipped property ranges from a
low of $27,462 in Buffalo-Cheektowaga-
Niagara Falls, NY to a high of $106,575 in
Boston, MA. The median percentage gross
profit ranges from a low of 14.4 percent
in Honolulu, HI to a high of 100 percent in
Pittsburgh, PA. ■
FIGURE 2. FLIPPING ACTIVITY IN TEXAS HOT METROS
0% 2% 4% 6% 8% 10% 12% 14% 16% 18%
El Paso, TX
Fort Worth-Arlington, TX
Dallas-Plano-Irving, TX
San Antonio-New Braunfels, TX
Houston-The Woodlands-Sugar Land, TX
flipping_2016
flipping_2015
peak_flipping_post 2000
He 2: fig 2
Source: CoreLogic
FIGURE 3. FLIPPING ACTIVITY IN HOT FLORIDA METROS
0% 2% 4% 6% 8% 10% 12% 14% 16% 18%
Tampa-St. Petersburg-Clearwater, FL
Deltona-Daytona Beach-Ormond Beach, FL
Miami-Miami Beach-Kendall, FL
Palm Bay-Melbourne-Titusville, FL
Fort Lauderdale-Pompano Beach-Deerfield Beach, FL
Lakeland-Winter Haven, FL
Orlando-Kissimmee-Sanford, FL
Jacksonville, FL
flipping_2016
flipping_2015
peak_flipping_post 2000
He 2: fig 3
Source: CoreLogic
“The Texas housing market did not really experience the bubble-bust like the rest of the country during 2005–2008…”

© 2017 CoreLogic — Proprietary. This material may not be reproduced in any form without express written permission.6
Articles | The MarketPulse g March 2017 g Volume 6, Issue 3
that rents were up 2.6 percent in December
2016 compared with one year earlier,
measured as an average across 40 metro
areas. Because rental vacancy rates remain
relatively low, we expect that rents will
continue to rise about 2½ to 3 percent in
2017, outpacing inflation, with faster growth
in tight, low-vacancy metros and slower
growth in high-vacancy markets. ■
Single-Family Rent Growth continued from page 1
State of House Flipping - Part I continued from page 3
FIGURE 3. RENTAL PROPERTY OWNERSHIP
87%
10%
1% 1% 1%
9%
77%
1% 12%
1%
Individual Investor
Partnerships andCorporations
Financial Institutions andPension Funds
Nonprofit & Housing Coops
Other
nothaft: fig 3
9%
77%
1% 12%
1%
2- to 4-Unit Properties
50 or More UnitProperties
Source: U.S. Department of Housing and Urban Development and U.S. Census Bureau, U.S. Rental Housing Finance Survey 2012, Table 2a, 2d (Estate Trustees included in Individual Investor category)
“At the national level, the ratio of flips to sales stands at 4.9 percent in 2016…”
“The importance of single-family rental homes and condominiums underscores the need to understand how rents on these properties vary with market conditions.”
high in the rate of home-price appreciation
and still-tight for-sale inventory.
In 2016, the real median gross gain (in
2016 dollars) rose to $54,700 per property
flipped, which is approaching the historical
high of $56,411 (in 2016 dollars) seen in
2005 prior to the housing crash, as Figure 2
shows1. On the other hand, the median
percentage gross gain has declined since
it peaked in 2013. We continue to believe
the decline of the percentage gain might
have something to do with the decline of
the share of distressed sales, which leads to
high acquisition cost. From this CoreLogic
Insights blog posted by Molly Boesel, Cash
and Distressed Sales Update: November
2016, we see that the share of distressed
sales has declined significantly and was just
7.7 percent in October 2016. From Figure 2
we can also see that the median percentage
gross profit was about 20 percent between
1996 and 2008 and then increased to
above 30–40 percent after 2008, which is
largely due to the high acquisition cost on
the investors’ part from 2000 to 2008, as
Figure 3 shows. ■
FIGURE 3. ACQUISITION COST ON THE INVESTORS’ PART IN 2016 DOLLARS
$0
$50,000
$100,000
$150,000
$200,000
$250,000
199
6
199
7
199
8
199
9
200
0
200
1
200
2
200
3
200
4
200
5
200
6
200
7
200
8
200
9
2010
2011
2012
20
13
20
14
20
15
2016
He 1: fig 3
Source: CoreLogic Public Records
1 Gross profits are in real terms of 2016 dollars so that we can
eliminate the impact of inflation over time. CPI is used to derive
the real dollar amount.

© 2017 CoreLogic — Proprietary. This material may not be reproduced in any form without express written permission. 7
The MarketPulse g March 2017 g Volume 6 Issue 3 | Analysis
Home Price Index State-Level Detail — Combined Single Family Including Distressed January 2017
StateMonth-Over-Month
Percent ChangeYear-Over-Year Percent Change
Forecasted Month-Over-Month
Percent Change
Forecasted Year-Over-Year Percent Change
Alabama −0.3% 3.8% 0.0% 3.6%Alaska 0.2% 1.6% 0.1% 5.9%
Arizona 1.0% 6.6% 0.2% 6.4%Arkansas 0.5% 4.6% 0.2% 4.0%California 0.2% 5.8% 0.3% 9.7%Colorado 0.6% 9.1% 0.2% 6.0%
Connecticut 0.2% 0.6% 0.3% 6.0%Delaware 0.5% 1.7% 0.2% 3.5%
District of Columbia 0.7% 5.3% 0.1% 3.3%Florida 0.6% 7.3% 0.2% 6.2%
Georgia 0.2% 6.4% 0.0% 3.4%Hawaii 0.6% 6.7% 0.3% 6.4%Idaho 0.1% 9.0% 0.1% 4.4%Illinois 0.0% 5.6% 0.2% 4.5%
Indiana −0.1% 5.3% 0.1% 4.4%Iowa −0.2% 3.3% 0.0% 3.5%
Kansas −1.0% 5.6% −0.1% 3.6%Kentucky −0.2% 5.6% 0.1% 3.7%Louisiana −0.2% 3.4% −0.1% 2.0%
Maine −2.8% −1.8% −0.3% 3.5%Maryland 0.7% 4.3% 0.2% 4.1%
Massachusetts 0.5% 6.1% 0.2% 5.7%Michigan −0.3% 6.4% 0.0% 5.3%
Minnesota −0.6% 5.4% 0.0% 3.3%Mississippi −0.1% 1.5% 0.0% 2.4%
Missouri −0.1% 4.6% 0.1% 4.1%Montana −1.6% 3.1% −0.2% 4.5%
Nebraska −0.2% 4.6% 0.0% 3.6%Nevada −0.2% 5.3% 0.3% 8.1%
New Hampshire 1.0% 6.0% 0.4% 5.9%New Jersey 0.1% 2.5% 0.2% 4.7%New Mexico 0.6% 5.5% 0.0% 3.8%
New York 2.8% 7.1% 0.4% 4.5%North Carolina 0.3% 5.2% 0.1% 3.6%North Dakota 0.3% 1.0% −0.2% 1.1%
Ohio 0.0% 5.4% 0.1% 4.2%Oklahoma −0.3% 1.6% 0.0% 2.7%
Oregon 0.2% 10.3% 0.3% 5.9%Pennsylvania −0.2% 2.9% 0.1% 3.9%Rhode Island −0.2% 5.6% 0.0% 3.4%
South Carolina 0.6% 6.4% 0.2% 3.6%South Dakota −0.1% 9.1% −0.1% 2.9%
Tennessee 0.2% 7.4% 0.1% 2.8%Texas 0.7% 6.8% 0.1% 2.3%Utah 0.5% 8.0% 0.1% 4.6%
Vermont 1.0% 6.1% 0.1% 3.5%Virginia 0.0% 3.1% 0.1% 3.8%
Washington 0.7% 10.8% 0.2% 5.3%West Virginia −0.7% 1.7% 0.0% 3.9%
Wisconsin 0.1% 5.4% 0.0% 3.9%Wyoming 0.2% 1.1% −0.3% 2.5%
Source: CoreLogic January 2017
In the News
HousingWire, March 21, 2017
CoreLogic: Influx of refis pushes risk
index lower in Q4
Mortgage originations grew safer in the fourth
quarter of 2016, according to CoreLogic, a
global property information, analytics and data-
enabled solutions provider.
Los Angeles Times, March 21, 2017
Southern California home prices jump
again as short supply fuels bidding wars
Low inventory — as well as one fewer day to record
sales last month than in February 2016, which included
a leap day — probably had a role in the 1.7% decline in
sales from a year earlier, CoreLogic said.
Yahoo! Finance, March 21, 2017
The Strongest Housing Market in the US
in 2017 – and the Weakest
Housing values increased 6.9 percent in January
compared with the same month a year ago,
according to the latest figures from CoreLogic.
Home prices also rose month over month by 0.7
percent, the company found.
CNBC, March 21, 2017
Mortgage applications fall 2.7%, as
borrowers turn to riskier loans
Mortgage lending is still conservative. In fact, the
average credit score for borrowers in the third quarter
of last year rose from the previous quarter, according to
CoreLogic, whose quarterly credit-risk index has been
falling steadily. That could change as mortgage rates
rise further, which is expected.
HOME PRICE INDEXPercentage Change Year Over Year
-25%
-20%
-15%
-10%
-5%
0%
5%
10%
15%
20%
Jan-02 Jul-04 Jan-07 Jul-09 Jan-12 Jul-14 Jan-17
1.77x4.93hpi as of jan 2017
Including Distressed
Source: CoreLogic January 2017
Charts & Graphs

© 2017 CoreLogic — Proprietary. This material may not be reproduced in any form without express written permission.8
Analysis | The MarketPulse g March 2017 g Volume 6, Issue 3
PEAK FORECLOSURE INVENTORY FOR 10 LARGEST CBSAS FROM THEIR PEAK TO DECEMBER 2016
Source: CoreLogic March 2017
2.67x5.01foreclosure jan 2017: peak foreclosure inventory for 10 largest
cbsas from their peak to dec 2016
0% 5% 10% 15% 20% 25%
Miami
Las Vegas
Chicago
New York
Los Angeles
Washington DC
Boston
Denver
Houston
San FranciscoPeak Foreclosure %
December 2016 Foreclosure %
ANNUAL NATIONAL COMPLETED FORECLOSURES 2000–2016Thousands
Source: CoreLogic March 2017
2.62x5.04foreclosure jan 2017: Annual National Completed
Foreclosures 2000‐2016
Number of Completed Foreclosures -
200
400
600
800
1,000
1,200
1,400
2000 2002 2004 2006 2008 2010 2012 2014 2016
FORECLOSURE RATES FOR THE TEN STATES WITH THE HIGHEST PEAK FORECLOSURE RATE
Source: CoreLogic March 2017
2.67x4.59foreclosure jan 2017: Foreclosure Rates for the Ten States with
the Highest Peak Foreclosure Rate
Peak Foreclosure %
December 2016 Foreclosure %
12.51%
8.49%
7.42%
5.61%
5.31%
4.62%
4.42%
4.39%
4.36%
4.36%
1.46%
1.05%
2.88%
1.08%
2.81%
1.42%
1.78%
1.06%
1.71%
0.29%
0% 2% 4% 6% 8% 10% 12% 14%
FL
NV
NJ
IL
NY
CT
ME
MD
HI
AZ
© 2017 CoreLogic — Proprietary. This material may not be reproduced in any form without express written permission. 9
The MarketPulse g March 2017 g Volume 6 Issue 3 | Analysis
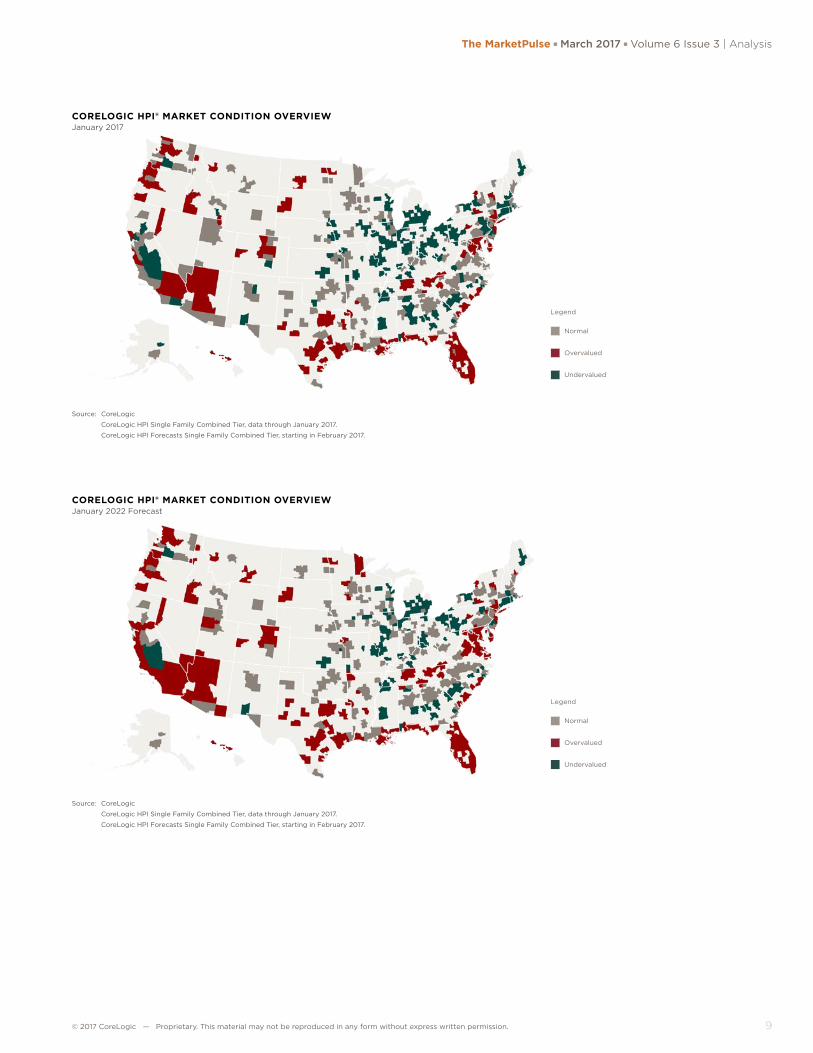
CORELOGIC HPI® MARKET CONDITION OVERVIEWJanuary 2017
Source: CoreLogic
CoreLogic HPI Single Family Combined Tier, data through January 2017.
CoreLogic HPI Forecasts Single Family Combined Tier, starting in February 2017.
Legend
Normal
Overvalued
Undervalued
CORELOGIC HPI® MARKET CONDITION OVERVIEWJanuary 2022 Forecast
Source: CoreLogic
CoreLogic HPI Single Family Combined Tier, data through January 2017.
CoreLogic HPI Forecasts Single Family Combined Tier, starting in February 2017.
Legend
Normal
Overvalued
Undervalued

© 2017 CoreLogic — Proprietary. This material may not be reproduced in any form without express written permission.10
Analysis | The MarketPulse g March 2017 g Volume 6, Issue 3
Variable Descriptions
Variable Definition
Total Sales The total number of all home-sale transactions during the month.
Total Sales 12-Month sum The total number of all home-sale transactions for the last 12 months.
Total Sales YoY Change 12-Month sum
Percentage increase or decrease in current 12 months of total sales over the prior 12 months of total sales
New Home Sales The total number of newly constructed residentail housing units sold during the month.
New Home Sales Median Price
The median price for newly constructed residential housing units during the month.
Existing Home Sales The number of previously constucted homes that were sold to an unaffiliated third party. DOES NOT INCLUDE REO AND SHORT SALES.
REO Sales Number of bank owned properties that were sold to an unaffiliated third party.
REO Sales Share The number of REO Sales in a given month divided by total sales.
REO Price Discount The average price of a REO divided by the average price of an existing-home sale.
REO Pct The count of loans in REO as a percentage of the overall count of loans for the reporting period.
Short SalesThe number of short sales. A short sale is a sale of real estate in which the sale proceeds fall short of the balance owed on the property's loan.
Short Sales Share The number of Short Sales in a given month divided by total sales.
Short Sale Price Discount The average price of a Short Sale divided by the average price of an existing-home sale.
Short Sale Pct The count of loans in Short Sale as a percentage of the overall count of loans for the month.
Distressed Sales Share The percentage of the total sales that were a distressed sale (REO or short sale).
Distressed Sales Share (sales 12-Month sum)
The sum of the REO Sales 12-month sum and the Short Sales 12-month sum divided by the total sales 12-month sum.
HPI MoM Percent increase or decrease in HPI single family combined series over a month ago.
HPI YoY Percent increase or decrease in HPI single family combined series over a year ago.
HPI MoM Excluding Distressed
Percent increase or decrease in HPI single family combined excluding distressed series over a month ago.
HPI YoY Excluding Distressed
Percent increase or decrease in HPI single family combined excluding distressed series over a year ago.
HPI Percent Change from Peak
Percent increase or decrease in HPI single family combined series from the respective peak value in the index.
90 Days + DQ Pct The percentage of the overall loan count that are 90 or more days delinquent as of the reporting period. This percentage includes loans that are in foreclosure or REO.
Stock of 90+ Delinquencies YoY Chg
Percent change year-over-year of the number of 90+ day delinquencies in the current month.
Foreclosure Pct The percentage of the overall loan count that is currently in foreclosure as of the reporting period.
Percent Change Stock of Foreclosures from Peak
Percent increase or decrease in the number of foreclosures from the respective peak number of foreclosures.
Pre-foreclosure FilingsThe number of mortgages where the lender has initiated foreclosure proceedings and it has been made known through public notice (NOD).
Completed ForeclosuresA completed foreclosure occurs when a property is auctioned and results in either the purchase of the home at auction or the property is taken by the lender as part of their Real Estate Owned (REO) inventory.
Negative Equity ShareThe percentage of mortgages in negative equity. The denominator for the negative equity percent is based on the number of mortgages from the public record.
Negative Equity
The number of mortgages in negative equity. Negative equity is calculated as the difference between the current value of the property and the origination value of the mortgage. If the mortgage debt is greater than the current value, the property is considered to be in a negative equity position. We estimate current UPB value, not origination value.
Months' Supply of Distressed Homes (total sales 12-Month avg)
The months it would take to sell off all homes currently in distress of 90 days delinquency or greater based on the current sales pace.
Price/Income RatioCoreLogic HPI™ divided by Nominal Personal Income provided by the Bureau of Economic Analysis and indexed to January 1976.
Conforming Prime Serious Delinquency Rate
The rate serious delinquency mortgages which are within the legislated purchase limits of Fannie Mae and Freddie Mac. The conforming limits are legislated by the Federal Housing Finance Agency (FHFA).
Jumbo Prime Serious Delinquency Rate
The rate serious delinquency mortgages which are larger than the legislated purchase limits of Fannie Mae and Freddie Mac. The conforming limits are legislated by the Federal Housing Finance Agency (FHFA).

© 2017 CoreLogic — Proprietary. This material may not be reproduced in any form without express written permission. 11
The MarketPulse g March 2017 g Volume 6 Issue 3 | Analysis

corelogic.com
End Notes | The MarketPulse g March 2017 g Volume 6, Issue 3
© 2017 CoreLogic, Inc. All rights reserved.
CORELOGIC, the CoreLogic logo, CORELOGIC HPI and MYRENTAL are trademarks of CoreLogic, Inc. and/or its subsidiaries. All other trademarks are the property of their respective holders.
17-MKTPLSE-0317-00
Source: CoreLogicThe data provided is for use only by the primary recipient or the primary recipient's
publication or broadcast. This data may not be re-sold, republished or licensed to any
other source, including publications and sources owned by the primary recipient's parent
company without prior written permission from CoreLogic. Any CoreLogic data used for
publication or broadcast, in whole or in part, must be sourced as coming from CoreLogic,
a data and analytics company. For use with broadcast or web content, the citation
must directly accompany first reference of the data. If the data is illustrated with maps,
charts, graphs or other visual elements, the CoreLogic logo must be included on screen
or website. For questions, analysis or interpretation of the data, contact CoreLogic at
[email protected]. Data provided may not be modified without the prior written
permission of CoreLogic. Do not use the data in any unlawful manner. This data is compiled
from public records, contributory databases and proprietary analytics, and its accuracy is
dependent upon these sources.
For more information please call 866-774-3282
The MarketPulse is a newsletter published by CoreLogic, Inc. ("CoreLogic"). This information is made
available for informational purposes only and is not intended to provide specific commercial, financial or
investment advice. CoreLogic disclaims all express or implied representations, warranties and guaranties,
including implied warranties of merchantability, fitness for a particular purpose, title, or non-infringement.
Neither CoreLogic nor its licensors make any representations, warranties or guaranties as to the quality,
reliability, suitability, truth, accuracy, timeliness or completeness of the information contained in this
newsletter. CoreLogic shall not be held responsible for any errors, inaccuracies, omissions or losses
resulting directly or indirectly from your reliance on the information contained in this newsletter.
This newsletter contains links to third-party websites that are not controlled by CoreLogic. CoreLogic is
not responsible for the content of third-party websites. The use of a third-party website and its content
is governed by the terms and conditions set forth on the third-party’s site and CoreLogic assumes no
responsibility for your use of or activities on the site.
MORE INSIGHTS
The CoreLogic Insights Blog
(corelogic.com/blog) provides an
expanded perspective on housing
economies and property markets,
including policy, trends, regulation
and compliance. Please visit the
blog for timely analysis, thought-
provoking data visualizations and
unique commentary from our team
in the Office of the Chief Economist.
CoreLogic CoreLogic Econ
CoreLogic Insights – On The Go. Download our free App now: