the mart mas - · pdf filethe mart mas market attractiveness score ... where 73% of the...
TRANSCRIPT

The MART MASMarket Attractiveness Score Urban & Rural 'Prosperity Plus' Index


Highlights
The MART MAS is a single index that can be used to select an attractive location or market.
Looking at the relevance of small towns and rural areas, for the first time, an index for market planning, covering States, Districts, Towns and Sub
Districts (Blocks), is being offered. The index allows prioritization of market , by selection on the basis of high/ low values for the different
geographical locations.
The MART MAS has been derived by using scientific modeling of different variables.
The locations sought, in terms of Overall, Urban or Rural (Blocks), can be pre -determined while looking at MAS.
Further prioritization of market is possible by using the ‘Market Intensity Score’ (MIS), ‘Means Score’, ‘Consumption Score’, ‘Awareness Score’ and
‘Infrastructure Score’.
State Profiles include additional secondary data on the demography, economy, consumption, health and infrastructure for states.
All data is available in ‘easy to use’ software.
MART Knowledge Centre 1
Contents
MART Knowledge Centre2
• About MART……………………………………………………………………………………………………………………... 3
• Origin of The MART MAS…………………………………………………………………………………………………... 4
• Defining The MART MAS……………………………………………………………………………………………………. 5
• The MART MAS Model………………………………………………………………………………………………………. 6
• Factors…………………………………………………………………………………………………………………………….... 7
• A User Guide for The MART MAS……………………………………………………………………………………….. 8
• Types of Target Consumers……………………………………………………………………………………………….. 9
• Defining Icons of Software…………………………………………………………………………………………………. 10-11
• Reading The MART MAS Tables & Validation…………………………………………………………………….. 12-13
• Cases……………………………………………………………………………………………………………………………….... 14-23
• Indicators used…………………………………………………………………………………………………………………… 24
• Listing of Indicators……………………………………………………………………………………………………………. 25
• Source of Data……………………………………………………………………………………………………………………. 26
• Derivation of The MART MAS…………………………………………………………………………………………….. 27-28
• Glossary………………………………………………………………………………………………………………………….…. 29-32

About MART
Established in 1993, MART is today India’s leading consultancy firm, on Emerging Markets and a pioneer in the rural domain.
MART's expertise lies in its understanding of the Base of the Pyramid (BoP) segments, their eco system and behavior; an understanding that has been built over years of interaction and engagement with rural as well as urban low income communities. An understanding that is constantly being revitalized and renewed as the emerging markets evolve in an ever -so-dynamic manner. Today, emerging markets are as much about unchanging traditions as is about changing lifestyles and evolving value systems. In such a dynamic environment, our clients have come to rely on us to provide them with accurate, insightful and contemporary knowledge. They place their trust in us and partner us in their search for relevant solutions.
MART enjoys a unique position as an end to end solutions facilitator for both the corporate and development sectors. We bring to the table expertise and experience that have been garnered by successfully handling major assignments for both corporate and development sectors in India and abroad.
A Brief History For both development and corporate sectors, rural marketing was little more than a black box. This huge knowledge gap motivated our founder to create MART in the year 1993. The aim was to equip both players with relevant rural solutions. Today MART comprises a team of 75 professionals. What began as a small one-man operation, servicing a couple of clients, has today transformed into an organization with a large roster of clients, partnering some of the best organizations and agencies in the development and corporate sectors including fortune 500 companies.
We started by providing handholding services to NGOs and development projects. Today, our range of services include research, strategy formulation, implementation and capacity building, which has helped us emerge as the only one-stop rural solutions provider of its kind not just in the country but in the subcontinent. Our operations have expanded from Delhi and its neighbourhood to include 10 states across the country. We provide support to our clients in the international arena as well, including Afghanistan, Malaysia, Mozambique, Bangladesh, Nepal and Sri Lanka. We have operational capability in South Africa, Kenya, Indonesia and Vietnam.
Publications The Rural Marketing by Pradeep Kashyap
User Manual on MART 3M Model (available in English and Hindi)
Collective Marketing – Enriching the Marginalized (English)
National study on Haats and Melas (English)
Strategic Support towards livelihood Promotion - MP-DPIP (English)
A handbook on promoting periodic rural (Haat) markets (English)
Capacity Building in Livelihoods Promotion and Marketing (English)
HLL – SHG Business Partnership (English)
MART Knowledge Centre 3

Origin of The MART MAS
In the dynamic emerging markets, a major challenge plaguing marketers today is the lack of proficient tools for market planning. The Tier 1 and Tier 2 markets have been the most lucrative and convenient to reach for marketers. Reaching these markets has been cost effective and distributing their products and services relatively less complicated. These cities have become saturated and therefore arises the need to look at new markets for growth, a natural progression was to look at smaller towns and blocks (rural), where 73% of the Indian population resides. Rural India constituting 67% of India’s population has been identified as the next engine of growth as rural consumption overtakes urban consumption in most of the products and services categories. Further increasing incomes from non-farm sector and robust local economy have proven to be surprisingly resilient to global slowdown, and the rural markets are emerging as an attractive market. While economic growth of the villages is on the rise, the transformation can be observed in village, Hamira in Kapurthala district, Punjab. In this 5000+ population village, 100% of the houses are ‘Pucca’ (permanent structures), have access to electricity and own TVs & Refrigerators. 50% also own inverters. The village boasts of a large 400 sq ft shop that represents a mini
departmental store, having a glass front and electronic registers located nearby. While this type of village is definitely not the norm, it does provide some indication of what the future holds in store. Expanding the distribution system by identifying new redistribution points is not only an expensive proposition for any Corporate but strategic one. Planning for more than 4500 small towns and 600,000 villages, becomes a difficult proposition due to paucity of information on infrastructure, economic prosperity and consumption in the Districts, Towns, and Sub districts (Blocks) which is critical for success.
MART realizes that a reliable means for prioritizing locations is vital to market planning and implementation of a viable ‘Go-To-Market’ strategy. Therefore it has worked to develop a business solution for the marketers, based on its extensive knowledge and insight into rural markets. The goal was a simple index to measure the attractiveness of any location for a marketer, whether State, District, Town, Sub district (Block); a Market Attractiveness Score (MAS).
MART Knowledge Centre4

Defining The MART MAS
The MART MAS The MART MAS, or Market Attractiveness Score, provides a single index to aid marketers in selecting the ‘best fit’ locations across the range of India’s population centers from Urban India to Rural India. The MART MAS consists of a number of factors: MAS= (Means + Consumption + Awareness + Infrastructure) X Population Size
Location Specific MAS The MART MAS is provided for all locations as is defined in Census
State Level
A. Overall State MAS (Urban + Rural) B. Urban State MAS C. Rural State MAS
District Level
D. Overall District MAS (Urban + Rural) E. Urban District MAS F. Rural District MAS
Town Level G. Town MAS (Urban)
Sub District/Block Level H. Sub District MAS (Rural)
Factor Identification for MAS Data was compiled under 65 variables, from different data sources for assessing their relevance and contribution to MAS.
More than 65 variables have been considered to validate 20 indicators.
A total of 20 indicators are grouped to generate factors. Though more number of indicators were considered, many of those were dropped being not contributing significantly to the Model.
A total of 5 Factors that represent the various facets of Market Attractiveness.
One MAS or Market Attractiveness Score is formed out of five factors.
MART Knowledge Centre 5

The MART MAS Model
MART Knowledge Centre6

Factors
The factors identified for the MART MAS tool, have necessarily taken into consideration the marketers reference points. The factors have been considered independently and also in combination with MAS for creating relevance.
Means Score Means score has been derived from indicators like bank deposit and work participation rate (As depicted in the above MART MAS Model). It denotes the purchasing power of the consumers. For marketers targeting the more affluent sections of the population, the score provides an opportunity to prioritize on locations with higher prosperity rankings, reducing the relevance of those where affordability for consumption becomes a barrier. Consumption Score Consumption score has been derived from indicators like ownership of telephone, two wheeler, four wheeler, LPG, pucca house and electricity (As depicted in the above MART MAS Model). Higher levels of asset ownership can reflect cultural tendencies in a location to use income for consumption rather than savings purposes; this is favorable for marketing of consumer products, but probably less favorable for those marketing mutual funds.
Population Size Of course, population size is an important factor in selecting a market to enter as it depicts the maximum absorption capacity particularly if the product or service is targeted to the mass markets rather than niche segments.
Awareness Score Awareness score has been derived from indicators like female literacy, reach of news paper, ownership of television and radio (As depicted in the above MART MAS Model). It denotes the progressiveness and exposure of the consumers and the score is useful to identify location clusters with high/low scores. For marketing a high involvement product / service, or testing a communications strategy, it may be useful to target those locations where consumers are more educated and have greater access to mass communications media. Infrastructure Score
MART Knowledge Centre 7
Infrastructure score has been derived from indicators like bank branches, educational institutes, health institutes, post and telegraph offices, number of beds in health institutes and number of recreational centers (As depicted in the above MART MAS Model). The existing level of infrastructure in a location is relevant to the decision making process when determining where to set up a distribution system. A location with better physical and market infrastructure will be essential needs to set up a re-distribution point to create access to new markets for a company.

A User Guide for The MART MAS
The MART MAS can be customized by the user, to suit his/her requirements
of market planning, e.g. expansion of distribution system, designing a
communication/promotion plan and other marketing activities for the
products or services offered.
Location Specific Scores A. Overall State Tables (Urban + Rural) – For marketers wishing to target
consumers in both rural and urban markets, allowing selection at the state level for distribution and market planning.
B. State Urban Tables – For marketers looking to target consumers in urban markets only, perhaps as part of a phased approach or for ‘urban centric’ products and services.
C. State Rural Tables – For marketers looking to target consumers in rural
markets only, perhaps as a continuation of their existing urban distribution system or for ‘rural centric’ products and services.
D. Overall District Tables (Urban + Rural) – For marketers wishing to target
consumers in both rural and urban markets, allowing selection at the district level for distribution and market planning.
E. District Urban Tables – For marketers looking to target consumers in
urban markets of districts only, perhaps as part of a phased approach or for ‘urban centric’ products and services.
F. District Rural Tables – For marketers looking to target consumers in rural
markets at the district level only, perhaps as a continuation of their
existing urban distribution system or for ‘rural centric’ products and
services.
G. Town Tables – For marketers wishing to target consumers in urban
markets, allowing selection of towns for distribution and market
planning. Selection is available from biggest to smallest towns.
H. Sub District (Rural) Tables - For marketers looking to target consumers in
rural markets at sub district (block) level only, perhaps as a continuation
of their existing urban distribution system or for ‘rural centric’ products
or services.
MART Knowledge Centre8
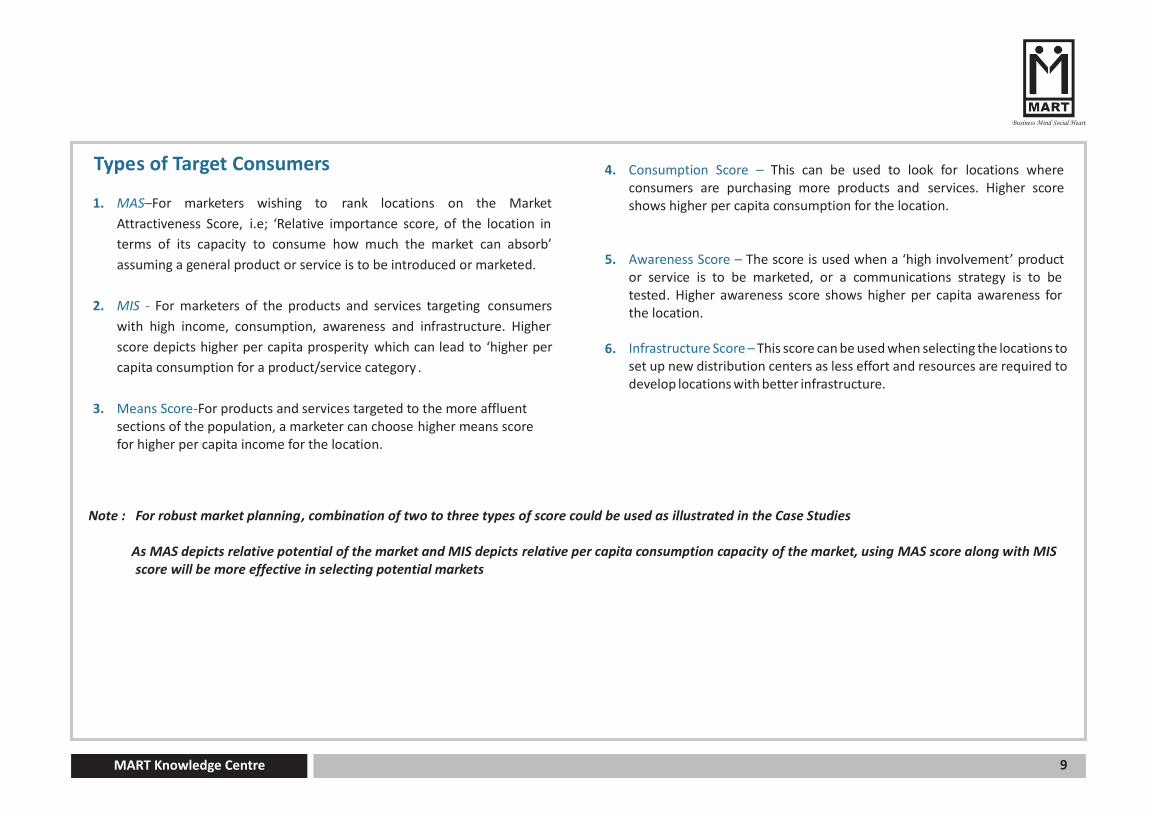
Types of Target Consumers
1. MAS–For marketers wishing to rank locations on the Market
Attractiveness Score, i.e; ‘Relative importance score, of the location in
terms of its capacity to consume how much the market can absorb’
assuming a general product or service is to be introduced or marketed.
2. MIS - For marketers of the products and services targeting consumers
with high income, consumption, awareness and infrastructure. Higher
score depicts higher per capita prosperity which can lead to ‘higher per
capita consumption for a product/service category .
3. Means Score-For products and services targeted to the more affluent sections of the population, a marketer can choose higher means score for higher per capita income for the location.
4. Consumption Score – This can be used to look for locations where
consumers are purchasing more products and services. Higher score shows higher per capita consumption for the location.
5. Awareness Score – The score is used when a ‘high involvement’ product or service is to be marketed, or a communications strategy is to be tested. Higher awareness score shows higher per capita awareness for the location.
6.
Note : For robust market planning, combination of two to three types of score could be used as illustrated in the Case Studies As MAS depicts relative potential of the market and MIS depicts relative per capita consumption capacity of the market, using MAS score along with MIS
score will be more effective in selecting potential markets
MART Knowledge Centre 9
Infrastructure Score – This score can be used when selecting the locations to set up new distribution centers as less effort and resources are required to develop locations with better infrastructure.

Defining Icons of Software
MART Knowledge Centre10
Defining Icons of Software

1. State Profile- State Profile button helps to get additional secondary data on the demography, economy, consumption, health and infrastructure for
states.
2. MART MAS- This button is used to get the “Market Attractiveness Score” at state, district, town and sub district level.
3. Methodology- This button helps to know about the methodology used to create “The MART MAS”
4. Type- This drop down menu helps to select the location (as state, district, town or sub district) for which we want “Market Attractiveness Score”; This
drop down allows you single location selection at a time.
5. State-This drop down menu helps to select the state for which we want “Market Attractiveness Score”; This drop down allows you multiple states
selection at a time.
6. District- This drop down menu helps to select the districts for which we want “Market Attractiveness Score”; This drop down allows you multiple
districts selection at a time.
7. Class/Level-This drop down menu helps to select different types of classes (as class I,II, III, IV, V, and VI in case of town index) or levels (as overall,
urban or rural in case of state/district index). This allows multiple selection of classes in town index while single selection of levels in state/district index.
8. Factor-This drop down menu helps to select different factors as per requirement. This allows multiple selections of factors.
9. Indicator- This drop down menu helps to select different indicators as per requirement. This allows multiple selections of indicators.
10. View Result- This button helps to get the output.
11. Export to Excel- This button helps to export the output to excel sheet.
12. Vertical Scroll bar- This button helps to navigate the output data vertically.
13. Horizontal Scroll bar- This button helps to navigate the output data horizontally.
14. Output Screen- This canvas is used to show output data.
Note: All the drop down menu are mandatory to be filled for getting output (except for a case when we select “State” in “Type” drop down menu, we do not
need to fill “district” drop down menu as state index does not require district.
Note: If we have used export to excel button once then we need to save the excel sheet before using this button again.
Note: Indicator drop down menu contains additional data on some specific assets to help in deeper understanding and analysis (Refer case 2 in case section)
15. Ascending/Descending Button- This button helps to see the data in ascending/descending order. This button is available for each field in output table.
This button is invisible so we need to keep the pointer of mouse on the field (like MAS or MAS India Rank) and click once to use this button.
MART Knowledge Centre 11

Reading the MART MAS Tables
1. State Name- It shows name of the state. 2. District Name- It shows name of districts in particular state. 3. Town Name- It shows name of towns in particular district. 4. Class Type -It shows the class of particular town. 5. Population- It shows population of particular town. 6. MAS - It shows the market attractiveness score for the town.
MART Knowledge Centre12

7. MAS India Rank- It shows the ranking of towns in India based on market attractiveness score (MAS). Lower ranking shows higher prosperity for town.
8. MIS – It is Market Intensity Score. It shows per capita prosperity of town. Higher score depicts higher per capita prosperity.
9. Means Score- It shows prosperity in terms of income. Higher score shows higher per capita means. 10. Consumption Score- It shows prosperity in terms of consumption. Higher score shows higher per capita consumption. 11. Awareness Score- It shows prosperity in terms of awareness. Higher score shows higher per capita awareness. 12. Infrastructure Score- It shows prosperity in terms of infrastructure. Higher score shows higher per capita infrastructure. 13. Television– It shows penetration of television at household level .
Note : Above Table has been taken from Town Index
Validation
Market Intensity Score (MIS) has been validated by referring the data of per capita income of States as stated in ‘Great Indian Middle Class Report
by NCAER’; MIS is found to have high correlation (.89) with per capita income at state level.
MART Knowledge Centre 13

Cases
Case 1 (Location specific….Using Town Index) Business Problem: A company wants to explore Rajasthan for expanding its marketing reach. It wants to identify potential towns in the state to plan its market expansion. Role of Index to solve the marketing problem: Both “MAS” and “MIS” will help the company to find the solution for the marketing problem. High MAS score ensures there is sufficient size of market to tap and high MIS score ensures high per capita prosperity. The index will find the towns which are economically prosperous.
MART Knowledge Centre14

MART Knowledge Centre 15

Steps to use the software:
1. Click on “ MART MAS” button of the software
2. Select “Town” from “Type” drop down menu
3. Select “Rajasthan” from “State” drop down menu
4. Select “Select all” from “District” drop down menu
5. Select “Select all” from “Class/Level” drop down menu
6. Select “MIS” from “Factor” drop down menu
7. Select any indicator from “Indicator” drop down menu (like Television)
8. Click on “View Result” Button
Output: Top ten towns selected on the basis of MAS or MAS India Rank and selecting top five towns among those based on MIS
The above circled five towns are highly prosperous in Rajasthan to provide better business opportunity.
MART Knowledge Centre16

Case 2 (Product Specific)
Business Problem: There is a DTH company in India. It is already doing its business in big towns (class I, II and III) of Punjab. Now, it wants to expand its business in small towns of Punjab. Company wants to know which small towns of Punjab have higher market potential . Role of Index to solve the marketing problem:
MART Knowledge Centre 17
Three data points such as MAS, MIS and TV penetration will help the company to overcome the marketing challenge. It helps to find the most prosperous small towns in Punjab state. The index will find the towns which are economically prosperous. It will also show the penetration of TV (that is supplementary to DTH) for small towns.

MART Knowledge Centre18

Steps to use the software:
1. Click on “ MART MAS” button of the software
2. Select “Town” from “Type” drop down menu
3. Select “Punjab” from “State” drop down menu
4. Select “Select all” from “District” drop down menu
5. Select “Class IV, V, VI” from “Class/Level” drop down menu
6. Select “MIS” from “Factor” drop down menu
7. Select “Television” from “Indicator” drop down menu
8. Click on “View Result” Button
Output: Top five small towns selected on the basis of MAS or MAS India Rank
Now, Company can further select small town based on MIS as well as “TV penetration” because MIS depicts depth of market, TV is supplementary to DTH.
MART Knowledge Centre 19
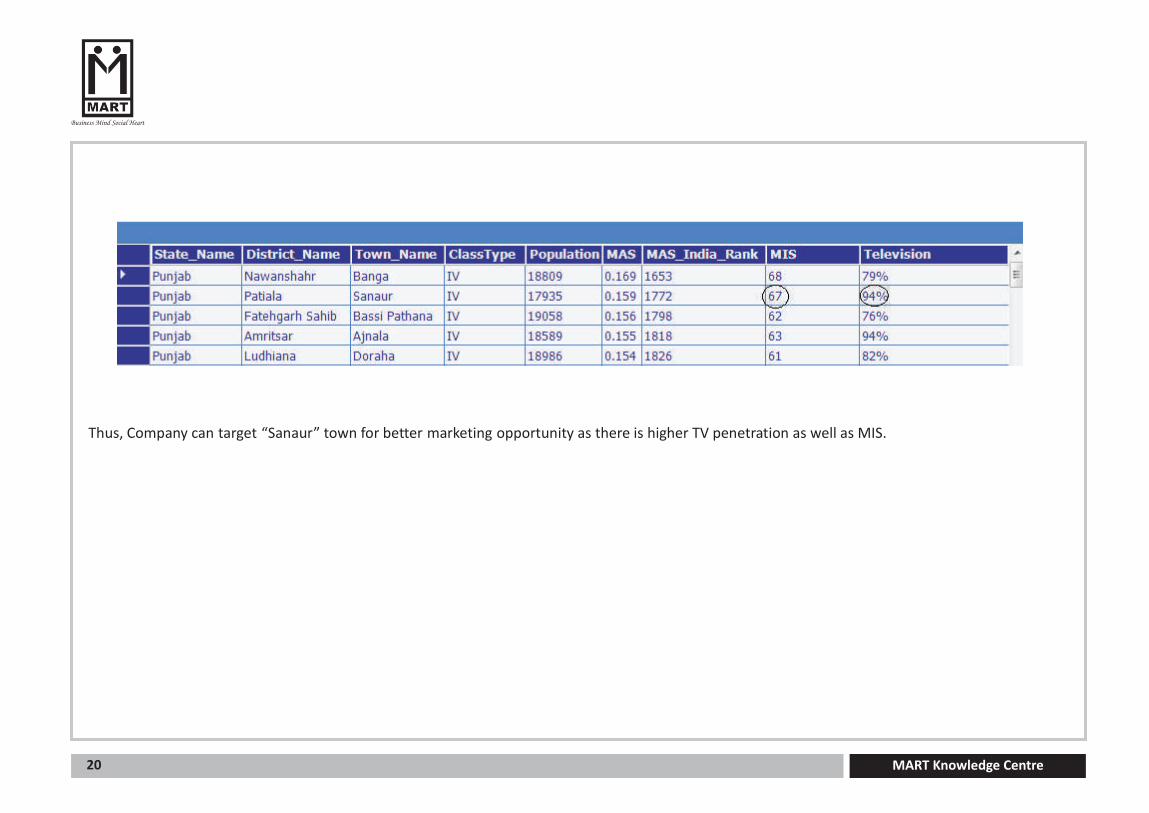
Thus, Company can target “Sanaur” town for better marketing opportunity as there is higher TV penetration as well as MIS.
MART Knowledge Centre20

Case 3 (Company Specific)
Business Problem:
Role of Index to solve the marketing problem: “MART MAS” will help the agency to find a marketing solution to the problem. It helps finding the most prosperous block/sub district in Madhya Pradesh.The index will find the blocks/sub districts which are economically prosperous as well as having higher per capita awareness score.
MART Knowledge Centre 21
There is a media agency and is planning a campaign in prosperous block of Madhya Pradesh. The agency wants to identify a block (smaller administration unit in a district) which should have better acceptability/reach for its media campaign.

MART Knowledge Centre22

Steps to use the software:
1. Click on “ MART MAS” button of the software
2. Select “Sub District” from “Type” drop down menu
3. Select “Madhya Pradesh” from “State” drop down menu
4. Select “Select all” from “District” drop down menu
5. Select “Rural” from “Class/Level” drop down menu
6. Select “Awareness Score” from “Factor” drop down menu
7. Select any indicator from “Indicator” drop down menu (like Radio)
8. Click on “View Result” Button
Output: Top three blocks / sub districts selected on the basis of MAS or MAS India Rank
Now, Agency can further select blocks / sub districts based on “Awareness Score” as ‘Awareness Score’ depicts the per capita level of awareness. Thus, Agency can enter in “Mandsaur” block for better response of media campaign.
MART Knowledge Centre 23
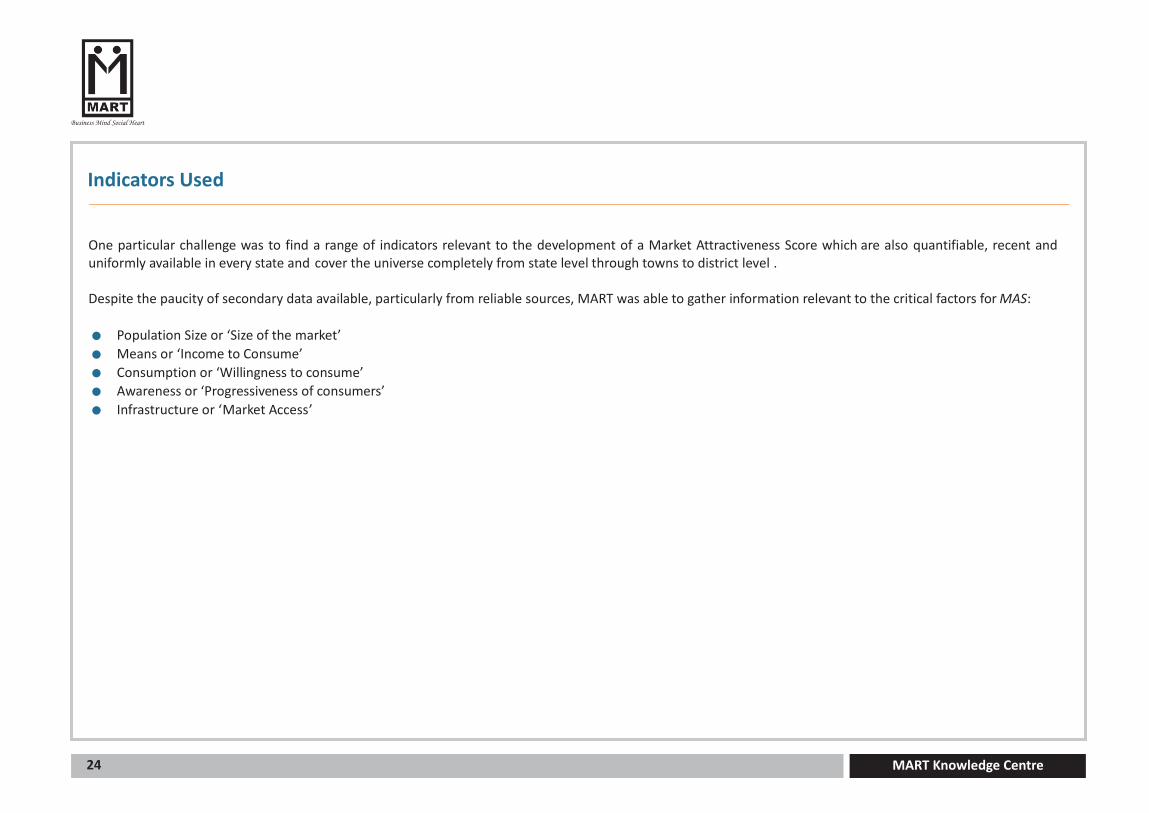
Indicators Used
One particular challenge was to find a range of indicators relevant to the development of a Market Attractiveness Score which are also quantifiable, recent and uniformly available in every state and cover the universe completely from state level through towns to district level . Despite the paucity of secondary data available, particularly from reliable sources, MART was able to gather information relevant to the critical factors for MAS:
Population Size or ‘Size of the market’
Means or ‘Income to Consume’
Consumption or ‘Willingness to consume’
Awareness or ‘Progressiveness of consumers’
Infrastructure or ‘Market Access’
MART Knowledge Centre24

Listing of Indicators A full listing of indicators is provided below:
* Ownership of TV (%), Ownership of Radio (%) have been considered surrogate for TV viewership and radio listenership respectively. ** ‘Number of bank branches’ also includes branches of credit societies. ’Number of educational institutions’ includes all types of schools, colleges including vocational institutions. ’Number of health institutions’ includes PHC, CHC, hospital, dispensaries, nursing homes etc. ’Number of recreational centre’ includes cinema hall, auditorium, stadium and recreational and cultural facilities.
INDICATORS USED
Sl. No.
Indicators Towns Sub District (Rural)
District (Urban)
District (Rural)
State (Urban)
State (Rural)
Population Size
1 Population √ √ √ √ √ √
Means to Consume
2 Bank deposits (Rs.) √ √ √ √ √ √
3 Work participation rate (%) √ √ √ √ √ √
Willingness to Consume
4 % of households availing banking services - √ - - - -
5 Ownership of telephone (%) √ √ √ √ √ √
6 Ownership of two-wheeler (%) √ √ √ √ √ √
7 Ownership of four-wheeler (%) √ √ √ √ √ √
8 Ownership of LPG (%) √ √ √ √ √ √
9 Ownership of Pucca House (%) - √ √ √ √ √
10 % of electrified households √ √ √ √ √ √
Awareness/Progressiveness of the Consumers
11 Female Literacy (%) √ √ √ √ √ √
12 *Ownership of TV (%) √ √ √ √ - √
13 *Ownership of Radio (%) √ √ √ √ √ √
14 Reach of Newspaper (%) - √ - √ - √
Infrastructure
15 **Number of bank branches √ √ √ √ √ √
16 **Number of educational institutions √ √ √ √ √ √
17 **Number of health institutions √ √ - √ - √
18 Number of beds in the health institutions - - √ - √ -
19 Number of post and telegraph offices - √ - √ - -
20 **Number of recreation centres √ - √ √ √ √
MART Knowledge Centre 25

Source of Data The data for above indicators have been collected from a variety of premium sources. Efforts have been made to use the most recent data available.
Sources Year
Bulletin on Rural Health Statistics 2009
Census 2001
Directorate of Inspection and Marketing 2004
Educational Statistics 2003-04
IRS 2008
Mc Kinsey Global Institute analysis 2008
Ministry of Agriculture 2000-01
Ministry of Communications & Information Technology 2008
NCAER 2007-08
NIC 1997
NSSO 2007-08
Population Projection Census 2011
RBI 2008
RMAI Study 2008
VMW Analytic Services 2009
MART Knowledge Centre26

Derivation of The MART MAS
Deriving The MART MAS undertook a number of steps which are outlined below: Step 1: Identifying relevant indicators and gathering available information from secondary data sources.
Step 2: Accounting for data missing at town/ sub-district levels Many of these indicators’ data were not available at all geographical levels, particularly at the town level as well as sub districts-rural level. In those
cases, their district level data has been apportioned to different towns or sub districts based on the ratio of working population. Step 3: Expressing data in ‘Per Capita’ terms All data have been converted into per capita terms by dividing it by the population of respective location . Step 4: Standardizing the data
As each of the indicators is measured in different units, uniformity was achieved by transforming individual values of a location to a fraction of the maximum value. This was obtained by dividing the value of individual town / sub district/ district / state data by the maximum value of that indicator among all the towns / sub district/ district/ state.
Step 5: Calculating weights of Indicators using Principal Component Analysis
Weights for different Indicators were derived by Principal Component Analysis (factor analysis) onto each ‘Factor’. In this analysis, factor loadings of each indicator were used as weights to explain the maximum variation of each ‘Factor’.
Step 6 Respective sub indices (factor score) such as Means Score, Consumption Score, Awareness Score and Infrastructure Score have been derived by calculating the weighted average of respective indicators under it. Maximum value among each of the factors has been converted into 100 and accordingly other values of different factors have been adjusted to come out with index.
Step 7: Calculating weights of ‘Factors’ using Principal Component Analysis
Weights for different Factors were derived by Principal Component Analysis (factor analysis) onto overall prosperity. In this analysis, factor loadings of each factor were used as weights to explain the maximum variation.
Step 8: Using above weights of sub-indices, Market Intensity Score (MIS) has been derived by calculating the weighted average of those. Maximum value among MIS has been converted into 100 and accordingly other values of MIS scores have been adjusted to come out with index.
MART Knowledge Centre 27

Step 9: Market Attractiveness Score (MAS) is calculated by multiplying Market Intensity Score (MIS) with the population. Maximum value among MAS has been converted into 100 and accordingly other values of MAS scores have been adjusted to come out with index.
Critical Factors & Indicators Weights in %
Towns Sub district(Rural) District (Urban) District (Rural) State (Urban) State (Rural)
Means to Consume
Bank deposits (Rs.) 50 50 50 50 50 50
Work participation rate (%) 50 50 50 50 50 50
Total 100 100 100 100 100 100
Willingness to Consume
Households availing banking services (%) - 13 - - - -
Ownership of telephone (%) 24 16 18 18 16 13
Ownership of two-wheeler (%) 22 15 16 18 14 19
Ownership of four-wheeler (%) 23 13 17 16 16 16
Ownership of LPG (%) 17 16 19 16 18 18
Ownership of pucca house (%) - 13 13 14 16 17
Electrification of households (%) 15 14 17 18 19 17
Total 100 100 100 100 100 100
Progressiveness of the Consumers
Female Literacy (%) 23 29 35 27 50 23
Ownership of TV (%) 39 28 35 27 - 30
Ownership of Radio (%) 38 20 30 21 50 25
Reach of newspaper (%) - 23 - 25 - 22
Total 100 100 100 100 100 100
Infrastructure
Number of bank branches 25 21 21 23 25 32
Number of educational institutions 20 27 25 28 29 32
Number of health institutions 27 26 - 28 30 13
Number of beds in health Institutions - - 29 - - -
Number of recreational centres 28 - 25 5 30 23
Number of telegraph offices - 26 - 16 - -
Total 100 100 100 100 100 100
Broad Parameters
Means 23 15 25 21 30 -
Consumption 32 30 27 29 27 50
Awareness 30 28 30 28 22 50
Infrastructure 15 27 18 22 21 -
Total 100 100 100 100 100 100
Index of districts and states at overall level have been derived by combining rural and urban indices
MART Knowledge Centre28

Glossary The terms and definitions used in this document are given below: URBAN: All statutory places with a municipality, corporation, cantonment board or notified town area committee, etc. are considered to be urban. This
includes all the towns and cities in India. CITY: All the towns above 5 lakh population are considered as cities. TOWN: A town is a human settlement larger than a village but smaller than a city. DISTRICT: Districts are local administrative units. Districts are generally grouped into administrative Divisions, which in turn form States. It comprise of
villages, towns and cities. SUB DISTRICT: Sub district is a low level administrative division of a district. RURAL: With a density of population less than 400 per sq. km and where at least 25 per cent of the male working population is engaged in agricultural
pursuit is called rural. Rural area comprises all the villages in India. HOUSEHOLD: Household comprises of all the number of family members who share one single kitchen. MART MAS: The MART MAS is the MART Market Attractiveness Score, an index for prioritizing locations in terms of attributes relevant to marketers for
market planning. FACTORS: Factors are combination of indicators. MIS: An index for prioritizing locations based on per capita overall prosperity. MEANS SCORE: An index for prioritizing locations based on income earning potential. Higher score shows higher per capita means. CONSUMPTION SCORE: An index for prioritizing locations based on asset consumption. Higher score shows higher per capita consumption.
MART Knowledge Centre 29

AWARENESS SCORE: An index for prioritizing locations based on consumer education and access to mass media. Higher score shows higher per capita
awareness. INFRASTRUCTURE SCORE: An index for prioritizing locations based on infrastructure. Higher score shows higher per capita infrastructure. INDICATORS: Indicators are individual entity that helps in forming factors.
WPR: Work participation rate is defined as the percentage of total workers (main and marginal) to total population.
Work participation rate = Total Workers (Main+Marginal) ---------------------------------------------x 100 Total Population
PUCCA HOUSE: Houses, the walls and roof of which are made of permanent materials. The material of walls can be any one from, namely, galva nized iron sheets or other metal sheets, asbestos sheets, burnt bricks, stones or concrete. Roof may be made of from any one of the following materials, namely, tiles, slate, galvanized iron sheets, metal sheets, asbestos sheets, bricks, stones or concrete.
ELECTRIFIED HOUSEHOLD: Households which are having metered connection of electricity.
EDUCATIONAL INSTITUTION: Includes all primary, middle, secondary, senior secondary schools and colleges.
HEALTH INSTITUTION: Includes government and private health facilities like hospital, dispensary, health centers, nursing homes, clinics, primary health centers and sub centers. TOWN CLASSIFICATION : Towns in India have been classified into six classes , based on population size.
Town Class Population
Class I 1 lakh and above
Class II 50,000 - 99,999
Class III 20,000 - 49,999
Class IV 10,000 - 19,999
Class V 5,000 - 9,999
Class VI Less than 5,000
MART Knowledge Centre30
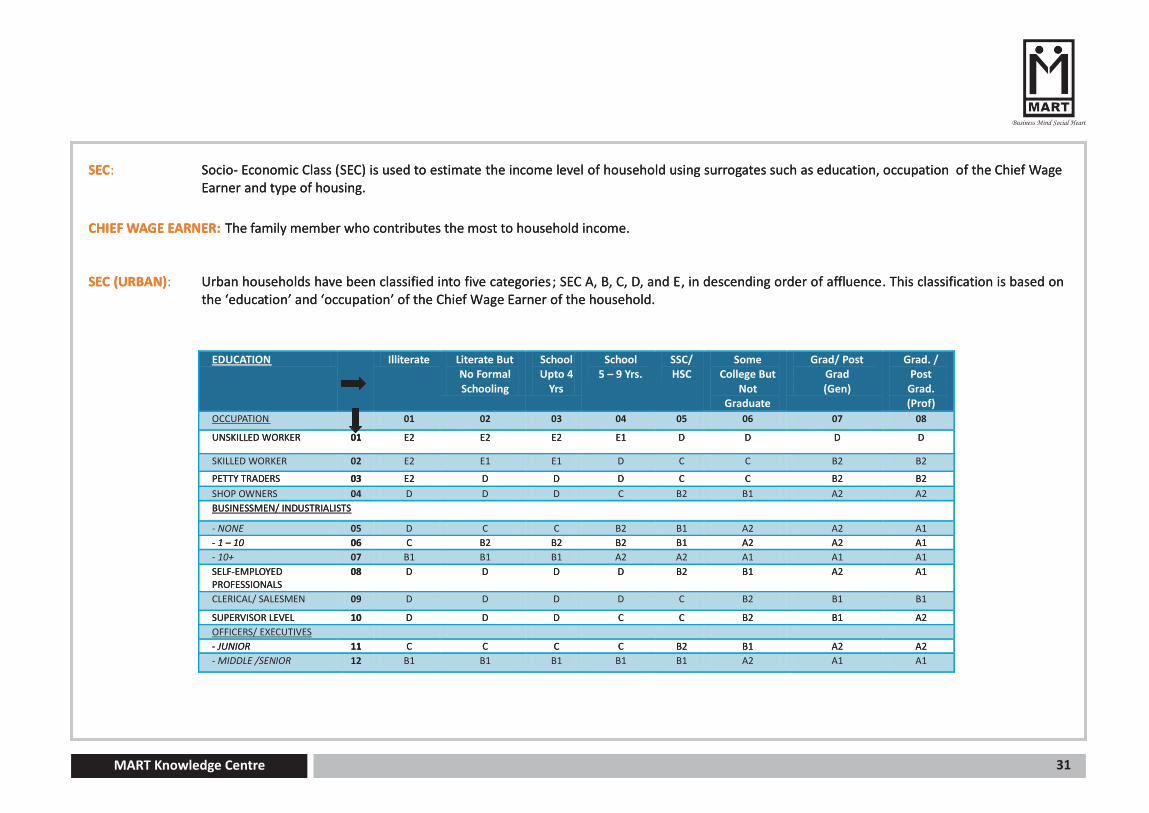
SEC: Socio- Economic Class (SEC) is used to estimate the income level of household using surrogates such as education, occupation of the Chief Wage
Earner and type of housing.
CHIEF WAGE EARNER: The family member who contributes the most to household income. SEC (URBAN): Urban households have been classified into five categories; SEC A, B, C, D, and E, in descending order of affluence. This classification is based on
the ‘education’ and ‘occupation’ of the Chief Wage Earner of the household.
EDUCATION
Illiterate Literate But No Formal Schooling
School Upto 4
Yrs
School 5 – 9 Yrs.
SSC/ HSC
Some College But
Not Graduate
Grad/ Post Grad (Gen)
Grad. / Post
Grad. (Prof)
OCCUPATION 01 02 03 04 05 06 07 08
UNSKILLED WORKER 01 E2 E2 E2 E1 D D D D
SKILLED WORKER 02 E2 E1 E1 D C C B2 B2
PETTY TRADERS 03 E2 D D D C C B2 B2
SHOP OWNERS 04 D D D C B2 B1 A2 A2
BUSINESSMEN/ INDUSTRIALISTS
- NONE 05 D C C B2 B1 A2 A2 A1
- 1 – 10 06 C B2 B2 B2 B1 A2 A2 A1
- 10+ 07 B1 B1 B1 A2 A2 A1 A1 A1
SELF-EMPLOYED PROFESSIONALS
08 D D D D B2 B1 A2 A1
CLERICAL/ SALESMEN 09 D D D D C B2 B1 B1
SUPERVISOR LEVEL 10 D D D C C B2 B1 A2
OFFICERS/ EXECUTIVES
- JUNIOR 11 C C C C B2 B1 A2 A2
- MIDDLE /SENIOR 12 B1 B1 B1 B1 B1 A2 A1 A1
MART Knowledge Centre 31
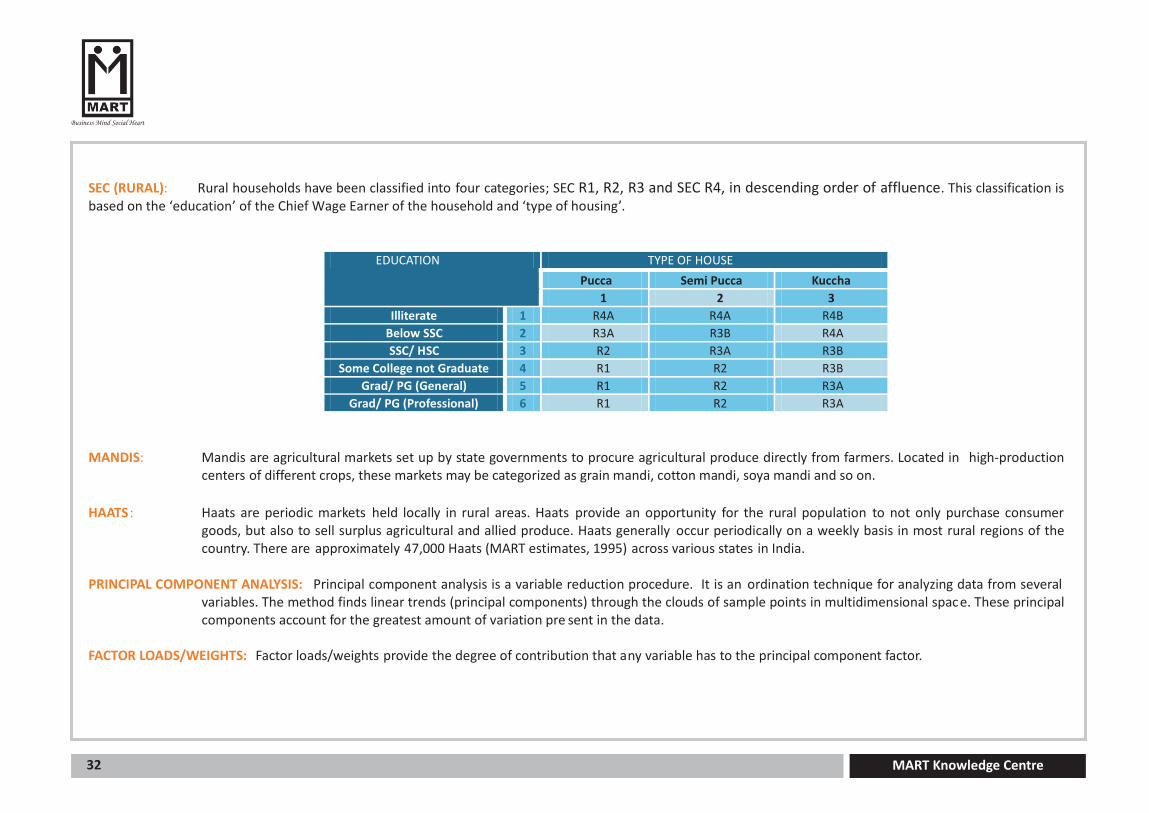
SEC (RURAL): Rural households have been classified into four categories; SEC R1, R2, R3 and SEC R4, in descending order of affluence. This classification is based on the ‘education’ of the Chief Wage Earner of the household and ‘type of housing’.
EDUCATION TYPE OF HOUSE
Pucca Semi Pucca Kuccha
1 2 3
Illiterate 1 R4A R4A R4B
Below SSC 2 R3A R3B R4A
SSC/ HSC 3 R2 R3A R3B
Some College not Graduate 4 R1 R2 R3B
Grad/ PG (General) 5 R1 R2 R3A
Grad/ PG (Professional) 6 R1 R2 R3A
MANDIS: Mandis are agricultural markets set up by state governments to procure agricultural produce directly from farmers. Located in high-production
centers of different crops, these markets may be categorized as grain mandi, cotton mandi, soya mandi and so on.
HAATS : Haats are periodic markets held locally in rural areas. Haats provide an opportunity for the rural population to not only purchase consumer
goods, but also to sell surplus agricultural and allied produce. Haats generally occur periodically on a weekly basis in most rural regions of the country. There are approximately 47,000 Haats (MART estimates, 1995) across various states in India.
PRINCIPAL COMPONENT ANALYSIS: Principal component analysis is a variable reduction procedure. It is an ordination technique for analyzing data from several
variables. The method finds linear trends (principal components) through the clouds of sample points in multidimensional space. These principal components account for the greatest amount of variation pre sent in the data.
FACTOR LOADS/WEIGHTS: Factor loads/weights provide the degree of contribution that any variable has to the principal component factor.
MART Knowledge Centre32
Disclaimer
This SOFTWARE PRODUCT is provided by MART "as is" and "with all faults." MART makes no representations or warranties of any kind concerning the safety, suitability, lack of viruses, inaccuracies, typographical errors, or other harmful components of this SOFTWARE PRODUCT. There are inherent dangers in the use of any software, and you are solely responsible for determining whether this SOFTWARE PRODUCT is compatible with your equipment and other software installed on your equipment. You are also solely responsible for the protection of your equipment and backup of your data, and MART will not be liable for any damages you may suffer in connection with using, modifying, or distributing this SOFTWARE PRODUCT.

Contact Us :MART, A-32, Sector 17, NOIDA, 201301 (UP, India)Tel - 91-120-2512140, Email: [email protected], Website: www.martrural.com