the megawatershed concept and recharge · pdf filerecharge analyses - sustainable groundwater...
TRANSCRIPT
THE MEGAWATERSHED CONCEPT AND RECHARGE ANALYSES - SUSTAINABLE
GROUNDWATER EXTRACTION FROM BEDROCK AQUIFERS IN TOBAGO
By
Utam S. Maharaj and Randolph Sankar
Water & Sewerage Authority TRINIDAD & TOBAGO
And
Roland B. Hoag, Robert A. Bisson and Joseph C. Ingari EarthWater Technology International, Inc. UNITED STATES OF AMERICA
1. Introduction
Emanating from an intensive geological exploration programme and hydrological study of the entire island of Tobago performed in 1999-2000 for the Water and Sewerage Authority of Trinidad and Tobago (WASA), several potential large area groundwater-bearing geological environments, called "megawatersheds" were identified for possible development by a team of exploration scientists using proprietary technologies from the U.S. firm EarthWater Technology International, Inc.. These previously unmapped megawatersheds consist of extensive networks of hydraulically conductive and interconnected fractures underlying alluvial deposits, which combine to provide groundwater storage and recharge to bedrock aquifers proximal to water-short consumer communities. The newly discovered Tobago bedrock aquifers are much larger than prior groundwater development targets on the island, representing an order of magnitude more high-quality renewable and readily accessible fresh water than previously recognized using traditional hydrological models.
In order to adequately predict long-term water availability within Tobago's megawatershed bedrock aquifers, a comprehensive recharge analysis was performed using all available data. Recognising the geographical extent of the megawatersheds, the limited quantity of hydrological data present for the island and the heterogeneous nature of the terrain, the authors calculated groundwater recharge for the island's megawatersheds and specific targeted aquifers by developing a correlation among several parameters, including topography, rainfall, run-off, soils, bedrock permeabilities and evapotranspiration.
This paper presents results of these analyses and recommendations for more accurate predictions of recharge in future investigations.

Conclusions Regarding Sustainable Development Potential 1. Average groundwater recharge from rainfall in Tobago is approximately 84 Million
Imperial Gallons per Day (imgd). 2. Tobago's overall safe, sustainable groundwater development potential exceeds 40 imgd. 3. Tobago possesses at least fourteen (14) geographically extensive "megawatersheds"
containing gravel and/or fractured bedrock aquifers proximal to population centres and existing WASA water mains.
4. Sixteen (16) preliminary Favourable Groundwater Development Zones ("Favourable
Zones") delineated most of which are recharged by megawatersheds and each with high potential for yielding groundwater volumes capable of solving local water shortages with a combined potential daily groundwater recharge of over 40 imgd.
The Megawatershed Concept Background Formal studies of groundwater relationships to bedrock fractures date back at least to 1835 when Hopkins listed his observation of rectangular arrangements in topographic features, faults, mineralised veins, joints and alignment of springs [1]. Before the onset of civilian orbital remote-sensing data, O. R. Angelillo, a professor of engineering at the California Institute of Technology and a pioneer in the study of tectonics, regional rock mechanics and underground water flows, graphically described a stress- field induced and fractured-rock groundwater system in his regiona l analysis [2] of the Mojave basin, California. He presented maps and discoveries to the State of California in 1958, which provided clear evidence of his early insights into these regional scale processes.
In the 1970s and 80s, results of exploration programs using space images and modern geologic mapping methods, carried out in East Africa [3], showed that the effects of tectonic controls on hydraulic conductivity are related to regional groundwater flows through fractured rock. A conceptual exploration model of these Megawatersheds was published by the Third World Academy of Sciences in1989 [4] and by the Environmental Research Institute of Michigan in 1990 [5].
Traditional Watershed Model
Traditional watershed models reflect limited drainages, where groundwater recharge is controlled by local topography and wherein hydrologic implications of underlying, regional geologic structures on rainfall capture, storage and transmission is ignored. Deep, often semi-

confined bedrock groundwater resources are cons idered fossil and are excluded as active parts of the water balance because they are deemed to be hydraulically isolated and noninteractive with watershed catchments [6,7]. At the same time, traditional evaluations of groundwater recharge in most regions are constrained by a paucity of data regarding rainfall, runoff, solar insolation, and the hydraulic permeabilities of indigenous soils and bedrock [7]. Unfortunately, traditional hydrological investigative methods depend on sparse data over large areas, because meteorological stations and stream gauges have historically been located for reasons of observer convenience rather than maximum scientific usefulness. Few rain gauges exist in uninhabited or mountainous zones, and water balance calculations are often based on short-term, error-prone measurements of precipitation, evapotranspiration and runoff [8].
Regardless of the insufficiency of valid data, complex analytical methods such as the Penman Formula, which require comprehensive coverage of several critical parameters, are commonly used to calculate evapotranspiration [7]. As a result, publications on the subject of water balance include erroneous concepts [9] and calculations based on incorrect assumptions about size of catchment area [10], precipitation [8] and actual evaporation [11], and these reference works are the principal sources of groundwater resource information utilised by governments, engineers and planners. This can lead government and private water providers to commit to costly surface water development projects in regions where deep groundwater development represents a less expensive alternative [12,13,14].
Megawatershed Model
The "Megawatershed " is a new model, or paradigm, which greatly extends the catchment, transmission and storage boundaries of traditional watersheds by recognizing the overriding influence of tectonically induced, large scale fracture permeability in defining the hydraulics and hydrology of a basin [15,16,17,18,19]. Traditional watersheds are subsidiary elements of megawatersheds. Applying the megawatershed model provides an understanding of the interaction of surface water, shallow aquifers and fractured bedrock aquifers and greatly improves the accuracy of sustainable groundwater resource calculations.
The premise of the megawatershed model is that aquifers contained in these fractured bedrock basins possess not only simple primary porosity but also pervasive fracture permeability. Megawatershed systems exist worldwide, and this novel concept of tectonically- induced, regional fracture permeability adds a major new dimension of rainfall catchment, groundwater flow and storage to currently recognized aquifers, such as Africa's Nubian sandstones [20,21,22], while at the same time defines new aquifers in previously discounted non-porous rocks, such as Tobago's volcanics.
While application of the megawatershed paradigm may appear to be most vital in arid regions, the prohibitive financial and environmental costs of delivering fresh water using traditional concepts and conventional technologies are quite similar worldwide. From the African deserts

to the Caribbean Sea, countries seek to resolve water-sourcing problems using shallow wells, surface impoundments and seawater desalination, while there is new evidence that megawatersheds are an undiscovered natural water resource worth investigating.
Groundwater Exploration Approach and History
For nearly 30 years, Earth observation from satellites have enabled scientists to examine synoptic views of large regions of the planet's surface over long periods of time, providing insights into the dynamics of regional complex natural systems including the role plate tectonics plays in the genesis of underground resources, from oil & gas to deep groundwater, including regional characteristics of the hydrologic cycle never before detected.
At the same time, advances in geophysical instruments, applications and interpretive methods have also contributed unprecedented information about the subsurface of the Earth's crust. Equally important, the perfecting of computer-based geographic information systems has allowed explorationists to quickly and accurately combine and analyse many different types of data.
The integrating of these innovative conceptual and technological tools into effective exploration methodologies led first, in the 1970s to breakthroughs in the detection of oil, gas and minerals deposits, and then in the 1980s, to the discovery of Megawatersheds and development of a proprietary exploration programme capable of predictably identifying and evaluating such complex groundwater systems [21].
By 1980 prolific bedrock aquifers were discovered in New England's classically low-yielding (0 - 10,000 igpd) granites, with wells drilled using these techniques in the same areas consistently yielded more than 100,000 igpd, ten times the volume of traditional groundwater development methods [21]. Within six years, this feat was repeated in other parts of the USA and in Africa's most arid and complex hydrogeological terrains [21].
Tobago Megawatersheds History of Groundwater Development in Tobago An examination of historical documents and reports reveals little success after several attempts to discover and develop groundwater in Tobago over the past thirty years. A cumulative total of less than 200 thousand imperial gallons per day (IMGD) of potable groundwater resource was developed during this time, reflecting the limitations of traditional hydrogeological concepts and conventional exploration and drilling technologies when applied in a complex hydrogeological environment such as Tobago.

Most of Tobago's present day coastal communities, where the fresh water needs are greatest, are located on land that was below sea level 10,000 years ago, very recently in geologic time. These once-submerged lands retain salt water within the pore spaces of their sediments, which may be left intact, diluted or even replaced by rain-fed fresh waters, depending on the vagaries of local geologic structure and climate. Consequently, wells drilled blindly into these sediments usually yield brackish water, which has been the case for documented wells in the Courland, Golden Grove, and Bon Accord areas of Tobago.
Unfortunately, the failures of past efforts led investigators to the false conclusion that Tobago lacked economic quantities of potable groundwater. Over the past several decades, such conclusions have impeded WASA's ability to solve local water problems and impaired the economic development of the island. The history of documented groundwater development efforts in Tobago is summarized in Table 1

Geology of Tobago
This summary of Tobago's geology is based on reports, theses and maps (Plate 1) produced during the last 15 years by Arthur Snoke and his associates [22, 23], as well as 1999-2000 fieldwork performed and reports and maps prepared during the WASA 1999-2000 Tobago Groundwater Assessment and Well Development Programme [24].
Tobago is an island exposure that forms part of a structural high composed of chiefly Mesozoic igneous and metamorphic rocks at the northeastern most corner of the present-day South American continental shelf. However, petrochemical data indicate an oceanic island arc character, implying an allochthonous history since petrogenesis. Tobago, therefore, has a definite affinity with allochthonous oceanic-arc rocks that occur as scattered fragments along the northern rim of South America. Tobago's position and relationships with the southern Lesser Antilles arc and associated accretionary prism are more uncertain.
The Mesozoic rocks of Tobago can be divided into four main groups: the North Coast Schist (NCS), amphibolite- facies aureole (dynamothermal metamorphism of the NCS rocks), the ultramafic to tonalitic plutonic complex, and the Tobago Volcanic Group (TVG). These broad lithologic subdivisions form approximately east-west-striking belts that transect the island. A mafic dike swarm widely intruded the plutonic complex and TVG, whereas only scattered post-metamorphic dikes occur in the NCS belt. The Mesozoic rocks of Tobago represent an exceptional cross-section through part of a composite oceanic-arc terrane.
Younger Cenozoic sedimentary deposits consist of clays, silts, sandstones, and gravels (Rockly Bay Formation), and a younger platform of coralline limestone (Booby Point). These deposits represent various shallow marine accumulations and their preservation records tectonic uplift and/or sea level changes.
Brittle faults of variable slip delineate several fault systems that have fragmented the Mesozoic lithic belts of Tobago. Although the large-scale fault systems that offset lithologies can be conveniently summarized on the geologic map of Tobago, the island is pervasively fractured by faults of all scales. It is unusual to examine decametre scale exposures of Mesozoic igneous and metamorphic rock on Tobago without finding some evidence of brittle fracturing and faulting.
Megawatersheds Exploration Programme
Megawatersheds boundaries were mapped and hydrogeological models developed to calculate recharge and sustainable yields of favourable groundwater development zones ("Favourable Zones") identified on the island (Plate 2). The models established a knowledge-based estimate of groundwater recharge volumes and flow paths of groundwater within Favourable Zones.
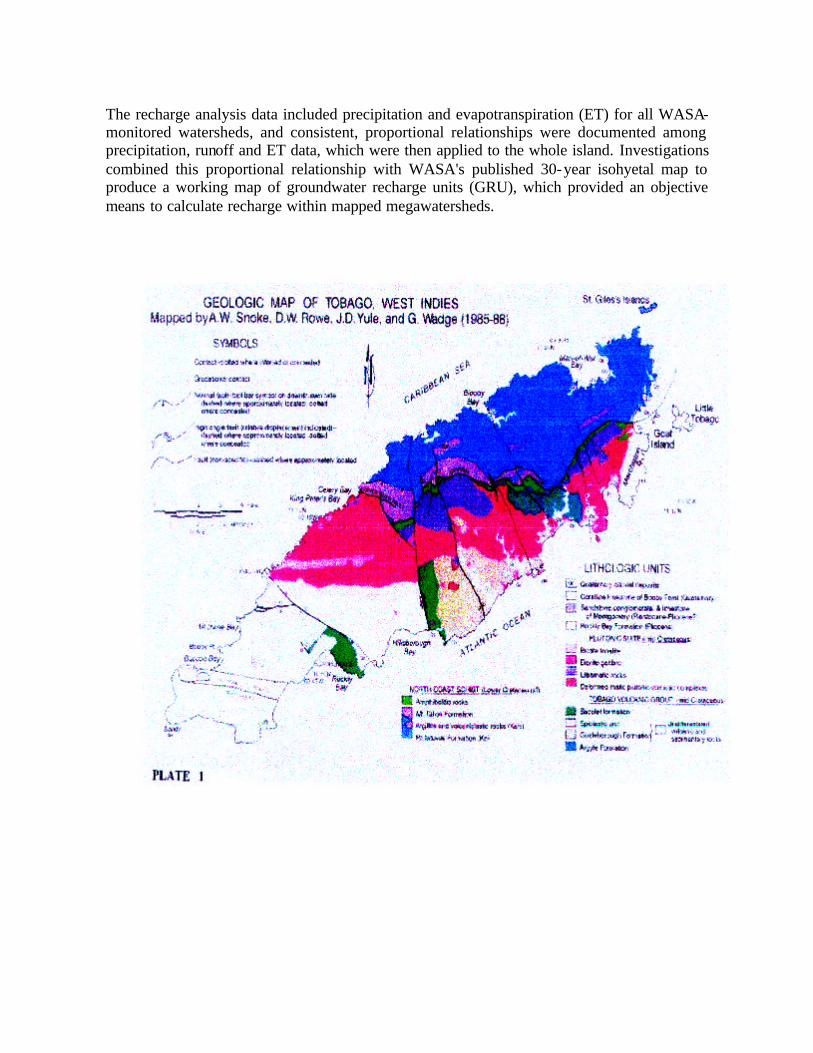
The recharge analysis data included precipitation and evapotranspiration (ET) for all WASA-monitored watersheds, and consistent, proportional relationships were documented among precipitation, runoff and ET data, which were then applied to the whole island. Investigations combined this proportional relationship with WASA's published 30-year isohyetal map to produce a working map of groundwater recharge units (GRU), which provided an objective means to calculate recharge within mapped megawatersheds.

Data Collection
The initial task in a megawatershed exploration program is the collection of data from a large number of sources. The types of data collected for this project include hydrological, meteorological, climatological, topographic, cadastral, geophysical and remotely sensed data, along with existing Geographic Information System materials.
The raw data used in this investigation to estimate the groundwater recharge to both bedrock and alluvial aquifers came from the climatological and gauged streamflow database developed by WASA over several decades years, includ ing:
· Annual stream flow data from the Courland, Kings Bay, Louis D'or and Richmond stream gauge station.

· Annual average basin-wide precipitation data as compiled by WASA for the Courland, Louis D'or, Kings Bay and Richmond watersheds for the same years as the annual flow data.
· Free surface evapotranspiration data obtained from WASA files for the Crown Point airport station in Tobago and the Hollis Dam station in Trinidad.
Mapping of megawatersheds and bedrock aquifers within megawatersheds requires the analysis of the structural geology, and topographic and remotely sensed data. The data that was used for this project was acquired from the following sources:
· Orbital Thematic Mapper imagery I
· Orbital Satellite radar imagery
· Digital topographic data
· Aerial photography
· Geological Maps
· On-Ground Mapping by Exploration Geologists
Precipitation
The team employed precipitation data for the Crown Point airport, Courland, Louis D'or, King's Bay and Richmond watersheds. The isohyetal map published by WASA and representing 30 years of island-wide data was also incorporated into the groundwater recharge calculations described below. It would have been preferable to have 10 years of daily precipitation data with no gaps, but after an exhaustive search, it was determined that such data did not exist. Consequently, after reviewing the rigorous manner in which the 30-year isohyetal maps were created by WASA, it was decided that the prudent use of these maps would result in a conservative recharge analysis of the Island. Obviously, during substantial droughts, the recharge would be substantially less.
Evapotranspiration
Evapotranspiration includes the sum of volumes of water used by both evaporation and transpiration processes, and is influenced by many factors, including solar radiation intensity and duration, wind conditions, relative humidity, cloud cover, atmospheric pressure, soils, vegetation and surface roughness. A widely used method for estimating evapotranspiration is

the Penman method, which presents a heat budget in terms of gains and losses in energy, where
H = Rn = S + ET + K + N + storage terms,
in which
H=heat budget
Rn=net radiation
S=energy to soil heat ET = energy used for evapotranspiration
K = sensible heat to air, and
N = energy used by plant in photosynthesis
Penman proved that this equation could be simplified to H = K + ET, since the other terms have a negligible impact and Penman solved this equation by substituting free surface evaporation for evapotranspiration and then making adjustments for annual evapotranspiration based on the season and geographic location. The calculation of free surface evaporation requires many meteorological parameters that are not available at many climatological stations. The parameters necessary for estimating evapotranspiration using the Penman method include:
- air temperature
- relative humidity
- wind speed
- solar radiation
- insolation
- reflective coefficient
The estimate of free surface evaporation (or Potential Evapotranspiration) is the maximum amount of water a plant will use assuming the supply to be non- limiting. However, in Tobago, there are distinct wet and dry seasons. Penman suggests in the tropics that the daily or monthly Potential Evapotranspiration be multiplied by a factor of 75%. The Crown Point airport provides estimates of free surface evaporation that was calculated by using the Penman equation, and this data was multiplied by the 0.75 factor to estimate actual evapotranspiration on a monthly basis.

The evapotranspiration data from the Crown Point airport does not accurately represent the evapotranspiration for the whole island, since the airport receives the least rainfall and highest insolation of the whole island. In contrast to the lowlands area, the interior of the island has substantially greater periods of cloud cover and rainfall, and is cooler due to a higher elevation. Solar radiation and temperature are important variables that impact the amount of evapotranspiration, and areas with greater rainfall should have a lower evapotranspiration.
This theory was tested in two ways. The first was to compare the average estimated evapotranspiration (0.75 times free surface evaporation) and precipitation from the Crown Point station with the data from Hollis Reservoir station in Trinidad, which has a much greater annual precipitation. The evapotranspiration and precipitation at Crown Point, averaged over the years 1993, 1994 and 1995, were 1118 mm and 1079 mm, respectively. The evapotranspiration at the Hollis station (the closest station to Crown Point on the island of Trinidad) was 795 mm and precipitation was 2817 mm for the same three years. A linear equation with precipitation as the independent variable and potential evapotranspiration as the dependant variable using data from Crown Point and Hollis yields a relationship governed by the equation:
ET = -.186 (PPT) + 1319
The other method of estimating evapotranspiration from precipitation was done by plotting the monthly Crown Point evapotranspiration data (0.75 times for surface evaporation) against the monthly Crown Point precipitation data. The estimated evapotranspiration data was plotted against the monthly precipitation data for the Crown Point station for the years 1993, 1994 and 1995 (Fig. 1). A linear least squares regression of the data was performed and an equation relating monthly precipitation (PPT) to evapotranspiration was derived: Monthly ET = -.146 (monthly PPT) + 106
The equation relating annual ET to Annual Precipitation was determined by multiplying both sides of the equation by 12. This equation is as follows:
Annual ET = -.146 (Annual PPT) + 1272
The slope and constant from this equation are very close to those derived from the Hollis/Crown Point Data. For example, the calculated ET at 1500 mm and 2000 mm precipitation for the Hollis/Crown Point equation is 1040 and 947 versus 1057 and 984 for the monthly Crown Point data, which is less than 4% error. The data when plotted on a graph (Figure 2) clearly demonstrate the inve rse relationship between ET and precipitation in Tobago (i.e., that ET decreases as precipitation increases). The above equation was then used to calculate ET (Fig. 3) from long term precipitation data in Tobago obtained from the 30 year isohyetal map published by WASA in the "Explanatory notes for the Hydrogeological maps of Trinidad and Tobago."

Runoff
In order to calculate groundwater recharge, it is necessary to derive a method of estimating runoff for each sub-basin on the Island. The method used for this project used long-term runoff data from several gauged basins in Tobago, including those drained by the Courland, Louis D'or, Bloody Bay, Richmond and Hillsborough Rivers.
Graphs of annual runoff versus annual precipitation for several basins were found to be statistically significant, allowing a relationship between precipitation and runoff to be developed by investigators, which was then applied over the entire island with a high degree of confidence. Figure 4 shows a graph of this relationship for the Courland, Louis D'or, Richmond, Hillsborough and Bloody Bay. A least squares linear regression of this data results in the following equation relating annual runoff to annual precipitation:
Runoff = 0.41 (Precipitation) - 334
This relationship between precipitation and runoff was then used to calculate runoff for a range of precipitation, and a runoff contour map was produced (Figure 5).


Recharge: Calculating Groundwater Recharge Units (GRU)
A recharge contour map was produced by subtracting the ET and Runoff contours from the isohyetal map using the following equation:
Recharge = Precipitation - Runoff - ET
The resultant map was digitised into ArcView to be used for calculating the recharge to each Groundwater Recharge Unit. The Digital Elevation Model was used to delineate sub-basins of approximately one square kilometre (1 km2) in area. The basins were delineated from the
DEM data using a proprietary software package from Environmental Modelling Systems, Inc..
The output was in a digital form easily input into ArcView for integration with the contoured recharge data (Figure 6). The groundwater recharge to each basin was then estimated by merging the contoured recharge data with the sub-basin overlay, resulting in Groundwater Recharge Units (GRU), and a GRU table was created. This GRU table was used to determine the total average annual recharge available to Tobago's groundwater resource as well as the recharge to each megawatershed and Favourable Zone. The total recharge to the Island was calculated at 80 imgd. Most of the recharge infiltrates into the fractured bedrock aquifers and is ultimately lost to the sea, and a substantial portion of this recharge is available for withdrawal by strategically located wells.
Recommended Technique for Improved Groundwater Recharge Prediction
In the year 2000 the authors will apply a novel technique with unprecedented accuracy for groundwater recharge evaluation in both Tobago and Trinidad. The investigators will conduct a comprehensive 10-year recharge analysis for both Tobago and Trinidad using proprietary algorithms and interpretive procedures to process and combine a variety of data sets, including satellite imagery, meteorological station data, land use/land cover and soil data, for the determination of precipitation, evapotranspiration and water yield (runoff and groundwater recharge).
From these new investigations the recharge into favourable zones from megawatersheds will be recalculated to provide a more accurate determination of the safe yields of the aquifers delineated and production wells drilled during the Tobago groundwater investigation.
Status of Megawatersheds Exploitation
During the WASA 1999-2000 Tobago Groundwater Development Programme three (3) of the sixteen (16) favourable zones were targeted for production well development. In the Diamond Estate Favourable Zone, with minimum average annual megawatershed recharge calculated at 1.5 million imperial gallons per day, three production wells have been drilled and tested, with a combined safe yield of 1.35 million imperial gallons per day. In the Government Farms Favourable Zone, with minimum average annual megawatershed recharge calculated at 0.6 million imperial gallons per day, one production well has been drilled and tested, with a safe yield of o.5 million imperial gallons per day. In the Charlotteville Favourable Zone, with minimum average annual megawatershed recharge calculated at 0.4 million imperial gallons per day, two production wells have been drilled and tested, with a combined safe yield of 0.1 million imperial gallons per day.

The fact that these prolific aquifers and water wells have been discovered and developed on this island substantiates the presence of megawatersheds and the rigorous pumping tests associated with the WASA investigation serve to calibrate the investigators' groundwater recharge model. Future refinement of this model will result from a one-year programme of monitoring of well and aquifer performance and new recharge data forthcoming from a 2000-2001 countrywide groundwater recharge investigation using the novel techniques described above.
REFERENCES
1. Hopkins, W., Researches in Physical Geology. 1835. 2. Angillilo, O.R., Replenishing Source of Waters Flowing Through Rock Fissure Aquifers.
Unpublished Manuscript, as presented to State of California. 1959.

3. Bisson, R.A., Hoag, Jr., R.B., Ingari, J. And DeMars, R.M., New Water and Economic Prosperity in the Red Sea Province of Sudan. Series of Three Technical Reports for the U.S. Agency for International Development. 1989,90.
4. Bisson, R A and El-Baz, F., The Megawatersheds Exploration Model. In: Proceedings of
the 23rd International Symposium on Remote-Sensing of Environment, Environmental Research Institute of Michigan. 1990.
5. Postel, S., Last Oasis:Facing Water Scarcity.W.W. Norton & Company 1992. 6. Agnew, C and Anderson, E., Water Resources in The Arid Realm. 1992, London,
Routledge Press. 7. Groisman, P Y and Legates, D.R., A U.S. Climate Study. Bulletin of the American
Meteorological Society. Feb. 1994 8. Pielou, E.C., Fresh Water, University of Chicago press, 1998, pp. 86-87 9. Burbey, T J andPrudic, D.E., Conceptual Evaluation of Regional Ground-Water Flow in
the Carbonate-Rock Province of the Great Basin, Nevada, Utah, and Adjacent States. Regional Aquifer System Analysis. U.S. Geological Survey Professional Paper 1409-D, 1991.
10. Morton, F I., Operational Estimates of Aerial Evapotranspiration and their Significance to
the Science and Practice of Hydrology. Journal of Hydrology 1983, 66. 11. Baker, G., Sudan Pipeline Hangs on Debt Talks, World Water, p53 Jan/Feb 1989. 12. Pearce, F., Britain's Other Dam Scandal. New Scientist, 26 Feb. 1994 13. Maharaj, U., Risk management in Groundwater Development - The Tobago Example,
Proceedings of the Caribbean water and Wastewater Association Annual Conference, Port of Spain, Trinidad and Tobago, October 2 - 6, 2000.
14. Magaritz, Aravena, M Pena, R. H. Suzuki, O. and Grilli, A. , Source of Ground Water in
the Deserts of Northern Chile: Evidence of Deep Circulation of Ground Water from the Andes. Ground Water, , 1990.v.28, no.4,
15. Bisson, R A,, Space-Age Integrated Exploration and Treatment of Renewable Regional
Sources of Pristine Groundwater in Fractured Rock "Megawatersheds" . Desalination, 1994. 99.
16. Angillilo, O.R., Replenishing Source of Waters Flowing Through Rock Fissure Aquifers.
Unpublished Manuscript, as presented to State of California. 1959.

17. Bisson, R.A., Hoag, Jr., R.B., Ingari, J. and DeMars, R.M., New Water and Economic Prosperity in the Red Sea Province of Sudan. Series of Three Technical Reports for the U.S. Agency for International Development. 1989,90.
18. Alam, M., Water Resources of the Middle East and North Africa, With Particular
Reference to Deep Artesian Ground Water Resources of the Area. Water International, 1989. 19. Ahmad, M ., A Model to Develop Ground Water Resources in Egypt. Proceedings of The International Symposium on Water Resources in the Middle East: Policy and Institutional Aspects. 1993 U. of Illinois.
20. Wright, E., Benfield, A.C. Edmund, W.M. & Kitching, R.., Hydrogeology of the Kufra
and Sirte Basins, Eastern Libya. Q.J. Eng. Geol. 1982 London,Vol.15 . 21. Bisson, R., Sheffield, C., and Sisk, S., Megawatershed Exploration: A State-of-the-Art
Technique Integrating Water Resources and Environmental Management Technologies, Proceedings of the IDA Conference on Desalination and Water Resources Development, Abu Dhabi, UAE, 1995.
22. Snoke, A.W., Yule, J.D., Rowe, D.W., Wage, G. and Sharp, W.D. Stratigraphic and
Structural Relationships on Tobago, W.I. and Some Tectonic Implications, Transactions of the 12th Caribbean Geological Conference, 1989, St. Croix, USVI.
23. Snoke, A.W., An Evaluation of the Petrogenesis of the Accreted Mesozoic Island Arc of
the South Caribbean, Transactions of the Second Geological Conference of the Geological Society of Trinidad and Tobago, 1991.
24. EarthWater Technology International, Inc. Tobago Groundwater Assessment and Well
Development Programme, Part A - Hydrogeological Assessment of the Island of Tobago, W.I., February 2000.
25. Maharaj, U., Sankar, R., Jadoo, L., Bisson, R., Hoag, R., Cormier, C. and Ingari, J.
Conceptualisation and Proceedings of the Caribbean water and Wastewater Association Annual Conference, Port of Spain, Trinidad and Tobago, October 2 - 6, 2000.