the middle class: state of mind or share of … · the middle class: state of mind or share of ......
TRANSCRIPT
T H E M I D D L E C L A S S: S TAT E O F M I N D O R S H A R E O F WA L L E T ?SPENDING FLEXIBILITY IN IRELAND IN INFLATIONARY TIMESOCTOBER 2013
2 RISING PRICES ARTICLE - IRELAND
SPENDING FLEXIBILITY IN IRELAND DURING INFLATIONARY TIMES
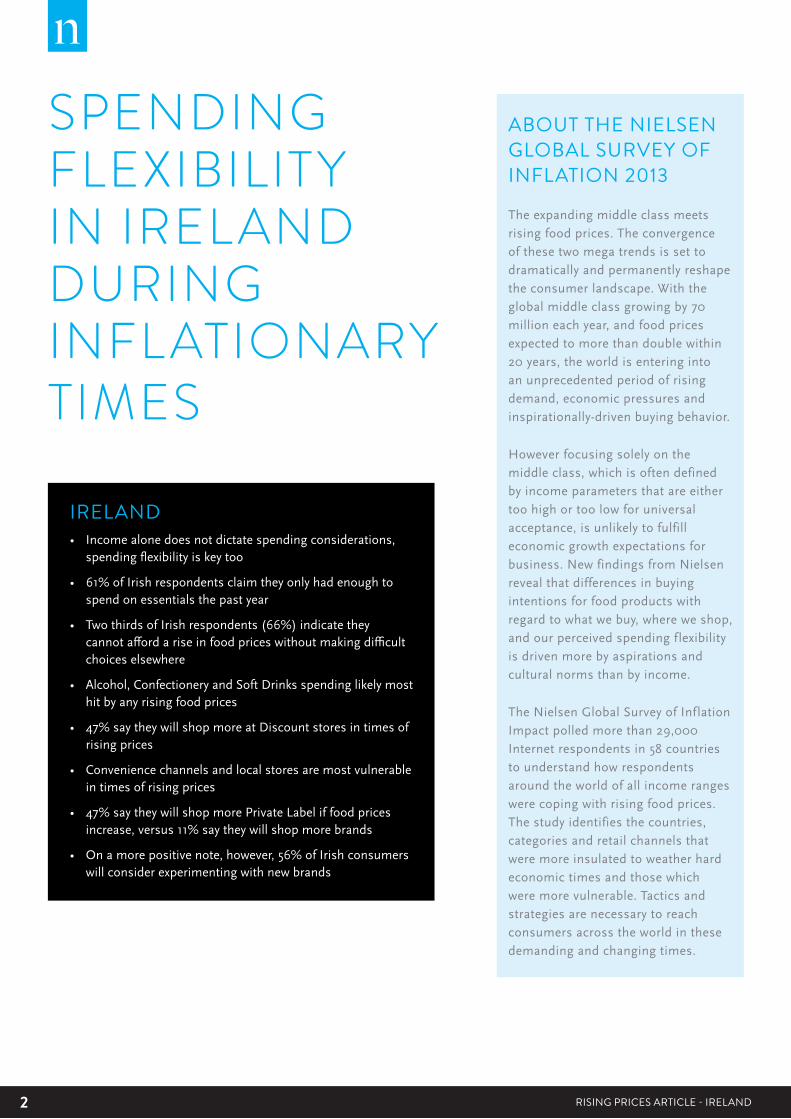
IRELAND• Incomealonedoesnotdictatespendingconsiderations, spendingflexibilityiskeytoo
• 61%ofIrishrespondentsclaimtheyonlyhadenoughto spendonessentialsthepastyear
• TwothirdsofIrishrespondents(66%)indicatethey cannotaffordariseinfoodpriceswithoutmakingdifficult choiceselsewhere
• Alcohol,ConfectioneryandSoftDrinksspendinglikelymost hitbyanyrisingfoodprices
• 47%saytheywillshopmoreatDiscountstoresintimesof risingprices
• Conveniencechannelsandlocalstoresaremostvulnerable intimesofrisingprices
• 47%saytheywillshopmorePrivateLabeliffoodprices increase,versus11%saytheywillshopmorebrands
• Onamorepositivenote,however,56%ofIrishconsumers willconsiderexperimentingwithnewbrands
ABOUT THE NIELSEN GLOBAL SURVEY OF INFLATION 2013
Theexpandingmiddleclassmeetsrisingfoodprices.Theconvergenceofthesetwomegatrendsissettodramaticallyandpermanentlyreshapetheconsumerlandscape.Withtheglobalmiddleclassgrowingby70millioneachyear,andfoodpricesexpectedtomorethandoublewithin20years,theworldisenteringintoanunprecedentedperiodofrisingdemand,economicpressuresandinspirationally-drivenbuyingbehavior.
Howeverfocusingsolelyonthemiddleclass,whichisoftendefinedbyincomeparametersthatareeithertoohighortoolowforuniversalacceptance,isunlikelytofulfilleconomicgrowthexpectationsforbusiness.NewfindingsfromNielsenrevealthatdifferencesinbuyingintentionsforfoodproductswithregardtowhatwebuy,whereweshop,andourperceivedspendingflexibilityisdrivenmorebyaspirationsandculturalnormsthanbyincome.
TheNielsenGlobalSurveyofInflationImpactpolledmorethan29,000Internetrespondentsin58countriestounderstandhowrespondentsaroundtheworldofallincomerangeswerecopingwithrisingfoodprices.Thestudyidentifiesthecountries,categoriesandretailchannelsthatweremoreinsulatedtoweatherhardeconomictimesandthosewhichweremorevulnerable.Tacticsandstrategiesarenecessarytoreachconsumersacrosstheworldinthesedemandingandchangingtimes.
3RISING PRICES ARTICLE - IRELAND Copyright © 2013 The Nielsen Company
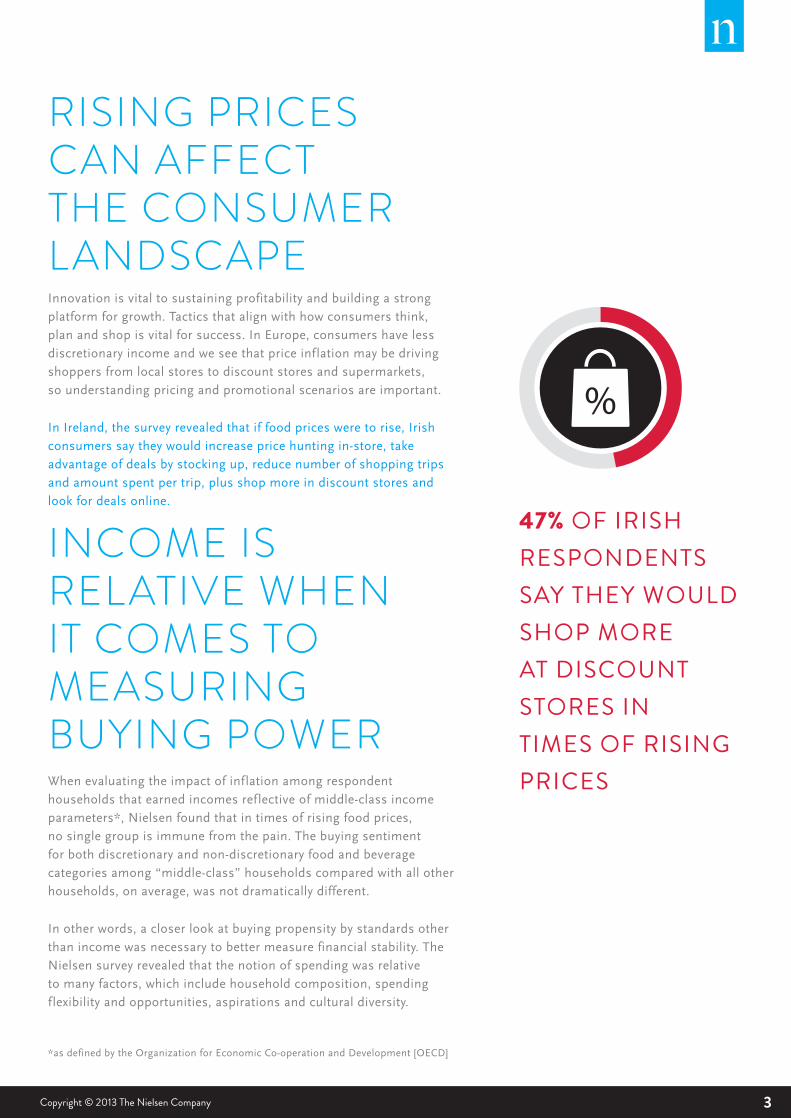
RISING PRICES CAN AFFECT THE CONSUMER LANDSCAPE Innovationisvitaltosustainingprofitabilityandbuildingastrongplatformforgrowth.Tacticsthatalignwithhowconsumersthink,planandshopisvitalforsuccess.InEurope,consumershavelessdiscretionaryincomeandweseethatpriceinflationmaybedrivingshoppersfromlocalstorestodiscountstoresandsupermarkets,sounderstandingpricingandpromotionalscenariosareimportant.
InIreland,thesurveyrevealedthatiffoodpricesweretorise,Irishconsumerssaytheywouldincreasepricehuntingin-store,takeadvantageofdealsbystockingup,reducenumberofshoppingtripsandamountspentpertrip,plusshopmoreindiscountstoresandlookfordealsonline.
INCOME IS RELATIVE WHEN IT COMES TO MEASURING BUYING POWERWhenevaluatingtheimpactofinflationamongrespondenthouseholdsthatearnedincomesreflectiveofmiddle-classincomeparameters*,Nielsenfoundthatintimesofrisingfoodprices,nosinglegroupisimmunefromthepain.Thebuyingsentimentforbothdiscretionaryandnon-discretionaryfoodandbeveragecategoriesamong“middle-class”householdscomparedwithallotherhouseholds,onaverage,wasnotdramaticallydifferent.
Inotherwords,acloserlookatbuyingpropensitybystandardsotherthanincomewasnecessarytobettermeasurefinancialstability.TheNielsensurveyrevealedthatthenotionofspendingwasrelativetomanyfactors,whichincludehouseholdcomposition,spendingflexibilityandopportunities,aspirationsandculturaldiversity.
47% OF IRISH RESPONDENTS SAY THEY WOULD SHOP MORE AT DISCOUNT STORES IN TIMES OF RISING PRICES
*asdefinedbytheOrganizationforEconomicCo-operationandDevelopment[OECD]
4 RISING PRICES ARTICLE - IRELAND
SPENDING FLEXIBILITY IS IMPORTANTAkeymeasureofbuyingpowerisspendingflexibility,ortheelasticityinthehouseholdbudgettoaffordariseinfoodpriceswithouthavingtomakedifficultspendingchoiceselsewhere.Inthesurvey,Nielsensegmentedrespondentsintothreespendingcapacities;
• THOSETHATHADENOUGHMONEYTOSPENDFREELY
• LIVECOMFORTABLY
• ORJUSTHADENOUGHMONEYFORSHELTER,FOODAND BASICS
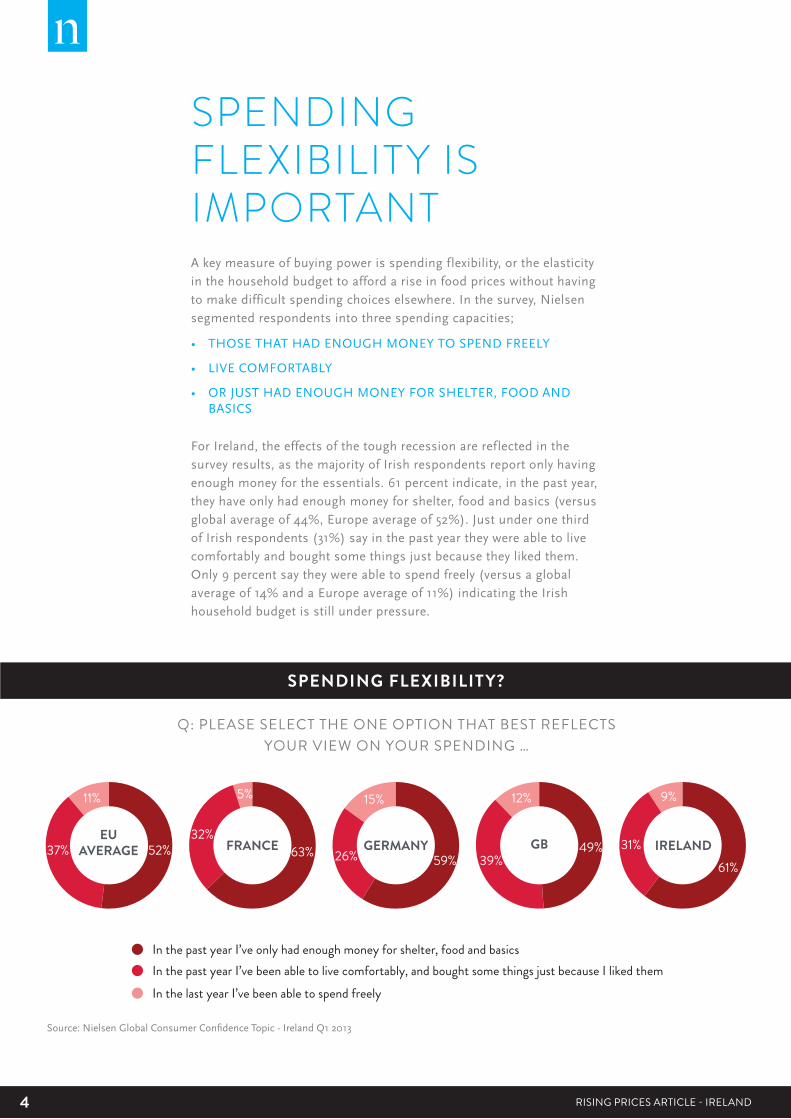
ForIreland,theeffectsofthetoughrecessionarereflectedinthesurveyresults,asthemajorityofIrishrespondentsreportonlyhavingenoughmoneyfortheessentials.61percentindicate,inthepastyear,theyhaveonlyhadenoughmoneyforshelter,foodandbasics(versusglobalaverageof44%,Europeaverageof52%).JustunderonethirdofIrishrespondents(31%)sayinthepastyeartheywereabletolivecomfortablyandboughtsomethingsjustbecausetheylikedthem.Only9percentsaytheywereabletospendfreely(versusaglobalaverageof14%andaEuropeaverageof11%)indicatingtheIrishhouseholdbudgetisstillunderpressure.
SPENDING FLEXIBILITY?
Q: PLEASE SELECT THE ONE OPTION THAT BEST REFLECTS YOUR VIEW ON YOUR SPENDING …
FRANCE GERMANY IRELANDGBEU
AVERAGE 52% 63% 49%61%59%
37%32%
26% 39%31%
11% 5% 15% 12% 9%
In the past year I’ve only had enough money for shelter, food and basicsIn the past year I’ve been able to live comfortably, and bought some things just because I liked themIn the last year I’ve been able to spend freely
Source:NielsenGlobalConsumerConfidenceTopic-IrelandQ12013

5RISING PRICES ARTICLE - IRELAND Copyright © 2013 The Nielsen Company
ELASTICITY IN THE HOUSEHOLD BUDGET9ofthetop10globalcountriesintheNielsensurveywiththeleastspendingflexibilityactuallyhailedfromEurope,reflectingtherecentEUtroubles.Morethanthree-quartersofrespondents‘notabletoaffordariseinprices’werefromGreece(87%),Croatia(82%),Romania(81%),Hungary(77%),Ukraine(77%)andBulgaria(77%)whiletwothirdsofIrishrespondents(66%)indicatetheycannotaffordariseinfoodpriceswithoutmakingdifficultchoiceselsewhere(ranking18outof58countriessurveyed).
FLEXIBILITY IN THE BUDGET?
Q: IS THERE ENOUGH FLEXIBILITY IN YOUR HOUSEHOLD BUDGET TO AFFORD A RISE IN FOOD PRICES WITHOUT MAKING DIFFICULT
SPENDING CHOICES ELSEWHERE?
FRANCE
GERMANY
GB
EU AVERAGE
66%
34%
YES NO
Source:NielsenGlobalConsumerConfidenceTopic-IrelandQ12013
35%
65%
24%
76%
43%
57%
44%
56%
IRELAND

6 RISING PRICES ARTICLE - IRELAND
HOW DOES RISING FOOD PRICES AFFECT THE SHOPPING BASKET?Whenitcomestorisingfoodprices,nearlyeveryonefeelsthepain;85percentofallglobalrespondentssaythathighercostsimpacttheirchoiceofgroceryproducts.Groceryproductsarenottheonlyareasofspendingaffected.ThetopwaysthatIrishrespondentswouldchangespendinghabitsbecauseofincreasedfoodpricesincludesnackingfood(59%),newclothesandaccessories(59%),diningout(57%),beveragesathome(42%),travel/vacation(33%),payingforrecreationandentertainment(32%).
CUTTING TACTICS IF FOOD PRICES RISE
Q: IF FOOD PRICES RISE, PLEASE IDENTIFY THE TOP 5 AREAS WHERE YOU WOULD CHANGE YOUR SPENDING … - IRELAND RESULTS
Source:NielsenGlobalConsumerConfidenceTopic-IrelandQ12013
BEVERAGES AT HOME
TRAVEL/VACATION
DINING OUT (RESTAURANTS, PUBS, ETC.)
SNACKING FOOD
NEW CLOTHES AND ACCESSORIES FOR SELF
RECREATION AND ENTERTAINMENT ( CONCERTS, MOVIES, SPORTS, ETC.)
COMMUNICATIONS SERVICES (MOBILE PHONE,LANDLINE, INTERNET, CABLE TV, ETC.)
HOME IMPROVEMENT AND DECORATING
MAIN MEAL FOOD AT HOME
SAVINGS/INVESTMENTS
COSMETICS AND TOILETRIES
ELECTRONICS/APPLIANCES
HOUSING (RENT, MORTGAGE, UTILITIES, ETC.)
ROUTINE TRANSPORTATION (CAR, GAS, COMMUTING, NON-VACATION, ETC.)
PAY DOWN DEBT
MEDICAL (DOCTOR/DENTIST VISITS, MEDICINES, VITAMINS)
NEW CLOTHES AND ACCESSORIES FOR CHILDREN
OTHER
EDUCATION
CHILD CARE
59%59%
57%42%
33%32%
28%25%
23%23%
22%21%
20%14%13%
10%
5%4%
2%
9%
7RISING PRICES ARTICLE - IRELAND Copyright © 2013 The Nielsen Company
CUTTING TACTICS IF FOOD PRICES RISE
VULNERABLE CATEGORIES DURING INFLATIONARY TIMESJustasIrishconsumersarenowshoppingaround,theywillalsomaketrade-offs.Formanufacturersandretailersalike,determiningwhichcategorieshavestayingpowerandwhichonesaremorevulnerableiscriticalastoughin-storedecisionsaremade.Whilebuyingmoreofanythingisachallengewhenwalletsaretight,therearecategoriesthatarelikelytobehardesthitwhenitcomestoreactingtorisingfoodprices,andothersthatshowresiliencetoinflation.
Categoriesmostvulnerableduringinflationarytimes,andtheonesthatatleasthalfofIrishrespondentssaytheywouldbuylessfrequentlywere;alcohol,conveniencefood,softdrinksandconfectionery.Threequarterssay,onmakingdecisionsaroundbuyingproductcategories,iffoodpricesincreased,theywouldbelikelytobuylesssweets&chocolate(73%),whiletwothirdsindicatedlesspurchasingoncrisps/snackfoods(67%),food-on-the-go(62%),andforalcoholandcarbonateddrinks,58%and57%respectively.
RESILIENT CATEGORIES DURING INFLATIONARY TIMESThemoreresilientcategoriesforIreland,wheremorethanhalfofrespondentshadnoplanstochangetheirshoppingroutine,wereforthestaplecategorieslike;dairyproducts(78%),freshfruit&veg(64%),meatandpoultry(67%),breadandbakerygoods(68%),packagedfoods(68%)andfishandseafood(58%).

8 RISING PRICES ARTICLE - IRELAND
Source:NielsenGlobalConsumerConfidenceTopic-IrelandQ12013
Howeverinterestingly,12percentofrespondentsalsoindicatetheywouldbuymorefreshorfrozenfruitsandvegetablesiffoodpricesincreased.Pluscannedfruitsandvegetablesandpackagedfoods(egcoffee,pastaetc)werealsostock-upessentialsamong7percentand8percentofallrespondents,respectively.
CATEGORY DECISIONS
Q: IF FOOD PRICES INCREASE, WHAT CHANGES WILL YOU MAKE WHEN BUYING THE FOLLOWING PRODUCT CATEGORIES?
ALC
OH
OLI
C B
EVER
AGES
BOTT
LED
WAT
ER
BREA
D &
BAK
ERY
CAN
NED
FRU
ITS
& VE
G
CAR
BON
ATED
BEV
ERAG
ES
CO
NVE
NIE
NC
E/PR
EPAR
ED F
OO
DS
CRI
SPS
& O
THER
SN
ACK
FOO
DS
FISH
& S
EAFO
OD
FOO
D O
N TH
E G
O
FRES
H O
R FR
OZE
N F
RUIT
S &
VEG
MEA
T & P
OU
LTRY
ORG
ANIC
PRO
DU
CTS
PAC
KED
CER
EAL
PRO
DU
CTS
(B
REAK
FAST
CER
EALS
)
PAC
KAG
ED F
OO
DS
(CO
FFEE
, PAS
TA, E
TC.)
PREP
ARED
MEA
LS
SWEE
TS &
CH
OC
OLA
TE
DAI
RY (M
ILK,
CH
EESE
, YO
GH
URT
, ETC
.)
NOT APPLICABLE BUY LESS BUY SAME BUY MORE
9
55 73
1618
6865
28
6764
62
28
16
5878
22
675157
31
262119
58
2031
45
14
4868
16
2625
199
17
2519198
50
162226
22
258555123642427433

9RISING PRICES ARTICLE - IRELAND Copyright © 2013 The Nielsen Company
SO ARE GROCERY PRICES INCREASING IN IRELAND? Inlookingatthetopselling20categoriesinIreland(alcoholandtobaccoexcluded)inlatestNielsenretailsalesdata,itappearsoverthelong-termandshort-termthisisthecase;
Onthelatest12weeks,stapleslikebreakfastcereals,packagedbreadandmilkpricesareuphigherthantheoverallaverage(+6.5%,+3.9%and+5.0%respectively),whilepre-packedbaconandtakehomeice-creamaretheonlycategoriesintheTop20whichhavenotseentheaveragepriceincreaseoverthesetimeperiods.₂
LATEST 4 WEEKS PRICES UP
LATEST 12 WEEKS PRICES UP
LATEST 52 WEEKS PRICES UP
+1.9% +2.5% +2.5%WITH 15 OF THE 20
CATEGORIES RECORDING A PRICE INCREASE
WITH 16 OF THE 20 CATEGORIES RECORDING A
PRICE INCREASE
WITH 17 OF THE 20 CATEGORIES RECORDING
PRICE INCREASE
Source:NielsenScantrackdata,w/e8thSeptember2013
CATEGORY DECISIONS

10 RISING PRICES ARTICLE - IRELAND
LATEST 4 WKS LATEST 12 WKS LATEST 52 WKS
Source:NielsenIrelandScantrackdata,w/e8thSept2013
PRICE FLUCTUATIONS
BABYMILKS / MEALS AND RUSKS BISCUITS CRACKERS CRISPBREAD
BREAKFAST CEREALS CARBONATED DRINKS
CELLOPHANE BAGS COUNTLINES
CRISPS ENERGY DRINKS
FRUIT JUICES 500ML + MARGARINE
MILK MINERAL WATER
PACKAGED BREAD PREPACKED BACON
PREPACKED SAUSAGES PREPACKED SLICED MEAT
SNACKS TAKE HOME ICE CREAM
TOILET TISSUE YOGURT & YOGURT DRINKS
TOTAL TOP 20 CATEGORIES
8.7%
5.2%
3.9%
3.4%
7.4%
4.1%
4.3%
5.9%
3.4%4.3%
6.8%
6.8%6.3%
3.9%3.1%
5.0%1.8%
5.3%6.7%
3.1%6.2%
4.3%3.9%
6.5%7.7%
3.5%
11.2% 5.2%
2.7%
2.9%
5.5%
-8.4%-4.1%
5.5%2.9%
2.1%
3.7%
1.9%2.5%2.8%
1.4%
-2.3%
-5.1%-3.9%
4.3%5.2%
1.0%
0.1%
0.6%
0.6%
0.6%
0.1%0.4%
0.2%
0.0%-0.7%
-0.2%
-0.6%
-1.1%
-0.5%
-0.6%
8.3% 4.6%

11RISING PRICES ARTICLE - IRELAND Copyright © 2013 The Nielsen Company
RETAILERS POISED FOR SUCCESS – BEST BET RETAILERS Withfinancesunderpressureandlessdiscretionarymoneytospend,consumerscontinuallylookforwaystostretchtheirbudgetsandfindthebestvalueforthemoney.Retailerspoisedforsuccessduringinflationarytimesarethosewithcompetitivepricesoftendifficulttobeat.
ManyIrishrespondentsindicatetheywillcontinuetoshopatSupermarketsandPharmacy,with35percentindicatingtheywouldincreaseshoppingfrequencyatSupermarkets.However,ahigh47percentofIrishrespondentssaytheywouldshopmoreatDiscountstoresintimesofrisingprices.IrelandcurrentlyseesstrongandcontinuousadvertisingbythemainDiscounters,whichwillonlyhelpincreaseawarenessoftheseretailersandtheirkeenlypricedoffers.
IRELAND RANKS THIRD HIGHEST GLOBALLY INSAYING THEY WOULD SHOP MORE AT DISCOUNT STORES, ONLY BEHIND SINGAPORE (48%) AND SOUTH KOREA (47%).
Q: IF FOOD PRICES INCREASE WHAT CHANGES WILL YOU MAKE IN WHERE YOU PURCHASE FOOD PRODUCTS? – IRELAND RESULTS
STORE SWITCHING IF FOOD PRICES INCREASE
NOT APPLICABLE
SHOP LESS
SUPERMARKETS CONVENIENCESTORES
DISCOUNTSTORES
PHARMACY LOCALNEIGHBOURHOOD
STORES
SHOP SAME
SHOP MORE
35%
50%
29%
30%
60%33%
48%23%9%
55%
14% 10% 14% 12% 8%
47%
12%5%5%
Source:NielsenGlobalConsumerConfidenceTopic-IrelandQ12013

12 RISING PRICES ARTICLE - IRELAND
Conversely,retailerformatsmostvulnerableduringinflationarytimesincludeconveniencestoresandspecialityretailers.55percentand48percentofallIrishrespondents,respectively,saytheywouldshopattheseretailerslessoften.Irelandresultsonthesescoresshowvulnerabilityversusalotofothercountries(versus40%and27%globalaverages).Channelswitchingfromconvenienceandlocalshopstolow-priceoutlets/supermarketsisevident,somessagingfortheseretailersthatfocusesontrust,differentiationandgoodvalueisimportant.
BRANDS VERSUS PRIVATE LABEL IN INFLATIONARY TIMESSomegoodnewsisthatthemajorityofIrishrespondentsreportbeingwillingtotrynewbrands.Whenasked‘thinkingaboutfoodbrandstobuyoverthenextyear’,56percentindicatetheywouldexperimentwithnewbrands.Notably,Irelandranks5thhighestgloballyonthisscore,behindBrazil(64%),Greece(61%),Philippines(60%)andSouthAfrica(57%).ThisindicatesopportunityfornewareasofgrowthandinnovativeNPDfrombrands.
INDICATE WILLINESS TO EXPERIMENT WITH NEW BRANDS
56%Q. THINKING ABOUT THE FOOD BRANDS YOU BUY OVER THE NEXT YEAR ‘I EXPECT TO‘… IRELAND
STRONG BRAND MESSAGES AND NPD IMPORTANT
63% LIKE WHEN MANUFACTURERS OFFER NEW PRODUCTS
60% WAIT UNTIL A NEW INNOVATION IS PROVEN
60% BUY NEW PRODUCTS FROM FAMILIAR BRANDS
59% LIKE TO TELL OTHERS ABOUT NEW PRODUCTS
CONSUMERS WILL RESPOND TO STRONG NPD ADVERTISING / PROMOTIONS
Source:NielsenGlobalConsumerConfidenceTopic-IrelandQ12013
Source:NielsenGlobalConsumerConfidenceNewProducts-IrelandQ32012
13RISING PRICES ARTICLE - IRELAND Copyright © 2013 The Nielsen Company
SAYING THEY WOULD BUY MORE PRIVATE LABEL IF FOOD PRICES INCREASED, COMPARED WITH ONLY 11 PERCENT SAYING THEY WOULD BUY MORE NATIONAL BRANDS.
47%
Howeverontheflipside,asshoppersincreasinglylookforvalue,private-labelbrandshaveapotentialadvantageasshoppersbecomemorediscerningandlower-pricedalternativesproliferate.Inregionswhereprivatelabeliswellestablished,theNielsensurveyresultsshowedthepotentialpowerofprivatelabelbrandsduringinflationarytimes.
IndevelopedEuropeancountries,35percentwouldshopmoreforprivate-labelbrands,comparedwithonly8percentsayingthattheywouldbuymorenationalbrands.ForIrelandthatnumberwashigherat47percentsayingtheywouldbuymoreprivatelabeliffoodpricesincreased,comparedwithonly11percentsayingtheywouldbuymorenationalbrands.

14 RISING PRICES ARTICLE - IRELAND
Source: Nielsen Global Consumer Confidence Topic - Ireland Q1 2013
BRANDS VS. PRIVATE LABEL
Q: IF FOOD PRICES INCREASE, WHAT CHANGES WILL YOU MAKE IN THE TYPE OF FOOD PRODUCTS YOU PURCHASE? – IRELAND RESULTS
BRANDS PRIVATELABEL
NOT APPLICABLE SHOP LESS SHOP SAME SHOP MORE
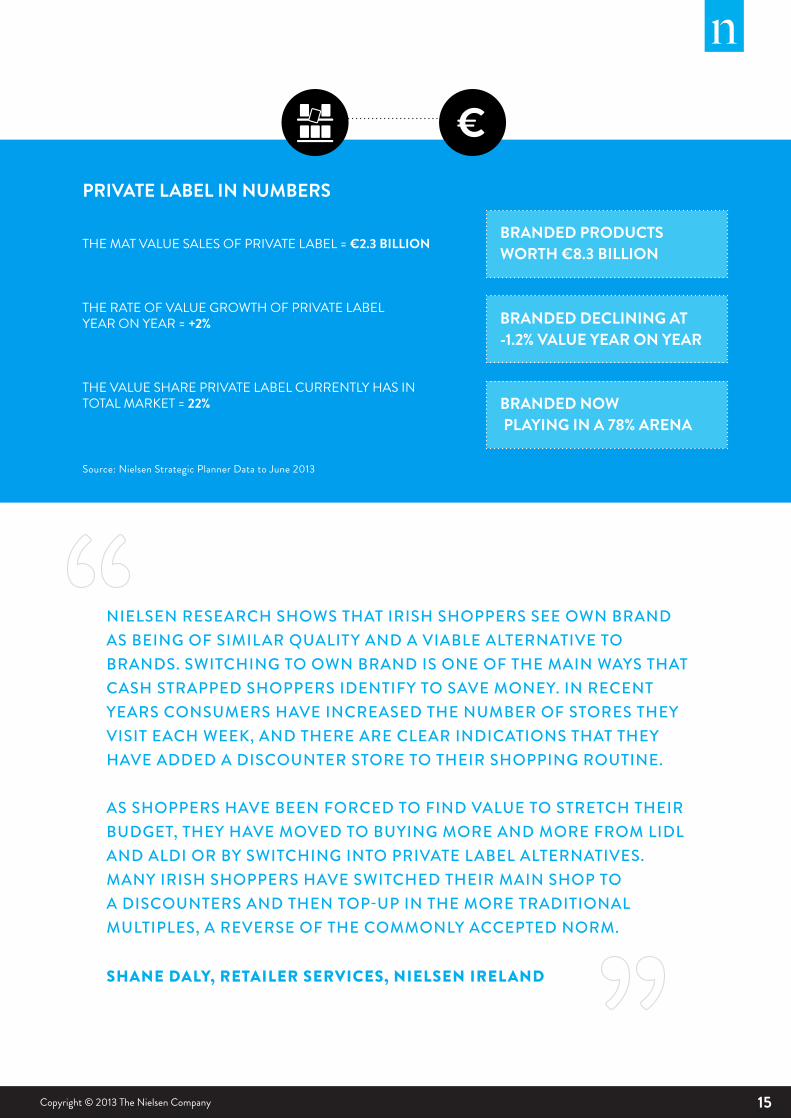
TodayinIreland,private-labelproductsaccountforroughly22percentofFMCGsales(worth€2.3billion),accordingtoNielsen’slatestfigures₁.Conditionsremaingoodforprivatelabelgrowth,andprivate-labelbrandshavebeenshoutingloudwithstrongadvertising.Thepricemustberightandmarketingmustbeeffectiveforprivate-labelbrandstobesuccessful.Packagingimpactstrustandqualityperceptionsespeciallywhenprivatelabelsextendbeyondcommodityorlow-riskproductcategories.
SalesofprivatelabelinIrelandarereapingrewards,reportingyearonyeargrowthof+2%(value)latestyeartoJune2013,(versus-0.8%forBranded),accordingtolatestNielsendata₁.
5%46%39%11%
6%13%
35%47%
15RISING PRICES ARTICLE - IRELAND Copyright © 2013 The Nielsen Company
THE MAT VALUE SALES OF PRIVATE LABEL = €2.3 BILLION
THE RATE OF VALUE GROWTH OF PRIVATE LABELYEAR ON YEAR = +2%
THE VALUE SHARE PRIVATE LABEL CURRENTLY HAS IN TOTAL MARKET = 22%
Source: Nielsen Strategic Planner Data to June 2013
NIELSEN RESEARCH SHOWS THAT IRISH SHOPPERS SEE OWN BRAND AS BEING OF SIMILAR QUALITY AND A VIABLE ALTERNATIVE TO BRANDS. SWITCHING TO OWN BRAND IS ONE OF THE MAIN WAYS THAT CASH STRAPPED SHOPPERS IDENTIFY TO SAVE MONEY. IN RECENT YEARS CONSUMERS HAVE INCREASED THE NUMBER OF STORES THEY VISIT EACH WEEK, AND THERE ARE CLEAR INDICATIONS THAT THEY HAVE ADDED A DISCOUNTER STORE TO THEIR SHOPPING ROUTINE.
AS SHOPPERS HAVE BEEN FORCED TO FIND VALUE TO STRETCH THEIR BUDGET, THEY HAVE MOVED TO BUYING MORE AND MORE FROM LIDL AND ALDI OR BY SWITCHING INTO PRIVATE LABEL ALTERNATIVES. MANY IRISH SHOPPERS HAVE SWITCHED THEIR MAIN SHOP TO A DISCOUNTERS AND THEN TOP-UP IN THE MORE TRADITIONAL MULTIPLES, A REVERSE OF THE COMMONLY ACCEPTED NORM.
SHANE DALY, RETAILER SERVICES, NIELSEN IRELAND
BRANDED PRODUCTSWORTH €8.3 BILLION
BRANDED DECLINING AT -1.2% VALUE YEAR ON YEAR
BRANDED NOW PLAYING IN A 78% ARENA
PRIVATE LABEL IN NUMBERS

16 RISING PRICES ARTICLE - IRELAND
TACTICS TO DEPLOY AND MARKETING LEVERS TO PULLCertainstrategyresponsesfromconsumersresonatewithstrongconsistencyaroundtheworld,suchastheincreasedpropensitytopurchaseonlysale-priceditems(42percentforIreland).61percentofIrishrespondentsalsosaytheywouldstockuponregular-useitemswhentheywereonsale(comparedwith41percentglobalaverageand48percentEuropeaverage).Purchasinglargerpacksizeswasastrategyfavouredamong40percentofIrishrespondents(againtrendinghigherthaneitherglobalorEuropeanaverages(28%and29%respectively).
Notably,thespeedandefficiencyofonlinemethodsprovedtobetheplatformofchoiceforsavingmoneyamongtwo-fifths(41%)ofIrishrespondents,whileoveronequarter(28%)usesocialmediatofindspecials.Withtheriseinsmartphoneownershipandmobileusage,lookingfordealsonlineisonlylikelytoincreaseinthesearchformoney-savingdeals.
Withconsumerslookingforvalueonline,thisdoesmeanretailershavefeweropportunitiestointeract.Retailersneedtocaptureconsumersthroughvariousmediums,notjustin-store,asmayseethemlessoftenthantheyhavebefore.
Onthoseshoppingstrategieslikelytodecrease;67percentsaytheywillcutdownonamountspentpertripwhile57percentindicatetheywoulddecreasetripstothestore.
Whilethestrategicresponsetoconsumerbuyingbehaviormaybeconsistentacrossregions,market-by-markettacticalvariationsareessential.Knowinghowtoscalegoodsandservicesacrosstheworldcanbechallengingwhenconsumerdiversitymustfactorintothemarketingmix.Understandingbrandpositionwithinthecategorydemandlandscapeallowsforatailoredfoodinflationresponsethatwillprotectthemostprofitableshopperswithoptimumefficiency.
Q: IF FOOD PRICES INCREASE, WHAT CHANGES WILL YOU MAKE WITH THE FOLLOWING ACTIONS?
SHOPPER SAVING TACTICS IF PRICES RISE
WILL DECREASE SPEND PER TRIP
WILL DECREASE TRIPS TO THE SHOP
WILL PURCHASE ONLY SALE ITEMS
WILL LOOK FOR DEALS ONLINE
WILL PURCHASE LARGER PACKS
WILL USE SOCIAL MEDIA TO FIND DEALS
WILL SHOP MORE ONLINE
67%
57%
42%
41%
40%
28%
20%

RISING PRICES ARTICLE - IRELAND
ABOUT NIELSEN
NielsenHoldingsN.V.(NYSE:NLSN)isaglobalinformationand
measurementcompanywithleadingmarketpositionsinmarketing
andconsumerinformation,televisionandothermediameasurement,
onlineintelligenceandmobilemeasurement.Nielsenhasapresence
inapproximately100countries,withheadquartersinNewYork,USA
andDiemen,theNetherlands.
Formoreinformation,visitwww.nielsen.com.
Copyright©2013TheNielsenCompany.Allrightsreserved.Nielsen
andtheNielsenlogoaretrademarksorregisteredtrademarksof
CZT/ACNTrademarks,L.L.C.Otherproductandservicenamesare
trademarksorregisteredtrademarksoftheirrespectivecompanies.
13/7004
ABOUT THE GLOBAL SURVEY METHODOLOGY
Thefindingsinthissurveyarebasedonrespondentswithonline
accessacross58countries.Whileanonlinesurveymethodologyallows
fortremendousscaleandglobalreach,itprovidesaperspectiveonly
onthehabitsofexistingInternetusers,nottotalpopulations.In
developingmarketswhereonlinepenetrationhasnotreachedmajority
potential,audiencesmaybeyoungerandmoreaffluentthanthegeneral
populationofthatcountry.Additionally,surveyresponsesarebasedon
claimedbehavior,ratherthanactualmetereddata.
ABOUT THE NIELSEN GLOBAL SURVEY
TheNielsenGlobalSurveyofInflationImpactwasconducted
betweenFebruary18andMarch8,2013,andpolledmorethan29,000
consumersin58countriesthroughoutAsia-Pacific,Europe,Latin
America,theMiddleEast,AfricaandNorthAmerica.Thesamplehas
quotasbasedonageandsexforeachcountrybasedontheirInternet
users,andisweightedtoberepresentativeofInternetconsumers
andhasamaximummarginoferrorof±0.6%.ThisNielsensurveyis
basedonthebehaviorofrespondentswithonlineaccessonly.Internet
penetrationratesvarybycountry.Nielsenusesaminimumreporting
standardof60percentInternetpenetrationor10Monlinepopulation
forsurveyinclusion.TheNielsenGlobalSurvey,whichincludesthe
GlobalConsumerConfidenceSurvey,wasestablishedin2005.
