the model developed fits the data observed, model assumptions are ... · ... (or hat matrix...
TRANSCRIPT
G-94
y i ' $0 % $1 x1, i % ... %$k xk, i
e i ' yi & yi
h i ' xi X'X &1 x i'
x ( j )
ri 'e i
F ( i ) 1 & h i
D i 'e ( i )
F h i
DFFITS i 'e ( i )
F( i ) h i
Ci 'det F2
( i ) ( X '( i ) X ( i ) )-1
det F2 (X'X)&1
DFBETAi, j '$j & $j ( i )
Fi ( X ' X )-jj
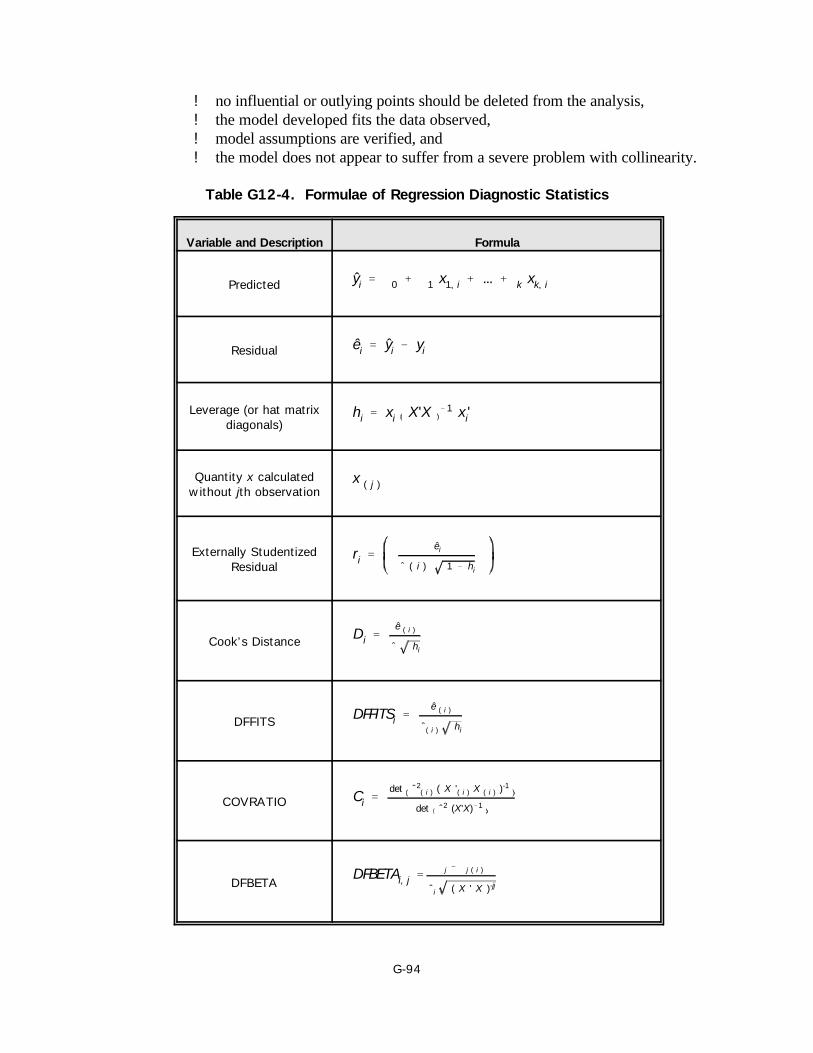
! no influential or outlying points should be deleted from the analysis,! the model developed fits the data observed,! model assumptions are verified, and! the model does not appear to suffer from a severe problem with collinearity.
Table G12-4. Formulae of Regression Diagnostic Statistics
Variable and Description Formula
Predicted
Residual
Leverage (or hat matrixdiagonals)
Quantity x calculatedwithout jth observation
Externally StudentizedResidual
Cook’s Distance
DFFITS
COVRATIO
DFBETA
G-95
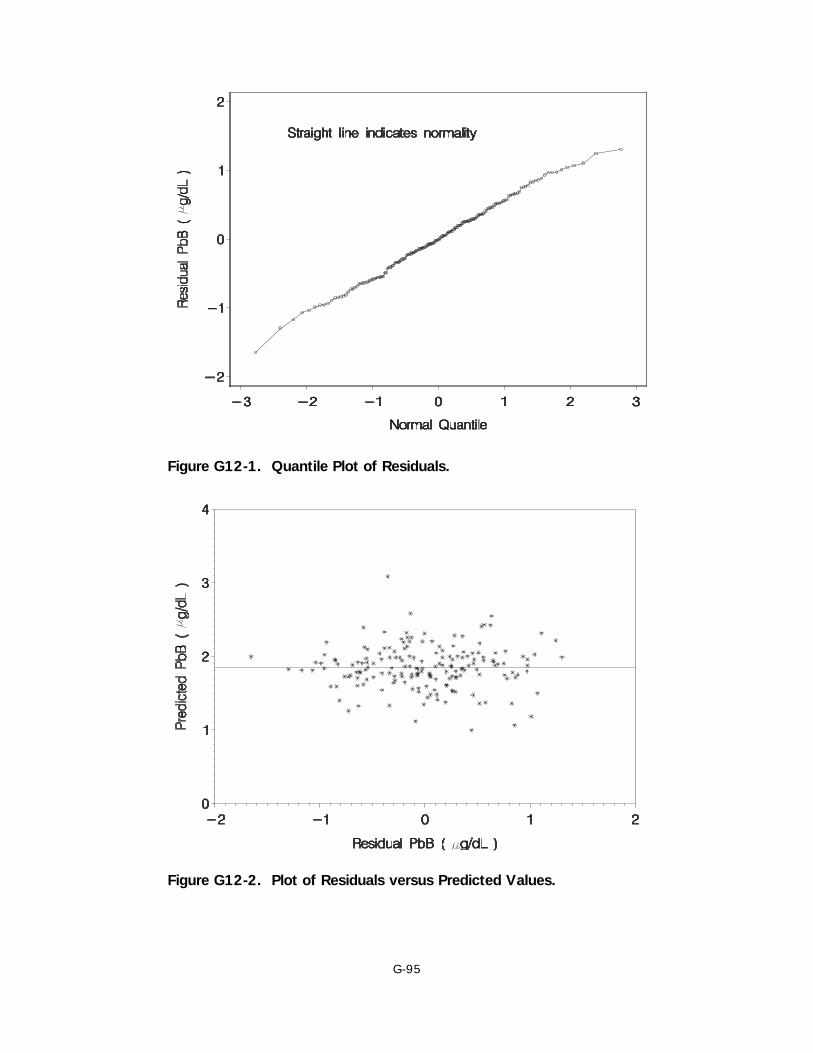
Figure G12-1. Quantile Plot of Residuals.
Figure G12-2. Plot of Residuals versus Predicted Values.

G-96
Figure G12-3. Plots of Residuals versus Predictors.
G-97
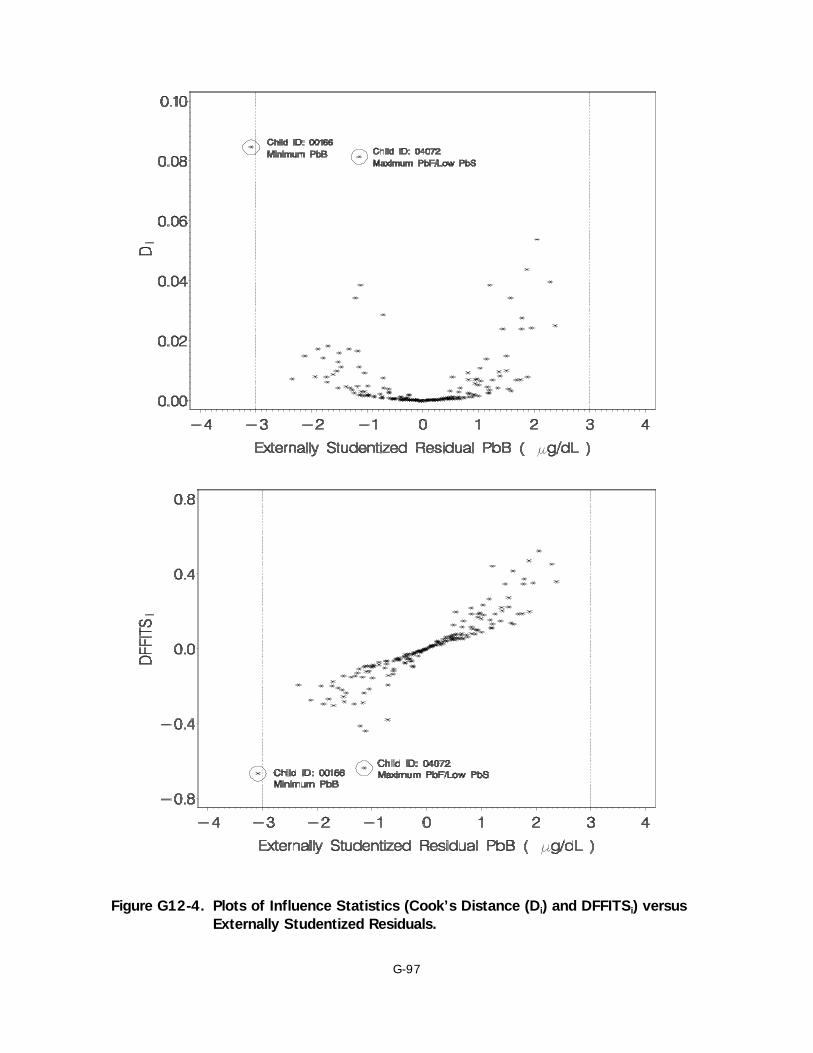
Figure G12-4. Plots of Influence Statistics (Cook’s Distance (Di) and DFFITSi) versusExternally Studentized Residuals.

G-98
Figure G12-5. Plot of Changes in Parameter Estimates Relative to Standard Error forIntercept and Coefficients of PbS, PbW, PbF and PbP.

G-99
Figure G12-6. Partial Leverage Regression Plots.

G-100
Figure G12-7. Plots of One Predictor Variable versus Another Predictor Variable Coded forValues of Paint/Pica Hazard Variable.

G-101
G13: Appendix on Parameter Estimates for CandidateMultimedia Exposure Models
G-102
Parameter Estimates for Candidate Multimedia Exposure Models
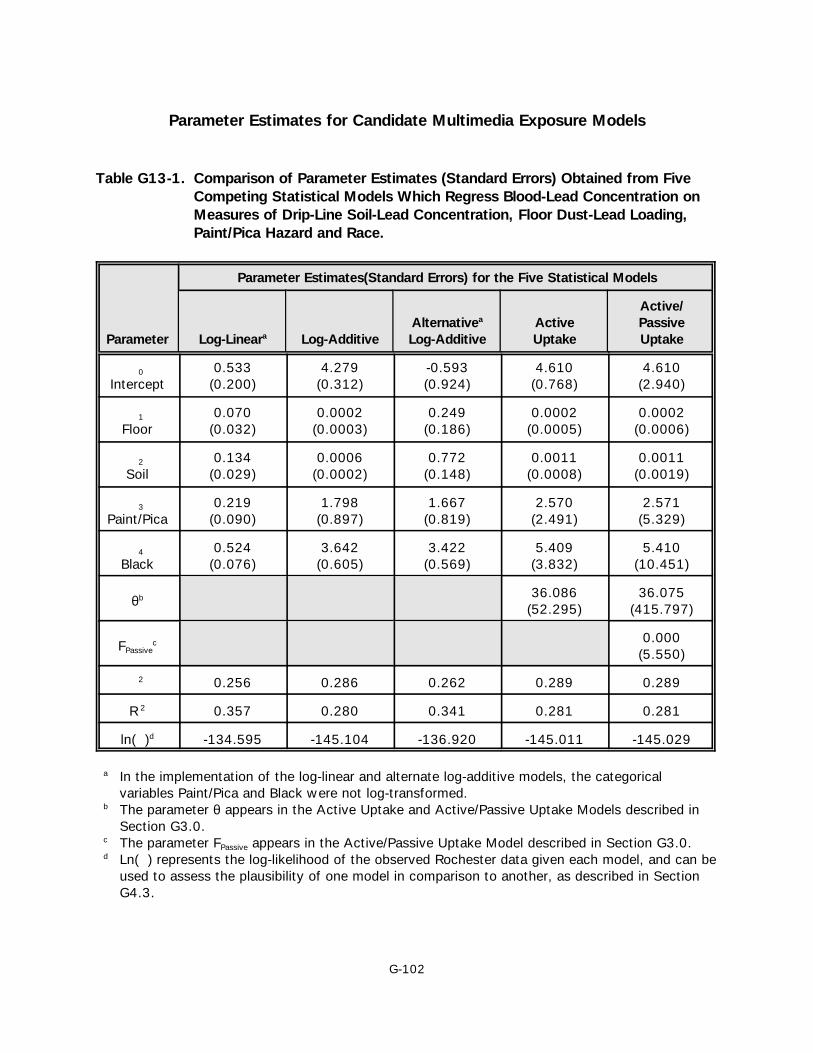
Table G13-1. Comparison of Parameter Estimates (Standard Errors) Obtained from FiveCompeting Statistical Models Which Regress Blood-Lead Concentration onMeasures of Drip-Line Soil-Lead Concentration, Floor Dust-Lead Loading,Paint/Pica Hazard and Race.
Parameter
Parameter Estimates(Standard Errors) for the Five Statistical Models
Log-Lineara Log-AdditiveAlternativea
Log-AdditiveActiveUptake
Active/PassiveUptake
$0
Intercept0.533
(0.200)4.279
(0.312)-0.593(0.924)
4.610(0.768)
4.610(2.940)
$1
Floor0.070
(0.032)0.0002
(0.0003)0.249
(0.186)0.0002
(0.0005)0.0002
(0.0006)
$2
Soil0.134
(0.029)0.0006
(0.0002)0.772
(0.148)0.0011
(0.0008)0.0011
(0.0019)
$3
Paint/Pica0.219
(0.090)1.798
(0.897)1.667
(0.819)2.570
(2.491)2.571
(5.329)
$4
Black0.524
(0.076)3.642
(0.605)3.422
(0.569)5.409
(3.832)5.410
(10.451)
2b 36.086(52.295)
36.075(415.797)
FPassivec 0.000
(5.550)
F2 0.256 0.286 0.262 0.289 0.289
R 2 0.357 0.280 0.341 0.281 0.281
ln(7)d -134.595 -145.104 -136.920 -145.011 -145.029
a In the implementation of the log-linear and alternate log-additive models, the categoricalvariables Paint/Pica and Black were not log-transformed.
b The parameter 2 appears in the Active Uptake and Active/Passive Uptake Models described inSection G3.0.
c The parameter FPassive appears in the Active/Passive Uptake Model described in Section G3.0. d Ln(7) represents the log-likelihood of the observed Rochester data given each model, and can be
used to assess the plausibility of one model in comparison to another, as described in SectionG4.3.

G-103
Table G13-2. Comparison of Parameter Estimates (Standard Errors) Obtained from FiveCompeting Statistical Models Which Regress Blood-Lead Concentration onMeasures of Drip-Line Soil-Lead Concentration, Floor Dust-Lead Loading, andPaint/Pica Hazard.
Parameter
Parameter Estimates(Standard Errors) for the Five Statistical Models
Log-Lineara Log-AdditiveAlternativea
Log-AdditiveActiveUptake
Active/PassiveUptake
$0
Intercept0.608
(0.224)5.221
(0.361)-0.494(1.079)
6.424(1.323)
6.424(1.763)
$1
Floor0.089
(0.036)0.00001(0.0004)
0.474(0.242)
0.00006(0.0008)
0.00006(0.0008)
$2
Soil0.146
(0.033)0.0008
(0.0002)0.834
(0.177)0.009
(0.006)0.009
(0.010)
$3
Paint/Pica0.252
(0.101)2.434
(1.075)2.131
(0.985)21.857
(34.860)21.857
(43.079)
2b 11.315(2.760)
11.315(6.623)
FPassivec 0.000
(0.054)
F2 0.321 0.354 0.324 0.340 0.340
R 2 0.189 0.105 0.182 0.149 0.149
ln(7)d -156.216 -165.340 -156.979 -160.687 -160.702
a In the implementation of the log-linear and alternate log-additive models, the categorical variablePaint/Pica was not log-transformed.
b The parameter 2 appears in the Active Uptake and Active/Passive Uptake Models described inSection G3.0.
c The parameter FPassive appears in the Active/Passive Uptake Model described in Section G3.0. d Ln(7) represents the log-likelihood of the observed Rochester data given each model, and can be
used to assess the plausibility of one model in comparison to another, as described in SectionG4.3.

G-104
Table G13-3. Comparison of Parameter Estimates (Standard Errors) Obtained from FiveCompeting Statistical Models Which Regress Blood-Lead Concentration onMeasures of Drip-Line Soil-Lead Concentration, Floor Dust-Lead Loading,Window Sill Dust-Lead Loading, Paint/Pica Hazard and Race.
Parameter
Parameter Estimates(Standard Errors) for the Five Statistical Models
Log-Lineara Log-AdditiveAlternativea
Log-AdditiveActiveUptake
Active/PassiveUptake
$0
Intercept0.399
(0.216)4.083
(0.308)-0.658(0.952)
4.409(0.559)
4.409(1.262)
$1
Floor0.058
(0.036)0.00008
(0.00031)0.131
(0.213)0.00002
(0.00047)0.00002
(0.00048)
$2
W. Sill0.065
(0.033)0.00097
(0.00037)0.280
(0.191)0.003
(0.002)0.003
(0.004)
$3
Soil0.109
(0.032)0.00042
(0.00018)0.609
(0.169)0.00090
(0.00056)0.00090
(0.00100)
$4
Paint/Pica0.209
(0.090)1.688
(0.870)1.604
(0.835)2.741
(2.387)2.741
(3.719)
$5
Black0.514
(0.079)3.567
(0.622)3.483
(0.604)6.413
(3.516)6.412
(7.491)
2b 25.174(17.194)
25.175(76.900)
FPassivec
0.000(0.994)
F2 0.255 0.277 0.265 0.278 0.278
R 2 0.371 0.316 0.346 0.323 0.323
ln(7)d -128.623 -136.253 -132.190 -135.353 -135.375
a In the implementation of the log-linear and alternate log-additive models, the categoricalvariables Paint/Pica and Black were not log-transformed.
b The parameter 2 appears in the Active Uptake and Active/Passive Uptake Models described inSection G3.0.
c The parameter FPassive appears in the Active/Passive Uptake Model described in Section G3.0. d Ln(7) represents the log-likelihood of the observed Rochester data given each model, and can be
used to assess the plausibility of one model in comparison to another, as described in SectionG4.3.
G-105
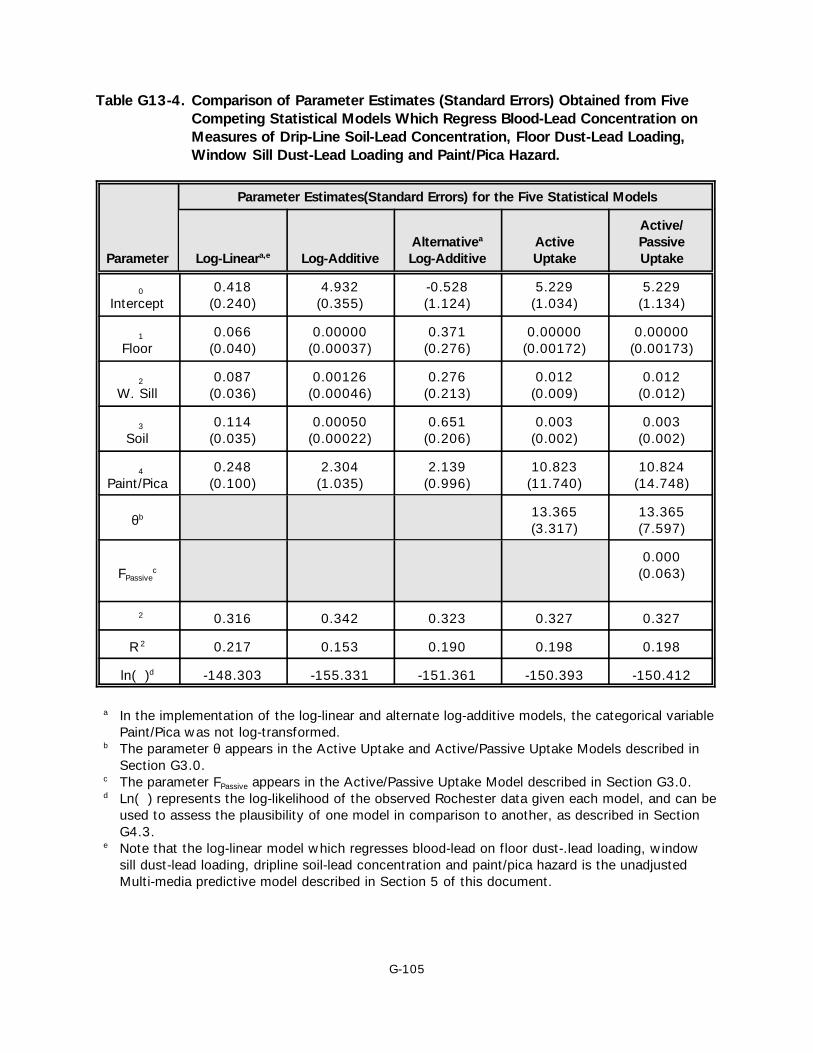
Table G13-4. Comparison of Parameter Estimates (Standard Errors) Obtained from FiveCompeting Statistical Models Which Regress Blood-Lead Concentration onMeasures of Drip-Line Soil-Lead Concentration, Floor Dust-Lead Loading,Window Sill Dust-Lead Loading and Paint/Pica Hazard.
Parameter
Parameter Estimates(Standard Errors) for the Five Statistical Models
Log-Lineara,e Log-AdditiveAlternativea
Log-AdditiveActiveUptake
Active/PassiveUptake
$0
Intercept0.418
(0.240)4.932
(0.355)-0.528(1.124)
5.229(1.034)
5.229(1.134)
$1
Floor0.066
(0.040)0.00000
(0.00037)0.371
(0.276)0.00000
(0.00172)0.00000
(0.00173)
$2
W. Sill0.087
(0.036)0.00126
(0.00046)0.276
(0.213)0.012
(0.009)0.012
(0.012)
$3
Soil0.114
(0.035)0.00050
(0.00022)0.651
(0.206)0.003
(0.002)0.003
(0.002)
$4
Paint/Pica0.248
(0.100)2.304
(1.035)2.139
(0.996)10.823
(11.740)10.824
(14.748)
2b 13.365(3.317)
13.365(7.597)
FPassivec
0.000(0.063)
F2 0.316 0.342 0.323 0.327 0.327
R 2 0.217 0.153 0.190 0.198 0.198
ln(7)d -148.303 -155.331 -151.361 -150.393 -150.412
a In the implementation of the log-linear and alternate log-additive models, the categorical variablePaint/Pica was not log-transformed.
b The parameter 2 appears in the Active Uptake and Active/Passive Uptake Models described inSection G3.0.
c The parameter FPassive appears in the Active/Passive Uptake Model described in Section G3.0. d Ln(7) represents the log-likelihood of the observed Rochester data given each model, and can be
used to assess the plausibility of one model in comparison to another, as described in SectionG4.3.
e Note that the log-linear model which regresses blood-lead on floor dust-.lead loading, windowsill dust-lead loading, dripline soil-lead concentration and paint/pica hazard is the unadjustedMulti-media predictive model described in Section 5 of this document.