the molecular structure of beryllocene, (c5h5)2be a ... · 271 journal of organometallic chemistry,...
TRANSCRIPT

271
Journal of Organometallic Chemistry, 170 (1979) 271-284
0 Elsevier Sequoia S.A., Lausanne - Printed in The Netherlands
THE MOLECULAR STRUCTURE OF BERYLLOCENE, (C5H5)2Be_ A REINVESTIGATION BY GAS PHASE ELECTRON DIFFRACTION
ARNE ALMENNINGEN, ARNE HAALAND *
Department of Chemistry, The Uniuersity of Oslo, Blindern, Oslo 3 (Norway)
and JANUSZ LUSZTYK
Institute for Organic Chemistry and Technology, Warsaw Technical University, Politechnika, 00-662 Warsaw (Poland)
(Received October lOth, 1978)
Summary
The electron scattering pattern of gaseous dicyclopentadienylberyllium, Cp,Be, has been recorded from s = 2.00 to 39.00 X-’ with a nozzle temperature of about 120°C Molecular models of D Sd symmetry or models containing one n-bonded and one o-bonded Cp ring are not compatible with the data. The possibility that gaseous CpzBe consists fo a mixture of DSd and x-Cp, a-Cp conformers is considered and rejected. A model of CSv symmetry can be brought into satisfactory agreement with the data. It is also found that a slip sandwich model obtained from the C,-, model by moving sideways the ring which is at the greatest distance from Be, while keeping the two rings essentially parallel is compatible with the electron diffraction data. The best fit between esperi- mental and calculated intensity curves is obtained with a model with a sideways slip of 0.8(l) ii. This model is similar to that indicated by the X-ray diffraction investigations by Wong and coworkers [4,5]. It is suggested that the potential energy of the molecule does not change much as the magnitude of the slip changes and that the molecule thus undergoes large amplitude vibration.
Introduction
In 1964 Almenningen, Bastiansen and Haaland [l] published the result of a gas phase electron diffraction (GED) investigation of beryllocene, and con- cluded that the molecular symmetry is CSv with two Cp (Cp = cyclopentadienyl) rings of fivefold symmetry lying one on top of the other. The Be atom was situated on the fivefold symmetry axis of the two rings, but closer to one ring thau co the other, see model II in Fig. 1. Two other models that had been suggested at the time, a symmetric sandwich model of DSd or DSh symmetry (I)

272
m L_ SLIP
Fig. 1. Molecular models of CpzBe.
and a model with one n-bonded (7’) and one o-bonded (77’) ring (IV), were implicitly rejected. The Csu model succeeded in reconciling two earlier seemingly contradictory observations, namely (i) that beryllocene crystallizes with the same space group and with very similar unit cell parameters as ferrocene [2] and, unless there is disorder, this requires the space group to possess a molecular center of symmetry, and (ii) that the molecule has a dipole moment of 2.24 + 0.09 Debye in cyclohexane [S].
In 1972 and 1973 Wong and coworkers published the results of X-ray diffrac- tion investigations of beryllocene at -120°C [4] and at room temperature [ 51. The crystals were disordered, but the molecular structure may be described as a, slip sandwich which can be derived from the C5” model by moving Cp’ (the ring which is at the greatest distance from the Be atom) about 1.2 A sideways. The Be atom is then directly below the edge of the ring. The electron density maps indicate that at -120°C the orientation of the Cp rings is such that the Be atom is below a carbon atom (see model III in Fig_ l), whereas at room temperature it appears to be below a C-C bond.
The slip sandwich model was not considered in the 1964 electron diffraction study. Drew and Haaland [6] therefore carried out refinements of the slip sandwich model using the old electron diffraction data. They concluded, wrongly as we shall show below, that the slip sandwich model was incompatible with the ED data. This conclusion received support from an earlier IR investiga- tion [7], which revealed that while the vibrational spectrum of gaseous BeCp, consists of only the few lines expected for a C,, model, the spectrum of the crystalline substance was much more complicated_ It was therefore suggested that intermolecular forces were responsible for the sideways displacement of Cp’ found in the crystal [ 61.
During the last few years molecular orbital calculations on the various models of beryllocene have been carried out within the PRDDO [ 81 and MNDO [ 91 approsimations, and ab initiQ calculations have been carried out with an STO- 3G basis [ lO,ll]. In each set of calculations extensive structure optimization was carried out on each model. All these calculations suggest that a C5, model has considerably higher energy than a symmetric Dsd or D5, model, and that the most stable form of beryllocene would be one containing one r-bonded and one a-bonded ring (model IV), and the validity of .the CsL’ and slip sand- wich models were brought in question.
We therefore decided to carry out ab initio molecular orbital calculations with a double-< basis to see if similar results would be obtained with more
273
accurate calculations. Because of the size of the problem, calculations could be carried out only for a fixed, assumed geometry for each model [12]. The lowest energy (-398.6621 au) was obtained for the ~r-%p, o-Cp model (IV), followed by the Dsd model (I) (+9.2 kcal mol-‘), the slip sandwich model (III) with SZip = 1.2 a, corresponding to the crystal structure at -12O”C, (+12.4 kcal mol-‘) and finally the Cs, model (+16.3 kcal mol-I).
Very recently Demuynck and Rohmer reported the result of ab initio calcu- lations on a small number of fixed geometries with a minimal basis set for the inner shells and a double-r basis set for the valence shell [13]. Their calculations, which should be of an accuracy comparable to ours, yield the lowest energy for the D,, model (-398.637 au), followed by the slip sandwich model with small differences between C-C bonds in the Cp’ ring (+7.5 kcal mol-I), the Cs, model (+10.5 kcal mol-‘), and finally the r-Cp, o-Cp model (+17-O kcal mol-‘). Clearly the energy differences involved are so small that small differ- ences in the bases and/or assumed geometries lead to contradictory results even at the double-c level.
In this present paper we wish to report the result of a reinvestigation of beryllocene by gas phase electron diffraction. In a subsequent paper [12] we deal with the result of our ab initio calculations and the photoelectron spectra recorded by Gleiter and coworkers.
Experimental and calculation procedure
Cp,Be was synthesized from NaCp and BeC12 in diethyl ether [14] and purified by vacuum sublimation_ The purity of the compound was checked by its melting point (59°C) and by its mass spectrum, which containing no peaks corresponding to possible impurities (CpBeCl or solvent). The crystalline, colorless samples were introduced into the Oslo electron diffraction unit [ 151 in closed ampules which were broken after the unit had been evacuated and the nozzle system heated to the appropriate temperature (reservoir, 105 to 110°C; nozzle tip, 120°C). The vapor pressure of Cp,Be has been measured up to 190°C [ 161, so the substance is presumably thermally stable below this tem- perature. Exposures were made with nozzle to plate distances of about 48 and 20 cm. This study is based on the data obtained by photometer analysis of six plates from the first set and four from the second. The optical densities ranged from 0.10 to 0.55, which is in the region of linearity of plate response, and so no blackness correction was carried out. Otherwise the data were prosessed as described by Andersen et al. [ 171.
Each time a new model, or mixture of models, of Cp,Be was considered, a new background was substracted using a program written by Gundersen and Samdal [ 181 modelled on a program described by Hedberg [ 191. In this program the background on the levelled intensity curve is calculated as a poly- nominal of variable. degree. The coefficients are determined by a least-squares procedure using the experimental levelled intensity data and a theoretical inten- sity curve calculated for the model under consideration. After a few trials the degree of the polynominal was selected as equal to five for both 48 and 20 cm data, In the final refinements the degree was increased to eight for the 48 cm data.

274
D b -
w
\ t
F
\
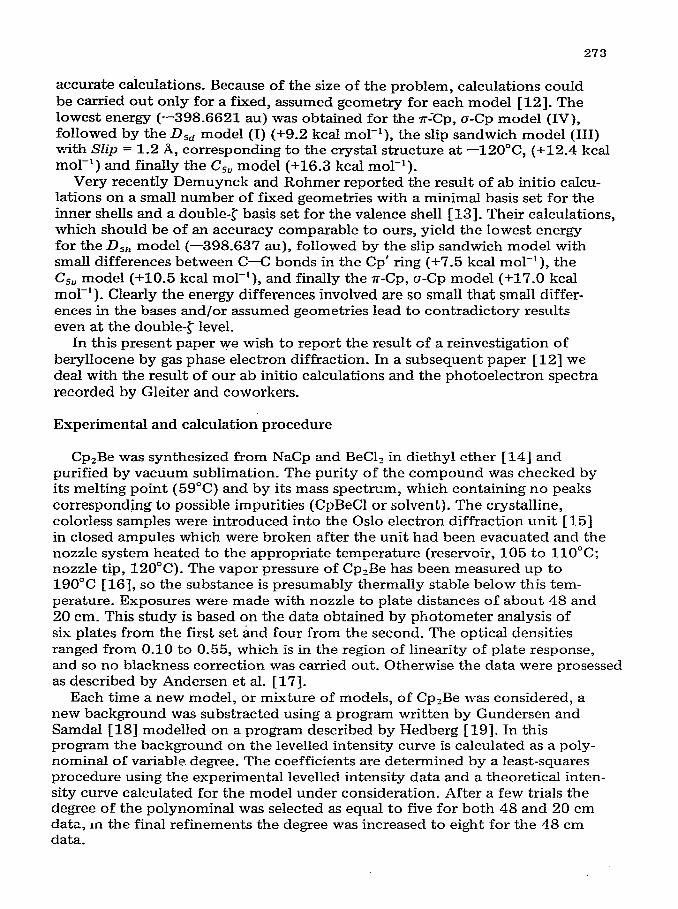
Fig. 2. A: Experimental modified molecular intensity values from s = 4.00 to 17.00 _&-I. obtained by subtraction of a background calculated for a Cgu model (Refinement 9. Table 1). Below the difference between the experimental and calc$ated intensities of various models: B: Csv model, Refinement 9:
C: Csu model. Refinement 5: D: r;-CP. CT-Cp model. Refinement 6: E: Dsd model, Refinement 10; F: Dsd/z-Cp. o-CP mixture, Refinement 11.
After backgrounds had been subtracted, the data obtained from each nozzle to plate distance were averaged and converted into modified molecular intensities (eq. 10 in ref. 17), The modified molecular intensity curves obtained by subtrac- tion of backgrounds calculated for a CsV model are shown in Fig. 2A and Fig. 3A. It should be emphasized that the backgrounds calculated for the various models were very similar; the resulting modified molecular intensity curves could hardly be distinguished when plotted on the scale of Fig. 2 and Fig. 3.
Finally the scale factor of each average curve and structure parameters were refined using a least-squares program written by Seip [ZO]. Most refinements were carried out with a diagonal, but the final refinements were carried out with a non-diagonal weight matrix.
A few refinements were also carried out on the intensity data of Cp,Be recorded in 1963 [l]. The intensity data had then been corrected for non- linearity of plate response and averaged for each nozzle to plate distance. The average curves were now processed anew as described above.
Radial distribution curves were calculated by Fourier inversion of experimen- tal or calculated intensity curves after multiplication with the artificial damp-
2’75
10
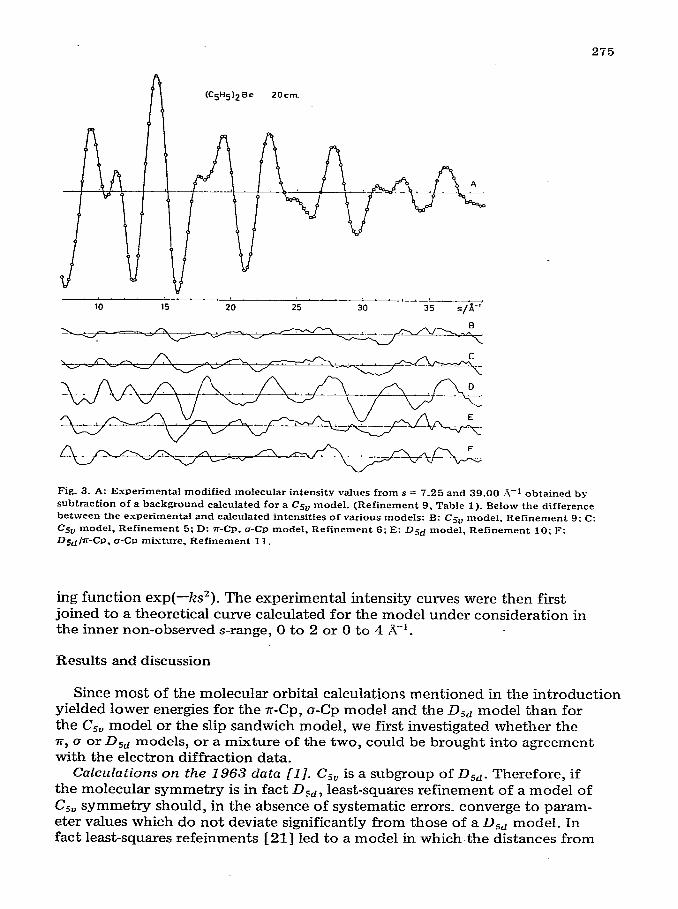
Fig. 3. A: Experimental modified molecular intensity values from s = 7.25 and 39.00 A-1 obtained by
subtraction of a background calculated for a Csv model. (Refinement 9. Table 1). Below the difference between the experimental and calculated intensities of various models: B: Csu model. Refinement 9: C: Csv model, Refinement 5: D: n-CP. a-CP model. Refinement 6; E: Dgd model, Refinement 10; F:
Dsdjz-CP. o-CP mixture, Refinement 11.
ing function exp(-ks*). The experimental intensity curves were then first joined to a theoretical curve calculated for the model under consideration in the inner non-observed s-range, 0 to 2 or 0 to 4 A-‘.
Results and discussion
Since most of the molecular orbital calculations mentioned in the introduction yielded lower energies for the 7-r-Cp, o-Cp model and the DSd model than for the C5, model or the slip sandwich model, we first investigated whet.her the r, (T or D5d models, or a mixture of the two, could be brought into agreement with the electron diffraction data.
Calculations on the I963 data [I /_ C,-, is a subgroup of DSd. Therefore, if the molecular symmetry is in fact Dsd, least-squares refinement of a model of C5, symmetry should, in the absence of systematic errors. converge to param- eter values which do not deviate significantly from those of a D,, model. In fact least-squares refeinments [21] led to a model in which-the distances from

LE
AST
.SQ
UA
RE
S R
EFI
NlZ
MI7
,NT
S O
F V
AR
IOU
S M
OD
EL
S O
F C
l12B
e
Ref
inem
ent.
num
ber
Mod
el
I%w
mic
tcrs
rc
finc
d ”
Ref
eren
ce
s-ra
nge
Rp(
Rj)
’
wnn
gc
82(R
3)
b Ran
tota
l
1 2 3 4 5 (i 7 8 9 10
11
12
13
14
-_
II C
5”
IV7r
, fl
II
csv
c
IV l
r, 0
II
C5”
IV
lr,
n
II C
Jv c
IV
rr,
a
II C
5”
I D
SrI
I&l”
, fJ
II
CS”
II
I sr
ip
III
Slip
_~-
--._
--
-.---
--
0 1
2.00
-13.
00
0 I
2.00
-18.
00
0 1
2.00
-18.
00
I(C
-c)m
can
1 2.
00-1
8.00
0
this
wor
k 4.
00-1
7.00
0
this
wor
k 4.
00-1
7.00
0
this
wor
k 4.
00-1
7.00
~(
c--c
hlml
th
is w
ork
4.00
-17.
00
14d
this
wor
k 4.
00-1
7.00
‘$
th
is w
ork
4.00
-17.
00
this
wor
k 4.
00-1
7.00
lG
d th
is w
ork
2,00
-17.
00
17 c
1 th
is w
orlc
2,
00--
17.0
0 IB
’I,
c th
is w
ork
2,00
--17
.00
12.2
lO
.OO
-44,
00
12.8
12
,4
13.1
10
.00-
44.0
0 23
.2
17,3
16
.7
lO.O
o-44
,00
13.1
14
,9
13.5
10
.00-
44.0
0 15
.9
14,4
G
-2
7,25
-39.
00
11.3
B,
6 7.
G
7.25
-39.
00
28.5
16
.8
7.9
7.25
-39.
00
11.2
9-
3 3.
3 7,
25-3
9.00
lG
.6
11,s
3.
7 7,
25-3
9,00
9.
5 65
8.
2 7.
25-3
9.00
14
.1
10,9
9.
G
7,2!
+39
.00
13.2
11
,l kB
(8.G
) 7.
25-3
9.00
9.
6(13
,0)
7.0(
11.5
) 5.
4(7,
8)
7.25
-39.
00
9.5(
12.8
) G
,G(l
l,l)
5.5(
B.3
) 7.
25-3
9.00
9.
7C13
.1)
G.7
(11.
5)
n Pa
ram
eter
s rr
finc
cl i
n ad
ditio
n to
tllc
tw
o sc
ale
fact
ors.
b
It2
= l
oO[~
P,~,
~V~/
TP,
~,il~
l112
~~~~
d R3 q 100[S~f',,yV,;V,/X~,~~I/,I~II'2.
SW ref,
20. ' T
hese
ref
inem
ents
b
I 12
I
wer
e ca
rrie
d ou
t on
mol
ecul
ar
inte
nsity
ca
rves
obt
aille
d by
sub
trac
tion
of a
bac
kgro
untl
calc
ulat
ed
for
a n.
n m
odel
, ns
in
I~cf
Inem
ent
2 nn
d G
, rcs
pcct
ivel
y.
(1 S
W t
ext
for
deta
ils.
‘Slip
=
1,2
0 A
was
not
ref
ined
.
__ _
.-
.-
..~
_ ..-
-
- -
_.
__
_.
_-
277
the Be atom to the centra of the two rings were significantly different: h I = l-472(6) A and h2 = 1.903(8) A.
When the structure pammeters listed in ref. 21 were used to calculate the theoretical intensity for a CSU model, backgrounds corresponding to fifth degree polynominals subtracted, and the. scale factors of the two average modified molecular intensity curves refined by least-squares calculations with a diagonal weight matrix, the resulting R-factors [ 201 were 12.2 for the 48 cm data and 12.8 for the 19 cm data. See Table 1, Refinement 1.
A 7r-Cp, o-Cp model of Cp,Be was constructed in the following way: The n-CpBe fragment was assumed to have CsV symmetry, the H atoms were assumed to lie in the plane of the C atoms, and the bond distances C-C = 1.423 -4, C-H = 1.100 .& and Be-C = 1.920 .% selected by comparison with the known structures of sr-CpBeCH3 [22] and rrr-CpBeH [23]. The structure of the O-Cp ring was taken from the recent microwave study of cyclopentadiene by Damiani and coworkers [ 241. The ring was joined to Be by removing one H atom on the saturated C atom and replacing it with the Be atom at a bond distance, Be-C, = 1.698 a, equal to the Ce-C(Me) bond distances in monomeric Be(CH& 1251 and x--CpBeCH, [22], and without changing the valence angles around the C, atom. The Be-C, bond was assumed to lie along the fivefold symmetry axis of the x-CpBe fragment. The angle between the two Cp ring planes is then (Y = 36.9”. The vibrational amplitudes of the CC bond distances were selected as follows: n-Cp, C-C = 1.423 a, I = 0.045 A (5 X) o-Cp, C-C = 1.468 a, I = 0.048 z& (1 X) a-Cp, C-C = 1.506 a, I = 0.048 A (2 X) o-cp, c=c = 1.345 A, I = 0.040 A (2 X). Other vibrational amplitudes were selected by comparison with CpBe compounds studied in this laboratory.
A theoretical intensity curve was calculated and after the background had been subtracted, the two scale factors were refined as for the C5” model. The resulting R-factors are listed in Table 1 (Refinement 2). It is seen that the m-Cp, a-Cp model gives considerably poorer agreement between experimental and calculated intensity data over the range s = 10.00 to 44.00 A-‘. This region carries more information about the bond distances and their vibrational ampli- tudes than the region from s = 2.00 to 18.00 A-‘. Comparison of radial distri- bution curves showed that the CC bond distance peak at 1.42 A in the calculated RD curve was lower and broader than the corresponding peak in the experimental curve. On the other hand a refinement of the C,-, model against the intensity curves obtained by background subtraction for the x, (J model, shows good agreement in the outer region, R2 = 13.170, (Refinement 3).
Finally we held the difference between the various CC bond distance vibra- tional amplitudes constant, but refined the mean value along with the scale factors. (Refinement 4). As was to be expected, the fit in the outer region improved considerably, R2 = 15.9%, but the resulting mean amplitude, I= O-022(3) a, is clearly unacceptable. Thus, barring systematic errors, the 7~, 0 model must be considered incompatible with the experimental data.
It is well known that a faulty blackness correction may introduce considerable systematic errors into the vibrational amplitudes determined by electron diffrac-

27s
tion, so at this point it was decided to record a new set of data. As described in the experimental section, the range of optical densities of the new plates is such as to eliminate non-linearity of plate response as a source of error, or at least to reduce it considerably.
Calculations on the new data. When backgrounds were calculated, it was found difficult to obtain satisfactory backgrounds in the region below s = 4.00 K1 for both the CS, model and the r-Cp, o-Cp models. In this region the back- ground may indeed be less smooth than at higher s-values, and so we did not wish to rule out any model because of disagreement between experimental and calculated intensity curves in this region, and the data below s = 4.00 A-’ were
disregarded for the time being. Backgrounds were calculated for both the CSU model and the K, 0 model and
refinements carried out as already described for the 1963 data. The R-factors obtained are listed in Table 1. Curves showing the differences between experi- mental and calculated intensity data are shown in Fig. 2C and D, and in Fig. 3C and D. Again it is seen that with reasonable values for the vibrational ampli- tudes of CC bond distances, the X, (J model leads to serious disagreement between experimental and calculated intensities in the higher s-range. When a mean CC vibrational amplitude is refined, the fit is improved (Table 1, Refine- ment S), but the resulting mean amplitude, O-014(3) A, is far outside the acceptable range. We conclude that the n-Cp, o-Cp model, or any other model containing localized CC single and double bonds in one or both rings, is incompatible with both the 1963 and the new electron diffraction data.
We now turn our attention to the DSd model. When the four independent structure parameters of the CSv model (the C-H and C-C bond distances and the perpendicular distances from Be to each of the two rings, h 1 and 1~~) were refined along with the ten most important vibrational amplitudes, the agree- ment between experimental and calculated intensities improved considerably (Table 1, Refinement 9, Fig. 2B and Fig. 3B). The structure parameters obtained were very similar to those obtained previously by least-squares refine- ment on the 1963 data [2l]. In particular the two perpendicular Be-Cp dis- tances were I2 , = l-472(5) a and h2 = l-898(8) iL We conclude that the DSd model is incompatible with the electron diffraction data.
On the basis of the similar energies obtained for the (T, K and DS, models by molecular orbital calculations, several workers htive suggested that gaseous Cp,Be may consist of a mixture of X, (T and DSd conformers [ S,lO]. In order to investigate this possibility we need an estimate for the perpendicular BeCp distance in the DSd model. Attempts to refine a Djd model gave a distance of 1.49 & very close to the value obtained for h , in the C,-, model, while geveral vibrational amplitudes diverged. The BeCp distance was therefore fixed at 1.62 8, equal to the value obtained by optimization of the Djd model by ab initio calcuiations with ST0 3G basis [lO,ll], but somewhat shorter than the average of the two BeCp distances obtained by refinement of the CSv model, i-68 a. Refinement of.the C-C and C-H bond distances and the same vibrational amplitudes as for the CS, model (except 1 (Be-s-H)), yielded the R factors listed in Table 1, Refinement 10, and the difference curves displayed in Fig. 2E and Fig. 3E. The amplitude obtained for the ten equal Be-C bond distances was 0.25 a. As was to be expected, the D,, model gave much poorer agreement
279
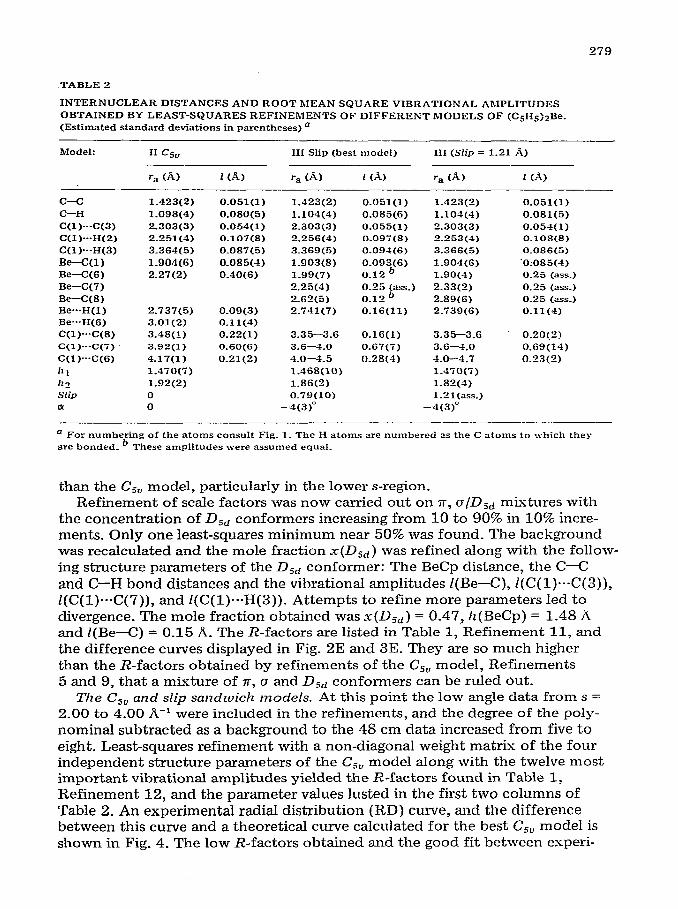
TABLE 2
INTERNUCLEAR DISTANCES AND ROOT hlEAN SQUARE VIBRATIONAL AMPLITUDES OBTAINED BY LEAST-SQUARES REFINEMENTS OF DIFFERENT MODELS OF (CsHg)2Be_ (Estimated standard deviations in parentheses) a
Model: II C5”
r, (f\)
III Slip (best model)
‘a (A) 1 (A)
III (Slip = 1.21 A)
‘a (A) 1 (-a
c-c C-H C(l)---C(3) C(l)---H(2) C(l)*.-H(3)
Be-C(l) Be-C(G)
Be-C(7) Be-C(8) Be...H(l) Be---H(6) C(l)---C(8) C(l)---C(7)
C(l)---C(6)
hl lz 2 Slip 6%
l-423(2)
l-098(4) 2.303<3) 2_251(4) 3.364(5)
l-904(6) 2.27(2)
2.737(5) 3.01(2) 3.48(l) 3.92(l) 4.17(l) l-470(7)
l-92(2) 0 0
0.051(l)
0.080(S) 0.054(l) 0_107<8) 0.087(5)
0_085(-l) O-40(6)
O-09(3) 0.1 l(4)
0.22(l) 0.60(6)
O-21(2)
l-423(2) 0.051(l)
l-104(4) O-085(6) 2.303(3) 0.055(l) 2_256(4) 0.097(S)
3.369(5) 0.094<6)
1.903(S) O-093(6) l-99(7) O-12 b
2.25(4) 0.25 (ass.) 2.62(s) 0.12 6 2.741(7) O-16(11)
3.35-3.6 3.6-4-O 4.0-4.5
l-468(10)
l-86(2) 0.79(10)
-4(3)”
0.16(l) 0.67(i) 0.28(-l)
l-423(2)
l-104(4) 2.303(3) 2.263(-L) 3.366(s)
l-901(6) l-90(4)
2.33(2) 2.89(6) 2.739(6)
3.35-3.6 3.6-4.0
4.0-4.7 l-470(7) l-82(4) 1_2l(asS.)
-4(3)O
0.051(l) 0.081(5)
0.054(l) 0_108<8) 0.086<5)
‘0;085(4) 0.25 (ass.)
0.25 (ass.) 0.25 (ass_) O-11(4)
0.20(2) 0.69(14) O-23(2)
cI For numbering of the atoms consult Fig. 1. The H atoms are numbered as the C atoms to which they zre bonded_ ’ These amplitudes were assumed equal.
than the CS, model, particularly in the lower s-region_ Refinement of scale factors was now carried out on rr, o/DSd mixtures with
the concentration of D,, conformers increasing from 10 to 90% in 10% incre- ments_ Only one least-squares minimum near 50% was found. The background was recalculated and the mole fraction _x(DSd) was refined along with the follow- ing structure parameters of the D,, conformer: The BeCp distance, the C-C and C-H bond distances and the vibrational amplitudes I(Be-C), /(C(l)---C(3)), r(C(l)--C(7)), and /(C(l)---H(3)). Attempts to refine more parameters led to divergence. The mole fraction obtained was x(Dgd) = 0.47, iz(BeCp) = 1.48 K and I(Be-C) = 0.15 A. The R-factors are listed in Table 1, Refinement 11, and the difference curves displayed in Fig. 2E and 3E. They are so much higher than the R-factors obtained by refinements of the C,-, model, Refinements 5 and 9, that a mixture of x, (T and DSd conformers can be ruled out.
The C,, and slip sandwich models. At this point the low angle data from s = 2.00 to 4.00 .%-l were included in the refinements, and the degree of the poly- nominal subtracted as a background to the 48 cm data increased from five to eight. Least-squares refinement with a non-diagonal weight matrix of the four independent structure parameters of the C,-, model along with the twelve most important vibrational amplitudes yielded the R-factors found in Table 1, Refinement 12, and the parameter values lusted in the first two columns of Table 2. An experimental radial distribution (RD) curve, and the difference between this curve and a theoretical curve calculated for the best Cgu model is shown in Fig. 4. The low R-factors obtained and the good fit between esperi-

280
B 1
0 1 2 3 5 r/% 6
Fig. 4. A: Experimental radial distribution curve for CpzBe calculated by Fourier inversion oi intensity curves. The intensity data from s = 0.000 to 1.875 I%--’ have been calculated for a Csv model. Artificial damping constant. k = O-001 AZ_ B: Difference between the experimental curve (A) and a theoretical curve for best Csu model <Table 2).
mental and calculated RD curves show that the C,-, model is in satisfactory agreement with the new electron-diffraction data as well as with the 1963 data, though close inspection of the RD curves reveals a minor disagreement in the region around 2.6 A.
All parameters obtained by refinement of the CSV model lie in the expected range, except the vibrational amplitude of the long Be-C distance, Z(Be-C(Cp’)) = O-40(6) A. This value is much larger than the amplitude of the short Be-C bond, O-085(4) A, the Be-C(Cp) amplitude in CpBeMe, O-075(3) A [22], or the Mg-C amplitude in Cp,Mg, Z(Mg-C) = O-103(3) A 1261.
Inspection of the radial distribution curve in Fig. 4 shows that while the geometry of the r-CpBe fragment and of the Cp’ ring is clearly defined by resolved peaks (C-H, C-C and Be-C(Cp)), the curve contains no features yielding similarly precise information about the position of the Cp’ ring relative to the 7r-CpBe fragment. One reason for this may be that though the equilibrium structure is CsU, the molecule undergoes large amplitude motion leading to the large value cbtained for Z(Be-C(Cp’)). This large amplitude motion could be a Be-Cp’ stretching mode, a Cp’ ring tilt mode, or a Cp’ slip mode.
An alternative explanation for the absence of a clearly defined Be-C(Cp’) peak in the RD curve may be that the equilibrium geometry has lower symmetry than CSU; i.e., that Cp’ is tilted or slipped in such a way that the five Be-C(Cp’) distances no longer are exactly equal.
In addition to the structure parameters of the CSv model we therefore define two new structure parameters, Slip, equal to the distance from the center of the Cp’ ring to the fivefold symmetry axis of the n-CpBe fragment, and CX, equal

281
to the angle between the planes of the two rings. The sign of cr is defined as positive when Cp’ has been rotated counterclockwise about the x-axis, see Fig. 1. In order to fix the position of all atoms unambiguously, one must also define two angles describing the angle of rotation of the two rings about their (approximate) fivefold symmetry axes. In the following we shall, however, confine ourselves to model III in Fig. 1, in which the rings are oriented in such a way that both C(1) and C(6) are in the YYZ plane. This model corresponds to the crystal structure at -120°C 143. The problem of the structure of Cp,Be may now be restated as the problem of determining how the potential energy of the molecule varies with Slip; if the potential energy surface has a minimum at SZip = 0 and CY = 0, the equilibrium structure is CsV, if the minimum is found- at some value of Hip # 0, the equilibrium structure is a slip sandwich_
Before proceeding we note that in a slip sandwich model, the Cp’ ring is no longer required to retain its fivefold symmetry. However, the vibrational ampli- tudes obtained by refinement of a CsU model Z(C--C) = 0.051(l) A and /(C(l)--* C(3)) = 0.054(l) a are very similar to the corresponding tiplitudes obtained for CpBeCH,, 0.051(l) and O-057(2) A, demonstrating that at least the carbon atom skeleton of the two Cp rings show no perceptible deviation from five- fold symmetry, though differences between individual C-C bonds of the order of four or five hundredths of an A unit cannot be ruled out.
The Slip parameter was refined by least-squares calculations with diagonal weight matrix with a CsV start model (Slip = 0.0) and a start model corresponding to the crystal structure at -120°C; Sip = 1.21 A. Both refinements converged to a model with Slip = 0.8 A. The background was readjusted and the refine-
--- 0 1 2 3 4 5 r/i 6
Fig. 5. A: Experimental radial distribution curve for CpzBe calculated by Fourier inversion of intensits curves. The intensity data from s = 0.000 to 1.875 .%-I have been calculated for the best SLIP model. Artificial damping constant 1: = 0.001 .k2_ B: Difference between the experimental curve (A) and a theoretical curve for best slip model (Table 2).
282
ments continued with a non-diagonal weight matrix. All the vibrational amplitudes that had been-refined for the CSV model could be refined without divergence except the amplitudes of the three Be-C(Cp’) distances. Somewhit arbitrarily the amplitude of the intermediate distance was fixed at 0.25 A, while the two other amplitudes were assumed equal. Under these conditions refine- ments gave the R-factors listed in Table 1, Refinement 13, and the structure parameters listed in Table 2.
Comparison of the R-factors show that the slip sandwich model gives a slightly better fit between experimental and calculated intensity curves than the C,, model, and comparison between RD curves show that the disagreement around 2.6 A has been largely eliminated_ See Fig. 5.
Finally similar refinements were carried out on a model with SZip fixed at 1.21 .4. Initially the same assumptions as before were made regarding the three Z(Be-C(Cp’)), but after [(Be-C(G)) and Z(Be-C(8)) had refined to values well above 1 A, they too were fixed at 0.25 A. The resulting R-factors are listed in Table 1, Refinement 14, and parameter values are listed in the last two columns of Table 2. It is seen that the agreement is about as good as that obtained with the CSV model and comparison of RD curves show that some disagreement has been reintroduced in the region around 2.6 A.
Concluding remarks
The best agreement between calculated and experimental intensities is obtained with a slip sandwich model and the structure parameters listed in Table 2_ The value obtained for Slip, 0_79(iO) A, would seem to rule out both the CSo and the SZip = 1.21 A models. However, since the standard deviation has been obtained for a fixed background, it cannot be taken at face value. In our view the fit obtained with the C,-, and Slip = 1.21 A models is so good that the CSV model as well as slip sandwich models with Slip between 0 and 1.2 A must be considered compatible with the electron diffraction data.
This conclusion is at variance with that drawn by Drew and Haaland who concluded after refinements on the 1963 data, that models with Slip >0.6 A could be ruled out. However, their refinements were carried out with a single ftied background drawn by hand for a CSv model and with a slip model with exactly parallel rings.
Ab initio molecular orbital calculations on the slip sandwich model yield orbital energies in satisfactory agreement with the vertical ionization poten- tials obtained by PE spectroscopy, while a model of CSo symmetry is only com- patible with the PE spectrum if the Jahn-Teller splitting of the lowest ‘E state of the molecular ion is exceptionally Iarge [12]_ The microwave spectrum of Cp,Be is more complicated than expected for a symmetric top [27], indicating that the equilibrium structure has lower symmetry than CS,.
-4s mentioned in the introduction the molecular structure in the crystalline phase is that of a slip sandwich [4,5] and the Raman spectra offer strong indica- t.ions that this conformation is retained in the melt [ZS] .
Though a CSv equilibrium structure of Cp,Be cannot be ruled out, the experi- mental evidence seems to favor a slip sandwich equilibrium geometry for the gas phase. Perhaps the most reasonable hypothesis at this time is that the poten-

283
tial energy of the molecule varies slowly with the magnitude of the slip. The potential energy surface would have fivefold symmetry around the z-axis. The minimum energy, and consequently the equilibrium structure, is found at a dis- tance of about Slip = 1 a from the z-axis. The height of the mound at Slip = 0 (i.e. the relative energy of the C 5U conformation) is unknown, but probably not very large. The molecule consequently undergoes large amplitude vibra- tions.
The ‘H NMR spectrum of Cp,Be in CF,Cl, consists of a single sharp peak down to -135°C [29]. Equivalence of all protons is probably achieved by rapid rotation of the two rings about their (approximate) fivefold symmetry axes and by motion of the Be atom between two potential energy minima each on the fivefold axis of one of the rings h 1 = 1.49 A above (below) the ring center. The energy barrier between the two minima is clearly low enough to allow the alteration of the Be atom between the minima to be rapid on the ‘H NMR timescale even at -13!?‘C, but the sharpness of the peak at 1.92 A in the RD-curve of Cp,Be shows that the barrier height must be significantly greater than the thermal energy available under our experimental conditions, RT = 0.8 kcal mol-*.
In model III the Be-C(G) distance is shorter than the Be-G(7) and Be-C(8) distances. Probably for this reason some workers have described the model as containing one pentahapto and one monohapto ring or even as a r-Cp, o-Cp model. We believe that these descriptions may be misleading and prefer to describe it as a slip sandwich model or a pentahapto, trihapto model for the following reasons :
(i) The gas phase election-diffraction data and IR spectrum [7] and the Raman spectrum of the melt [28] show that the Cp’ ring does not deviate much from fivefold symmetry. This indicates that the r-system of the ring remains delocalized.
(ii) The angle between the Cp and Cp’ ring planes, o[ = -4( 3)“, is significantly different from the angle expected if Be is bonded to C(6) through a single cova- lent o-bond, +36.9” [24].
(iii) The Be-C(G) distance is significantly longer than the Be-C(Me) dis- tance in CpBeMe, l-706(3) [22], while the Be-fZ(7) distance is so short as to indicate a bonding interaction between the two atoms.
Acknowledgements
We are grateful to siv. ing. Liv Fernholt for computationai assistance, to Professors Otto Bastiansen and Jan AlmKf for helpful discussions, to Professors Paul von R. Schleyer and Lothar Schlfer for providing us with the results of their calculations before publication, and to the Norwegian Research Council for Science and the Humanities for financial support.
References
1 A. Almenningen. 0. Bastiansen and -4. Haaland. J. Chem. Phys.. 10 (1964) 3434.
2 R. Schneider and E-0. Fischer, Naturwiss., 50 (1963) 349. 3 E.O. Fischer and S. Schreiner. Chem. Ber_. 92 (1959) 938. 4 C. Wang. T.Y. Lee, K.J. Chao and S. Lee, Acta Crystallogr. B. 28 (1972) 1662.

5 C. Wang. T-Y. Lee. T.J. Lee, T.W. Chang and C.S. Liu. Inorg. Nucl. Chem. Let& 9 (1973) 667. 6 D.A. Drew and A. Haaland. Acta Crystallogr. B. 28 (1972) 3671. 7 G-B. McVicker and G.L. Morgan, Spectrochim. Acta A. 26 (1970) 23. 8 D.S. Marynick, J. Amer. Chem. Sot.. 99 (1977) 1436. 9 M.J.S. Dewar and H.S. Rrepa. J. Amer. Chem. Sot.. 100 (1978) 777.
10 N.S. Chiu and L. Schafer. J. Amer. Chem. Sot.. 100 (1978) 2604. 11 E-D. jemmis. S. Alexandratos. P. v. R. Schleyer. A. Streitwieser and H.F. Schaefer III, J. Amer.
Chem. Sot., 100 (1978) 5695. 12 R. Gleiter. M.C. Bohm. A_ Haaland. R. Johansen and J. Luetyk. J. Organometal. Chem.. 170 (1979)
285. 13 J_ Demuynck and M-M_ Rohmer. Chem. Phys. Lett.. 54 (1978) 567. 14 E-0. Fischer and H.P. Hofmann. Chem. Ber.. 92 (1959) 482. 15 0. Bastizinsen. 0. Hassel and E. Risberg. Acta Chem. Stand.. 9 (1955) 232.
16 F. Scherer. Thesis. Ludwig-Maximilian Universitiit, Miinchen, 1961. 17 B. Andersen. H.M. Seip, T.G. Strand and R. Stiilevik, Acta Chem. Stand.. 23 (1969) 3224. 18 The Norwegian Electron Diffraction Group, Annual Report 1976. 19 L. Hedberg. Abstracts. Fifth A&tin Symposium on Gas Phase Molecular Structure. (1974) 37. 20 H.M. Seip, T-G. Strand and R. Stijlevik. Chem. Phys. L&t.. 3 (1969) 617. 21 A. Haaland, Acta Chem. Stand.. 22 (1968) 3030. 22 D.A. Drew and A. Haaland. Acta Chem. Stand.. 26 (1972) 3079. 23 T-C. Barike. A. BjSrseth. A. Haaland. K.-hl. Marstokk and H. MSllendal, J. Organometal. Chem.. 85
(1975) 271. 24 D. Damiani. L. Ferretti and E. Gallinella, Chem. Phys. L&t.. 37 (1976) 265. 25 A. Almenningen. A. Haaland and G.L. Morgan, Acta Chem. Stand.. 23 (1969) 2921. 26 A. Haaland. J. Luetyk. J. BrunvolI and K-B. Starowieyski, J. Organometal. Chem.. 85 (1975) 279. 27 E-A. Rhiehart and G.L. Morgan, unpublished results, quoted by G.L. Morgan and G.B. McVicker.
J. Amer. Chem. Sot.. 90 (1968) 2789. 28 J. Lusztyk and K.B. Starowieyski. J. Organometal. Chem.. 170 (1979) 293. 29 C. Wong and S.-M. Wang. Inorg. Nucl. Chem. Lett.. 11 (1975) 677.