the municipal water quality investigations program … · bryte chemical laboratory for sample...
TRANSCRIPT

State of California The Resources Agency
Department of Water Resources
The Municipal Water Quality Investigations Program Summary and
Findings from Data Collected October 2001 through September 2003
June 2005
Arnold Schwarzenegger Mike Chrisman Lester A. Snow Governor Secretary for Resources Director
State of California The Resources Agency Department of Water Resources

If you need this publication in an alternate form, contact the Municipal Water Quality Investigations Unit at (916) 651-9691 or the Equal Opportunity and Management Investigations Office at TDD 1-800-653-6934, or Voice 1-800-653-6952.

Foreword The Sacramento-San Joaquin Delta (the Delta) is a major source of drinking water for two-thirds of the
population in the State of California. The quality of Delta waters, however, may be affected by a variety
of degrading factors. Close monitoring of Delta waters is necessary to ensure delivery of high quality
source waters to urban water users of the State.
The Municipal Water Quality Investigations (MWQI) Program of the Division of Environmental Services
in the Department of Water Resources is charged with monitoring and research of water quality in the
Delta. Among all State and local agencies that are monitoring the Delta and its tributaries, MWQI
conducts the only monitoring program mandated to investigate the quality of source waters in the Delta
with respect to its suitability for production of drinking water.
Since 1982, MWQI has been conducting comprehensive and systematic source water monitoring in the
Delta region, and regularly prepares annual or multi-year data summary reports. The previous three-year
report (July 2003) summarized data collected through September 2001. The current report summarizes
and interprets monitoring data collected from October 1, 2001, to September 30, 2003, from 11 MWQI
sampling sites. Presented are data and findings for major water quality constituents, including organic
carbon, bromide, salinity, regulated organic and inorganic constituents in drinking water, and a few
unregulated constituents of current interest.
This and other MWQI reports are available online at the MWQI web site:
http://www.wq.water.ca.gov/mwq/index.htm. For further information about the MWQI Program, please
visit its Web site or contact Dan Otis, Chief of the Municipal Water Quality Program Branch, (916)
651-9683, or send your request to: MWQI Program, P.O. Box 942836, Sacramento, CA 94236-0001.
Barbara McDonnell Chief, Division of Environmental Services

STATE OF CALIFORNIA
Arnold Schwarzenegger, Governor
THE RESOURCES AGENCY Mike Chrisman, Secretary for Resources
DEPARTMENT OF WATER RESOURCES
Lester A. Snow, Director
P. Joseph Grindstaff Chief Deputy Director Brian E. White Nancy J. Saracino Susan Sims-Teixeira Assistant Director Legislative Affairs Chief Counsel Assistant Director Public Affairs Peter S. Garris Stephen W. Verigin Deputy Director Deputy Director Vernon T. Glover Gerald E. Johns Deputy Director Deputy Director
Division of Environmental Services Barbara McDonnell, Chief
Office of Water Quality Municipal Water Quality Program Branch Steve Ford, Chief Dan Otis, Chief
Prepared under the direction of
Richard S. Breuer, Chief Municipal Water Quality Investigations Program
Prepared by
Fengmao Guo, Project Leader
William J. McCune
Sarojini Balachandra
Jaclyn Pimental
Michael Zanoli
Editorial review, graphics, and report production
Gretchen Goettl, Acting Supervisor of Technical Publications
Marilee Talley, editor and page layout
Joanne Pierce, maps Carole Rains, cover

Municipal Water Quality Investigations Program, Office of Water Quality
Richard S. Breuer, Chief
Robert DuVall, Environmental Scientist
Jaclyn Pimental, Environmental Scientist
Lori Weisser, WR Engineering Associate
Water Quality Special Studies, Office of Water Quality
Carol DiGiorgio, Staff Environmental Scientist
Fengmao Guo, Staff Environmental Scientist
Michael Zanoli, Staff Environmental Scientist
Quality Assurance/Quality Control Group, Office of Water Quality
Bruce Agee, Chief
Murage Ngatia, Environmental Scientist
Field Support Group, Office of Water Quality
David Gonzalez, Chief
Arin Conner, Environmental Scientist
Steven San Julian, Environmental Scientist
Bryte Laboratory, Office of Water Quality
William Nickels, Chief
Sid Fong, Supervising Chemist
Pritam Thind, Staff Chemist
Richard Hernandez, Chemist
Josie Quiambao, Chemist
Mark Betencourt, Chemist
Maritza Pineda, Chemist
David Nishimura, Chemist
Elaine Chan, Laboratory Technician
Marilyn Toomey, Laboratory Technician
Shelly Bains-Jordan, Business Services Assistant
Report Production
Department of Water Resources Reprographics

MWQI Summary and Findings from Data Collected Oct 2001 through Sep 2003 Page vii
Acknowledgments
The authors thank colleagues from MWQI Field Unit for sample collections and the chemists at DWR’s Bryte Chemical Laboratory for sample analyses. We thank Mr. Bill Nickels and Mr. Sid Fong for their prompt responses to questions. We thank Mr. Rick Woodard for reviewing the draft report and providing us with valuable comments. We are particularly grateful to Ms. Marilee Talley for her editorial work, which helps improve the readability of this report. Special thanks are also extended to Ms. Joanne Pierce for modifying the maps in this year’s report. We thank Ms. Gretchen Goettl and Nikki Blomquist for their enthusiastic support for this project. The MWQI Program gratefully acknowledges support of the following water agencies:
State Water Project Contractors:
Alameda County Flood Control and Water Conservation District Zone 7 Alameda County Water District Antelope Valley-East Kern Water Agency Casitas Municipal Water District Castaic Lake Water Agency Central Coast Water Authority Coachella Valley Water District County of Kings Crestline-Lake Arrowhead Water Agency Desert Water Agency Dudley Ridge Water District Empire-West Side Irrigation District Kern County Water Agency Littlerock Creek Irrigation District Metropolitan Water District of Southern California Mojave Water Agency Napa County Flood Control and Water Conservation District Oak Flat Water District Palmdale Water District San Bernardino Valley Municipal Water District San Gabriel Valley Municipal Water District San Gorgonio Pass Water Agency San Luis Obispo County Flood Control and Water Conservation District Santa Clara Valley Water District Solano County Water Agency Tulare Lake Basin Water Storage District MWQI Participant: Contra Costa Water District

MWQI Summary and Findings from Data Collected Oct 2001 through Sep 2003 Page viii
Metric Conversion Factors Quantity To Convert from Metric Unit To Customary Unit Multiply Metric Unit
By To Convert to Metric
Unit Multiply Customary Unit By
millimeters (mm) inches (in) 0.03937 25.4
centimeters (cm) for snow depth inches (in) 0.3937 2.54
meters (m) feet (ft) 3.2808 0.3048 Length
kilometers (km) miles (mi) 0.62139 1.6093
square millimeters (mm2) square inches (in2) 0.00155 645.16
square meters (m2) square feet (ft2) 10.764 0.092903
hectares (ha) acres (ac) 2.4710 0.40469 Area
square kilometers (km2) square miles (mi2) 0.3861 2.590
liters (L) gallons (gal) 0.26417 3.7854
megaliters (ML) million gallons (10*) 0.26417 3.7854
cubic meters (m3) cubic feet (ft3) 35.315 0.028317
cubic meters (m3) cubic yards (yd3) 1.308 0.76455
Volume
cubic dekameters (dam3) acre-feet (ac-ft) 0.8107 1.2335
cubic meters per second (m3/s) cubic feet per second (ft3/s) 35.315 0.028317
liters per minute (L/mn) gallons per minute (gal/mn) 0.26417 3.7854
liters per day (L/day) gallons per day (gal/day) 0.26417 3.7854
megaliters per day (ML/day) million gallons per day (mgd) 0.26417 3.7854
Flow
cubic dekameters per day (dam3/day) acre-feet per day (ac-ft/day) 0.8107 1.2335
kilograms (kg) pounds (lbs) 2.2046 0.45359 Mass
megagrams (Mg) tons (short, 2,000 lb.) 1.1023 0.90718
Velocity meters per second (m/s) feet per second (ft/s) 3.2808 0.3048
Power kilowatts (kW) horsepower (hp) 1.3405 0.746
kilopascals (kPa) 0.14505 6.8948 Pressure
kilopascals (kPa)
pounds per square inch (psi) feet head of water
0.32456 2.989
Specific capacity liters per minute per meter drawdown gallons per minute per foot
drawdown 0.08052 12.419
Concentration milligrams per liter (mg/L) parts per million (ppm) 1.0 1.0
Electrical conductivity microsiemens per centimeter (µS/cm) micromhos per centimeter
(µmhos/cm) 1.0 1.0
Temperature degrees Celsius (°C) degrees Fahrenheit (°F) (1.8X°C)+32 0.56(°F-32)

MWQI Summary and Findings from Data Collected Oct 2001 through Sep 2003 Page ix
Acronyms and Abbreviations af acre-foot/acre-feet AL(s) action level(s) APHA American Public Health Association AWWA American Water Works Association BLM US Bureau of Land Management CCWD Contra Costa Water District CDEC California Data Exchange Center cfs cubic feet per second CIMIS California Irrigation Management Information System CVP Central Valley Project CVRWQCB Central Valley Regional Water Quality Control Board D/DBP(s) disinfectant/disinfection byproduct(s) DES Division of Environmental Services of DWR DHS California Department of Health Services DMC Delta-Mendota Canal DOC dissolved organic carbon DWR California Department of Water Resources EC electrical conductivity EPA US Environmental Protection Agency ESWTR Enhanced Surface Water Treatment Rule FLIMS Field and Laboratory Information Management System HAAs Haloacetic acids IC Ion Chromatography ICP Inductively Coupled Plasma Optical Emission Spectroscopy IEP Interagency Ecological Program IQR interquartile range L Liters LCS laboratory control sample maf million acre-feet MCL maximum contaminant level MDL method detection limit mg/L milligrams per liter MTBE methyl tertiary-butyl ether MWDSC Metropolitan Water District of Southern California MWQI DWR Municipal Water Quality Investigations NEMDC Natomas East Main Drainage Canal nm nanometers NTU(s) nephelometric turbidity unit(s) O&M DWR Division of Operations and Maintenance OWQ Office of Water Quality

MWQI Summary and Findings from Data Collected Oct 2001 through Sep 2003 Page x
pH negative log of the hydrogen ion activity POC particulate organic carbon QA/QC quality assurance/quality control RPD(s) relative percent difference(s) SJR San Joaquin River SRWTP Sacramento Regional Wastewater Treatment Plant SUVA254 specific UVA254 SWC State Water Contractors SWP State Water Project SWRCB State Water Resources Control Board SWTR Surface Water Treatment Rule TCAA trichloroacetic acid TDS total dissolved solids THM trihalomethane TKN total Kjeldahl nitrogen TOC total organic carbon TSS total suspended solids TTHMFP total trihalomethane formation potential USBR US Bureau of Reclamation US EPA see EPA UVA254 ultraviolet absorbance measured at a wavelength of 254 nanometers VAMP Vernalis Adaptive Management Plan WDL Water Data Library WTP water treatment plant WWTP wastewater treatment plant WY water year µg/L micrograms per liter µm micrometers µS/cm microsiemens per centimeter

MWQI Summary and Findings from Data Collected Oct 2001 through Sep 2003 Page xi
Contents Foreword...................................................................................................................................................... iii Acknowledgments.......................................................................................................................................vii Metric Conversion Factors.........................................................................................................................viii Acronyms and Abbreviations ...................................................................................................................... ix Contents ....................................................................................................................................................... xi Executive Summary Chapter 1 Introduction Chapter 2 Data Collection and Analysis Chapter 3 Delta Hydrology Chapter 4 Organic Carbon Chapter 5 Bromide Chapter 6 Salinity Chapter 7 Nutrients Chapter 8 pH, Alkalinity, Hardness, and Turbidity Chapter 9 Other Water Quality Constituents Chapter 10 Data Quality Control References Appendix A Data Files

MWQI Summary and Findings from Data Collected Oct 2001 through Sep 2003 ES-i Executive Summary
Executive Summary
Contents Executive Summary...............................................................................................ES-1
Purpose ..............................................................................................................ES-1 Background........................................................................................................ES-1 Scope of Report .................................................................................................ES-2 Summary of Findings ........................................................................................ES-2
Organic Carbon..............................................................................................ES-3 Bromide .........................................................................................................ES-3 Salinity...........................................................................................................ES-4 Other Constituents .........................................................................................ES-5
Figures
Figure A Location of MWQI monitoring stations, 2001–2003 ............................ES-6 Figure B Total organic carbon: range (median), unit (mg/L) ...............................ES-7 Figure C Bromide: range (median), unit (mg/L) ..................................................ES-8 Figure D Electrical conductivity: range (median), unit: (µS/cm) .........................ES-9
Table Table A Inorganic and miscellaneous constituents.............................................ES-10
Executive Summary figures and tables

MWQI Summary and Findings from Data Collected Oct 2001 through Sep 2003 ES-1 Executive Summary
Executive Summary
Purpose The purpose of this report is to summarize water quality data collected in the Sacramento-San Joaquin Delta (the Delta) region from October 2001 through September 2003. The Municipal Water Quality Investigations Program (MWQI) of the California Department of Water Resources (DWR) regularly reports findings to the State Water Contractors and the public by preparing annual or multiyear reports summarizing water quality data collected from various sites in or near the Delta. The previous report presented data collected over 3 years through September 2001.
Background In the State of California, two-thirds of the water consumption occurs south of Sacramento, but two-thirds of the precipitation occurs north of Sacramento mostly as snow and rainfall in the Sierra Nevada and the Sacramento Valley. Precipitation is unevenly distributed throughout the year with most of the annual precipitation occurring from November through April (wet months). Water from the wet months must be stored outside the Delta and transported through the Delta before it is exported or diverted. Water quality deteriorates as the water traverses the complex Delta tributaries and channels, especially during dry and critical water years when annual precipitation is low. When water reaches the Delta, many factors degrade water quality. These include intrusion of seawater with high salinity and bromide, releases of organic carbon from the vast area of carbon-rich peat soils, growth and decay of phytoplankton in Delta waterways, returns of Delta island drainage, urban runoff and discharges, and recirculation of irrigation waters through the San Joaquin Valley. The Delta water system is highly complex, and water operations in the Delta are constrained by competing interests. Accordingly, it will not be feasible to solve all water quality problems affecting the Delta in the near term. Frequent monitoring is necessary to identify water quality changes and spatial and seasonal patterns to assist Delta water users to treat and manage their source waters. Computer models are currently being developed or refined to enable water quality forecasts to be made. Long-term monitoring data are essential to the development, calibration, and validation of these computer models, such as the DSM2 model developed by DWR modelers. These models may subsequently be used for long-term resource and facilities planning and project operations.

MWQI Summary and Findings from Data Collected Oct 2001 through Sep 2003 ES-2 Executive Summary
Scope of Report
Presented are data from 11 MWQI stations (Figure A). Four of the stations monitor water quality from the San Joaquin River (SJR), the Sacramento River, and the American River as they flow into the Delta. Three of these 4 stations are on the American and Sacramento rivers at or near the north end of the Delta—American River at E. A. Fairbairn Water Treatment Plant (WTP), Sacramento River at West Sacramento WTP Intake, and Sacramento River at Hood. The E. A. Fairbairn WTP represents water quality of the American River, which is a major tributary of the Sacramento River. West Sacramento WTP Intake represents water quality of the Sacramento River before mixing with water of the American River, and the Sacramento River at Hood reflects the quality of water from the Sacramento River shortly after it enters the Delta. The SJR near Vernalis represents SJR water quality as it enters the Delta. Six of the 11 stations are within the Delta or at diversion points in the Delta. Two of the stations—Old River at Station 9 and Old River at Bacon Island—are Delta channel stations representing quality of mixed waters primarily from the SJR and Sacramento River. Water is being diverted near the Old River at Station 9 at a pumping station of the Contra Costa Water District (CCWD). Three of the 6 stations—Banks Pumping Plant, Delta-Mendota Canal (DMC) at McCabe Road, and Contra Costa Pumping Plant No. 1—are diversion points that reflect the quality of waters being diverted from the Delta at these points. The Sacramento River at Mallard Island is a station at the western end of the Delta, which is most susceptible to seawater influence due to its proximity to the San Francisco and Suisun bays. CCWD has an intake at Rock Slough, which is near Mallard Island. CCWD only operates this intake during high Delta outflow conditions when chloride concentrations are acceptable. In addition, MWQI also monitored an urban drainage site—Natomas East Main Drainage Canal. Water quality constituents in Delta source waters are presented according to current regulatory priorities with organic carbon, bromide, salinity, and nutrients addressed in individual chapters. For each constituent at each station, descriptive plots in the form of temporal graphs show general seasonal patterns. Summary statistics that include range, mean, and median describe general data characteristics.
Summary of Findings The constituents of most concern for Delta source waters include organic carbon, bromide, and salinity. Organic carbon and bromide concentrations were found to be elevated in Delta source waters. Salinity may be elevated during dry runoff years. None of the other constituents was found at concentrations above the State or federal maximum contaminant levels (MCLs) for finished drinking water.
Figure A Location of MWQI monitoring stations, 2001–2003

MWQI Summary and Findings from Data Collected Oct 2001 through Sep 2003 ES-3 Executive Summary
Organic Carbon Organic carbon in the Delta and its tributaries differed both seasonally and spatially (Figure B). Median total organic carbon (TOC) for the American and Sacramento River stations north of the Delta was 2 mg/L or less, whereas median TOC for the SJR near Vernalis was 3.7 mg/L. The median TOC at Mallard Island was 2.4 mg/L, which was different from concentrations from either the Sacramento River or SJR stations, reflected the multiple sources of water at this station. The 2 Delta channel stations—Old River at Station 9 and Old River at Bacon Island—and the 3 diversion stations—Banks Pumping Plant, DMC, and Contra Costa Pumping Plant #1—receive water from both the SJR and the Sacramento River. Despite dilutional effects of water from the Sacramento River, median TOC concentrations for these stations ranged from 3.2 to 3.5 mg/L, which were close to that of the SJR near Vernalis station, suggesting that additional sources of organic carbon exist. Agricultural drainage and in-channel production are probable sources of organic carbon. Compared with the previous summary period (1998–2001), median TOC concentrations of most stations did not change significantly except for the SJR near Vernalis station, where median TOC concentration increased about 19%. Seasonal patterns of organic carbon concentrations differed between tributary and channel stations. At each tributary station, organic carbon was generally significantly higher during the wet months than during the dry months. Seasonal patterns at the 2 Delta channel stations and at the 3 diversion stations differed from those at SJR and the Sacramento River stations, further indicating additional organic carbon sources. Bromide The data confirmed findings from MWQI’s previous summary report that bromide in Delta waters came primarily from seawater. Bromide concentrations were higher at those stations closer to seawater influence than away from seawater influence (Figure C). Of the 11 stations, the Mallard Island station is the closest to the bay and had the highest median bromide (2.00 mg/L) of all stations (Figure C). The SJR near Vernalis had the second highest bromide concentrations with a median of 0.3 mg/L. Elevated bromide in the SJR was attributable to agricultural drainage returns, which are indirectly influenced by seawater. Agricultural lands in the San Joaquin Valley have been irrigated with water diverted from the Delta through the DMC, which contains considerable bromide (Figure C). Bromide and other salts in irrigation waters are concentrated and discharged to the SJR where they re-enter the Delta and mix with waters being diverted into the DMC. Soils in some areas developed from old marine deposits with high levels of bromide, which may be concentrated on the soil surface, and were washed into the river during wet months of low to moderate rainfall. In some areas, shallow groundwater carries high levels of bromide and moves into the SJR through seepage. Therefore, bromide levels in the SJR and Delta channels were elevated.
Figure B Total organic carbon: range (median), unit (mg/L)
Figure C Bromide: range (median), unit (mg/L)

MWQI Summary and Findings from Data Collected Oct 2001 through Sep 2003 ES-4 Executive Summary
Median bromide concentrations at the diversion stations ranged from 0.15 to 0.22 mg/L (Figure C). The stations at the north end of the Delta are not influenced by seawater; therefore, bromide concentrations were either very low or below its reporting limit of 0.01 mg/L (Figure C). Urban discharges and runoff from the watersheds in the Sacramento Valley were not significant sources of bromide in Delta waters because bromide concentrations were low in waters of the American and Sacramento rivers and the Natomas East Main Drainage Canal. Compared with the previous summary period, median bromide concentrations remained unchanged except at the Contra Costa Pumping Plant #1 and the SJR near Vernalis station, where median bromide concentrations were significantly higher. The lower bromide levels at Contra Costa Pumping Plant #1 and the SJR near Vernalis were due to the greater runoff amounts in the watersheds during the previous summary period. Seasonal patterns of bromide differed from those of organic carbon. Unlike organic carbon, bromide loads do not increase with high precipitation from the Sacramento Valley; precipitation dilutes bromide concentrations. However, precipitation in the San Joaquin Valley may increase loads because rain flushes salts from the soils into the SJR. High Delta outflows lower bromide levels at seawater-affected stations such as Mallard Island and nearby stations. During the reporting period, Delta outflows in 2003 water year were higher than in 2002 WY, and bromide concentrations at Mallard were kept low from January to August 2003. Freshwater outflow not only keeps seawater from entering the Delta, it also dilutes bromide already present in the waters. Therefore, bromide levels were lower during wet years when outflows were greater and significantly higher during dry or critical water years when Delta outflows were less. Salinity Seawater influence was the primary source of salinity throughout the western Delta as indicated by the high median electrical conductivity (EC) and the wide EC range at Mallard Island (Figure D). Among the river stations, EC of SJR water was significantly higher than in waters from the American and Sacramento rivers. This was apparently due to the high level of salts in the irrigation returns from the San Joaquin Valley and recirculation of salts from the Delta, into the San Joaquin Valley through the DMC, then back to the Delta through the SJR. EC was significantly lower at Delta channel and diversion stations than at the SJR due to the dilutional effects of water from the Sacramento River. Median EC at the Delta channel stations ranged from 285 to 324 µS/cm (Figure D). EC became higher at the diversion stations, especially at the DMC (Figure D). In addition to seawater intrusion, EC in Delta waters is also affected by sources that include watershed runoff, urban discharges, and agricultural drainage. Salinity loads from the watersheds were significant during the wet months, especially after each of the first few major rain events.
Figure D Electrical conductivity: range (median), unit: (µS/cm)

MWQI Summary and Findings from Data Collected Oct 2001 through Sep 2003 ES-5 Executive Summary
Other Constituents During the 2-year reporting period, MWQI monitored constituents known either to have adverse human health effects or to affect taste, odor, or appearance of finished drinking water. Monitoring was at the diversion stations. Of all the constituents monitored, none was found at concentrations above the State or federal MCLs (Table A). The highest concentrations of lead, selenium, chromium, arsenic, iron, manganese, copper, and zinc never exceeded the objectives specified in “Article 19 Water Quality” of the Standard Provisions for Water Supply Contract.
Table A Inorganic and miscellaneous constituents

MWQI Summary and Findings from Data Collected Oct 2001 through Sep 2003 ES-6 Executive Summary
Figure A Location of MWQI monitoring stations, 2001–2003

MWQI Summary and Findings from Data Collected Oct 2001 through Sep 2003 ES-7 Executive Summary
Figure B Total organic carbon: range (median), unit (mg/L)

MWQI Summary and Findings from Data Collected Oct 2001 through Sep 2003 ES-8 Executive Summary
Figure C Bromide: range (median), unit (mg/L)

MWQI Summary and Findings from Data Collected Oct 2001 through Sep 2003 ES-9 Executive Summary
Figure D Electrical conductivity: range (median), unit: (µS/cm)

MWQI Summary and Findings from Data Collected Oct 2001 through Sep 2003 ES-10 Executive Summary
Table A Inorganic and miscellaneous constituents Constituents Findings Regulation compliance
Constituents with adverse effects on human health
Aluminum Never detected at or above reporting limits
Never exceeded State or federal MCL of 0.2 mg/L
Antimony, cadmium, and lead
Never detected at or above reporting limits Never exceeded federal primary MCL
Arsenic Detected at or above reporting limit in all 48 samples; range: 0.001–to 0.003 mg/L; median: 0.002 mg/L
Never exceeded federal MCL of 0.01 mg/L
Barium Of 40 samples collected at diversion stations, 15 samples were found at the reporting limit at or above 0.05 mg/L (38%) range:0.05-0.06; median:0.06
Never exceeded federal MCL of 2 mg/L or DHS MCL of 1 mg/L
Chromium (total) Detected at or above reporting limit in 44 out of 48 samples (92%); range: 0.001–0.009 mg/L; median: 0.003 mg/L
Never exceeded federal MCL of 0.1 mg/L or DHS MCL of 0.05 mg/L
Copper Detected at or above reporting limit in all 48 samples collected at 2 diversion stations; range: 0.001–0.009 mg/L; median: 0.002 mg/L
Never exceeded State or federal MCL of 1.0 mg/L
Mercury Of 41 samples, none was found at or above reporting limit of 0.0002 mg/L
Never exceeded federal MCL of 0.002 mg/L
Nickel Detected at or above reporting limit in 44 of 46 samples (96%); range: 0.001–0.003; median: 0.001 mg/L
Never exceeded DHS MCL of 0.1 mg/L
Nitrate+Nitrite (as N) Detected in all 24 samples at Banks; range: 0.13–1.7 mg/L, median: 0.53 mg/L
Never exceeded DHS MCL of 10 mg/L
Selenium Detected at or above reporting limit in 9 of 24 samples (38%); range: 0.001–0.002 mg/L; median: 0.001
Never exceeded federal MCL of 0.05 mg/L
Constituents with adverse effects on taste, odor, or appearance
Iron Detected at or above reporting limit in 24 of 48 samples collected at 2 diversion stations (50%); range: 0.005–0.085 mg/L; median: 0.02 mg/L
Never exceeded federal MCL of 0.3 mg/L
Manganese Detected at or above reporting limit in 22 of 48 samples collected at 2 diversion stations (46%); range: 0.006–0.028 mg/L, median: 0.01 mg/L
Never exceeded federal MCL of 0.05 mg/L
Silver Never detected at or above reporting limit in any of the 40 samples collected at 2 diversion stations
Never exceeded federal MCL of 0.1 mg/L
Zinc Detected at or above reporting limit in 2 out of 48 samples collected at 2 diversion stations (4%) Range:0.005 -0.015
Never exceeded federal MCL of 5 mg/L

MWQI Summary and Findings from Data Collected Oct 2001 through Sep 2003 1-i Chapter 1 Introduction
Chapter 1 Introduction
Contents Chapter 1 Introduction............................................................................................. 1-1
Overview ............................................................................................................. 1-1 Monitoring Stations ............................................................................................. 1-2 Program Changes................................................................................................. 1-3 Frequently Used Terms ....................................................................................... 1-4
Figure
Figure 1-1 Location of MWQI monitoring stations, 2001–2003............................ 1-5
Table Table 1-1 MWQI monitoring stations, 2001–2003................................................. 1-6
Chapter 1 figures and tables

MWQI Summary and Findings from Data Collected Oct 2001 through Sep 2003 1-1 Chapter 1 Introduction
Chapter 1 Introduction
Overview This report summarizes and interprets monitoring data collected by the Municipal Water Quality Investigations Program of the Department of Water Resources (DWR) from October 1, 2001, to September 30, 2003. The previous MWQI report was completed in July 2003 and summarized data collected from August 1998 through September 2001 (DWR 2003). Data were collected from 11 MWQI stations in or near the Sacramento-San Joaquin Delta (the Delta). An extensive number of water quality constituents were analyzed for each sample, but only those constituents that are of most concern to drinking water quality are presented in this report. Selection of constituents is based on findings from previous reports and feedback from the MWQI committee represented by urban State Water Contractors. Water quality constituents of limited concern to SWCs are discussed only for selected stations. Major water quality constituents examined in this report include organic carbon, bromide, salinity, regulated organic and inorganic constituents in drinking water, and a few unregulated constituents of current interest. MWQI resumed nutrient monitoring at most stations beginning November 2002. Nutrient data collected during this reporting period are presented in a separate chapter. Statistical analyses in this report are not as extensive as they were in the previous summary report, but some basic statistics, seasonal patterns, and brief discussions on sources of some constituents are presented. The raw data for all examined constituents are available both online and on a CD-ROM (see Appendix A). Neither this nor the previous report discusses water quality in the context of drinking water standards because source waters are not regulated to meet standards for finished drinking water. However, at some Delta diversion stations, certain constituents are discussed in the context of existing State and federal drinking water regulations and water quality objectives specified in the long-term water supply contracts between DWR and each SWC. This report does not present the details of the regulations, standards, or provisions; the regulations and standards may be found in Chapter 2 of Sanitary Survey Update Report 2001 (DWR 2001). The Standard Provisions for Water Supply Contract between DWR and the SWCs is available from the Project Water Contracts Unit, State Water Project Analysis Office of DWR. Interpretations in this report are based on either monthly or weekly grab sampling data. Results and interpretations from grab sampling data, especially monthly data, have limitations in explaining spatial and seasonal patterns in the Delta, given its complex hydrology. Therefore, MWQI collaborated with DWR’s Modeling Section to develop computer models using grab sampling data and hydrologic information, particularly at tidally influenced locations. Progress made by DWR modelers may be found at: http://modeling.water.ca.gov/branch/reports.html. MWQI is committed to
Appendix A

MWQI Summary and Findings from Data Collected Oct 2001 through Sep 2003 1-2 Chapter 1 Introduction
the use of modeling tools to provide more extensive interpretations of its monitoring data and to enable water quality forecast to be made.
Monitoring Stations Geographic locations of the 11 monitoring stations are presented in Figure 1-1. During the reporting period, MWQI collected samples at 9 stations; the Division of Operations and Maintenance (O&M) of DWR collected samples for MWQI at the Banks and Delta-Mendota Canal (DMC) stations. Samples were generally taken monthly; but samples were collected weekly at the Hood station on the Sacramento River and the San Joaquin River (SJR) near Vernalis station (Table 1-1). Starting November 2001, weekly sampling was increased to 6 stations during wet months, which were sampled for turbidity, electrical conductivity, alkalinity, total organic carbon (TOC), dissolved organic carbon (DOC), and bromide (Table 1-1). With approval of the MWQI committee, MWQI discontinued monitoring Delta drainage stations during this reporting period. MWQI has collected extensive historical grab sampling data from drainage sites throughout the Delta. However, accurate estimates of salt and organic carbon loads have proven to be difficult, and the value of continuing to take grab samples from drainage sites is questionable. However, MWQI will consider conducting special studies on drainage sites in the future. For this report, the 11 sampling stations were divided into 5 functional groups for discussion purposes (Table 1-1). Stations within each group are either geographically or hydrologically related except for the Natomas East Main Drainage Canal station, which is an urban drainage tributary to the Sacramento River (Table 1-1). MWQI is now conducting a special study on NEMDC. Therefore, data from NEMDC will be briefly discussed and presented separately from most other stations. Although the Old River at Station 9 is treated as a channel station in this report, Contra Costa Water District (CCWD) has an intake very close to this station. The Mallard Island station is traditionally considered a station on the Sacramento River. However, it receives water from both the SJR and the Sacramento River, and it is affected by waters from the San Francisco and Suisun bays. CCWD has an intake at Mallard Slough, which is close to MWQI’s Mallard Island monitoring station. CCWD operates this intake only when Delta outflows are high and chloride concentrations are below regulatory limits. The Mallard Island station shows the most seawater influence of all the Delta stations. When Delta outflows are low during dry runoff years or during dry months of each year, water quality (electrical conductivity and bromide in particular) at this station reflects a mixture of fresh and marine waters and, thus, is an indicator of water quality that may be affecting Delta diversion stations. Therefore, water quality at this station is also discussed separately throughout this report.
Table 1-1 MWQI monitoring stations, 2001–2003
Figure 1-1 Location of MWQI monitoring stations, 2001–2003

MWQI Summary and Findings from Data Collected Oct 2001 through Sep 2003 1-3 Chapter 1 Introduction
Program Changes
During the reporting period, MWQI made some changes to increase monitoring frequency and improve data quality and site access. Monitoring frequency at 6 stations was increased from monthly to weekly from November 1 to April 30 of each year. The increased monitoring served as a temporary alternative to real-time carbon and anion data while awaiting construction and installation of planned real-time monitoring facilities at key stations. When the real-time stations and analyzers are in service, the need for increased grab sampling will be re-evaluated. For the weekly samples, turbidity, electric conductivity, alkalinity, TOC, DOC, and bromide were analyzed. The standard minerals were not included in the weekly samples because historical data have shown these parameters are of less concern in Delta source waters and monthly sampling data are sufficient. Following a recommendation in the previous data report (DWR 2003a), MWQI resumed nutrient monitoring in November 2002. Initial monitoring has been monthly, but may be expanded in both frequency and locations, depending on the data collected during this period. The objective of this phase of sampling is to collect nutrient data at key stations for examination of seasonal and spatial trends. More extensive sampling may be conducted to study the effects of nutrients on in-channel production of organic carbon and the interrelationships between nutrient fluxes and organic carbon levels, especially during the summer months. MWQI relocated the station in Old River at Bacon Island to improve quality of data collected there. Prior to January 2002, samples were taken behind an agricultural processing plant. The sampling point was approximately 20 feet from the river bank within riparian plants that prevented free waterflow. In addition, boating activities in Old River stirred up river sediments, causing the water to become cloudy and potentially nonrepresentative of that site. In order to take a more representative sample, MWQI moved the station approximately 300 feet downstream to a mail boat dock, which extends about 25 feet into Old River. The new sampling site is free of riparian vegetation and less susceptible to disturbances from passing boats. Thus, a more representative sample can be taken.

MWQI Summary and Findings from Data Collected Oct 2001 through Sep 2003 1-4 Chapter 1 Introduction
Frequently Used Terms
This report uses certain abbreviations, acronyms, and terminology. A list of acronyms and abbreviations is at the front of this report. Some frequently used terms and abbreviations are defined here: Water year or WY: The period from October 1 of one calendar year to September 30 of the following calendar year is called a water year. The year number is the latter of the 2 calendar years; for example, 2002 WY runs from October 1, 2001, to September 30, 2002. Wet months: November 1 to April 30 of each water year Dry months: May 1 to October 31 of each calendar year Dry Year, Below Normal Year, and Above Normal Year: Runoff year types indicating low, moderately high, and high total unimpaired runoff in a watershed, respectively, as defined in http://cdec.water.ca.gov/cgi-progs/iodir/wsihist. NEMDC: Natomas East Main Drainage Canal SJR: San Joaquin River Banks Pumping Plant: Harvey O. Banks Pumping Plant Headworks monitoring station at the start of the California Aqueduct Contra Costa Pumping Plant (CCPP#1): Contra Costa Water District Pumping Plant #1 DMC at McCabe Road: A sampling site along the Delta-Mendota Canal at mile 67.2 about 0.87 miles upstream of McCabe Road. Mile 0.00 of the DMC is at the diversion point from the Old River. Reporting period: The period from October 1, 2001, to September 30, 2003, which includes 2 water years. Thus, “the reporting period” may also be referred to as “the 2 water years” throughout the report. VAMP: Vernalis Adaptive Management Plan is mandated by State Water Resources Control Board Decision 1641. From April 15 to May 15, reservoir releases to the SJR are increased, and temporary barriers are installed to increase the survival of juvenile Chinook salmon in their migration to the ocean. p-value and statistical significance: In this report, the p-value, or p in short, is reported whenever a statistical comparison is made. The p-value is a computed probability value used in combination with a prescribed level of significance (α) to declare if a test is statistically significant. The smaller the p-value, the stronger is the evidence supporting statistical significance. This report uses a commonly accepted α value of 5%, or α = 0.05. If the p-value is < 0.05, the statistical test is declared significant; otherwise, the test is declared not statistically significant. TKN: Total Kjeldahl nitrogen is total digestible organic nitrogen and excludes the inorganic nitrogen species such as ammonia, nitrate, and nitrite.

MWQI Summary and Findings from Data Collected Oct 2001 through Sep 2003 1-5Chapter 1 Introduction
Figure 1-1 Location of MWQI monitoring stations, 2001–2003

MWQI Summary and Findings from Data Collected Oct 2001 through Sep 2003 1-6Chapter 1 Introduction
Table 1-1 MWQI monitoring stations, 2001–2003
StationDWR station number
Monitoring frequency
American and Sacramento River stations
American River at E.A. Fairbairn WTPa
A0714010 Monthly / weekly (Nov-April) b
Sacramento River at West Sacramento WTP Intake A0210451 Monthly / weekly (Nov-April)
Sacramento River at Hood B9D82211312 Weekly
San Joaquin River stations
San Joaquin River near Vernalis B0702000 Weekly
Delta channel stations
Old River at Station 9 B9D75351342 Monthly / weekly (Nov-April)
Old River at Bacon Island B9D75811344 Monthly / weekly (Nov-April)
Delta diversion stations
Banks Pumping Plant KA000331 Monthly
Delta-Mendota Canal at McCabe Road DMC06716 Monthly
Contra Costa Pumping Plant B9591000 Monthly
Other stations
Mallard Island E0B80261551 Monthly
Natomas East Main Drainage Canal A0V83671280 Monthly / event-based c (Nov-April)
a. WTP = water treatment plant. b. Weekly sampling from November through April for turbidity, electrical conductivity, alkalinity, TOC, DOC, and bromide. c. Monitoring approximately weekly depending on storm events.

MWQI Summary and Findings from Data Collected Oct 2001 through Sep 2003 2-iChapter 2 Data Collection and Analysis
Chapter 2 Data Collection and Analysis
Contents Chapter 2 Data Collection and Analysis.................................................................. 2-1
Sample Collection................................................................................................ 2-1 Laboratory Analysis ............................................................................................ 2-2 Data Quality......................................................................................................... 2-2 Statistical Analysis .............................................................................................. 2-2 Descriptive Plots.................................................................................................. 2-3 Nonparametric Statistical Methods...................................................................... 2-3
Tables
Table 2-1 MWQI water sample collection and preservation .................................. 2-4 Table 2-2 Analytical methods and reporting limits for included constituents ........ 2-6
Chapter 2 tables

MWQI Summary and Findings from Data Collected Oct 2001 through Sep 2003 2-1 Chapter 2 Data Collection and Analysis
Chapter 2 Data Collection and Analysis
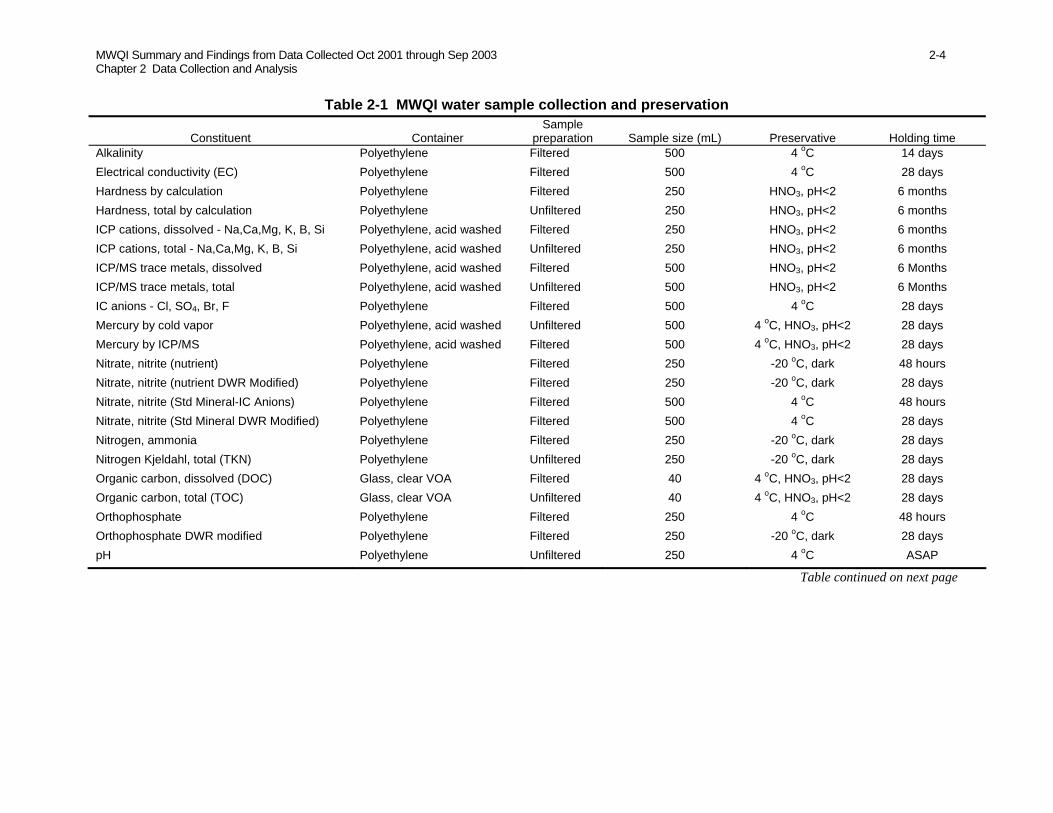
Sample Collection The Municipal Water Quality Investigations (MWQI) Field Support Group collected samples at 9 of the 11 stations. The Division of Operations and Maintenance of the Department of Water Resources (DWR) collected samples at the Banks and Delta-Mendota Canal stations. Because samples from all stations cannot be collected within one day due to distances between stations and differences in sampling frequencies, samples at the sites were collected on 2 to 3 different one-day sampling runs within one week’s period, with each sampling day covering a group of geographically close stations or stations with the same sampling frequency. A set of sample documentation forms was generated for each site before each sample run. These forms included a Sample Submission Form and a Test Request Form, which contained site information, sample description, an automatically assigned sample number, and the requested laboratory and field tests. The forms were generated from a Field and Laboratory Information Management System (FLIMS), an automatic laboratory information, data tracking, and management system. MWQI field staff also use FLIMS to prepare sample containers and preservation methods. DWR’s Bryte Chemical Laboratory supplied all necessary sampling materials to MWQI Field Support Group and performed all laboratory analyses. Bryte Laboratory’s requirements for sample containers, preservation techniques, and sample holding times for the included constituents are summarized in Table 2-1. Samples were collected from each site approximately 3 feet below the surface. At stations with a sample collection platform, a stainless steel bucket was used to collect the sample. At stations without a platform, a round, 2-liter, stainless steel container attached to the end of a 15-foot extension pole was used to collect the sample; in this case, 4 or 5 subsamples were combined to make a composite sample. All samples were prepared and filtered, when necessary, onsite in a specially equipped mobile laboratory van. Samples were preserved according to techniques listed in Table 2-1 and stored on ice inside an ice chest for transportation to Bryte Laboratory. Certain field measurements were also taken onsite, but these measurements are generally not included in this report. However, certain onsite measurements were useful during internal data audits when laboratory data for the same measurements seemed questionable. Large discrepancies between field and laboratory values occasionally triggered corrective action in the laboratory. Chapter 10 has discussion and details about corrective actions made on data in this report. For quality control purposes, the MWQI Field Support Unit regularly collects quality assurance/quality control samples according to QA/QC requirements established within DWR. These samples included equipment blanks, field blanks, and duplicate site samples. QA/QC samples were processed in the same manner as regular grab samples.
Table 2-1 MWQI water sample collection and preservation

MWQI Summary and Findings from Data Collected Oct 2001 through Sep 2003 2-2 Chapter 2 Data Collection and Analysis
Laboratory Analysis Bryte Chemical Laboratory, a fully certified environmental laboratory in West Sacramento, analyzed all samples for the constituents in this report. The methods and reporting limits for the included constituents are summarized in Table 2-2. Samples were submitted to the laboratory on the same day of collection. The sample container was labeled with FLIMS-generated sample labels indicating the sample identification number and other required information. After the samples and necessary forms were cross-checked and verified, the receiving clerk at Bryte signed and dated the Test Request Forms with a copy to the sampler. All samples received by the laboratory were placed in appropriate storage cabinets or refrigerators for various sample types (that is, metals, standard minerals, etc.) or sent directly to the test area. All pertinent field information—including date, time, location, sampling personnel, field measurements, requested laboratory tests, and additional information—was logged into and tracked by FLIMS after sample collection. Following data login, FLIMS notified laboratory personnel of the samples to be analyzed. The samples were then processed within an allowed holding time (Table 2-1). Analytical results were entered into FLIMS, which is connected to the DWR Water Data Library (WDL), the destination database for all MWQI monitoring data.
Data Quality Once analyses were completed, the remaining sample was kept for 30 to 60 days in storage before being discarded. Sample retention is necessary for evaluating and ensuring acceptable results. Bryte Laboratory follows a set of internal QA/QC audit procedures, which include evaluation of data for blanks (laboratory and field), calibration standards, laboratory control samples, etc. The detailed QA/QC procedures and corrective actions have been described in Bryte Laboratory’s latest QA technical documentation (Fong 2002). The QA/QC Unit of the Office of Water Quality performs data quality checks routinely on data in WDL. Results of data quality evaluations for constituents included in this report are presented in Chapter 10. In this report, constituents at concentrations below their reporting limits are treated as “nondetect” and are not included in the summary statistics (discussed below). During the reporting period, occasional method changes occurred for some constituents due to adoption of improved techniques, equipment failures, or staff limitations. Constituents that may be analyzed by more than one method are shown in Table 2-2. To minimize discrepancy of data resulting from method changes, this report included data from a single method for each constituent.
Statistical Analysis Unlike the previous summary report (DWR 2003a), this report’s statistical analyses are less extensive, typically including summary statistics and some nonparametric comparisons. Most data are presented in descriptive graphics. Summary statistics were computed using Microsoft Excel. Nonparametric statistical comparisons were made using Minitab, Release 13.
Table 2-2 Analytical methods and reporting limits for included constituents

MWQI Summary and Findings from Data Collected Oct 2001 through Sep 2003 2-3 Chapter 2 Data Collection and Analysis
The following summary statistics will be presented in tabular forms for each constituent: • Data range: data between the minimum and the maximum. • Mean: presented mostly for historical reasons. Skewed data of wide
variability such as water quality data should not be averaged because the mean is usually strongly influenced by data at both ends and is often misleading.
• Median: more resistant measure for water quality data, thus a generally preferred measure over the mean.
Descriptive Plots
Descriptive plots are mostly in the form of temporal graphs. Monthly or weekly data are plotted with time to demonstrate general behavior of the data during the reporting period. Data interpretations are generally based on these bar or scatter plots for seasonal differences, which demonstrate the influences of constituent sources during a given time period.
Nonparametric Statistical Methods The majority of monitoring data for the included constituents was not normally distributed, thus parametric statistical methods may not be robust. When necessary, a nonparametric test—the Mann-Whitney test (also called the Wilcoxon Rank-sum test)—was used for comparisons of medians among stations. These distribution-free tests are as powerful as their parametric equivalents for most water quality data, but do not require normal data distribution or data transformation.
MWQI Summary and Findings from Data Collected Oct 2001 through Sep 2003 2-4 Chapter 2 Data Collection and Analysis
Table 2-1 MWQI water sample collection and preservation
Constituent Container Sample
preparation Sample size (mL) Preservative Holding time Alkalinity Polyethylene Filtered 500 4 oC 14 days Electrical conductivity (EC) Polyethylene Filtered 500 4 oC 28 days Hardness by calculation Polyethylene Filtered 250 HNO3, pH<2 6 months Hardness, total by calculation Polyethylene Unfiltered 250 HNO3, pH<2 6 months ICP cations, dissolved - Na,Ca,Mg, K, B, Si Polyethylene, acid washed Filtered 250 HNO3, pH<2 6 months ICP cations, total - Na,Ca,Mg, K, B, Si Polyethylene, acid washed Unfiltered 250 HNO3, pH<2 6 months ICP/MS trace metals, dissolved Polyethylene, acid washed Filtered 500 HNO3, pH<2 6 Months ICP/MS trace metals, total Polyethylene, acid washed Unfiltered 500 HNO3, pH<2 6 Months IC anions - Cl, SO4, Br, F Polyethylene Filtered 500 4 oC 28 days Mercury by cold vapor Polyethylene, acid washed Unfiltered 500 4 oC, HNO3, pH<2 28 days Mercury by ICP/MS Polyethylene, acid washed Filtered 500 4 oC, HNO3, pH<2 28 days Nitrate, nitrite (nutrient) Polyethylene Filtered 250 -20 oC, dark 48 hours Nitrate, nitrite (nutrient DWR Modified) Polyethylene Filtered 250 -20 oC, dark 28 days Nitrate, nitrite (Std Mineral-IC Anions) Polyethylene Filtered 500 4 oC 48 hours Nitrate, nitrite (Std Mineral DWR Modified) Polyethylene Filtered 500 4 oC 28 days Nitrogen, ammonia Polyethylene Filtered 250 -20 oC, dark 28 days Nitrogen Kjeldahl, total (TKN) Polyethylene Unfiltered 250 -20 oC, dark 28 days Organic carbon, dissolved (DOC) Glass, clear VOA Filtered 40 4 oC, HNO3, pH<2 28 days Organic carbon, total (TOC) Glass, clear VOA Unfiltered 40 4 oC, HNO3, pH<2 28 days Orthophosphate Polyethylene Filtered 250 4 oC 48 hours Orthophosphate DWR modified Polyethylene Filtered 250 -20 oC, dark 28 days pH Polyethylene Unfiltered 250 4 oC ASAP
Table continued on next page

MWQI Summary and Findings from Data Collected Oct 2001 through Sep 2003 2-5 Chapter 2 Data Collection and Analysis
Table 2-1 continued
Constituent Container Sample
preparation Sample size (mL) Preservative Holding time Phosphorous, total Polyethylene Unfiltered 250 -20 oC, dark 28 days Solids, total dissolved (TDS) Polyethylene Filtered 500 4 oC 7 days Turbidity Polyethylene Unfiltered 500 4 oC 48 hours UVA Polyethylene Filtered 250 4 oC 14 days Volatile organic analysis (MTBE, etc.) Glass, amber VOA Unfiltered 40, X 2, Teflon, no air 4 oC, HCl, pH<2 14 days
Note: Condensed from Appendix A, Bryte Chemical Laboratory Quality Assurance Manual (Fong 2002). ext = extraction

MWQI Summary and Findings from Data Collected Oct 2001 through Sep 2003 2-6 Chapter 2 Data Collection and Analysis
Table 2-2 Analytical methods and reporting limits for included constituents Constituent Method source a Method number Reporting limit b
Total organic carbon (TOC) Std Methods 5310-D, Wet oxidation, IR, automated 0.1
EPA 415.1 Wet oxidation, IR, automated 0.1
Dissolved organic carbon (DOC) EPA 415.1 Wet oxidation, IR, automated 0.1
UV absorbance at 254 nm Std Methods 5910-B UV-absorbing organics 0.001 cm-1
Bromide 300.0 ion chromatography 0.01
Electrical conductivity (EC) Std Methods 2310-B Wheatstone Bridge 1 µS/cm
EPA 120.1 Wheatstone Bridge 1 µS/cm
Total dissolved solids (TDS) Std Methods 2540-C Gravimetric, dried at 180° C 1
EPA 160.1 Gravimetric, dried at 180° C 1
Chloride Std Methods 4500-Cl-E Colorimetric, Ferricyanide 1
Sulfate 375.2 Colorimetric, Methythymol Blue 1
300.0 Ion Chromatography 1
Calcium EPA 215.1AA Flame 1
200.7 ICP 1
Magnesium 242.1 AA Flame 1
200.7 ICP 1
Sodium 273.1 AA Flame 1
200.7 ICP 1
pH Std Methods 4500-H+ Electrometric 0.1 pH unit
EPA 150.1 Electrometric 0.1 pH unit
Alkalinity Std Methods 2320-B Titrimetric 1
EPA 310.1 Titrimetric 1
Hardness Std Methods 2340 B total by calculation
Turbidity 2130-B Nephelometric 1 NTU
EPA 180.1 Nephelometric 1 NTU
Note: Condensed from Appendix A of Bryte Chemical Laboratory Quality Assurance Manual (Fong 2002). a. Std Methods = “Standard Methods for the Examination of Water and Wastewater,” 1995. 19th ed. Eaton AD, Clesceri LS, Greenberg AE, Franson MAH, editors. Prepared and published jointly by American Public Health Association, American Water Works Association, Water Environment Federation. Washington, DC: American Public Health b. Unit is mg/L unless otherwise indicated.
Table continued on next page

MWQI Summary and Findings from Data Collected Oct 2001 through Sep 2003 2-7 Chapter 2 Data Collection and Analysis
Table 2-2 continued Constituent Method sourcea Method number Reporting limitb Aluminum EPA 200.7 ICP 0.05
200.8 ICP/MS 0.01
200.9 GFAA 0.01
Antimony EPA 200.7 ICP 0.025
200.8 ICP/MS 0.001
Arsenic Std Methods 3114 (4d), AA gaseous hybride 0.001
EPA 200.7 ICP 0.05
200.8 ICP/MS 0.001
Barium EPA 200.7 ICP 0.01
200.8 ICP/MS 0.05
200.9 GFAA 0.05
208.2 GFAA 0.05
Boron USGS I-2115-85 Colorimetric, Azomethine 0.1
Cadmium EPA 200.7 ICP 0.01
200.8 ICP/MS 0.001
200.9 GFAA 0.005
213.2 GFAA 0.005
Total chromium (all valencies) EPA 200.7 ICP 0.02
200.8 ICP/MS 0.005
200.9 GFAA 0.005
218.2 GFAA 0.005
Cobalt EPA 200.7 ICP 0.02
200.8 ICP/MS 0.005
200.9 GFAA 0.005
219.2 GFAA 0.005
Copper EPA 200.7 ICP 0.02
200.8 ICP/MS 0.001
200.9 GFAA 0.005
220.1 AA Flame 0.1
220.2 GFAA 0.005
Note: Condensed from Appendix A of Bryte Chemical Laboratory Quality Assurance Manual (Fong 2002). a. Std Methods = “Standard Methods for the Examination of Water and Wastewater,” 1995. 19th ed. Eaton AD, Clesceri LS, Greenberg AE, Franson MAH, editors. Prepared and published jointly by American Public Health Association, American Water Works Association, Water Environment Federation. Washington, DC: American Public Health b. Unit is mg/L unless otherwise indicated.
Table continued on next page

MWQI Summary and Findings from Data Collected Oct 2001 through Sep 2003 2-8 Chapter 2 Data Collection and Analysis
Table 2-2 continued Constituent Method sourcea Method number Reporting limitb Iron EPA 200.7 ICP 0.025
200.8 ICP/MS 0.005
200.9 GFAA 0.005
236.1 AA Flame 0.1
236.2 GFAA 0.005
Lead EPA 200.7 ICP 0.05
200.8 ICP/MS 0.001
200.9 GFAA 0.005
239.2 GFAA 0.005
Manganese EPA 200.7 ICP 0.01
200.9 GFAA 0.005
243.1 AA Flame 0.1
243.2 GFAA 0.005
Mercury EPA 245.1 AA, Flameless, cold vapor 0.001
Molybdenum EPA 200.7 ICP 0.02
200.8 ICP/MS 0.005
200.9 GFAA 0.005
246.2 GFAA 0.005
Nickel EPA 200.7 ICP 0.025
200.8 ICP/MS 0.001
200.9 GFAA 0.005
249.1 AA Flame 0.1
249.2 GFAA 0.005
Selenium Std Methods 3114B AA gaseous hydride 0.001
EPA 200.8 ICP/MS 0.001
Silver EPA 200.7 ICP 0.025
200.8 ICP/MS 0.001
200.9 GFAA 0.005
272.2 GFAA 0.005
Note: Condensed from Appendix A of Bryte Chemical Laboratory Quality Assurance Manual (Fong 2002). a. Std Methods = “Standard Methods for the Examination of Water and Wastewater,” 1995. 19th ed. Eaton AD, Clesceri LS, Greenberg AE, Franson MAH, editors. Prepared and published jointly by American Public Health Association, American Water Works Association, Water Environment Federation. Washington, DC: American Public Health b. Unit is mg/L unless otherwise indicated.
Table continued on next page

MWQI Summary and Findings from Data Collected Oct 2001 through Sep 2003 2-9 Chapter 2 Data Collection and Analysis
Table 2-2 continued Constituent Method sourcea Method number Reporting limitb Zinc EPA 200.7 ICP 0.02
200.8 ICP/MS 0.005
200.9 GFAA 0.005
289.1 AA Flame, Direct 0.1
289.2 GFAA 0.005
Ammonia Std Methods 4500-NH3 B, G Automated Phenate 0.01
EPA 350.1 Automated Phenate 0.01
Total Kjeldahl nitrogen EPA 351.2 Colorimetric, semi-automated 0.1
Nitrate Std Methods 4500-NO3-F Cd-Reduction 0.01
EPA 353.2 Cd-Reduction, Automated 0.01
Nitrite + nitrate EPA 353.2, Cd-Reduction, Automated 0.01
Orthophosphate Std Methods 4500-P-E Colorimetric, Ascorbic Acid 0.01
EPA 365.1 Colorimetric, Ascorbic Acid 0.01
Phosphorus, total EPA 365.4 Colorimetric, semi-automated 0.01
Note: Condensed from Appendix A of Bryte Chemical Laboratory Quality Assurance Manual (Fong 2002). a. Std Methods = “Standard Methods for the Examination of Water and Wastewater,” 1995. 19th ed. Eaton AD, Clesceri LS, Greenberg AE, Franson MAH, editors. Prepared and published jointly by American Public Health Association, American Water Works Association, Water Environment Federation. Washington, DC: American Public Health
b. Unit is mg/L unless otherwise indicated.

MWQI Summary and Findings from Data Collected Oct 2001 through Sep 2003 3-i Chapter 3 Delta Hydrology
Chapter 3 Delta Hydrology
Contents Chapter 3 Delta Hydrology...................................................................................... 3-1
Sacramento River Basin ...................................................................................... 3-1 San Joaquin River Basin...................................................................................... 3-1 Precipitation in the Sacramento and San Joaquin Valleys ................................... 3-2 Runoff Index........................................................................................................ 3-2 Reservoir Releases............................................................................................... 3-3 Delta Outflows..................................................................................................... 3-4 Delta Cross Channel Operations.......................................................................... 3-4 Vernalis Adaptive Management Plan .................................................................. 3-5 South Delta Temporary Barriers.......................................................................... 3-6
Figures
Figure 3-1 Location of selected weather stations ................................................... 3-8 Figure 3-2 Cumulated monthly precipitation (in inches) at six weather stations.... 3-9 Figure 3-3 Sacramento River watershed reservoir releases and Sacramento River
flow at Freeport ....................................................................................3-10 Figure 3-4 San Joaquin River watershed reservoir releases ..................................3-11 Figure 3-5 Daily flows at two Delta locations and calculated total Delta
outflow..................................................................................................3-12 Figure 3-6 South Delta temporary barriers ............................................................3-13
Tables Table 3-1 Summary of daily precipitation (in inches) at six weather stations.......3-14 Table 3-2 Summary of monthly precipitation (in inches) at six weather stations..3-14 Table 3-3 Hydrologic index classification based on measured unimpaired runoff at
selected rivers .......................................................................................3-15 Table 3-4 Delta Cross Channel operations ............................................................3-16 Table 3-5 Temporary barriers operating schedule .................................................3-17
Chapter 3 figures and tables

MWQI Summary and Findings from Data Collected Oct 2001 through Sep 2003 3-1 Chapter 3 Delta Hydrology
Chapter 3 Delta Hydrology
By Sarojini Balachandra and William J. McCune This chapter discusses hydrologic conditions affecting water quality in rivers and channels of the Sacramento-San Joaquin Delta (the Delta). Presented are precipitation in the contributing watersheds, flow data at 2 Delta locations, calculated total Delta outflow, and hydrologic classification indices for both Sacramento and San Joaquin Valleys. A brief discussion is also presented on hydrologic influences of reservoir releases to the Sacramento and San Joaquin rivers, Delta Cross Channel operations, and South Delta Improvements. Water quality at various stations is discussed in the context of Delta hydrologic conditions for the constituents included in the following chapters.
Sacramento River Basin Sacramento River is California’s longest river, stretching 384 miles from near Mount Shasta to its mouth in the Delta. As the river runs south, several major rivers drain into the Sacramento River. These tributaries include Pit, McCloud, Feather, Yuba, and American rivers. Part of the Trinity River flow is also diverted to the Sacramento River, which carries about 31% of the State’s total runoff water. The Sacramento River Basin consists of 6 physiographic provinces, namely the Sacramento Valley, the Coast Ranges, Klamath Mountains, Cascade Range, Sierra Nevada, and the Modoc Plateau. Of these, Sacramento Valley has the largest population and greatest demands for water for both domestic and agricultural uses. Precipitation in this region is unevenly distributed within each water year with most occurring during the wet winter months and little during the dry summer months. The eastern mountain ranges and high plateau regions of the Sacramento River Basin receive large amounts of winter snow. The snowmelt is collected in reservoirs near the head waters of the Sacramento River and all the major rivers that drain into it. These reservoirs provide waterflow during the dry summer months and flood control for the Sacramento Valley during the heavy rainfall period. Sacramento Valley has 2.1-million acres of irrigated farmlands. Forests and mines in the mountainous regions and the urban and agricultural areas in the Sacramento River Basin affect water quality of the river and the Delta.
San Joaquin River Basin The San Joaquin River is the second largest river in the State of California. It originates from Ansel Adams Wilderness in the Sierra Nevada and flows into the Central Valley. As the river flows north in the valley, it is joined by Merced River, Tuolumne River, Stanislaus River, Mokelumne River, and Consumnes River, which all originate from the Sierra Nevada. All these rivers and the San Joaquin River (SJR) have reservoirs above the valley to collect rain and snowmelt. These reservoirs provide water to the San Joaquin Valley during the summer months. The SJR finally flows into the Delta and then into Suisun Bay.

MWQI Summary and Findings from Data Collected Oct 2001 through Sep 2003 3-2 Chapter 3 Delta Hydrology
Precipitation in the Sacramento and San Joaquin Valleys
Six weather stations were selected to represent general precipitation patterns in the Delta and the watersheds tributary to the Delta. Figure 3-1 shows their locations relative to the Delta and the Sacramento River and SJR watersheds. The 3 northern stations—Redding Fire Station, Durham, and Sacramento Executive Airport are within the Sacramento Valley; the other 3 stations— Brentwood, Stockton Fire Station, and Madera—are in the San Joaquin Valley. Data for Redding Fire Station, Stockton Fire Station, and Sacramento Executive Airport were obtained from the Western Regional Climate Center in Reno, Nevada. Data for the remainder of the stations were from the California Irrigation Management Information System (CIMIS) of the California Department of Water Resources (DWR). The 3 stations within the Sacramento Valley (the northern stations) generally recorded more intense rain with a mean daily precipitation of 0.3 inches or more (Table 3-1), while the 3 stations in the San Joaquin Valley (the southern stations) experienced less rain with a mean daily precipitation of 0.24 inches or less (Table 3-1). During the 2-year reporting period, there were 161 rainy days at the Redding Fire Station and the highest daily precipitation was 3.07 inches; whereas there were 100 rainy days at Stockton Fire Station, and the highest daily rainfall was 1.50 inches. The southern stations recorded only a few days with more than one inch of rain; whereas northern stations recorded more days with rainfall above an inch (Table 3-1). Numbers of rainy months were similar in both Sacramento and San Joaquin Valley (Table 3-2). However, the monthly average and median precipitation was greater in the Sacramento Valley than in the San Joaquin Valley (Table 3-2). Cumulated precipitation in the 2002 Water Year was less than that of 2003 WY at Redding Fire Station, Durham, Stockton Fire Station, and Brentwood (Table 3-2). However, Sacramento Executive Airport in the Sacramento Valley and Madera in the San Joaquin Valley received more cumulated precipitation in 2002 than in 2003 (Table 3-2). Most rainfall occurred from November through May at all stations (Figure 3-2). Rainfall during the months of June, July, August, and September were negligible at all stations (Figure 3-2).
Runoff Index To classify the water years, the State Water Resources Control Board developed a hydrologic index based on the amount of unimpaired watershed runoff. The definition and method of calculating the index can be found in Water Right Decision 1641, revised March 15, 2000 (SWRCB 2000). Unimpaired runoff represents the natural water production of a river basin unaltered by upstream exports, storage, or diversion to or import of water from other basins. For the Sacramento River system, the index uses the total runoff (in millions of acre-feet) of Sacramento River at Bend Bridge, Feather River inflow to Lake Oroville, Yuba River at Smartville, and American River
Figure 3-1 Location of selected weather stations
Table 3-1 Summary of daily precipitation (in inches) at six weather stations
Table 3-2 Summary of monthly precipitation (in inches) at six weather stations
Figure 3-2 Cumulated monthly precipitation (in inches) at six weather stations
Sacramento Valley stations San Joaquin Valley stations
Stockton
02468
10121416
Oct
-01
Nov
-01
Dec
-01
Jan-
02Fe
b-02
Mar
-02
Apr
-02
May
-02
Jun-
02Ju
l-02
Aug
-02
Sep
-02
Oct
-02
Nov
-02
Dec
-02
Jan-
03Fe
b-03
Mar
-03
Apr
-03
May
-03
Jun-
03Ju
l-03
Aug
-03
Sep
-03
Prec
ipita
tion
Redding
02468
10121416
Oct
-01
Nov
-01
Dec
-01
Jan-
02Fe
b-02
Mar
-02
Apr-0
2M
ay-0
2Ju
n-02
Jul-0
2A
ug-0
2S
ep-0
2O
ct-0
2N
ov-0
2D
ec-0
2Ja
n-03
Feb-
03M
ar-0
3Ap
r-03
May
-03
Jun-
03Ju
l-03
Aug
-03
Sep
-03
Prec
ipita
tion
Durham
02468
10121416
Oct
-01
Nov
-01
Dec
-01
Jan-
02Fe
b-02
Mar
-02
Apr
-02
May
-02
Jun-
02Ju
l-02
Aug-
02Se
p-02
Oct
-02
Nov
-02
Dec
-02
Jan-
03Fe
b-03
Mar
-03
Apr
-03
May
-03
Jun-
03Ju
l-03
Aug-
03Se
p-03
Prec
ipita
tion
Brentwood
02468
10121416
Oct
-01
Nov
-01
Dec
-01
Jan-
02Fe
b-02
Mar
-02
Apr
-02
May
-02
Jun-
02Ju
l-02
Aug-
02Se
p-02
Oct
-02
Nov
-02
Dec
-02
Jan-
03Fe
b-03
Mar
-03
Apr
-03
May
-03
Jun-
03Ju
l-03
Aug-
03Se
p-03
Prec
ipita
tion
Madera
-4
1
6
11
16
Oct
-01
Nov
-01
Dec
-01
Jan-
02Fe
b-02
Mar
-02
Apr-0
2M
ay-0
2Ju
n-02
Jul-0
2A
ug-0
2S
ep-0
2O
ct-0
2N
ov-0
2D
ec-0
2Ja
n-03
Feb-
03M
ar-0
3Ap
r-03
May
-03
Jun-
03Ju
l-03
Aug
-03
Sep
-03
Pre
cipi
tatio
nSacramento Executive Airport
-4
1
6
11
16
Oct
-01
Nov
-01
Dec
-01
Jan-
02Fe
b-02
Mar
-02
Apr
-02
May
-02
Jun-
02Ju
l-02
Aug
-02
Sep
-02
Oct
-02
Nov
-02
Dec
-02
Jan-
03Fe
b-03
Mar
-03
Apr
-03
May
-03
Jun-
03Ju
l-03
Aug
-03
Sep
-03P
reci
pita
tion

MWQI Summary and Findings from Data Collected Oct 2001 through Sep 2003 3-3 Chapter 3 Delta Hydrology
inflow to Folsom Lake. The runoff for the San Joaquin River system is the total of Stanislaus River inflow to New Melones Reservoir, Tuolumne River inflow to New Don Pedro Reservoir, Merced River inflow to Lake McClure, and San Joaquin River inflow to Millerton Lake (SWRCB 2000). According to the runoff index system, 2002 WY was a dry year for both valleys, indicating that runoff was lower than normal (Table 3-3). The 2003 WY was above normal for the Sacramento Valley and below normal for the San Joaquin Valley (Table 3-3). The effect of precipitation and runoff on water quality at various stations is discussed in later chapters.
Reservoir Releases Runoff from the watersheds of the Sacramento River and SJR is a primary source of domestic water for many Californians, and it provides irrigation water for about 4-million acres of cropland. The domestic water is used year round, and the irrigation water is mostly used in the dry summer months. Because the majority of the precipitation in the watersheds occurs during winter months, precipitation during the wet months must be stored in reservoirs along the major rivers and streams in the watersheds. Monthly releases from major reservoirs on or tributary to the Sacramento River are in Figure 3-3. Water imported from the Trinity River is included with the Shasta Reservoir data. Releases from Oroville and New Bullards Bar Reservoirs are included in the Feather and Yuba rivers data. Total releases from these major reservoirs, including imports from the Trinity River, were approximately 9.439 million acre-feet in 2002 WY and 12.493 million acre-feet in the 2003 WY. Releases for 2003 WY were about 132% of those for 2002 WY. Releases from reservoirs in the SJR watershed are in Figure 3-4. The reservoirs included in the charts are New Melones Lake, New Hogan Reservoir, Camanche Reservoir, Millerton Lake, Lake McClure, and New Don Pedro Reservoir (Figure 3-4). Because precipitation is much higher in the Sacramento River watershed than in the SJR watershed, total releases from Sacramento reservoirs are much greater (Figures 3-3 and 3-4). In both 2002 WY and 2003 WY, the San Joaquin total reservoir releases during the months of April through September were more than 4 times greater than releases during October through March (Figure 3-4). The releases from Sacramento reservoirs also tended to be greater during the summer than the winter, but the pattern was not nearly as clear (Figure 3-3). Total releases from these San Joaquin Valley reservoirs were approximately 4.046 million acre-feet in 2002 WY and 4.081 million acre-feet in 2003 WY, indicating little year-to-year difference.
Table 3-3 Hydrologic index classification based on measured unimpaired runoff at selected rivers
Figure 3-4 San Joaquin River watershed reservoir releases
Figure 3-3 Sacramento River watershed reservoir releases and Sacramento River flow at Freeport
Sacramento River watershed reservoir releases
0
200000
400000
600000
800000
1000000
1200000
Oct
-01
Dec
-01
Feb-
02
Apr
-02
Jun-
02
Aug-
02
Oct
-02
Dec
-02
Feb-
03
Apr
-03
Jun-
03
Aug-
03
Month
Mon
thly
tota
ls (a
cre
feet
)
Shasta Reservoir and Trinity River imports Feather and Yuba River reservoirs Folsom Lake
Sacramento River flow at Freeport
0
10000
20000
30000
40000
50000
60000
70000
10/1
/200
1
12/1
/200
1
2/1/
2002
4/1/
2002
6/1/
2002
8/1/
2002
10/1
/200
2
12/1
/200
2
2/1/
2003
4/1/
2003
6/1/
2003
8/1/
2003
10/1
/200
3
Date
Flow
(cfs
)
0
20000
40000
60000
80000
100000
120000
140000
160000O
ct-0
1
Dec
-01
Feb-
02
Apr-
02
Jun-
02
Aug-
02
Oct
-02
Dec
-02
Feb-
03
Apr-
03
Jun-
03
Aug-
03
Date
Mon
thly
tot
al re
leas
e (a
cre
feet
)
New Melones Lake New Hogan Reservoir Camarche Reservoir
0
50000
100000
150000
200000
250000
300000
350000
Oct
-01
Dec
-01
Feb-
02
Apr
-02
Jun-
02
Aug
-02
Oct
-02
Dec
-02
Feb-
03
Apr
-03
Jun-
03
Aug
-03
Date
Mon
thly
tota
l re
leas
e (a
cre
feet
)
Millerton Lake Lake McClure Don Pedro Reservoir

MWQI Summary and Findings from Data Collected Oct 2001 through Sep 2003 3-4 Chapter 3 Delta Hydrology
Delta Outflows
Fresh water to the Delta primarily comes from inflows from the SJR and Sacramento River. Water inflows to the rivers come from their major tributaries, reservoirs, and drainage canals within their watersheds. A portion of the water within the Delta is diverted by the State Water Project (SWP), the Central Valley Project (CVP), and Contra Costa Water District. The remaining water is allowed to continue as Delta outflow into the Suisun and San Francisco bays in the western Delta. The diversion of fresh water from the Delta for urban and agricultural uses has the potential of creating problems within the estuary, mainly with declining fish populations. The outflows help to control seawater influence in the western Delta by holding back the daily tides. In general, when tidal levels change from low to high, a flooding current moves the seawater inland into the bay and the Delta. When tidal levels change from high to low, ebbing current moves water from the Delta through the bay to the sea. Delta outflow needs to be maintained against the high tide to prevent salt water from entering the Delta through Suisun Bay and lowering water quality. Therefore, a steady Delta outflow is necessary to preserve the quality of source waters in the Delta. The Interagency Ecological Program of DWR routinely calculates the daily outflows at Chipps Island at the western end of the Delta. Figure 3-5 presents the calculated Delta outflow and flows from SJR and Sacramento River in 2002 WY and 2003 WY. Total outflows in 2002 WY were less than in 2003 WY (Figure 3-5). The reduced Delta outflows during the 2002 WY adversely affected water quality at various stations, particularly those in the western and central Delta. Water quality at these stations with respect to changes in Delta outflow is discussed in later chapters.
Delta Cross Channel Operations The Delta Cross Channel is a US Bureau of Reclamation (USBR) channel that connects the Sacramento River to Snodgrass Slough. The channel diverts water from the Sacramento River to Snodgrass Slough, which opens into the Mokelumne River flowing into the central Delta. Fresh water from the Sacramento River comes through the Delta Cross Channel and improves local water quality in the Delta. The water flows from the Delta Cross Channel through about 50 miles of narrow Delta channels to the vicinity of Clifton Court Forebay and the Tracy Pumping Plant. The Delta Cross Channel diversion helps to provide adequate water supply to the diversion pumps of various agencies in the Delta, while helping to maintain adequate water quality and levels in Delta channels. Delta Cross Channel is useful for improving the quality of water in the Delta. During the winter, the Delta Cross Channel is closed during high flows to prevent flooding in the Delta near the SJR. It is assumed that an open Delta Cross Channel would confuse the migrating fish in the Sacramento River; therefore, during fish migration, Delta Cross Channel gates are closed. Delta Cross Channel gates are operated in accordance with State Water Resources Control Board Decision 1641 (SWRCB 2000).
Figure 3-5 Daily flows at two Delta locations and calculated total Delta outflow
Figure 3-5 Daily flows at two Delta locations and calculated total Delta outflow
0
20000
40000
60000
80000
100000
120000
10/1
/200
1
11/1
/200
1
12/1
/200
1
1/1/
2002
2/1/
2002
3/1/
2002
4/1/
2002
5/1/
2002
6/1/
2002
7/1/
2002
8/1/
2002
9/1/
2002
10/1
/200
2
11/1
/200
2
12/1
/200
2
1/1/
2003
2/1/
2003
3/1/
2003
4/1/
2003
5/1/
2003
6/1/
2003
7/1/
2003
8/1/
2003
9/1/
2003
Dai
ly o
utflo
ws
(cfs
)
Sacramento River at FreeportSan Joaquin River near VernalisDelta Total Outflow
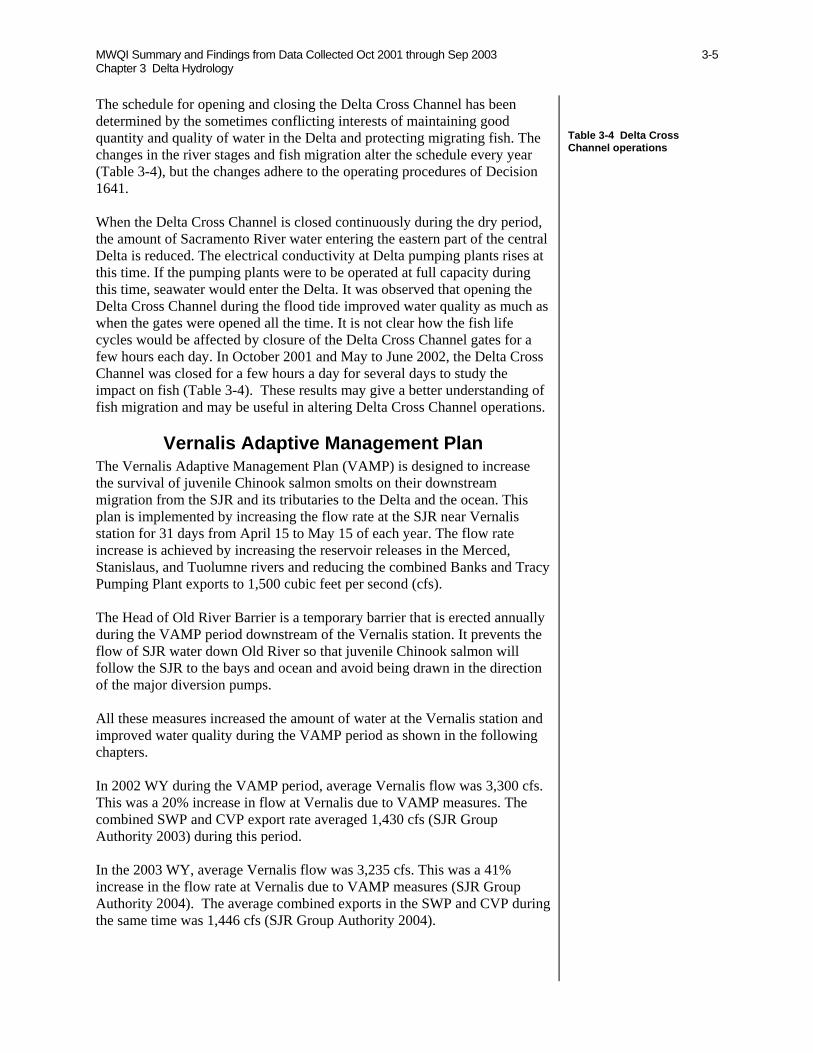
MWQI Summary and Findings from Data Collected Oct 2001 through Sep 2003 3-5 Chapter 3 Delta Hydrology
The schedule for opening and closing the Delta Cross Channel has been determined by the sometimes conflicting interests of maintaining good quantity and quality of water in the Delta and protecting migrating fish. The changes in the river stages and fish migration alter the schedule every year (Table 3-4), but the changes adhere to the operating procedures of Decision 1641. When the Delta Cross Channel is closed continuously during the dry period, the amount of Sacramento River water entering the eastern part of the central Delta is reduced. The electrical conductivity at Delta pumping plants rises at this time. If the pumping plants were to be operated at full capacity during this time, seawater would enter the Delta. It was observed that opening the Delta Cross Channel during the flood tide improved water quality as much as when the gates were opened all the time. It is not clear how the fish life cycles would be affected by closure of the Delta Cross Channel gates for a few hours each day. In October 2001 and May to June 2002, the Delta Cross Channel was closed for a few hours a day for several days to study the impact on fish (Table 3-4). These results may give a better understanding of fish migration and may be useful in altering Delta Cross Channel operations.
Vernalis Adaptive Management Plan The Vernalis Adaptive Management Plan (VAMP) is designed to increase the survival of juvenile Chinook salmon smolts on their downstream migration from the SJR and its tributaries to the Delta and the ocean. This plan is implemented by increasing the flow rate at the SJR near Vernalis station for 31 days from April 15 to May 15 of each year. The flow rate increase is achieved by increasing the reservoir releases in the Merced, Stanislaus, and Tuolumne rivers and reducing the combined Banks and Tracy Pumping Plant exports to 1,500 cubic feet per second (cfs). The Head of Old River Barrier is a temporary barrier that is erected annually during the VAMP period downstream of the Vernalis station. It prevents the flow of SJR water down Old River so that juvenile Chinook salmon will follow the SJR to the bays and ocean and avoid being drawn in the direction of the major diversion pumps. All these measures increased the amount of water at the Vernalis station and improved water quality during the VAMP period as shown in the following chapters. In 2002 WY during the VAMP period, average Vernalis flow was 3,300 cfs. This was a 20% increase in flow at Vernalis due to VAMP measures. The combined SWP and CVP export rate averaged 1,430 cfs (SJR Group Authority 2003) during this period. In the 2003 WY, average Vernalis flow was 3,235 cfs. This was a 41% increase in the flow rate at Vernalis due to VAMP measures (SJR Group Authority 2004). The average combined exports in the SWP and CVP during the same time was 1,446 cfs (SJR Group Authority 2004).
Table 3-4 Delta Cross Channel operations

MWQI Summary and Findings from Data Collected Oct 2001 through Sep 2003 3-6 Chapter 3 Delta Hydrology
South Delta Temporary Barriers
The South Delta Improvements Program is implemented by the USBR and DWR to ensure long-term capability of State and federal water projects. This program is designed to protect local agricultural diversions and SJR salmon populations. To accomplish these goals, 4 temporary rock barriers are placed each year across south Delta channels. Three barriers are constructed to increase water levels, circulation patterns, and water quality in the south Delta for local agricultural diversions (Figure 3-6). They are constructed at Old River near Tracy, Middle River, and Grant Line Canal. These barriers were installed in 2002 and 2003 in the month of April and removed in the month of November (Table 3-5). The fourth temporary barrier acts as a fish barrier and was constructed at the Head of Old River. It was installed in the month of April and removed in the month of May in both 2002 and 2003. This barrier was constructed again in September and removed in November in both years (Table 3-5). It was observed that when temporary barriers were installed and the Delta Cross Channel gates were opened, daily variations and maximum electrical conductivity were lower at Tracy Fish Collection Facility near Tracy than when the SJR was allowed to flow uncontrolled to this area.
Table 3-5 Temporary barriers operating schedule
Figure 3-6 South Delta temporary barriers

MWQI Summary and Findings from Data Collected Oct 2001 through Sep 2003 3-7 Chapter 3 Delta Hydrology
Chapter 3 Delta Hydrology
Figures Figure 3-1 Location of selected weather stations ..................................................................................................... 3-8 Figure 3-2 Cumulated monthly precipitation (in inches) at six weather stations...................................................... 3-9 Figure 3-3 Sacramento River watershed reservoir releasesa and Sacramento River flow at Freeportb................... 3-10 Figure 3-4 San Joaquin River watershed reservoir releases ................................................................................... 3-11 Figure 3-5 Daily flows at two Delta locations and calculated total Delta outflow ................................................. 3-12 Figure 3-6 South Delta temporary barriers ............................................................................................................. 3-13
Tables Table 3-1 Summary of daily precipitation (in inches) at six weather stations........................................................ 3-14 Table 3-2 Summary of monthly precipitation (in inches) at six weather stations................................................... 3-14 Table 3-3 Hydrologic index classification based on measured unimpaired runoff at selected rivers .................... 3-15 Table 3-4 Delta Cross Channel operations ............................................................................................................. 3-16 Table 3-5 Temporary barriers operating schedule .................................................................................................. 3-17

MWQI Summary and Findings from Data Collected Oct 2001 through Sep 2003 3-8 Chapter 3 Delta Hydrology
Figure 3-1 Location of selected weather stations

MWQI Summary and Findings from Data Collected Oct 2001 through Sep 2003 3-9 Chapter 3 Delta Hydrology
Figure 3-2 Cumulated monthly precipitation (in inches) at six weather stations
Sacramento Valley stations San Joaquin Valley stations
Stockton
02468
10121416
Oct
-01
Nov
-01
Dec
-01
Jan-
02Fe
b-02
Mar
-02
Apr-0
2M
ay-0
2Ju
n-02
Jul-0
2Au
g-02
Sep-
02O
ct-0
2N
ov-0
2D
ec-0
2Ja
n-03
Feb-
03M
ar-0
3Ap
r-03
May
-03
Jun-
03
Prec
ipita
tion
Redding
02468
10121416
Oct
-01
Nov
-01
Dec
-01
Jan-
02Fe
b-02
Mar
-02
Apr-0
2M
ay-0
2Ju
n-02
Jul-0
2Au
g-02
Sep-
02O
ct-0
2N
ov-0
2D
ec-0
2Ja
n-03
Feb-
03M
ar-0
3Ap
r-03
May
-03
Jun-
03Ju
l-03
Aug-
03Se
p-03
Prec
ipita
tion
Durham
02468
10121416
Oct
-01
Nov
-01
Dec
-01
Jan-
02Fe
b-02
Mar
-02
Apr-0
2M
ay-0
2Ju
n-02
Jul-0
2Au
g-02
Sep-
02O
ct-0
2N
ov-0
2D
ec-0
2Ja
n-03
Feb-
03M
ar-0
3Ap
r-03
May
-03
Jun-
03Ju
l-03
Aug-
03Se
p-03
Prec
ipita
tion Brentwood
02468
10121416
Oct
-01
Nov
-01
Dec
-01
Jan-
02Fe
b-02
Mar
-02
Apr-0
2M
ay-0
2Ju
n-02
Jul-0
2Au
g-02
Sep-
02O
ct-0
2N
ov-0
2D
ec-0
2Ja
n-03
Feb-
03M
ar-0
3Ap
r-03
May
-03
Jun-
03
Prec
ipita
tion
Madera
-4
1
6
11
16
Oct
-01
Nov-
01D
ec-0
1Ja
n-02
Feb-
02M
ar-0
2Ap
r-02
May
-02
Jun-
02Ju
l-02
Aug-
02Se
p-02
Oct
-02
Nov-
02D
ec-0
2Ja
n-03
Feb-
03M
ar-0
3Ap
r-03
May
-03
Jun-
03
Prec
ipita
tion
Sacramento Executive Airport
-4
1
6
11
16
Oct
-01
Nov
-01
Dec
-01
Jan-
02Fe
b-02
Mar
-02
Apr-0
2M
ay-0
2Ju
n-02
Jul-0
2Au
g-02
Sep-
02O
ct-0
2N
ov-0
2D
ec-0
2Ja
n-03
Feb-
03M
ar-0
3Ap
r-03
May
-03
Jun-
03Ju
l-03
Aug-
03Se
p-03
Prec
ipita
tion

MWQI Summary and Findings from Data Collected Oct 2001 through Sep 2003 3-10 Chapter 3 Delta Hydrology
Figure 3-3 Sacramento River watershed reservoir releasesa and Sacramento River flow at Freeportb
Source: DWR http://cdec.water.ca.gov/ a. Releases were calculated from CDEC data b. Daily average flow from CDEC
Sacramento River watershed reservoir releases
0
200000
400000
600000
800000
1000000
1200000O
ct-0
1
Dec
-01
Feb-
02
Apr
-02
Jun-
02
Aug
-02
Oct
-02
Dec
-02
Feb-
03
Apr
-03
Jun-
03
Aug
-03
Month
Mon
thly
tota
ls (a
cre
feet
)
Shasta Reservoir and Trinity River imports Feather and Yuba River reservoirs Folsom Lake
Sacramento River flow at Freeport
0
10000
20000
30000
40000
50000
60000
70000
10/1
/200
1
12/1
/200
1
2/1/
2002
4/1/
2002
6/1/
2002
8/1/
2002
10/1
/200
2
12/1
/200
2
2/1/
2003
4/1/
2003
6/1/
2003
8/1/
2003
10/1
/200
3
Date
Flow
(cfs
)
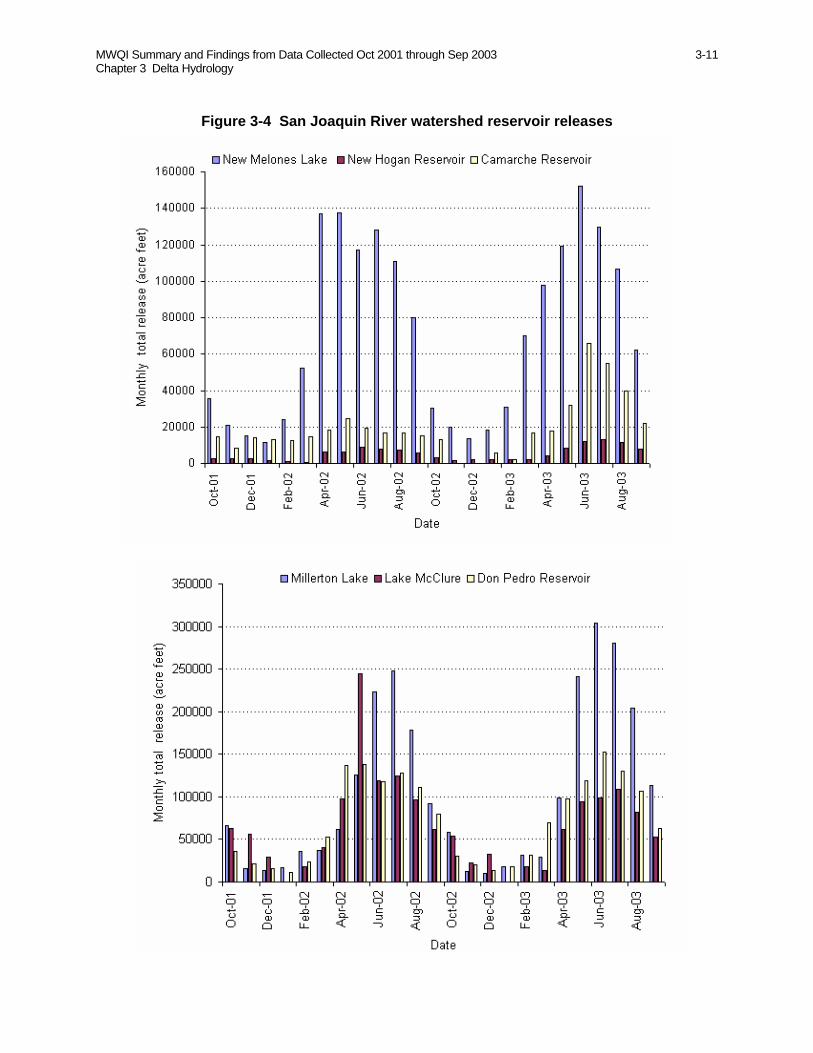
MWQI Summary and Findings from Data Collected Oct 2001 through Sep 2003 3-11 Chapter 3 Delta Hydrology
Figure 3-4 San Joaquin River watershed reservoir releases

MWQI Summary and Findings from Data Collected Oct 2001 through Sep 2003 3-12 Chapter 3 Delta Hydrology
Figure 3-5 Daily flows at two Delta locations and calculated total Delta outflow
Source: California Department of Water Resources, http://cdec.water.ca.gov/, Accessed July 26, 2004
0
20000
40000
60000
80000
100000
120000
10/1
/200
1
11/1
/200
1
12/1
/200
1
1/1/
2002
2/1/
2002
3/1/
2002
4/1/
2002
5/1/
2002
6/1/
2002
7/1/
2002
8/1/
2002
9/1/
2002
10/1
/200
2
11/1
/200
2
12/1
/200
2
1/1/
2003
2/1/
2003
3/1/
2003
4/1/
2003
5/1/
2003
6/1/
2003
7/1/
2003
8/1/
2003
9/1/
2003
Dai
ly o
utflo
ws
(cfs
)
Sacramento River at FreeportSan Joaquin River near VernalisDelta Total Outflow
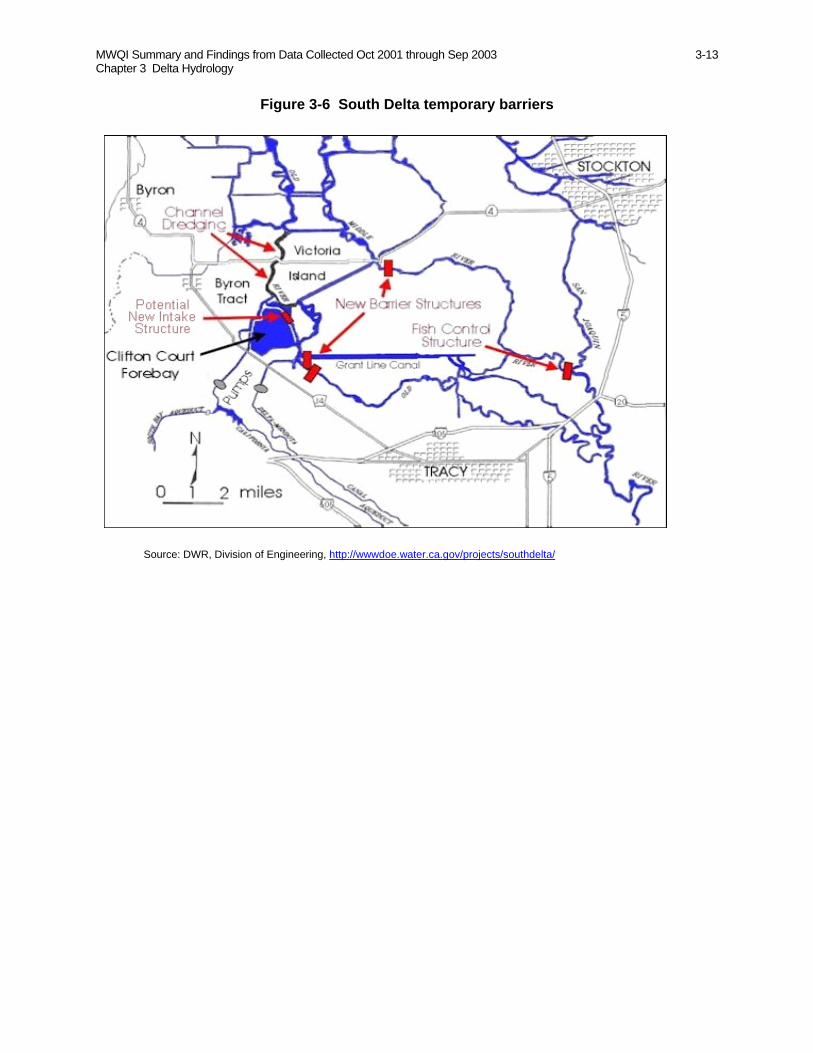
MWQI Summary and Findings from Data Collected Oct 2001 through Sep 2003 3-13 Chapter 3 Delta Hydrology
Figure 3-6 South Delta temporary barriers
Source: DWR, Division of Engineering, http://wwwdoe.water.ca.gov/projects/southdelta/

MWQI Summary and Findings from Data Collected Oct 2001 through Sep 2003 3-14 Chapter 3 Delta Hydrology
Table 3-1 Summary of daily precipitation (in inches) at six weather stations Reporting Days Days of varying intensity
Station days rained Rangea Meana Mediana >= 0.1 >= 0.5 >= 1 >= 2 Sacramento Valley
Redding Fire Station 730 161 0.01–3.07 0.4 0.22 109 43 19 2
Durham 730 117 0.01–2.05 0.37 0.19 77 33 9 1
Sacramento Executive Airport 730 116 0.01–1.67 0.3 0.19 74 24 5 0
San Joaquin Valley
Stockton Fire Station 730 100 0.01–1.50 0.24 0.13 53 15 4 0
Brentwood 730 137 0.01–1.90 0.21 0.08 65 17 5 0
Madera 730 112 0.01–1.06 0.15 0.06 46 9 1 0 a. Calculated with data from wet days.
Table 3-2 Summary of monthly precipitation (in inches) at six weather stations Reporting Months Monthly precipitation Cumulated precipitation in water year a
Station months rained Rangeb Meanb Medianb 2002 2003 Sacramento Valley Redding Fire Station 24 19 0.05–14.72 3.39 2.41 28.5 35.9 Durham 24 14 0.06–9.18 3.08 2.34 20.6 22.48 Sacramento Executive Airport 24 16 0.12–6.27 2.17 1.97 17.44 17.32 San Joaquin Valley Stockton Fire Station 24 16 0.06–5.0 1.5 1.06 11.86 12.17 Brentwood 24 20 0.01–6.19 1.42 0.78 13.03 15.42 Madera 24 19 0.01–2.62 0.92 0.73 9.36 8.1
a. Water year runs from Oct 1 to Sep 30; for example, the 2002 water year runs from 1 Oct 2001 to 30 Sep 2002. b. Calculated with data from wet months.
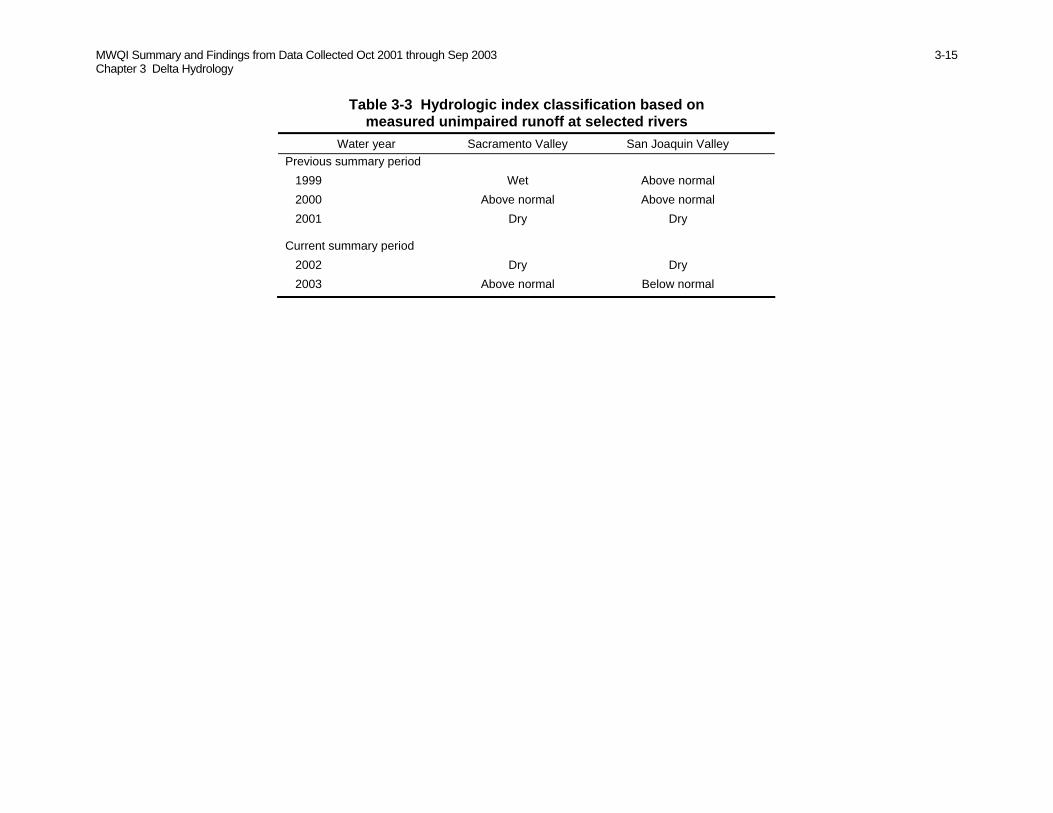
MWQI Summary and Findings from Data Collected Oct 2001 through Sep 2003 3-15 Chapter 3 Delta Hydrology
Table 3-3 Hydrologic index classification based on measured unimpaired runoff at selected rivers
Water year Sacramento Valley San Joaquin Valley Previous summary period 1999 Wet Above normal 2000 Above normal Above normal 2001 Dry Dry
Current summary period 2002 Dry Dry 2003 Above normal Below normal

MWQI Summary and Findings from Data Collected Oct 2001 through Sep 2003 3-16 Chapter 3 Delta Hydrology
Table 3-4 Delta Cross Channel operations
Water quality concerns Winter closure Fish concerns Fish study
Open Closed Closed Experimental
period Number of study days
Closed hours/day
8/27/01 to 10/8/01 10/8-/01 to 10/27/01 18 5 to 6 10/27/01 to11/21/01 11/21/01 to 11/29/01 11/29/01 to 12/4/01 12/4/01 to 5/24/02 5/24/02 to 5/28/02 5/28/02 to 5/31/02 5/31/02 to 6/14/02 9 8 to 9 6/14/02 to 10/16/02 10/16/02 to 10/19/02 3 24 10/19/02 to 12/3/02 12/3/02 to 12/10/02 12/10/02 to 12/16/02 12/16/02 to 5/30/03 5/30/03 to 6/2/03 6/2/03 to 6/6/03 6/6/03 to 6/9/03 6/9/03 to 6/12/03 6/12/03 to 12/1/03
Note: Calculated with the data from US Bureau of Reclamation, Delta Cross Channel Operations. Maintenance schedule is not included

MWQI Summary and Findings from Data Collected Oct 2001 through Sep 2003 3-17 Chapter 3 Delta Hydrology
Table 3-5 Temporary barriers operating schedule Head of Old River
Year Work Old River at Tracy Middle River Grant Line Canal Spring Fall
2001 Installation
Started April 23 April 20 May 2 April 17 September24 Completed April 26 April 23 May 6 April 26 October 6 2001 Removal Started November 13 November 12 November 11 May 23 November 22 Breached November 14 November 18 November 12 November 22 Completed November 26 November 18 May 30 December 2 2002 Installation Started April 1 April 10 April 1 April 2 September 24 Completed April 18 April 15 April 12 April 18 October 4 2002 Removal Started November 16 November 20 November 14 May 22 November 11 Breached November 16 November 20 November 16 May 24 November 12 Completed November 29 November 23 November 25 June 7 November 21 2003 Installation Started April 1 April 12 April 1 April 1 September 2 Closed April 14 April 15 June 11 April 15 September 15 Completed April 22 April 23 June 17 April 21 September 18 2003 Removal Started November 13 November 7 November 10 May 16 November 3 Breached November 15 November 8 November 13 May 18 November 4 Completed November 25 November 10 November 25 June 3 November 13
Note: Data from California Department of Water Resources, Bay-Delta Office

MWQI Summary and Findings from Data Collected Oct 2001 through Sep 2003 4-i Chapter 4 Organic Carbon
Chapter 4 Organic Carbon
Contents Chapter 4 Organic Carbon ....................................................................................... 4-1
Ranges and Seasonality of Organic Carbon......................................................... 4-1 American River and Sacramento River Stations.............................................. 4-1
American River............................................................................................ 4-1 Sacramento River at the West Sacramento WTP Intake.............................. 4-1 Sacramento River at the Hood Station......................................................... 4-2
San Joaquin River near Vernalis...................................................................... 4-3 Delta Channel Stations .................................................................................... 4-4
Old River at Station 9 .................................................................................. 4-4 Old River at Bacon Island............................................................................ 4-5
Diversion Stations............................................................................................ 4-5 Banks Pumping Plant................................................................................... 4-5 Delta-Mendota Canal at McCabe Road ....................................................... 4-6 Contra Costa Pumping Plant #1................................................................... 4-6
Other Stations .................................................................................................. 4-7 Mallard Island Station.................................................................................. 4-7 Natomas East Main Drainage Canal ............................................................ 4-7
Ultraviolet Absorbance at 254 nm....................................................................... 4-8 Ranges of UVA254 in Delta Waters.................................................................. 4-8 Specific UVA254 and DOC .............................................................................. 4-8 Relationships between UVA254 and Organic Carbon in Delta Waters............. 4-9
Relationships between Organic Carbon Concentrations Measured by Two Different Methods................................................................................................ 4-9
Figures
Figure 4-1 Location of monitoring stations near the City of Sacramento..............4-11 Figure 4-2 Organic carbon at the American River and West Sacramento WTP
Intake ..................................................................................................4-12 Figure 4-3 Organic carbon at Sacramento River at Hood......................................4-13 Figure 4-4 Organic carbon at San Joaquin River near Vernalis.............................4-14 Figure 4-5 Organic carbon at two Old River stations ............................................4-15 Figure 4-6 Organic carbon at three Delta diversion stations .................................4-16 Figure 4-7 Organic carbon at Mallard Island and Natomas East Main Drainage
Canal ...................................................................................................4-17 Figure 4-8 Relationships between UVA254 and organic carbon concentrations
measured by two different methods ....................................................4-18 Figure 4-9 Organic carbon determined by two different methods.........................4-19
Tables Table 4-1 Summary of organic carbon at 11 MWQI stations................................4-20 Table 4-2 Summary of UVA254 at 11 MWQI stations ...........................................4-21 Table 4-3 Summary of SUVA254 at 11 MWQI stations.........................................4-21
Chapter 4 figures and tables

MWQI Summary and Findings from Data Collected Oct 2001 through Sep 2003 4-1 Chapter 4 Organic Carbon
Chapter 4 Organic Carbon This chapter summarizes organic carbon data collected from 11 monitoring stations in the Sacramento-San Joaquin Delta (the Delta) region from October 1, 2001, to September 30, 2003. The Municipal Water Quality Investigations Program (MWQI) monitors both total organic carbon and dissolved organic carbon. Although some TOC and DOC were analyzed by a combustion method in addition to a chemical oxidation method (wet oxidation), data of TOC and DOC by wet oxidation will be discussed for ranges and seasonality at individual stations. A brief discussion on UVA254 and the relationships between TOC and DOC by the 2 different methods are also presented.
Ranges and Seasonality of Organic Carbon American River and Sacramento River Stations MWQI sampled 3 river stations and an urban drainage station near the northern boundary of the Delta (Figure 4-1). Water quality at these stations represents water from the American and Sacramento rivers before and right after water enters the Delta, as well as drainage from a heavily populated urban watershed. American River Monthly and weekly (November through April) grab samples were collected from the American River at the E.A. Fairbairn Water Treatment Plant (WTP) (Figure 4-1). With a few exceptions, organic carbon at this station was generally lower than 2 mg/L (Figure 4-2). The difference between TOC and DOC was consistently small regardless of season, indicating most organic carbon was present in dissolved form (Figure 4-2). The ranges, median, and means for both TOC and DOC at this station were similar (Table 4-1), again suggesting that organic carbon was mostly in dissolved form. American River water is low in turbidity (see Chapter 8 pH, Alkalinity, Hardness, and Turbidity), thus the differences between TOC and DOC were small. American River water is generally of high quality, which does not appear to change significantly with season. Organic carbon was elevated in November 2001 and December 2002 in response to early rainfall events in the watershed, but elevated organic carbon levels did not persist. Apparent seasonality within each water year was not observed with either TOC or DOC (Figure 4-2). Median TOC and DOC between the 2 water years did not differ statistically according to the Mann-Whitney test (p was 0.1172 and 0.1959 for TOC and DOC, respectively) despite 2002 WY being a dry runoff year and 2003 WY being an above normal year (see Table 3-3). Sacramento River at the West Sacramento WTP Intake The West Sacramento WTP Intake is about 2.5 miles upstream of the confluence of the American and the Sacramento rivers (Figure 4-1). The median levels of TOC and DOC for the reporting period were 2.0 and 1.8 mg/L, respectively (Table 4-1), which were not statistically different according to the Mann-Whitney test (p= 0.2005). These median concentrations were higher than those of the previous 3 water years
Figure 4-1 Location of monitoring stations near the City of Sacramento
Figure 4-2 Organic carbon at American River and West Sacramento WTP Intake
Table 4-1 Summary of organic carbon at 11 MWQI stations
Oct
-01
N
ov-0
1
Dec
-01
Ja
n-02
Fe
b-02
M
ar-0
2
Apr-0
2
May
-02
Ju
n-02
Ju
l-02
Au
g-02
Se
p-02
O
ct-0
2
Nov
-02
D
ec-0
2
Jan-
03
Feb-
03
Mar
-03
Ap
r-03
M
ay-0
3
Jun-
03
Jul-0
3
Aug-
03
Sep-
03
Oct
-03
Org
anic
Car
bon
(mg/
L)
1.0
2.0
3.0
American River at E.A. Fairbairn WTP Intake
TOC DOC
Org
anic
Car
bon
(mg/
L)
1.0
2.0
3.0
4.0
5.0
6.0
TOC DOC

MWQI Summary and Findings from Data Collected Oct 2001 through Sep 2003 4-2 Chapter 4 Organic Carbon
(DWR 2003a) due to 2 successive dry runoff years in the watersheds (see Table 3-3). Organic carbon concentrations were mostly less than 3 mg/L, but early rainfall events (see Figure 3-2) in the watersheds increased organic carbon concentrations above 4 and 5 mg/L (Figure 4-2). Unlike the American River, episodic spikes and clear seasonality of organic carbon were observed (Figure 4-2). TOC and DOC were higher during the wet months than during the dry months. Both TOC and DOC had little fluctuation during the dry months of the 2 water years (Figure 4-2). The slight increase in organic carbon in September 2002 may have been attributable to rice drainage to the Sacramento River (DWR 2003a). Although 2003 WY was a wetter year than 2002 WY in the watershed, median TOC and DOC were not significantly different according to the Mann-Whiney test (p was 0.3789 and 0.5069 for TOC and DOC, respectively). Sacramento River at the Hood Station The Hood station is on the Sacramento River shortly after the river enters the legal Delta (Figure 4-1); therefore, it is one of the 2 key MWQI monitoring stations where water quality is monitored weekly throughout each water year. Organic carbon concentrations at Hood were generally less than 3 mg/L, but were heavily influenced by rainfall events during the wet months in the Sacramento Valley (Figure 4-3). Median concentrations of TOC and DOC were 1.8 and 1.7 mg/L, respectively (Table 4-1), which were statistically different according to the Mann-Whitney test (p=0.0290). These median TOC and DOC concentrations were nearly the same as those found during the 1998-2001 summary period (DWR 2003a). TOC was considerably higher than DOC during the wet months (Figure 4-3), suggesting that considerable particulate organic carbon was present during rainfall periods. TOC was significantly higher during the wet months than during the dry months for each of the 2 water years with Mann-Whitney p values of <0.00001 and 0.0165 for WY 2002 and WY 2003, respectively (Figure 4-3). The same was true for DOC with Mann-Whitney p values of <0.00001 and 0.0028 for WY 2002 and WY 2003, respectively. Compared with monthly sampling at nearby stations (Figure 4-2), weekly sampling revealed more detailed changes in organic carbon. For example, after a heavy rainfall event in early November 2002, there was no rain during the rest of November (see Appendix A for raw data) in the Sacramento Valley, and organic carbon levels returned to low levels (Figure 4-3). The rapid fall of elevated organic carbon levels is the result of both settling of particulate organic carbon in the water and dilution of organic carbon concentrations by water with relatively low organic carbon levels following initial flushing. As at the West Sacramento WTP Intake station, organic carbon at Hood increased each year around September (Figure 4-3). These increases were probably due to rice drainage into the upper Sacramento River. Despite a difference in runoff volume from the watersheds between the 2 water years, neither TOC nor DOC was significantly different (p was
Figure 4-3 Organic carbon at Sacramento River at Hood
Oct
-01
N
ov-0
1
Dec
-01
Ja
n-02
Fe
b-02
M
ar-0
2
Apr-0
2
May
-02
Ju
n-02
Ju
l-02
Au
g-02
Se
p-02
O
ct-0
2
Nov
-02
D
ec-0
2
Jan-
03
Feb-
03
Mar
-03
Ap
r-03
M
ay-0
3
Jun-
03
Jul-0
3
Aug-
03
Sep-
03
Oct
-03
Org
anic
Car
bon
(mg/
L)
1.0
2.0
3.0
4.0
5.0
6.0
TOCDOC
Rice drainage Rice drainage
Appendix A

MWQI Summary and Findings from Data Collected Oct 2001 through Sep 2003 4-3 Chapter 4 Organic Carbon
0.5955 and 0.6368 for TOC and DOC, respectively). Median TOC and DOC were not statistically different from each other for the wet months of the 2 water years (p was 0.4436 and 0.5232 for TOC and DOC, respectively). DOC during the dry months was not statistically different between the 2 water years, either (p=0.0936). However, median TOC during the dry months of 2003 WY was significantly higher than that of the dry months of 2002 WY (p=0.0210), probably due to TOC increases during June, July, and August 2003 (Figure 4-3). These TOC increases were not found to be correlated with the relative percentages of inflows from the American River (data not shown). In addition to urban discharges, TOC increases may have been affected by irrigation discharges from rice fields and row crops. Approximately half a million acres of rice is grown in the Sacramento Valley. Herbicides are usually applied in April and May. A one-month impoundment of water in the rice fields is required to ensure a good kill of weeds following herbicide application to the rice field. At the end of the impoundment period, irrigation water is discharged to the Sacramento River in June and July (Rich Breuer 2002 pers comm), thus increasing organic carbon levels. San Joaquin River near Vernalis The San Joaquin River near Vernalis station represents the point where the SJR enters the Delta. As at the Hood station on the Sacramento River, water quality near Vernalis was monitored weekly. Organic carbon concentrations generally varied between 2 and 5 mg/L, but were as high as 8 mg/L once during January 2002 (Figure 4-4). The median concentrations of TOC and DOC were 3.7 and 2.9 mg/L, respectively (Table 4-1), which were significantly different (p<0.00001), indicating significant association of organic carbon with particulate matter. These median concentrations were higher than those found during the 1998–2001 summary period (DWR 2003a). During 2002 WY and 2003 WY, river flows at the Vernalis station were substantially lower than during the 1998-2001 summary period (data not shown); organic carbon concentrations were higher during this reporting period than during the 1998–2001 summary period. Organic carbon concentrations during the wet months of each water year depend on rainfall events in the San Joaquin Valley. Heavy rainfall events during 2002 WY were mostly in December and January (see Figure 3-2); therefore, organic carbon spikes occurred only in January (Figure 4-4). In contrast, 2003 WY was a wetter runoff year (see Table 3-3) with more heavy rainfall events spanning from November to April (see Figure 3-2) and more organic carbon spikes observed (Figure 4-4). Median organic carbon concentrations for the 2 water years were not significantly different (p was 0.9921 and 0.6874 for TOC and DOC, respectively) despite the difference in runoff year type (see Table 3-3). For 2002 WY, except for a spike caused by early flushing of the watershed after the first heavy rainfall and some small fluctuations (Figure 4-4), TOC during the dry months was as high as during the wet months. A Mann-Whitney analysis showed that median TOC between the dry months and wet months (p=0.4027) were not significantly different. However, median DOC
Figure 4-4 Organic carbon at San Joaquin River near Vernalis
Figure 4-4 Organic Carbon at San Joaquin River near Vernalis
Oct
-01
N
ov-0
1
Dec
-01
Ja
n-02
Fe
b-02
M
ar-0
2
Apr-0
2
May
-02
Ju
n-02
Ju
l-02
Au
g-02
Se
p-02
O
ct-0
2
Nov
-02
D
ec-0
2
Jan-
03
Feb-
03
Mar
-03
Ap
r-03
M
ay-0
3
Jun-
03
Jul-0
3
Aug-
03
Sep-
03
Oct
-03
Org
anic
Car
bon
(mg/
L)
1.0
2.0
3.0
4.0
5.0
6.0
7.0
8.0TOCDOC
VAMP VAMP

MWQI Summary and Findings from Data Collected Oct 2001 through Sep 2003 4-4 Chapter 4 Organic Carbon
during the wet months was significantly higher than that during the dry months (p<0.00001). TOC during the dry months was consistently higher than DOC (Figure 4-4), and the difference in median TOC and DOC was statistically significant (p<0.00001), suggesting that much particulate organic carbon was present during the dry months. The 2003 WY was a wetter runoff year compared with the 2002 WY, and more TOC fluctuations occurred during the wet months (Figure 4-4). Similar to 2002 WY, median TOC between the wet months and dry months were not statistically different (p=0.2322). However, as in 2002 WY, median DOC during the wet months was also significantly higher than that during the dry months (p=0.0004). The higher organic carbon concentrations during the dry months were attributable to agricultural drainage returns to the SJR. Agricultural drainage enters the SJR from May to October of each year and increases organic carbon concentrations (Figure 4-4). During the dry months the lowest organic carbon level was observed in May and October. The low organic carbon levels in SJR from April to May were attributable to increased reservoir releases during the Vernalis Adaptive Management Plan period from April 15 to May 15 (see Chapter 3). Low organic carbon levels in October were probably due to less agricultural drainage at the end of the growing season. For both water years, median TOC was not significantly different between wet and dry months (p was 0.4027 and 0.2322 for 2002 WY and 2003 WY, respectively). However, median DOC during the wet months was significantly higher than during the dry months for both water years (p was <0.00001 and 0.0004 for 2002 WY and 2003 WY, respectively). Delta Channel Stations Old River at Station 9 TOC and DOC differed only slightly (Figure 4-5) with similar ranges and medians (Table 4-1), suggesting that most organic carbon was in dissolved form. Organic carbon concentrations during this reporting period were similar to those found during the previous summary period (DWR 2003a). TOC at Station 9 comes from multiple sources, including waters from the SJR, the Sacramento River, and Delta island drainage. Seasonality patterns of organic carbon at this station differed from those at the river stations. Most elevated TOC and DOC concentrations were observed during the wet months when most precipitation occurred. Unlike the Vernalis station on the SJR, organic carbon concentrations were much lower during dry months than during the wet months (Figure 4-5). At the Vernalis station, median organic carbon concentrations were as high during the dry months as during the wet months for both water years (Figure 4-4). The seasonality patterns of TOC and DOC at Station 9 are probably related to elevated organic carbon in inflows from the 2 major river systems and Delta island drainage. Organic carbon concentrations in waters of both SJR and Sacramento River were elevated during the wet months (Figures 4-3 and
Figure 4-5 Organic carbon at two Old River stations
Old River at Bacon Island
Oct
-01
N
ov-0
1
Dec
-01
Ja
n-02
Fe
b-02
M
ar-0
2
Apr-0
2
May
-02
Ju
n-02
Ju
l-02
Au
g-02
Se
p-02
O
ct-0
2
Nov
-02
D
ec-0
2
Jan-
03
Feb-
03
Mar
-03
Ap
r-03
M
ay-0
3
Jun-
03
Jul-0
3
Aug-
03
Sep-
03
Oct
-03
Org
anic
car
bon
(mg/
L)
2.0
4.0
6.0
8.0
TOCDOC
Old River at Station 9
Oct
-01
N
ov-0
1
Dec
-01
Ja
n-02
Fe
b-02
M
ar-0
2
Apr-0
2
May
-02
Ju
n-02
Ju
l-02
Au
g-02
Se
p-02
O
ct-0
2
Nov
-02
D
ec-0
2
Jan-
03
Feb-
03
Mar
-03
Ap
r-03
M
ay-0
3
Jun-
03
Jul-0
3
Aug-
03
Sep-
03
Oct
-03
Org
anic
car
bon
(mg/
L)
2.0
4.0
6.0
8.0
TOCDOC

MWQI Summary and Findings from Data Collected Oct 2001 through Sep 2003 4-5 Chapter 4 Organic Carbon
4-4). When inflows of high organic carbon from both river systems passed the Delta channels, organic carbon concentrations would be elevated. In addition, Delta island drainage pump-outs were higher during the wet months than during the rest of each water year. Organic carbon levels in drainage waters were also higher during the wet months. Therefore, organic carbon at Station 9 was higher during the wet months than during the dry months (Figure 4-5). Seasonality of organic carbon was also related to the amount of runoff from the contributing watersheds. The 2003 WY was a wetter runoff year than 2002 WY; consequently, organic carbon levels were lower in 2003 WY than in 2002 WY (Figure 4-5). Old River at Bacon Island The ranges and seasonality of organic carbon at the Bacon Island station were similar to those at Station 9 (Figure 4-5), and TOC and DOC at both stations did not differ statistically (p was 0.1169 and 0.0879 for TOC and DOC, respectively). The median concentrations of TOC and DOC were 3.2 and 3.0 mg/L, respectively, which were similar to those found during the previous summary period (DWR 2003a). As discussed under Station 9 above, seasonality patterns of TOC and DOC at channel stations are probably related to elevated organic carbon in inflows from the 2 major river systems and Delta island drainage. Year-to-year variations of organic carbon concentrations were related to the amount of runoff from the contributing watersheds. The 2003 WY was a wetter runoff year than 2002 WY, thus organic carbon levels were lower in 2003 WY than 2002 WY (Figure 4-5). Diversion Stations Banks Pumping Plant Samples for TOC and DOC were collected monthly at Banks Pumping Plant during the 2 water years. Similar to those at the Old River stations (Figure 4-5), median TOC and DOC concentrations did not differ significantly (p=0.3771) even during the wet months (Figure 4-6), indicating low particulate organic carbon in water at the Banks Pumping Plant. Although TOC and DOC both had a wide range (Table 4-1), high concentrations were found mostly during the wet months of 2002 WY (Figure 4-6), which was a dry runoff year in both the Sacramento and San Joaquin watersheds. Most TOC and DOC levels varied around 3 mg/L; median TOC and DOC levels were 3.2 and 2.9 mg/L, respectively (Table 4-1), which were similar to organic carbon concentrations found during the 1998–2001 summary period (DWR 2003a). TOC and DOC concentrations did not appear to vary with the runoff year type (Figure 4-6); however, the increase in organic carbon during the wet months of 2002 WY did not occur during the wet months of 2003 WY, which was a wetter runoff year. Organic carbon was higher during the wet months than during the dry months of each water year (Figure 4-6). The increase in organic carbon during the wet months was attributable to increased loads from contributing watersheds. Organic carbon in inflow waters to the Banks station increased
Figure 4-6 Organic carbon at three Delta diversion stations
Banks Pumping Plant
Oct-01
Nov-01
Dec-01
Jan-02 Feb-02 M
ar-02 Apr-02 M
ay-02 Jun-02
Jul-02 A
ug-02 Sep-02 O
ct-02 N
ov-02 D
ec-02 Jan-03 Feb-03 M
ar-03 Apr-03 M
ay-03 Jun-03
Jul-03 Aug-03 S
ep-03 O
ct-03
0.0
3.0
6.0
9.0
TOCDOC
Delta-Mendota Canal
Oct-01
Nov-01
Dec-01
Jan-02 Feb-02 M
ar-02 Apr-02 M
ay-02 Jun-02
Jul-02 A
ug-02 Sep-02 O
ct-02 N
ov-02 D
ec-02 Jan-03 Feb-03 M
ar-03 Apr-03 M
ay-03 Jun-03
Jul-03 Aug-03 S
ep-03 O
ct-03
0.0
3.0
6.0
9.0
TOCDOC
Contra Costa Pumping Plant
Oc No
De
Ja Fe Ma
Ap M Ju
Jul Au SeO
c No
De
Ja Fe Ma
Ap M JuJul Au SeO
c
0.0
3.0
6.0
9.0
TOCDOC

MWQI Summary and Findings from Data Collected Oct 2001 through Sep 2003 4-6 Chapter 4 Organic Carbon
during the wet months, but freshwater flow did not dilute organic carbon in the water because the dams and reservoirs released less water during the winter. Delta-Mendota Canal at McCabe Road Both the ranges and seasonality of TOC and DOC at the Delta-Mendota Canal (DMC) at McCabe Road resembled those found at the Banks station (Table 4-1 and Figure 4-6). TOC and DOC levels were not significantly different (p=0.3329) during the 2-year period (Figure 4-6), suggesting that organic carbon was primarily in dissolved form. The median concentrations of TOC and DOC were 3.2 and 3.0 mg/L, respectively (Table 4-1), which were similar to organic concentrations found during the 1998–2001 summary period (DWR 2003a). As at the Banks station, organic carbon increases were observed during January of 2002 WY, but not in the wet months of the wetter 2003 WY (Figure 4-6). A Mann-Whitney analysis suggested that there was no significant difference between median TOC concentrations at Banks and the DMC stations (p=0.5753). Contra Costa Pumping Plant #1 Samples were collected monthly at the pumping outlet of the Contra Costa Pumping Plant. A sample was collected only if the pump was operating on the day when the sampling run was scheduled. As at the Banks and DMC stations, TOC and DOC concentrations were not significantly different (p=0.6873), suggesting low particulate organic carbon in the water. The ranges for both TOC and DOC were similar. Median TOC and DOC was the same (Table 4-1). Concentrations were similar to those found during the 1998–2001 summary period (DWR 2003a). Seasonality patterns at the Contra Costa Pumping Plant were similar to those at the other diversion stations (Figure 4-6) and those at the Old River stations (Bacon Island and Station 9). The seasonality patterns appear to have been less dependent than the Vernalis station on runoff patterns in the contributing watersheds.

MWQI Summary and Findings from Data Collected Oct 2001 through Sep 2003 4-7 Chapter 4 Organic Carbon
Other Stations Mallard Island Station Water at the Mallard Island station is a mixture from several sources including the SJR and the Sacramento River, the San Francisco Bay, and drainage from in-Delta islands. Median TOC and DOC concentrations were 2.4 and 1.9 mg/L, respectively (Table 4-1), which were similar to organic concentrations found during the previous summary period (DWR 2003a). Unlike at the Sacramento River and channel stations, considerable quantities of particulate organic carbon were present in the water at the Mallard Island station; median TOC was about 26% higher than median DOC (Table 4-1). Because water at this station comes from multiple sources, organic carbon seasonality differed from that at channel stations, the Sacramento River, and SJR (Figure 4-7). For example, an obvious spike of organic carbon during January of 2003 WY was not observed at the diversion stations (Figure 4-6), but was seen at this station (Figure 4-7). Natomas East Main Drainage Canal The Natomas East Main Drainage Canal (NEMDC) at El Camino Avenue in north Sacramento is an urban drainage canal that discharges water to the Sacramento River. The NEMDC relative to both the American and Sacramento rivers is shown in Figure 4-1. Organic carbon at this station was consistently high and varied around 5 mg/L during most months. Carbon concentrations were generally higher during the wet months than during the dry months (Figure 4-7). Organic carbon could spike as high as nearly 40 mg/L after initial heavy rainfall events in the watershed (Figure 4-7). The high organic carbon concentrations in November 2002 and August 2003 both followed the first significant rainfall events after long dry periods, and the runoff was the first flush of the watershed (see Figure 3-2). Median concentrations of TOC and DOC were 5.9 and 5.7 mg/L, respectively (Table 4-1), which were considerably higher than those reported during the previous summary period (DWR 2003a). It is not yet known whether the increased concentrations were the result of trends in the watershed or due to increased sampling frequency in this reporting period. A Mann-Whitney analysis indicated that there was no significant difference between median TOC and DOC at this site (p=0.4272), suggesting that organic carbon was primarily in the dissolved form. Although organic carbon concentrations at NEMDC were much higher than those in the water of the nearby Sacramento River, the discharge was small relative to inflows from both the American and Sacramento rivers. Organic carbon loading at this site is under investigation by MWQI.
Figure 4-7 Organic carbon at Mallard Island and Natomas East Main Drainage Canal
Oct
-01
N
ov-0
1
Dec
-01
Ja
n-02
Fe
b-02
M
ar-0
2
Apr-0
2
May
-02
Ju
n-02
Ju
l-02
Au
g-02
Se
p-02
O
ct-0
2
Nov
-02
D
ec-0
2
Jan-
03
Feb-
03
Mar
-03
Ap
r-03
M
ay-0
3
Jun-
03
Jul-0
3
Aug-
03
Sep-
03
Oct
-03
Org
anic
car
bon
(mg/
L)
0.0
2.0
4.0
6.0
TOCDOC
Mallard Island
Natomas East Main Drainage Canal
Oct
-01
N
ov-0
1
Dec
-01
Ja
n-02
Fe
b-02
M
ar-0
2
Apr-0
2
May
-02
Ju
n-02
Ju
l-02
Au
g-02
Se
p-02
O
ct-0
2
Nov
-02
D
ec-0
2
Jan-
03
Feb-
03
Mar
-03
Ap
r-03
M
ay-0
3
Jun-
03
Jul-0
3
Aug-
03
Sep-
03
Oct
-03
Org
anic
car
bon
(mg/
L)
0.0
10.0
20.0
30.0
40.0
TOCDOC

MWQI Summary and Findings from Data Collected Oct 2001 through Sep 2003 4-8 Chapter 4 Organic Carbon
Ultraviolet Absorbance at 254 nm
This section discusses relationships between ultraviolet absorbance (UVA) and organic carbon in Delta source waters. Historically, UVA is measured at a wavelength of 254 nm, and thus is commonly referred to as UVA254. UVA254 has been used as a surrogate measure of organic carbon for monitoring wastewater effluents and for evaluating organic matter removal by coagulation in WTPs (Eaton and others 1995). More recently, aromatic compounds have been implicated as disinfection byproduct precursors. UVA254 was used as an indicator of aromaticity of organic carbon and, subsequently, for predicting the abundances of precursors of various DBPs. Ranges of UVA254 in Delta Waters During the 2-year reporting period, 560 samples were collected throughout the Delta and measured for both UVA254 and organic carbon. A summary of sample distribution among stations and statistics is presented in Table 4-2. Based on the UVA data in Table 4-2, the 11 stations may be divided into 3 groups: rivers, channel/diversions, and urban drainage. The first group is the river stations, which include the American River, Sacramento River, SJR, and the Mallard Island stations. The water from these stations had the lowest UVA254 with medians ranging from 0.036 cm-1 to 0.084 cm-1 (Table 4-2). Among the river stations, the SJR near Vernalis had the highest median UVA254, followed by the Mallard station. The American River and upper Sacramento River stations had the lowest median UVA254. These spatial patterns are consistent with the spatial pattern for organic carbon (Table 4-1). The second group—channel/diversions—includes the 2 channel stations on Old River and the diversion stations Banks Pumping Plant, DMC, and Contra Costa Pumping Plant (Table 4-2). UVA254 at these stations were higher than at the river stations with UVA254 ranging from 0.087 to 0.119 cm-1 (Table 4-2). The urban drainage station had the highest median organic carbon among all stations (Table 4-1) and, consequently, the highest median UVA254, which was 0.164 (Table 4-2). Specific UVA254 and DOC UVA254 normalized on a carbon basis (that is, the ratio of UVA254 over DOC) is defined as specific UVA254 (SUVA254). SUVA254 has been used to compare organic carbon aromaticity and DBP formation potentials among different sites. Table 4-3 summarizes the SUVA data from 558 samples, which were measured with both UVA254 and DOC by oxidation. Based on the SUVA data, the 11 stations may be divided into 2 distinct groups. The first group includes the American River, Sacramento River, SJR, and NEMDC, which are stations either outside the Delta or near the edge of the Delta. Median SUVA254 for these stations narrowly ranged from 0.025 cm-1 to 0.030 cm-1(Table 4-3). The other group includes the 2 channel stations, the diversion stations, and the Mallard Island station, which are in central or southern Delta. Median SUVA254 was in the narrow range from 0.034 to 0.037 (Table 4-2).
Table 4-2 Summary of UVA254 at 11 MWQI stations
Table 4-3 Summary of SUVA254 at 11 MWQI stations

MWQI Summary and Findings from Data Collected Oct 2001 through Sep 2003 4-9 Chapter 4 Organic Carbon
Relationships between UVA254 and Organic Carbon in Delta Waters A linear relationship exists between UVA254 and organic carbon (Figure 4-8). The linear relation was less variable between UVA254 and DOC than that between UVA254 and TOC (Figure 4-8). Between the 2 methods used for determining TOC and DOC, the linear relationships between TOC and DOC by oxidation and UVA254 had less unexplained variability than those between UVA254 and TOC and DOC by combustion (Figure 4-8). Despite an apparent linear relationship, considerable scattering occurred. As discussed in the previous summary report (DWR 2003a), use of a single linear relationship to describe data collected from different sites may not be appropriate. UVA254 varies both by site and by season. At a specific site, DOC is generally higher during the wet months than during the dry months. UVA254 and DOC relationships for samples collected during the dry months differed from those relationships in samples collected during the wet months, even when the samples were from the same station (DWR 2003a).
Relationships between Organic Carbon Concentrations Measured by Two Different
Methods Although TOC and DOC data summarized in previous sections were analyzed by oxidation, some TOC and DOC were determined by both combustion and oxidation. This section briefly describes some of the differences between methods. A more detailed analysis on this subject may be found in an upcoming MWQI report summarizing a multiyear method comparison study. In general, relatively small differences were observed in DOC determined by both methods, but considerable differences were found between TOC by the 2 methods. The relationship between DOC by oxidation and combustion may be described by this linear equation:
DOC by combustion = 1.067 * DOC by oxidation + 0.767 (Figure 4-9a). The slope for the above equation was 1.067, suggesting that the difference between DOC by both methods was small. In contrast, the slope for the linear equation for TOC was 1.27 (Figure 4-9b), suggesting that TOC by combustion was about 27% higher than TOC by oxidation. There was a linear relationship between TOC and DOC by either method (Figure 4-9c and 4-9d), but the relationship between TOC and DOC by oxidation had much less unexplained variability than that between TOC and DOC by combustion. For this reason, MWQI is currently using the oxidation methods for both TOC and DOC. When using the oxidation method, TOC is approximately 20% higher than DOC; whereas TOC was 35% more than DOC using the combustion method (Figure 4-9c and 4-9d).
Figure 4-8 Relationships between UVA254 and organic carbon concentrations measured by two different methods
Figure 4-9(a-d) Organic carbon determined by two different methods
TOC by oxtidation, mg/L
0.0 10.0 20.0 30.0 40.0
TOC
by
com
bust
ion,
mg/
L
0.0
10.0
20.0
30.0
40.0
50.0Y =0.923 + 1.270 X , p for regression <0.0001
r2 = 0.8144, N = 383
DOC by oxtidation, mg/L
0.0 5.0 10.0 15.0 20.0 25.0
TOC
by
oxid
atio
n, m
g/L
0.0
10.0
20.0
30.0
40.0
Y = -0.286 + 1.192 X , p for regression <0.0001
r2 = 0.9187, N = 583
DOC by combustion, mg/L
0.0 5.0 10.0 15.0 20.0 25.0
TOC
by
com
bust
ion,
mg/
L
0.0
10.0
20.0
30.0
40.0
50.0
Y = -0.100 + 1.353 X , p for regression <0.0001
r2 = 0.8279, N = 317
DOC by oxtidation, mg/L
0.0 5.0 10.0 15.0 20.0 25.0
DO
C b
y co
mbu
stio
n, m
g/L
0.0
5.0
10.0
15.0
20.0
25.0
30.0
Y = 0.767 + 1.067 X , p for regression < 0.0001
r2 = 0.8312, N = 320
(a) (b)
(c)(d)
TOC (combustion), mg/L
0 1 2 3 4 5 6 7 8 9 10 11 12 13 14 15
UV
A 254
0.000
0.100
0.200
0.300
0.400 Y = 0.0119 + 0.0164 X , p < 0.0001 for regression
r2 = 0.6858, N = 357
3 data points with TOC >15 mg/L not shown
DOC (combustion), mg/L
0 1 2 3 4 5 6 7 8 9 10 11 12 13 14 15
UVA
254
0.000
0.100
0.200
0.300
0.400 Y = -0.0075 + 0.0262 X , p < 0.001 for regression
r2 = 0.7750, N = 316
DOC (oxidation), mg/L
0 2 4 6 8 10
UV
A25
4
0.000
0.100
0.200
0.300
0.400 Y = -0.0063 + 0.0351X , p <0.0001 for regression
r2 = 0.8588, N = 557
3 data points with DOC>10 mg/L not shown
TOC (oxidation), mg/L
0 2 4 6 8 10
UV
A25
4
0.000
0.100
0.200
0.300
0.400Y = 0.0114 + 0.0265 X , p <0.0001 for regression
r2 = 0.7644, N = 557
4 data points with TOC > 10 mg/L not shown
2 data points with DOC >15 mg/L not shown

MWQI Summary and Findings from Data Collected Oct 2001 through Sep 2003 4-10 Chapter 4 Organic Carbon
Chapter 4 Organic Carbon
Figures Figure 4-1 Location of monitoring stations (▲) near the City of Sacramento ....................................................... 4-11 Figure 4-2 Organic carbon at the American River and West Sacramento WTP Intake.......................................... 4-12 Figure 4-3 Organic carbon at Sacramento River at Hood....................................................................................... 4-13 Figure 4-4 Organic carbon at San Joaquin River near Vernalis.............................................................................. 4-14 Figure 4-5 Organic carbon at two Old River stations ............................................................................................. 4-15 Figure 4-6 Organic carbon at three Delta diversion stations .................................................................................. 4-16 Figure 4-7 Organic carbon at Mallard Island and Natomas East Main Drainage Canal......................................... 4-17 Figure 4-8 Relationships between UVA254 and organic carbon concentrations measured by two different
methods.................................................................................................................................................. 4-18 Figure 4-9 Organic carbon determined by two different methods.......................................................................... 4-19
Tables Table 4-1 Summary of organic carbon at 11 MWQI stations................................................................................. 4-20 Table 4-2 Summary of UVA254 at 11 MWQI stations ............................................................................................ 4-21 Table 4-3 Summary of SUVA254 at 11 MWQI stations.......................................................................................... 4-21

MWQI Summary and Findings from Data Collected Oct 2001 through Sep 2003 4-11 Chapter 4 Organic Carbon
Figure 4-1 Location of monitoring stations (▲) near the City of Sacramento

MWQI Summary and Findings from Data Collected Oct 2001 through Sep 2003 4-12 Chapter 4 Organic Carbon
Figure 4-2 Organic carbon at the American River and West Sacramento WTP Intake
West Sacramento Water Treatment Plant Intake
Oct
-01
N
ov-0
1
Dec
-01
Ja
n-02
Fe
b-02
M
ar-0
2
Apr-0
2
May
-02
Ju
n-02
Ju
l-02
Au
g-02
Se
p-02
O
ct-0
2
Nov
-02
D
ec-0
2
Jan-
03
Feb-
03
Mar
-03
Ap
r-03
M
ay-0
3
Jun-
03
Jul-0
3
Aug-
03
Sep-
03
Oct
-03
Org
anic
Car
bon
(mg/
L)
1.0
2.0
3.0
American River at E.A. Fairbairn WTP Intake
TOC DOC
Oct
-01
N
ov-0
1
Dec
-01
Ja
n-02
Fe
b-02
M
ar-0
2
Apr-0
2
May
-02
Ju
n-02
Ju
l-02
Au
g-02
Se
p-02
O
ct-0
2
Nov
-02
D
ec-0
2
Jan-
03
Feb-
03
Mar
-03
Ap
r-03
M
ay-0
3
Jun-
03
Jul-0
3
Aug-
03
Sep-
03
Oct
-03
Org
anic
Car
bon
(mg/
L)
1.0
2.0
3.0
4.0
5.0
6.0
TOC DOC

MWQI Summary and Findings from Data Collected Oct 2001 through Sep 2003 4-13 Chapter 4 Organic Carbon
Figure 4-3 Organic carbon at Sacramento River at Hood
Oct
-01
N
ov-0
1
Dec
-01
Ja
n-02
Fe
b-02
M
ar-0
2
Apr-0
2
May
-02
Ju
n-02
Ju
l-02
Au
g-02
Se
p-02
O
ct-0
2
Nov
-02
D
ec-0
2
Jan-
03
Feb-
03
Mar
-03
Ap
r-03
M
ay-0
3
Jun-
03
Jul-0
3
Aug-
03
Sep-
03
Oct
-03
Org
anic
car
bon
(mg/
L)
1.0
2.0
3.0
4.0
5.0
6.0
TOCDOC
Rice drainageRice drainage

MWQI Summary and Findings from Data Collected Oct 2001 through Sep 2003 4-14 Chapter 4 Organic Carbon
Figure 4-4 Organic carbon at San Joaquin River near Vernalis
Oct
-01
N
ov-0
1
Dec
-01
Ja
n-02
Fe
b-02
M
ar-0
2
Apr-0
2
May
-02
Ju
n-02
Ju
l-02
Au
g-02
Se
p-02
O
ct-0
2
Nov
-02
D
ec-0
2
Jan-
03
Feb-
03
Mar
-03
Ap
r-03
M
ay-0
3
Jun-
03
Jul-0
3
Aug-
03
Sep-
03
Oct
-03
Org
anic
car
bon
(mg/
L)
1.0
2.0
3.0
4.0
5.0
6.0
7.0
8.0TOCDOC
VAMP VAMP

MWQI Summary and Findings from Data Collected Oct 2001 through Sep 2003 4-15 Chapter 4 Organic Carbon
Figure 4-5 Organic carbon at two Old River stations
Old River at Bacon Island
Oct
-01
N
ov-0
1
Dec
-01
Ja
n-02
Fe
b-02
M
ar-0
2
Apr-0
2
May
-02
Ju
n-02
Ju
l-02
Au
g-02
Se
p-02
O
ct-0
2
Nov
-02
D
ec-0
2
Jan-
03
Feb-
03
Mar
-03
Ap
r-03
M
ay-0
3
Jun-
03
Jul-0
3
Aug-
03
Sep-
03
Oct
-03
Org
anic
car
bon
(mg/
L)
2.0
4.0
6.0
8.0
TOCDOC
Old River at Station 9
Oct
-01
N
ov-0
1
Dec
-01
Ja
n-02
Fe
b-02
M
ar-0
2
Apr-0
2
May
-02
Ju
n-02
Ju
l-02
Au
g-02
Se
p-02
O
ct-0
2
Nov
-02
D
ec-0
2
Jan-
03
Feb-
03
Mar
-03
Ap
r-03
M
ay-0
3
Jun-
03
Jul-0
3
Aug-
03
Sep-
03
Oct
-03
Org
anic
car
bon
(mg/
L)
2.0
4.0
6.0
8.0
TOCDOC

MWQI Summary and Findings from Data Collected Oct 2001 through Sep 2003 4-16 Chapter 4 Organic Carbon
Figure 4-6 Organic carbon at three Delta diversion stations
Banks Pumping Plant
Oct
-01
N
ov-0
1
Dec
-01
Ja
n-02
Fe
b-02
M
ar-0
2
Apr-0
2
May
-02
Ju
n-02
Ju
l-02
Au
g-02
Se
p-02
O
ct-0
2
Nov
-02
D
ec-0
2
Jan-
03
Feb-
03
Mar
-03
Ap
r-03
M
ay-0
3
Jun-
03
Jul-0
3
Aug-
03
Sep-
03
Oct
-03
Org
anic
Car
bon
(mg/
L)
0.0
3.0
6.0
9.0
TOCDOC
Delta-Mendota Canal
Oct
-01
N
ov-0
1
Dec
-01
Ja
n-02
Fe
b-02
M
ar-0
2
Apr-0
2
May
-02
Ju
n-02
Ju
l-02
Au
g-02
Se
p-02
O
ct-0
2
Nov
-02
D
ec-0
2
Jan-
03
Feb-
03
Mar
-03
Ap
r-03
M
ay-0
3
Jun-
03
Jul-0
3
Aug-
03
Sep-
03
Oct
-03
Org
anic
Car
bon
(mg/
L)
0.0
3.0
6.0
9.0
TOCDOC
Contra Costa Pumping Plant
Oct
-01
N
ov-0
1
Dec
-01
Ja
n-02
Fe
b-02
M
ar-0
2
Apr-0
2
May
-02
Ju
n-02
Ju
l-02
Au
g-02
Se
p-02
O
ct-0
2
Nov
-02
D
ec-0
2
Jan-
03
Feb-
03
Mar
-03
Ap
r-03
M
ay-0
3
Jun-
03
Jul-0
3
Aug-
03
Sep-
03
Oct
-03
Org
anic
Car
bon
(mg/
L)
0.0
3.0
6.0
9.0
TOCDOC

MWQI Summary and Findings from Data Collected Oct 2001 through Sep 2003 4-17 Chapter 4 Organic Carbon
Figure 4-7 Organic carbon at Mallard Island and Natomas East Main Drainage Canal
Oct
-01
N
ov-0
1
Dec
-01
Ja
n-02
Fe
b-02
M
ar-0
2
Apr-0
2
May
-02
Ju
n-02
Ju
l-02
Au
g-02
Se
p-02
O
ct-0
2
Nov
-02
D
ec-0
2
Jan-
03
Feb-
03
Mar
-03
Ap
r-03
M
ay-0
3
Jun-
03
Jul-0
3
Aug-
03
Sep-
03
Oct
-03
Org
anic
car
bon
(mg/
L)
0.0
2.0
4.0
6.0
TOCDOC
Mallard Island
Natomas East Main Drainage Canal
Oct
-01
N
ov-0
1
Dec
-01
Ja
n-02
Fe
b-02
M
ar-0
2
Apr-0
2
May
-02
Ju
n-02
Ju
l-02
Au
g-02
Se
p-02
O
ct-0
2
Nov
-02
D
ec-0
2
Jan-
03
Feb-
03
Mar
-03
Ap
r-03
M
ay-0
3
Jun-
03
Jul-0
3
Aug-
03
Sep-
03
Oct
-03
Org
anic
car
bon
(mg/
L)
0.0
10.0
20.0
30.0
40.0
TOCDOC

MWQI Summary and Findings from Data Collected Oct 2001 through Sep 2003 4-18 Chapter 4 Organic Carbon
Figure 4-8 Relationships between UVA254 and organic carbon concentrations measured by two different methods
TOC (combustion), mg/L
0 1 2 3 4 5 6 7 8 9 10 11 12 13 14 15
UV
A 254
0.000
0.100
0.200
0.300
0.400 Y = 0.0119 + 0.0164 X , p < 0.0001 for regression
r2 = 0.6858, N = 357
3 data points with TOC >15 mg/L not shown
DOC (combustion), mg/L
0 1 2 3 4 5 6 7 8 9 10 11 12 13 14 15
UV
A 254
0.000
0.100
0.200
0.300
0.400 Y = -0.0075 + 0.0262 X , p < 0.001 for regression
r2 = 0.7750, N = 316
DOC (oxidation), mg/L
0 2 4 6 8 10
UVA
254
0.000
0.100
0.200
0.300
0.400 Y = -0.0063 + 0.0351X , p <0.0001 for regression
r2 = 0.8588, N = 557
3 data points with DOC>10 mg/L not shown
TOC (oxidation), mg/L
0 2 4 6 8 10
UVA
254
0.000
0.100
0.200
0.300
0.400Y = 0.0114 + 0.0265 X , p <0.0001 for regression
r2 = 0.7644, N = 557
4 data points with TOC > 10 mg/L not shown
2 data points with DOC >15 mg/L not shown

MWQI Summary and Findings from Data Collected Oct 2001 through Sep 2003 4-19 Chapter 4 Organic Carbon
Figure 4-9 Organic carbon determined by two different methods
TOC by oxtidation, mg/L
0.0 10.0 20.0 30.0 40.0
TOC
by
com
bust
ion,
mg/
L
0.0
10.0
20.0
30.0
40.0
50.0Y =0.923 + 1.270 X , p for regression <0.0001
r2 = 0.8144, N = 383
DOC by oxtidation, mg/L
0.0 5.0 10.0 15.0 20.0 25.0
TOC
by
oxid
atio
n, m
g/L
0.0
10.0
20.0
30.0
40.0
Y = -0.286 + 1.192 X , p for regression <0.0001
r2 = 0.9187, N = 583
DOC by combustion, mg/L
0.0 5.0 10.0 15.0 20.0 25.0
TOC
by
com
bust
ion,
mg/
L
0.0
10.0
20.0
30.0
40.0
50.0
Y = -0.100 + 1.353 X , p for regression <0.0001
r2 = 0.8279, N = 317
DOC by oxtidation, mg/L
0.0 5.0 10.0 15.0 20.0 25.0
DO
C b
y co
mbu
stio
n, m
g/L
0.0
5.0
10.0
15.0
20.0
25.0
30.0Y = 0.767 + 1.067 X , p for regression < 0.0001
r2 = 0.8312, N = 320
(a)(b)
(c)(d)

MWQI Summary and Findings from Data Collected Oct 2001 through Sep 2003 4-20 Chapter 4 Organic Carbon
Table 4-1 Summary of organic carbon at 11 MWQI stations
River Sample ------------------(units in cm-1)----------------- Station mileagea Constituentb number Range Average Median American and Sacramento River American River at E.A. Fairbairn WTP
TOC 58 1.2–2.8 1.5 1.5
DOC 59 1.1–2.7 1.5 1.4 West Sacramento WTP Intake 63.2 TOC 61 1.2–5.4 2.4 2.0 DOC 61 1.1–4.9 2.2 1.8 Sacramento River at Hood 38.6 TOC 100 1.2–5.5 2.1 1.8 DOC 100 1.2–5.1 1.9 1.7 San Joaquin River stations
San Joaquin River near Vernalis TOC 103 2.1–7.8 3.8 3.7 DOC 103 2.0–8.0 3.2 2.9 Delta channel stations Old River at Station 9 TOC 63 1.9–8.4 3.7 3.5 DOC 63 1.8–8.2 3.6 3.4 Old River at Bacon Island TOC 62 1.7–7.5 3.4 3.2 DOC 61 1.8–7.1 3.3 3.0 Diversion stations Banks Pumping Plant TOC 24 1.9–8.4 3.3 3.2 DOC 24 1.9–8.3 3.2 2.9 Delta-Mendota Canal TOC 23 2.0–8.5 3.5 3.2 DOC 24 2.1–8.3 3.3 3.0 Contra Costa Pumping Plant TOC 21 2.1–5.4 3.4 3.2
DOC 21 2.2–5.4 3.3 3.2 Other stations Sacramento River at Mallard Island -4.1 TOC 24 1.6–5.5 2.6 2.4 DOC 24 1.3–4.9 2.1 1.9 Natomas East Main Drainage Canal (NEMDC)
TOC 47 4.2–36.6 7.2 5.9
DOC 47 4.3–22.3 6.5 5.7 a. River miles from Collinsville at the junction of the Sacramento and San Joaquin rivers. b. Both TOC and DOC were determined by the wet oxidation method.

MWQI Summary and Findings from Data Collected Oct 2001 through Sep 2003 4-21 Chapter 4 Organic Carbon
Table 4-2 Summary of UVA254 at 11 MWQI stations Sample ------------------(units in cm-1)-----------------
Station number Range Average Median American and Sacramento River stations
American River at E.A. Fairbairn WTP 59 0.024–0.078 0.037 0.036 West Sacramento WTP Intake 61 0.031–0.200 0.072 0.057 Sacramento River at Hood 101 0.031–0.210 0.059 0.045
San Joaquin River stations San Joaquin River near Vernalis 102 0.058–0.292 0.095 0.084
Delta channel stations Old River at Station 9 62 0.063–0.320 0.137 0.119 Old River at Bacon Island 61 0.055–0.295 0.127 0.110
Diversion stations Banks Pumping Plant 22 0.067–0.304 0.107 0.087 Contra Costa Pumping Plant 21 0.067–0.186 0.108 0.100
Other stations Sacramento River at Mallard Island 24 0.049–0.295 0.083 0.068 Natomas East Main Drainage Canal (NEMDC) 47 0.096–0.666 0.204 0.164
Table 4-3 Summary of SUVA254 at 11 MWQI stations Sample -----------------(units in cm-1)-----------------
Station number Range Average Median American and Sacramento River stations
American River at E.A. Fairbairn WTP 59 0.016–0.033 0.025 0.025 West Sacramento WTP Intake 61 0.022–0.081 0.033 0.030 Sacramento River at Hood 100 0.021–0.083 0.029 0.027 San Joaquin River stations
San Joaquin River near Vernalis 102 0.019–0.061 0.030 0.029 Delta channel stations Old River at Station 9 62 0.029–0.068 0.037 0.035 Old River at Bacon Island 60 0.028–0.066 0.037 0.036 Diversion stations Banks Pumping Plant 22 0.023–0.042 0.034 0.034
Contra Costa Pumping Plant 21 0.027–0.037 0.033 0.033
Other stations Sacramento River at Mallard Island 24 0.030–0.060 0.037 0.037 Natomas East Main Drainage Canal (NEMDC) 47 0.018–0.041 0.031 0.029

MWQI Summary and Findings from Data Collected Oct 2001 through Sep 2003 5-i Chapter 5 Bromide
Chapter 5 Bromide
Contents Chapter 5 Bromide................................................................................................... 5-1
American and Sacramento Rivers........................................................................ 5-1 San Joaquin River Station near Vernalis ............................................................. 5-1 Channel Stations .................................................................................................. 5-2 Diversion Stations................................................................................................ 5-3 Other Stations ...................................................................................................... 5-4
Mallard Island.................................................................................................. 5-4 Urban Drainage................................................................................................ 5-5
Sources of Bromide in Delta Waters ................................................................... 5-5 Direct Seawater influence................................................................................ 5-5 Recirculation of Bromide within the San Joaquin Valley................................ 5-6
Figures Figure 5-1 Bromide concentrations at San Joaquin River near Vernalis ................ 5-8 Figure 5-2 Bromide concentrations at two Old River stations................................ 5-9 Figure 5-3 Bromide concentrations at three diversion stations..............................5-10 Figure 5-4 Bromide concentrations at the Mallard Island station..........................5-11 Figure 5-5 Bromide concentrations at the Natomas East Main Drainage Canal....5-12 Figure 5-6 The relationship between bromide and chloride at six stations............5-13
Tables Table 5-1 Summary of bromide at 11 MWQI stations ..........................................5-14 Table 5-2 Bromide at diversion stations: current vs. previous summary period....5-15
Chapter 5 figures and tables
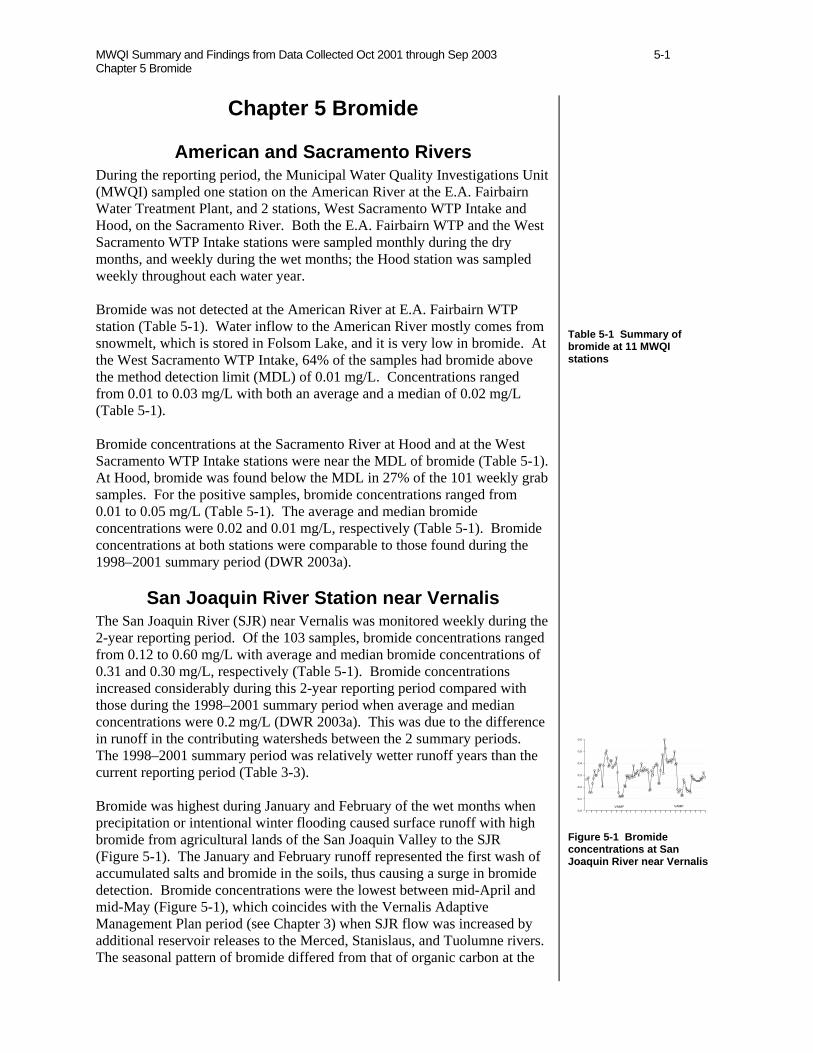
MWQI Summary and Findings from Data Collected Oct 2001 through Sep 2003 5-1 Chapter 5 Bromide
Chapter 5 Bromide
American and Sacramento Rivers During the reporting period, the Municipal Water Quality Investigations Unit (MWQI) sampled one station on the American River at the E.A. Fairbairn Water Treatment Plant, and 2 stations, West Sacramento WTP Intake and Hood, on the Sacramento River. Both the E.A. Fairbairn WTP and the West Sacramento WTP Intake stations were sampled monthly during the dry months, and weekly during the wet months; the Hood station was sampled weekly throughout each water year. Bromide was not detected at the American River at E.A. Fairbairn WTP station (Table 5-1). Water inflow to the American River mostly comes from snowmelt, which is stored in Folsom Lake, and it is very low in bromide. At the West Sacramento WTP Intake, 64% of the samples had bromide above the method detection limit (MDL) of 0.01 mg/L. Concentrations ranged from 0.01 to 0.03 mg/L with both an average and a median of 0.02 mg/L (Table 5-1). Bromide concentrations at the Sacramento River at Hood and at the West Sacramento WTP Intake stations were near the MDL of bromide (Table 5-1). At Hood, bromide was found below the MDL in 27% of the 101 weekly grab samples. For the positive samples, bromide concentrations ranged from 0.01 to 0.05 mg/L (Table 5-1). The average and median bromide concentrations were 0.02 and 0.01 mg/L, respectively (Table 5-1). Bromide concentrations at both stations were comparable to those found during the 1998–2001 summary period (DWR 2003a).
San Joaquin River Station near Vernalis The San Joaquin River (SJR) near Vernalis was monitored weekly during the 2-year reporting period. Of the 103 samples, bromide concentrations ranged from 0.12 to 0.60 mg/L with average and median bromide concentrations of 0.31 and 0.30 mg/L, respectively (Table 5-1). Bromide concentrations increased considerably during this 2-year reporting period compared with those during the 1998–2001 summary period when average and median concentrations were 0.2 mg/L (DWR 2003a). This was due to the difference in runoff in the contributing watersheds between the 2 summary periods. The 1998–2001 summary period was relatively wetter runoff years than the current reporting period (Table 3-3). Bromide was highest during January and February of the wet months when precipitation or intentional winter flooding caused surface runoff with high bromide from agricultural lands of the San Joaquin Valley to the SJR (Figure 5-1). The January and February runoff represented the first wash of accumulated salts and bromide in the soils, thus causing a surge in bromide detection. Bromide concentrations were the lowest between mid-April and mid-May (Figure 5-1), which coincides with the Vernalis Adaptive Management Plan period (see Chapter 3) when SJR flow was increased by additional reservoir releases to the Merced, Stanislaus, and Tuolumne rivers. The seasonal pattern of bromide differed from that of organic carbon at the
Table 5-1 Summary of bromide at 11 MWQI stations
Figure 5-1 Bromide concentrations at San Joaquin River near Vernalis
0.0
0.1
0.2
0.3
0.4
0.5
0.6
VAMPVAMP

MWQI Summary and Findings from Data Collected Oct 2001 through Sep 2003 5-2 Chapter 5 Bromide
Vernalis station. Organic carbon concentrations at Vernalis were generally lower and less variable during the dry months than during the wet months (see Chapter 4); however, bromide concentrations remained relatively high throughout the dry months (Figure 5-1). Seasonal patterns of bromide in the SJR reflect both rainfall and agricultural practices in the watershed. The San Joaquin Valley is mostly irrigated agricultural land. Irrigation water for the area comes from the Delta-Mendota Canal (DMC), a Delta diversion station, and contains considerable bromide (Table 5-1) and recirculates within the San Joaquin Valley. When irrigation water is applied, bromide concentrates on the soil surface through evapotranspiration. Following either irrigation or rainfall, runoff water carries previously accumulated bromide on the soil surface and moves it into the SJR. Soils in some areas were developed from old marine deposits that contain high levels of bromide, which may be concentrated on the soil surface and washed into the river during wet months of low to moderate rainfall. In some areas, shallow groundwater also carries high levels of bromide and moves into the SJR through seepage. On the other hand, inflow water in the upstream watershed with low bromide is mostly trapped in upstream reservoirs for flood control or storage purposes during the wet months resulting in less dilution downstream; therefore, bromide concentrations in the lower part of the river are high during the wet months. During the dry months, irrigation return waters containing elevated levels of bromide are discharged into the SJR. Thus, bromide concentrations generally increased during periods of peak irrigation (May through September) and decreased at the end of the irrigation season prior to increases in the wet months (Figure 5-1). During the reporting period, 2002 Water Year was a “dry runoff year,” whereas 2003 WY was considered a “below normal year” in the SJR watershed (refer to Chapter 3). Median bromide concentrations between the 2 water years were not statistically different (p=0.5683), nor was the difference in median bromide concentrations between the wet months of the 2 water years (p=0.2223). However, the median bromide concentration (0.30 mg/L) during the dry months of 2002 WY was significantly higher than that (0.25 mg/L) of the dry months of 2003 WY (p=0.0006), according to the nonparametric Mann-Whitney test. This was attributable to irrigation returns with modest bromide concentrations and decreased inflows with low bromide levels from the tributaries on the east side of the upper SJR.
Channel Stations MWQI monitored bromide at 2 channel stations—Old River at Station 9 and Old River at Bacon Island. The 2 monitoring stations are approximately 9 miles apart along Old River. The Woodward and North Victoria canals and Indian Slough join this section of the river. Although about 10 agricultural return sites drain to this section of Old River from Holland, Bacon, Orwood, Woodward, and Victoria islands/tracts, water quality between the 2 sites does not differ significantly. During the 2-year reporting period, bromide was always above the reporting limit (Table 5-1). Median concentrations of bromide were 0.10 mg/L at

MWQI Summary and Findings from Data Collected Oct 2001 through Sep 2003 5-3 Chapter 5 Bromide
Station 9 and 0.09 mg/L at the Bacon Island station (Table 5-1), which were not statistically different (p=0.2929) according to the nonparametric Mann-Whitney test. These median bromide concentrations were similar to those found during the 1998–2001 summary period (DWR 2003a). Temporal patterns of bromide were similar for both channel stations (Figure 5-2) and were similar to those of organic carbon. Concentrations were higher from October to February and decreased and remained relatively unchanged from February to July during the 2 water years (Figure 5-2). This seasonality pattern differed from that of the SJR station near Vernalis (Figure 5-1). At both stations (Figure 5-2), bromide concentrations were as elevated from July to October of 2002 WY as during the wet months. This was because 2002 WY was a dry runoff year. Total Delta outflows reached the lowest from July to October of 2002 WY (see Figure 3-5). The tides brought in seawater to the Delta, which increased bromide concentrations. The 2003 WY was a relatively wetter year, and thus total Delta outflow was greater (see Figure 3-5). Therefore, an increase in bromide concentrations around July 2003 was not as great as from July to October of 2002 WY. Precipitation and runoff in the watershed had a significant impact on bromide concentrations at the 2 stations. Median bromide concentrations at Station 9 were 0.11 and 0.09 mg/L for 2002 WY and 2003 WY, respectively; median bromide concentrations at Bacon Island were 0.09 and 0.05 mg/L for 2002 WY and 2003 WY, respectively. For both stations, median bromide concentrations were significantly higher during 2002 WY than in 2003 WY (p was 0.0447 and 0.0213 for Station 9 and Bacon Island, respectively). The effect of runoff in the watershed on bromide concentration was also clearly demonstrated during the dry months (Figure 5-2). The 2002 WY was considered a dry runoff year in the SJR watershed (refer to Chapter 3). Bromide concentrations increased from about 0.10 mg/L at the end of June 2002 to more than 0.40 mg/L from July to September 2002. The 2003 WY was a wetter year and classified as a “below normal year” in the SJR watershed (refer to Chapter 3). The sudden increase in bromide levels from July to September 2002 did not occur from July to September 2003 (Figure 5-2). The lower bromide concentration from July to September 2003 was attributable to more reservoir releases and subsequently increased river flows from the Sacramento River and upper SJR (see Figures 3-3 and 3-4).
Diversion Stations Samples from 3 Delta diversion stations—Banks Pumping Plant, DMC, and Contra Costa Pumping Plant #1—were collected during the reporting period. The median bromide concentrations varied from 0.15 to 0.22 mg/L (Table 5-1). Average bromide concentrations ranged from 0.19 to 0.31 mg/L (Table 5-1). Both median and average bromide concentrations during the current summary period were higher than those of the previous summary period (Table 5-2). The lower bromide levels at the diversion stations during the previous summary period were very likely due to that period’s greater runoff in the watersheds (DWR 2003a).
Table 5-2 Bromide at diversion stations: current vs. previous summary period
Figure 5-2 Bromide concentrations at two Old River stations
Oct
No
De
JanFe M
aAprM
aJun
Jul-0Au SeO
ctN
oD
eJanFe M
aAprM
aJun
Jul-0Au Se
0.0
0.2
0.4
0.6Bacon Island Station 9

MWQI Summary and Findings from Data Collected Oct 2001 through Sep 2003 5-4 Chapter 5 Bromide
Seasonal patterns were similar for all 3 stations (Figure 5-3). In general, bromide reached its highest value from October through February of each water year. Bromide concentrations were lower from April through July (Figure 5-3). These seasonal patterns were different from those observed at the SJR station near Vernalis (Figure 5-2), reflecting the influences of multiple sources at the diversion pumps. Because the Contra Costa Pumping Plant #1 had a different sampling frequency, statistical comparisons of all 3 stations cannot be performed. However, because both Banks and DMC stations were sampled mostly on the same day, a Mann-Whitney test of median bromide concentration can be made. Results suggested that median bromide concentrations at Banks and DMC were not significantly different during the 2 water years (p=0.2745). Among the 3 diversion stations, both average and median bromide concentrations were highest at the Contra Costa Pumping Plant #1, perhaps due to the station’s proximity to seawater influence (see Figure 1-1). Seawater influence is related to Delta outflows. The 2002 WY was a dry runoff year for both the Sacramento and San Joaquin valleys, but 2003 WY was a wetter year compared with 2002 WY (Table 3-3). Outflow in 2002 WY was lower than in 2003 WY. Delta outflow was lower in 2002 WY (see Figure 3-5) due to reduced reservoir releases (see figures 3-3 and 3-4). Reduced outflows resulted in greater seawater influence to the western part of the Delta during 2002 WY. Therefore, bromide levels at all 3 stations were much higher during the latter part of the dry months (July to October) of 2002 WY (Figure 5-3). This July to October increase in bromide did not occur in the relatively wetter 2003 WY (Figure 5-3). The July to October increase in bromide in response to runoff year type was more pronounced at Contra Costa Pumping Plant than at the other 2 diversion stations due to its proximity to seawater influence.
Other Stations Mallard Island The Mallard Island station is more indicative of seawater influence than are the other stations. Water at this station is a mixture of water from rivers and channels in the Delta as well as water from the Bay. A total of 23 monthly samples were collected from this station during the 2-year period. Bromide was always above the reporting limit (Table 5-1). Concentrations ranged from 0.03 to 17.9 mg/L, making it the most widely variable of all 11 stations (Table 5-1). The average and median bromide concentrations were 4.06 and 2.00 mg/L, respectively, which were similar to those found during the previous summary period (DWR 2003a). Bromide at the Mallard Island station was much higher during the drier 2002 WY than during the relatively wetter 2003 WY (Figure 5-4). Higher bromide concentrations at Mallard during 2002 WY appear to have been directly related to runoff in the contributing watersheds. In 2002 WY, runoff was lower from both the Sacramento and San Joaquin watersheds than in 2003 WY (Table 3-3), reservoir releases and total Delta outflow were lower
Figure 5-3 Bromide concentrations at three diversion stations
Oct
No
De
JanFe M
aAp M
aJun
Jul-Au SeO
ctN
oD
eJanFe M
aAp M
aJun
Jul-Au SeO
ct
0.00
0.20
0.40
0.60
0.80Banks Pumping Plant Contra Costa Pumping Plant
Delta-Mendota Canal
Figure 5-4 Bromide concentrations at the Mallard Island stations
Oct-01
Nov-01
Dec-01
Jan-02 Feb-02 M
ar-02 Apr-02 M
ay-02Jun-02
Jul-02 Aug-02Sep-02O
ct-02 N
ov-02 D
ec-02Jan-03 Feb-03 M
ar-03 Apr-03 M
ay-03Jun-03
Jul-03 Aug-03Sep-03O
ct-03
0.00
3.00
6.00
9.00
12.00
15.00
18.00
Wetter runoff yearDrier runoff year
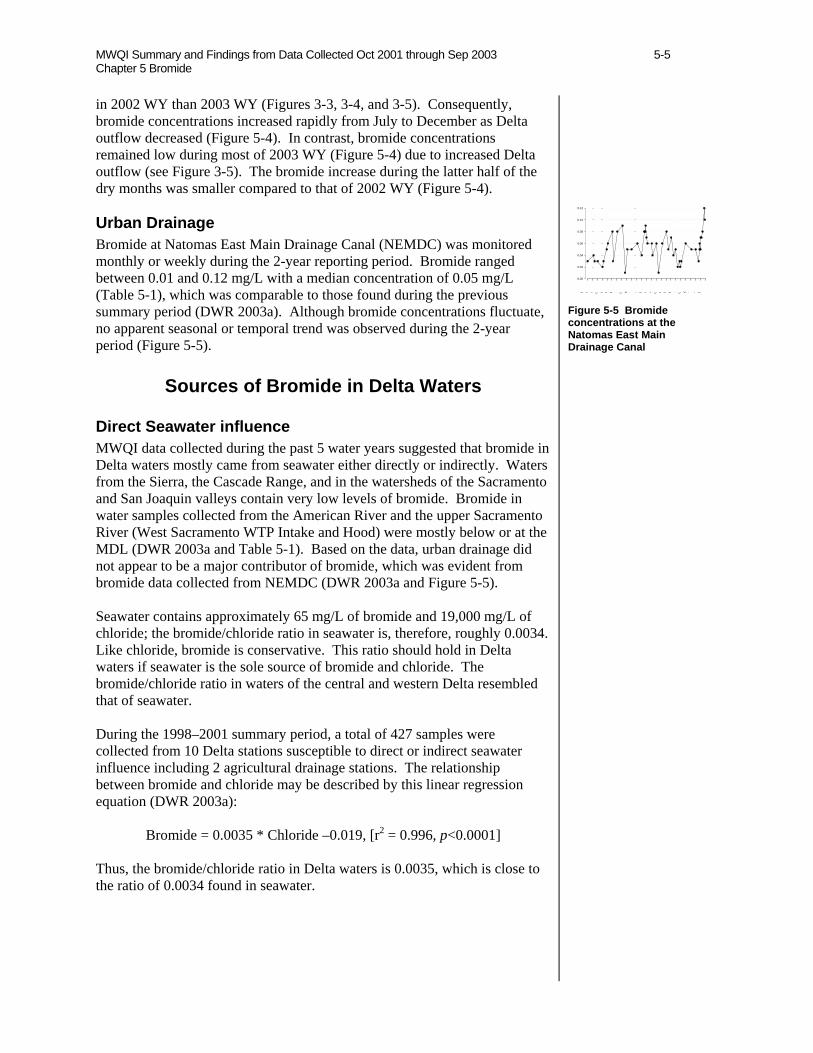
MWQI Summary and Findings from Data Collected Oct 2001 through Sep 2003 5-5 Chapter 5 Bromide
in 2002 WY than 2003 WY (Figures 3-3, 3-4, and 3-5). Consequently, bromide concentrations increased rapidly from July to December as Delta outflow decreased (Figure 5-4). In contrast, bromide concentrations remained low during most of 2003 WY (Figure 5-4) due to increased Delta outflow (see Figure 3-5). The bromide increase during the latter half of the dry months was smaller compared to that of 2002 WY (Figure 5-4). Urban Drainage Bromide at Natomas East Main Drainage Canal (NEMDC) was monitored monthly or weekly during the 2-year reporting period. Bromide ranged between 0.01 and 0.12 mg/L with a median concentration of 0.05 mg/L (Table 5-1), which was comparable to those found during the previous summary period (DWR 2003a). Although bromide concentrations fluctuate, no apparent seasonal or temporal trend was observed during the 2-year period (Figure 5-5).
Sources of Bromide in Delta Waters Direct Seawater influence MWQI data collected during the past 5 water years suggested that bromide in Delta waters mostly came from seawater either directly or indirectly. Waters from the Sierra, the Cascade Range, and in the watersheds of the Sacramento and San Joaquin valleys contain very low levels of bromide. Bromide in water samples collected from the American River and the upper Sacramento River (West Sacramento WTP Intake and Hood) were mostly below or at the MDL (DWR 2003a and Table 5-1). Based on the data, urban drainage did not appear to be a major contributor of bromide, which was evident from bromide data collected from NEMDC (DWR 2003a and Figure 5-5). Seawater contains approximately 65 mg/L of bromide and 19,000 mg/L of chloride; the bromide/chloride ratio in seawater is, therefore, roughly 0.0034. Like chloride, bromide is conservative. This ratio should hold in Delta waters if seawater is the sole source of bromide and chloride. The bromide/chloride ratio in waters of the central and western Delta resembled that of seawater. During the 1998–2001 summary period, a total of 427 samples were collected from 10 Delta stations susceptible to direct or indirect seawater influence including 2 agricultural drainage stations. The relationship between bromide and chloride may be described by this linear regression equation (DWR 2003a):
Bromide = 0.0035 * Chloride –0.019, [r2 = 0.996, p<0.0001] Thus, the bromide/chloride ratio in Delta waters is 0.0035, which is close to the ratio of 0.0034 found in seawater.
Figure 5-5 Bromide concentrations at the Natomas East Main Drainage Canal
O N D Ja F M A M JuJu A S O N D Ja F M A M JuJu A S O
0.00
0.02
0.04
0.06
0.08
0.10
0.12

MWQI Summary and Findings from Data Collected Oct 2001 through Sep 2003 5-6 Chapter 5 Bromide
During the current 2-year reporting period, 130 samples were collected from 6 Delta stations susceptible to direct or indirect seawater influence, the relationship between bromide and chloride may be described by this linear regression equation (Figure 5-6):
Bromide = 0.0032 * Chloride – 0.0096, [ r2 = 0.988, p<0.0001] A bromide/chloride ratio of 0.0032 is close to the bromide/chloride ratio of 0.0034 found in seawater. This analysis supports the hypothesis that the source of bromide in the Delta is primarily seawater. Of the 11 stations studied, the Mallard Island station is most indicative of seawater influence among the stations. Bromide concentrations at this station reached as high as 18 mg/L during the reporting period (Figure 5-4). Such high concentrations can only be from seawater because rivers, channels, and urban drains of the Delta all had substantially lower bromide levels. In fact, when Delta outflows were high, bromide at Mallard Island decreased to levels similar to Delta river and channel stations, such as from January to June of 2003 (Figure 5-4). Recirculation of Bromide within the San Joaquin Valley Recirculation of bromide within the San Joaquin Valley represents effects of indirect seawater influence. The SJR contributes significant amounts of bromide to Delta waters. Median bromide concentration of the SJR near Vernalis was 0.30 mg/L (Table 5-1). Bromide from seawater enters the San Joaquin Valley as irrigation water taken from the Delta. Bromide in the irrigation water is concentrated in the agricultural lands and returned to the Delta through the SJR. Delta soils are peaty soils, which were formed when the area was a tidal wetland; therefore, soil bromide content was high. Bromide and salts also have accumulated in Delta island soils through irrigation and evapotranspiration. Some islands have shallow groundwater, which also contributes bromide through seepage. When island drainage water is pumped back into the Delta, bromide is released into Delta channels. As shown in MWQI’s previous summary report, median bromide in island drainage waters ranged from 0.18 to 0.34 mg/L (DWR 2003a). Bromide concentrations in island drainage are even higher during the wet months when farmers apply water to their land to leach salts from the soil and then return the water to Delta channels during the winter. Heavy rainfall during the wet months also dissolves salts and carries these salts including bromide into the ditches, which are subsequently pumped into Delta channels. Most of the bromide in the San Joaquin Valley can be accounted for this way, but the valley also has intrinsic bromide sources, such as bromide from shallow groundwater or from soils developed from old marine deposits.
Figure 5-6 The relationship between bromide and chloride at six stations
Chloride, mg/L
0 50 100 150 200 2500.00
0.20
0.40
0.60
0.80Bromide = -0.0096 + 0.0032 ChlorideN= 130, r2 = 0.9880

MWQI Summary and Findings from Data Collected Oct 2001 through Sep 2003 5-7 Chapter 5 Bromide
Chapter 5 Bromide
Figures Figure 5-1 Bromide concentrations at San Joaquin River near Vernalis .................................................................. 5-8 Figure 5-2 Bromide concentrations at two Old River stations.................................................................................. 5-9 Figure 5-3 Bromide concentrations at three diversion stations............................................................................... 5-10 Figure 5-4 Bromide concentrations at the Mallard Island station........................................................................... 5-11 Figure 5-5 Bromide concentrations at the Natomas East Main Drainage Canal..................................................... 5-12 Figure 5-6 The relationship between bromide and chloride at six stations............................................................. 5-13
Tables Table 5-1 Summary of bromide at 11 MWQI stations ........................................................................................... 5-14 Table 5-2 Bromide at diversion stations: current vs. previous summary period..................................................... 5-15

MWQI Summary and Findings from Data Collected Oct 2001 through Sep 2003 5-8 Chapter 5 Bromide
Figure 5-1 Bromide concentrations at San Joaquin River near Vernalis
Oct
-01
N
ov-0
1
Dec
-01
Ja
n-02
Fe
b-02
M
ar-0
2
Apr-0
2
May
-02
Ju
n-02
Ju
l-02
Au
g-02
Se
p-02
O
ct-0
2
Nov
-02
D
ec-0
2
Jan-
03
Feb-
03
Mar
-03
Ap
r-03
M
ay-0
3
Jun-
03
Jul-0
3
Aug-
03
Sep-
03
Oct
-03
Bro
mid
e (m
g/L)
0.0
0.1
0.2
0.3
0.4
0.5
0.6
VAMPVAMP

MWQI Summary and Findings from Data Collected Oct 2001 through Sep 2003 5-9 Chapter 5 Bromide
Figure 5-2 Bromide concentrations at two Old River stations
Oct
-01
N
ov-0
1
Dec
-01
Ja
n-02
Fe
b-02
M
ar-0
2
Apr-0
2
May
-02
Ju
n-02
Ju
l-02
Au
g-02
Se
p-02
O
ct-0
2
Nov
-02
D
ec-0
2
Jan-
03
Feb-
03
Mar
-03
Ap
r-03
M
ay-0
3
Jun-
03
Jul-0
3
Aug-
03
Sep-
03
Bro
mid
e (m
g/L)
0.0
0.2
0.4
0.6Bacon Island Station 9

MWQI Summary and Findings from Data Collected Oct 2001 through Sep 2003 5-10 Chapter 5 Bromide
Figure 5-3 Bromide concentrations at three diversion stations
Oct
-01
N
ov-0
1
Dec
-01
Ja
n-02
Fe
b-02
M
ar-0
2
Apr-0
2
May
-02
Ju
n-02
Ju
l-02
Au
g-02
Se
p-02
O
ct-0
2
Nov
-02
D
ec-0
2
Jan-
03
Feb-
03
Mar
-03
Ap
r-03
M
ay-0
3
Jun-
03
Jul-0
3
Aug-
03
Sep-
03
Oct
-03
Bro
mid
e (m
g/L)
0.00
0.20
0.40
0.60
0.80Banks Pumping Plant Contra Costa Pumping Plant
Delta-Mendota Canal

MWQI Summary and Findings from Data Collected Oct 2001 through Sep 2003 5-11 Chapter 5 Bromide
Figure 5-4 Bromide concentrations at the Mallard Island station
Oct
-01
N
ov-0
1
Dec
-01
Ja
n-02
Fe
b-02
M
ar-0
2
Apr-0
2
May
-02
Ju
n-02
Ju
l-02
Au
g-02
Se
p-02
O
ct-0
2
Nov
-02
D
ec-0
2
Jan-
03
Feb-
03
Mar
-03
Ap
r-03
M
ay-0
3
Jun-
03
Jul-0
3
Aug-
03
Sep-
03
Oct
-03
Bro
mid
e (m
g/L)
0.00
3.00
6.00
9.00
12.00
15.00
18.00
Wetter runoff yearDrier runoff year

MWQI Summary and Findings from Data Collected Oct 2001 through Sep 2003 5-12 Chapter 5 Bromide
Figure 5-5 Bromide concentrations at the Natomas East Main Drainage Canal
Oct
-01
N
ov-0
1
Dec
-01
Ja
n-02
Fe
b-02
M
ar-0
2
Apr-0
2
May
-02
Ju
n-02
Ju
l-02
Au
g-02
Se
p-02
O
ct-0
2
Nov
-02
D
ec-0
2
Jan-
03
Feb-
03
Mar
-03
Ap
r-03
M
ay-0
3
Jun-
03
Jul-0
3
Aug-
03
Sep-
03
Oct
-03
Bro
mid
e (m
g/L)
0.00
0.02
0.04
0.06
0.08
0.10
0.12

MWQI Summary and Findings from Data Collected Oct 2001 through Sep 2003 5-13 Chapter 5 Bromide
Figure 5-6 The relationship between bromide and chloride at six stations
Chloride (mg/L)
0 50 100 150 200 250
Brom
ide
(mg/
L)
0.00
0.20
0.40
0.60
0.80Bromide = -0.0096 + 0.0032 ChlorideN= 130, r2 = 0.9880

MWQI Summary and Findings from Data Collected Oct 2001 through Sep 2003 5-14 Chapter 5 Bromide
Table 5-1 Summary of bromide at 11 MWQI stations Positive detects/ -------------------units in mg/L----------------- Station Sample number Range Average Median American and Sacramento River stations American River at E.A. Fairbairn WTP 0/59 <0.01 West Sacramento WTP Intake 39/61 0.01–0.03 0.02 0.02 Sacramento River at Hood 74/101 0.01–0.05 0.02 0.01 San Joaquin River stations San Joaquin River near Vernalis 103/103 0.12–0.60 0.31 0.30 Delta channel stations Old River at Station 9 63/63 0.04–0.49 0.18 0.10 Old River at Bacon Island 62/62 0.03–0.60 0.19 0.09 Diversion stations Banks Pumping Plant 24/24 0.04–0.47 0.19 0.15 Delta-Mendota Canal (DMC) 24/24 0.04–0.52 0.23 0.18 Contra Costa Pumping Plant 21/21 0.08–0.73 0.31 0.22 Other stations Mallard Island 23/23 0.03–17.90 4.06 2.00 Natomas East Main Drainage Canal (NEMDC) 49/49 0.01–0.12 0.05 0.05 Note: All statistics are calculated for positively detected samples; positive detects are samples with concentrations equal to or greater than the reporting limit of 0.01 mg/L.

MWQI Summary and Findings from Data Collected Oct 2001 through Sep 2003 5-15 Chapter 5 Bromide
Table 5-2 Bromide at diversion stations: current vs. previous summary period Station Summary perioda Range Average Median Banks Pumping Plant 10/01–9/03 0.04–0.47 0.19 0.15 8/98–9/01 0.05–0.52 0.17 0.14 Delta-Mendota Canal (DMC) 10/01–9/03 0.04–0.52 0.23 0.18 8/98–9/01 0.05–0.47 0.18 0.15 Contra Costa Pumping Plant 10/01–9/03 0.08–0.73 0.31 0.22 8/98–9/01 0.03–0.77 0.22 0.11
a. Current summary period (Oct 2001-Sep 2003); previous summary period, Aug 1, 1998, to Sep 30, 2001 (see DWR 2003).

MWQI Summary and Findings from Data Collected Oct 2001 through Sep 2003 6-i Chapter 6 Salinity
Chapter 6 Salinity
Contents Chapter 6 Salinity .................................................................................................... 6-1
General Relationships between EC and TDS in Delta Waters ............................ 6-1 Ranges and Seasonality ....................................................................................... 6-1
American River at the Fairbairn WTP Intake .................................................. 6-2 Sacramento River Stations............................................................................... 6-2 San Joaquin River near Vernalis...................................................................... 6-3 Channel Stations .............................................................................................. 6-4 Diversion Stations............................................................................................ 6-5 Other stations................................................................................................... 6-6
Mallard Island.............................................................................................. 6-6 Natomas East Main Drainage Canal ............................................................ 6-6
Chloride and Sulfate ............................................................................................ 6-7
Figures Figure 6-1 The relationship between EC and TDS at all 11 stations ...................... 6-9 Figure 6-2 Electrical conductivity at the American River WTP Intake.................6-10 Figure 6-3 Electrical conductivity at the West Sacramento WTP Intake ..............6-11 Figure 6-4 Electrical conductivity at the Hood station ..........................................6-12 Figure 6-5 Electrical conductivity at San Joaquin River near Vernalis .................6-13 Figure 6-6 Electrical conductivity at Station 9 and Bacon Island on Old River ....6-14 Figure 6-7 Electrical conductivity at three Delta diversion stations ......................6-15 Figure 6-8 Electrical conductivity at the Mallard Island station............................6-16 Figure 6-9 Electrical conductivity at the NEMDC station.....................................6-17
Tables Table 6-1 Summary of EC and TDS data, Oct 2001 through Sep 2003 ................6-18 Table 6-2 Summary of chloride and sulfate data, Oct 2001 through Sep 2003 .....6-19
Chapter 6 figures and tables

MWQI Summary and Findings from Data Collected Oct 2001 through Sep 2003 6-1 Chapter 6 Salinity
Chapter 6 Salinity Waters with highly elevated salinity and electrical conductivity (EC) are not suitable for drinking purposes. Salinity was originally conceived as a measure of the mass of dissolved salts in a given mass of solution (Eaton and others 1995). However, measuring every constituent in the water is time-consuming and cannot yield the precision necessary for accurate, routine assessment of water quality (Eaton and others 1995). The total quantity of dissolved salts, referred to as total dissolved solids (TDS), is estimated by increase in weight of a filtrate evaporated to dryness in a previously weighted dish and dried to constant weight at 180 oC after filtering through a standard glass fiber filter (Eaton and others 1995). The TDS results may not agree with the theoretical value for solids calculated from chemical analysis of sample. Therefore, an alternative and indirect method of observing salinity is often used, which is the measurement of the electrical conductivity of the water.
General Relationships between EC and TDS in Delta Waters
In the previous summary report by the Municipal Water Quality Investigations Program, 694 samples were collected from 14 MWQI stations from August 1998 to September 2001 (DWR 2003a). The 14 stations included 2 Delta island drainage stations. The report found that the relationship between EC and TDS in Delta waters was linear, and that TDS in milligrams per liter (mg/L) can be estimated numerically as 58% of the value of EC in µS/cm (DWR 2003a). During this reporting period (September 2001 through October 2003), a total of 285 samples were collected from 11 MWQI stations and analyzed. The relationship between EC and TDS was also linear (Figure 6-1) and can be described by the following equation:
TDS = 0.60*EC – 3, (r2 = 0.9982, p< 0.0001). The equation suggests that TDS in mg/L can be estimated numerically as 60% of the value of EC in microsiemens per centimeter (µS/cm).
Ranges and Seasonality The range, average, and median EC and TDS for each station are presented in Table 6-1. Despite similar spatial patterns of EC and TDS among the 11 stations (Table 6-1), median EC and TDS at San Joaquin River (SJR) near Vernalis and Contra Costa Pumping Plant #1 were much higher during the the reporting period (Table 6-1) than during the previous summary period (DWR 2003a). The cause of such increases will be discussed in more detail. As noted above, the relationship between EC and TDS is linear and numerically predictable from each other (Figure 6-1). The following sections discuss EC alone at each individual station.
Figure 6-1 The relationship between EC and TDS at all 11 stations
Table 6-1 Summary of EC and TDS data, Oct 2001 through Sep 2003
EC (µS/cm)
0 200 400 600 800 1000 1200 1400 16000
200
400
600
800
1000
TDS = 0.60 * EC -2.86N = 285, r2 = 0.9982, p < 0.0001

MWQI Summary and Findings from Data Collected Oct 2001 through Sep 2003 6-2 Chapter 6 Salinity
American River at the Fairbairn WTP Intake Among all MWQI stations, E.A. Fairbairn Water Treatment Plant (WTP) intake on the American River has the lowest EC and TDS. During this reporting period, EC ranged from 51 to 92 µS/cm with an average of 69 µS/cm and a median of 66 µS/cm. TDS varied from 32 to 57 mg/L. Both the average and median TDS were 41 mg/L (Table 6-1), which were the lowest among all 11 stations. These EC and TDS concentrations were only slightly higher than those observed during the previous summary period (DWR 2003a). The 2002 Water Year was a drier runoff year than 2003 WY in the Sacramento Valley (see Table 3-3). Runoff and releases from Folsom Lake were less during 2002 WY than during 2003 WY (see Figure 3-3). As a result, EC was higher in 2002 WY than in 2003 WY (Figure 6-2) Median EC was 77 µS/cm during 2002 WY and 62 µS/cm in 2003 WY; the difference in median EC was statistically significant (Mann-Whitney test p<0.00001). Sacramento River Stations The ranges for EC were 117 to 245 µS/cm at the West Sacramento WTP Intake and 114 to 239 µS/cm at Hood. The median EC was 167 and 160 µS/cm for West Sacramento WTP Intake and Hood, respectively (Table 6-1). TDS at these stations ranged from 80 to 138 mg/L and from 72 to 138 mg/L, respectively; median TDS was 104 mg/L for West Sacramento WTP Intake and 102 mg/L for Hood (Table 6-1). Median EC and TDS were not statistically different from those found during the 1998–2001 summary period (DWR 2003a). EC at these 2 stations was dependent on the amount of runoff in the contributing watershed. EC was higher during the drier runoff year and lower during the wetter runoff year (Figures 6-3 and 6-4). At West Sacramento WTP Intake, median EC was 175 µS/cm during the relatively drier 2002 WY, and 154 µS/cm during the wetter 2003 WY. The difference was statistically significant with a p value of 0.0022. At Hood, median EC was 165 µS/cm during 2002 WY, and 152 µS/cm during 2003 WY. The difference was also significant with a p value of 0.0017. Values of EC were elevated and variable in response to rainfall events during the wet months (Figures 6-3 and 6-4). EC fluctuated during the dry months in response to urban and agricultural drainages. For example, EC at both stations increased during August and September of each water year (Figures 6-3 and 6-4), probably due to rice drainage from the Sacramento Valley. Despite differences in sampling frequency, seasonal patterns of EC at Hood were similar to those at the West Sacramento WTP Intake (Figures 6-3 and 6-4). Although low mineral water from the American River enters the Sacramento River between the West Sacramento WTP Intake and Hood, inflows were generally small compared to the inflows from the upper Sacramento River. Two wastewater treatment plants also discharge to the Sacramento River between the West Sacramento WTP Intake and Hood (see
Figure 6-4 EC at the Hood station
Figure 6-3 EC at the West Sacramento WTP Intake
Figure 6-2 EC at the American River WTP Intake
Oct-0
Dec-
Feb-
Apr-0
Jun-0
Aug-
Oct-0
Dec-
Feb-
Apr-0
Jun-0
Aug-
EC(
S/
)
0
20
40
60
80
100
Median EC = 77 µS/cm
Median EC = 62 µS/cm
Oct-0
Nov-
Dec-
Jan-0Feb-0M
ar-0Apr-0M
ay-Jun-0
Ju l-02Aug-Sep-O
ct-0N
ov-D
ec-Jan-0Feb-0M
ar-0Apr-0M
ay-Jun-0
Jul-03Aug-S
ep-
EC(
S/)
0
50
100
150
200
250
Oct-01
Nov-01
Dec-01
Jan-02 Feb-02 M
ar-02 Apr-02 M
ay-02 Jun-02
Jul-02 Aug-02 Sep-02 O
ct-02 N
ov-02 D
ec-02 Jan-03 Feb-03 M
ar-03 Apr-03 M
ay-03 Jun-03
Jul-03 Aug-03 Sep-03
EC
(/
)
50
100
150
200
250
Rice drainage Rice drainage

MWQI Summary and Findings from Data Collected Oct 2001 through Sep 2003 6-3 Chapter 6 Salinity
Figure 4-1). Wastewater discharges may counter the effect of dilution from the American River water inflows. San Joaquin River near Vernalis Both EC and TDS of the SJR near Vernalis were among the highest of all 11 stations monitored during the reporting period and were only exceeded by those found at the Mallard Island station (Table 6-1), which is influenced by seawater. Salinity of water in the SJR is the highest of monitored rivers, channels, diversion points, and an urban drainage canal. At the SJR near Vernalis, EC ranged from 352 to 1,180 µS/cm (Table 6-1). Median EC was 715 µS/cm (Table 6-1). Median EC in water years from 1998 through 2001 was 549 µS/cm (DWR 2003a); according to the Mann-Whitney test, median EC during the reporting period was significantly higher (p<0.0001). Higher EC and salinity at this station was attributable to reduced inflows to the SJR. The previous summary period (1998–2001) was preceded by 2 wet runoff years, and started with 2 above normal runoff years (1999 and 2000), followed by a dry runoff year (2001). In contrast, this reporting period was preceded by a dry runoff year (2001) and began with a dry runoff year (2002), which was followed by a below normal runoff year (2003). Consequently, inflows to the SJR above Vernalis were higher during the previous summary period than during this reporting period (data not shown). The median EC was higher during this reporting period than during the previous summary period. EC was generally higher during the wet months than during the dry months of each water year; the highest EC values occurred during the wet months of the 2 water years (Figure 6-5). Median EC was 857 µS/cm during the wet months of 2002 WY, which was a dry runoff year in the San Joaquin Valley. Median EC was 935 µS/cm during the wet months of 2003 WY, which was a below normal runoff year. Although median EC was about 9% higher during the wet months of the wetter 2003 WY than during 2002 WY, these median EC levels were not significantly different (p=0.1871) according to the Mann-Whitney test. In contrast, EC during the dry months of the 2 water years demonstrated a stronger response (16%) to the differences in watershed runoff (Figure 6-5). Median EC during the dry months of 2002 WY and 2003 WY were 710 and 611 µS/cm, respectively. The difference in median EC were statistically significant (p=0.0023). The lowest EC values were found from April through June of the 2 water years (Figure 6-5). This lowering in EC was attributable to the implementation of the Vernalis Adaptive Management Plan, which is mandated by State Water Resources Control Board Decision 1641 (SWRCB 2000). VAMP requires an increase in inflows to the SJR from the Stanislaus River, Merced River, and Tuolumne River from the east side, which increases the percentages of low EC water from the Sierra Nevada. During high inflows from the eastern tributaries with increased reservoir releases, the SJR near Vernalis shows lower EC. This happens during the months of April and May when VAMP’s measures are carried out (Figure 6-5). Because of VAMP, a pulse of fresh water is maintained for a minimum of 31 days from
Figure 6-5 EC at San Joaquin River near Vernalis
Oct-
Nov
Dec
Jan-FebM
arApr-M
ayJun-
Jul-0AugSepO
ct-N
ovD
ecJan-FebM
arApr-M
ayJun-
Jul-0AugSep
EC(
S/)
0
200
400
600
800
1000
VAMP VAMP

MWQI Summary and Findings from Data Collected Oct 2001 through Sep 2003 6-4 Chapter 6 Salinity
the rivers that bring in water from the Sierra (DWR 2003a). This was performed from mid-April to mid-May in both 2002 and 2003. A corresponding drop in EC and all charged ions were seen in May of those 2 years (Figure 6-5). Salinity of the water in the SJR is the result of a combination of factors: (1) limited low EC water inflows into the SJR, (2) irrigation with Delta-Mendota Canal (DMC) water, which is recirculated water with considerable salinity both from the bay and from island drainages, and (3) geological sources of salinity such as soils and groundwater. Because of these contributing factors, EC at the Vernalis station varied at an elevated level even during the dry months (Figure 6-5), which were higher than median EC at most stations except for the Mallard Island station (Figure 6-5 and Table 6-1). The elevated EC during the dry months coincided with the increased agricultural activity and drainage returns from the San Joaquin Valley. Channel Stations MWQI sampled 2 channel stations along Old River. One station was at Bacon Island and the other at Station 9 near Highway 4. They are approximately 9 miles apart. Due to their proximity, salinity levels and seasonality were similar (Figure 6-6). Although EC and TDS ranges differed slightly and median EC at Station 9 was about 14% higher than that at Bacon Island, these median EC levels were not statistically different according to the Mann-Whitney test (p=0.2161). Average EC and TDS levels at the 2 stations were nearly the same (Table 6-1). At both stations, EC and TDS levels were much lower than those at the SJR near Vernalis. However, they were nearly twice as high as the levels at the upper Sacramento River stations (Table 6-1), suggesting that channel waters came from multiple sources. The majority of the water in Old River is a mixture from the 2 major river systems flowing into the Delta. However, seasonality and variability patterns of EC at the 2 channel stations (Figure 6-6) differed from those at the SJR near Vernalis and at the stations on the Sacramento River (Figures 6-3 and 6-4). Seasonality is directly related to Delta outflow, which is related to runoff year type in the contributing watersheds. The relative contribution from either the Sacramento River or the SJR varies with hydrologic conditions in the rivers and pumping regimes at the diversion stations along Old River. In addition, a small fraction of the water is Delta drainage from various Delta islands. When Delta outflows are low, tides can bring in water from the bay. The biological processes in nutrient-rich channel waters also affect water quality. Consequently, seasonal patterns of EC and TDS at Old River stations resembled, but were not the same as, those of the SJR and Sacramento River. Similar to the stations along both the SJR and Sacramento River, EC at the 2 channel stations were generally higher early in the wet months than during the dry months (Figure 6-6). During the reporting period, EC levels
Figure 6-6 EC at Station 9 and Bacon Island on Old River
Oct-01
Nov-0
Dec-0
Jan-02Feb-0M
ar-0A
pr-02M
ay-0Jun-02
Jul-02 Aug-0Sep-0O
ct-02N
ov-0D
ec-0Jan-03Feb-0M
ar-0A
pr-03M
ay-0Jun-03
Jul-03 Aug-0Sep-0
EC(
S/)
0
200
400
600
800
1000
Bacon IslandStation 9

MWQI Summary and Findings from Data Collected Oct 2001 through Sep 2003 6-5 Chapter 6 Salinity
increased during November to January of both water years (Figure 6-6), probably in response to watershed flush by the first few rainfall events. As precipitation in the watershed continued from January to April, EC levels decreased (Figure 6-6). This was probably attributable to increased Delta outflow during the wet months, which prevented seawater from coming into the Delta, and, to a less extent, to the dilutional effect of relatively low salinity water from the Sacramento River Valley. As mentioned above, seasonality of the channel stations was directly related to Delta outflows, which is related to runoff year type. During the 2-year reporting period, 2002 WY was a dry runoff year at both contributing watersheds (see Table 3-3); therefore, Delta outflows were the lowest between July 2002 and November 2002 (see Figure 3-5). In response, EC at the 2 channels stations increased to near peak levels of the 2 water years between July 2002 and November 2002 (Figure 6-6). In contrast, 2003 WY was a wetter runoff year. Delta outflows were greater (see Figure 3-5); therefore, an increase in EC during the dry months was not observed (Figure 6-6). Diversion Stations Median EC and TDS were 616 µS/cm and 361 mg/L, respectively, at Contra Costa Pumping Plant #1, which were the highest among the 3 diversion stations (Table 6-1). The Banks Pumping Plant station had the lowest EC and TDS among the diversion stations. Both EC and TDS were higher at the diversion stations than at the 2 Old River stations (Table 6-1). Median EC and TDS at both Banks and DMC were comparable to those found during the previous summary period, 1998–2001 (DWR 2003a). However, median EC at the Contra Costa Pumping Plant #1 during this reporting period was about 68% higher than that of the previous period. The increase in EC is directly related to Delta outflows, which were less in this reporting period than during the previous summary period. See Table 3-3 for runoff year types in the 2 major contributing watersheds during both summary periods. Of the 3 diversion stations, Contra Costa Pumping Plant #1 is closer to the Suisun Bay, where seawater intrusion to the Delta occurs, making the water at the Contra Costa Pumping Plant #1 more susceptible to seawater intrusion than the waters at Banks Pumping Plant and the DMC. Consequently, median EC levels were lower at Banks and at the DMC than at Contra Costa Pumping Plant #1 (Table 6-1). Seasonal patterns of EC (Figure 6-7) at the diversion stations were similar to those at the Old River stations (Figure 6-6), which depend on Delta outflows. EC values were generally higher during the early days of the wet months of each water year. As Delta outflows increased with precipitation in the contributing watersheds, EC decreased during the wet months (Figure 6-7). During the dry months, EC could be as high as during the wet months if Delta outflows were reduced and seawater intrusion occurred. The increase in EC response to reduced Delta outflows was evident between July 2002 and November 2002 (Figure 6-7) when Delta outflows were the lowest (see Figure 3-5).
Figure 6-7 EC at three Delta diversion stations
Oct-0
Nov
Dec
Jan-FebM
arApr-0M
ayJun-
Jul-02AugSepO
ct-0N
ovD
ecJan-FebM
arApr-0M
ayJun-
Jul-0AugSep
EC
S/
0
300
600
900
1200Banks DMC Contra Costa PP#01

MWQI Summary and Findings from Data Collected Oct 2001 through Sep 2003 6-6 Chapter 6 Salinity
Other stations Mallard Island Of all 11 MWQI sampling stations, the Mallard Island station is the closest to Suisun Bay where tidal events and seawater intrusion can influence the western Delta. Water quality data collected at the Mallard Island station affect operations of the State Water Project and reservoir release controls for maintaining drinking water quality and ecological health purposes. During the 2 water years, a total of 24 monthly grab samples were taken. The general range of EC was from 188 to 15,900 µS/cm, while average and median EC were 4,502 and 2,615 µS/cm, respectively (Table 6-1). Average and median TDS were 2,670 and 1,503 mg/L, respectively (Table 6-1). These EC and TDS concentrations were the most elevated for the 11 stations (Table 6-1), and were not significantly different than those found during the previous summary period (DWR 2003a). As with the Delta channel and diversion stations, EC was higher at the beginning of the wet months during each water year, but EC decreased as precipitation in the contributing watersheds continued (Figure 6-8). Between the 2 water years, 2003 WY was a relatively wetter runoff year than 2002 WY (see Table 3-3). Consequently, there were more Delta outflows in 2003 WY (see Figure 3-5). In response, EC levels between January and September were much lower in the 2003 WY than in 2002 WY (Figure 6-8). Natomas East Main Drainage Canal The Delta receives inflows from urban drainages from the watersheds that contribute runoff to the Delta. Loads of salts and other water quality constituents have not been quantified. An MWQI special study is under way to investigate discharge and loads of various water quality constituents at the Natomas East Main Drainage Canal at El Camino, which collects urban runoff from a heavily populated and rapidly expanding watershed adjacent to the northern boundary of the legal Delta in northern Sacramento. Although NEMDC is outside the legal Delta, its mouth is less than 2 miles from the I Street Bridge, which is the upstream end of the legal Delta. NEMDC discharges to the Sacramento River. EC and TDS ranged from 128 to 562 µS/cm and from 85 to 334 mg/L, respectively (Table 6-1). Average and median EC and TDS at NEMDC were considerably higher than in the American River at the E.A. Fairbairn WTP and in the Sacramento River at the West Sacramento WTP Intake, both of which are close to NEMDC (Table 6-1). EC and TDS at NEMDC were comparable to those found at the channel stations and at the Banks Pumping Plant, which are influenced by Delta drainage, flow from the SJR, and seawater. There was no clear and persistent seasonal pattern of EC at NEMDC (Figure 6-9). However, EC and TDS may be significantly lower during or immediately after a sustained heavy rainfall and runoff such as those in
Figure 6-8 EC at the Mallard Island station
Figure 6-9 EC at the NEMDC station
Oct
Nov
Dec
JanFebM
aAprM
aJun
Jul-0AugSepO
ctN
ovD
ecJanFebM
aAprM
aJun
Jul-0AugSep
EC(
S/)
0
3000
6000
9000
12000
15000
18000
Oct-
Nov
Dec
JanFebM
arApr-M
ayJun
Jul-0AugSepO
ct-N
ovD
ecJanFebM
arApr-M
ayJun
Jul-0AugSep
EC(
S/)
0
100
200
300
400
500
600

MWQI Summary and Findings from Data Collected Oct 2001 through Sep 2003 6-7 Chapter 6 Salinity
December 2002 and January 2003 (Figure 6-9). Also, no clear differences were observed in EC between the dry months and wet months. Sample collection for the ongoing MWQI special study is more frequent, and sometimes event-based. More detailed discussion on seasonality and loads of water quality constituents at NEMDC may be found in a recent report (DWR 2003b).
Chloride and Sulfate Chloride and sulfate affect the taste and odor of finished drinking water. The maximum contaminant level (MCL) for chloride and for sulfate is the same: 250 mg/L. Drinking water providers report increased taste and odor complaints from customers when chlorides are greater than 100 mg/L (Holm 2003 pers comm). Although concentrations of chloride and sulfate in source waters of the Delta do not represent those of finished drinking waters, chloride and sulfate data are briefly summarized here for reference purposes. Chloride and sulfate levels were generally low in most stations except at the Mallard Island station (Table 6-2). Chloride at the Mallard Island station was high and frequently exceeded the MCL because of seawater influence. The chloride ranged from 13 to 5,510 mg/L with a median of 394 mg/L. Sulfate occasionally was also above the MCL at Mallard Island station. The range for sulfate was from 12 to 767 mg/L with a median of 60 mg/L (Table 6-2). Contra Costa Water District has an intake adjacent to Mallard Island but only uses the intake when chlorides are less than 65 mg/L (Holm and Denton 2003 pers comm). The Contra Costa Pumping Plant #1, which is adjacent to Mallard Island, is also affected by seawater influence. During the reporting period, both chloride and sulfate were low at this station: Average chloride and sulfate were 94 and 68 mg/L, respectively; median chloride and sulfate were 68 and 36 mg/L, respectively (Table 6-2), which were below the MCLs of chloride and sulfate. Agricultural drainage waters, which often contain higher levels of chloride and sulfate, affect the stations on the SJR and Old River, but it doesn’t appear that they raised the concentrations of chloride and sulfate above their MCLs. Agricultural return water is a relatively small fraction of the water in the SJR and Old River; therefore, chloride and sulfate in these river stations remained low despite the discharges from Delta drainage. Chloride and sulfate at the other 2 diversion stations never exceeded the MCL of 250 mg/L. Both concentrations of chloride and sulfate at the urban drainage NEMDC were low (Table 6-2). Sulfate concentrations were higher at NEMDC than at the American River at E.A. Fairbairn WTP, the Sacramento River at Hood, and the West Sacramento WTP Intake, but lower than at all other stations (Table 6-2).
Table 6-2 Summary of chloride and sulfate data, Oct 2001 through Sep 2003

MWQI Summary and Findings from Data Collected Oct 2001 through Sep 2003 6-8 Chapter 6 Salinity
Chapter 6 Salinity
Figures Figure 6-1 The relationship between EC and TDS at all 11 stations ........................................................................ 6-9 Figure 6-2 Electrical conductivity at the American River WTP Intake.................................................................. 6-10 Figure 6-3 Electrical conductivity at the West Sacramento WTP Intake ............................................................... 6-11 Figure 6-4 Electrical conductivity at the Hood station ........................................................................................... 6-12 Figure 6-5 Electrical conductivity at San Joaquin River near Vernalis .................................................................. 6-13 Figure 6-6 Electrical conductivity at Station 9 and Bacon Island on Old River ..................................................... 6-14 Figure 6-7 Electrical conductivity at three Delta diversion stations ....................................................................... 6-15 Figure 6-8 Electrical conductivity at the Mallard Island station............................................................................. 6-16 Figure 6-9 Electrical conductivity at the NEMDC station...................................................................................... 6-17
Tables
Table 6-1 Summary of EC and TDS data, Oct 2001 through Sep 2003 ................................................................. 6-18 Table 6-2 Summary of chloride and sulfate data, Oct 2001 through Sep 2003 ...................................................... 6-19

MWQI Summary and Findings from Data Collected Oct 2001 through Sep 2003 6-9 Chapter 6 Salinity
Figure 6-1 The relationship between EC and TDS at all 11 stations
EC (µS/cm)
0 200 400 600 800 1000 1200 1400 1600
TDS
(mg/
L)
0
200
400
600
800
1000

MWQI Summary and Findings from Data Collected Oct 2001 through Sep 2003 6-10 Chapter 6 Salinity
Figure 6-2 Electrical conductivity at the American River WTP Intake
Oct
-01
Dec
-01
Feb-
02
Apr-0
2
Jun-
02
Aug-
02
Oct
-02
Dec
-02
Feb-
03
Apr-0
3
Jun-
03
Aug-
03
EC (µ
S/cm
)
0
20
40
60
80
100
Median EC = 77 µS/cm
Median EC = 62 µS/cm

MWQI Summary and Findings from Data Collected Oct 2001 through Sep 2003 6-11 Chapter 6 Salinity
Figure 6-3 Electrical conductivity at the West Sacramento WTP Intake
Oct
-01
N
ov-0
1
Dec
-01
Ja
n-02
Fe
b-02
M
ar-0
2
Apr-0
2
May
-02
Ju
n-02
Ju
l-02
Au
g-02
Se
p-02
O
ct-0
2
Nov
-02
D
ec-0
2
Jan-
03
Feb-
03
Mar
-03
Ap
r-03
M
ay-0
3
Jun-
03
Jul-0
3
Aug-
03
Sep-
03
EC (µ
S/cm
)
0
50
100
150
200
250

MWQI Summary and Findings from Data Collected Oct 2001 through Sep 2003 6-12 Chapter 6 Salinity
Figure 6-4 Electrical conductivity at the Hood station
Oct
-01
N
ov-0
1
Dec
-01
Ja
n-02
Fe
b-02
M
ar-0
2
Apr-0
2
May
-02
Ju
n-02
Ju
l-02
Au
g-02
Se
p-02
O
ct-0
2
Nov
-02
D
ec-0
2
Jan-
03
Feb-
03
Mar
-03
Ap
r-03
M
ay-0
3
Jun-
03
Jul-0
3
Aug-
03
Sep-
03
EC (µ
/cm
)
50
100
150
200
250
Rice drainage Rice drainage

MWQI Summary and Findings from Data Collected Oct 2001 through Sep 2003 6-13 Chapter 6 Salinity
Figure 6-5 Electrical conductivity at San Joaquin River near Vernalis
Oct
-01
N
ov-0
1
Dec
-01
Ja
n-02
Fe
b-02
M
ar-0
2
Apr-0
2
May
-02
Ju
n-02
Ju
l-02
Au
g-02
Se
p-02
O
ct-0
2
Nov
-02
D
ec-0
2
Jan-
03
Feb-
03
Mar
-03
Ap
r-03
M
ay-0
3
Jun-
03
Jul-0
3
Aug-
03
Sep-
03
EC (µ
S/cm
)
0
200
400
600
800
1000
VAMP VAMP

MWQI Summary and Findings from Data Collected Oct 2001 through Sep 2003 6-14 Chapter 6 Salinity
Figure 6-6 Electrical conductivity at Station 9 and Bacon Island on Old River
Oct
-01
N
ov-0
1
Dec
-01
Ja
n-02
Fe
b-02
M
ar-0
2
Apr-0
2
May
-02
Ju
n-02
Ju
l-02
Au
g-02
Se
p-02
O
ct-0
2
Nov
-02
D
ec-0
2
Jan-
03
Feb-
03
Mar
-03
Ap
r-03
M
ay-0
3
Jun-
03
Jul-0
3
Aug-
03
Sep-
03
EC (µ
S/cm
)
0
200
400
600
800
1000
Bacon IslandStation 9

MWQI Summary and Findings from Data Collected Oct 2001 through Sep 2003 6-15 Chapter 6 Salinity
Figure 6-7 Electrical conductivity at three Delta diversion stations
Oct
-01
N
ov-0
1
Dec
-01
Ja
n-02
Fe
b-02
M
ar-0
2
Apr-0
2
May
-02
Ju
n-02
Ju
l-02
Au
g-02
Se
p-02
O
ct-0
2
Nov
-02
D
ec-0
2
Jan-
03
Feb-
03
Mar
-03
Ap
r-03
M
ay-0
3
Jun-
03
Jul-0
3
Aug-
03
Sep-
03
EC (µ
S/cm
)
0
300
600
900
1200Banks DMC Contra Costa PP#01

MWQI Summary and Findings from Data Collected Oct 2001 through Sep 2003 6-16 Chapter 6 Salinity
Figure 6-8 Electrical conductivity at the Mallard Island station
Oct
-01
N
ov-0
1
Dec
-01
Ja
n-02
Fe
b-02
M
ar-0
2
Apr-0
2
May
-02
Ju
n-02
Ju
l-02
Au
g-02
Se
p-02
O
ct-0
2
Nov
-02
D
ec-0
2
Jan-
03
Feb-
03
Mar
-03
Ap
r-03
M
ay-0
3
Jun-
03
Jul-0
3
Aug-
03
Sep-
03
EC (µ
S/cm
)
0
3000
6000
9000
12000
15000
18000

MWQI Summary and Findings from Data Collected Oct 2001 through Sep 2003 6-17 Chapter 6 Salinity
Figure 6-9 Electrical conductivity at the NEMDC station
Oct
-01
N
ov-0
1
Dec
-01
Ja
n-02
Fe
b-02
M
ar-0
2
Apr-0
2
May
-02
Ju
n-02
Ju
l-02
Au
g-02
Se
p-02
O
ct-0
2
Nov
-02
D
ec-0
2
Jan-
03
Feb-
03
Mar
-03
Ap
r-03
M
ay-0
3
Jun-
03
Jul-0
3
Aug-
03
Sep-
03
EC (µ
S/cm
)
0
100
200
300
400
500
600

MWQI Summary and Findings from Data Collected Oct 2001 through Sep 2003 6-18 Chapter 6 Salinity
Table 6-1 Summary of EC and TDS data, Oct 2001 through Sep 2003 EC (uS/cm) TDS (mg/L)
Station Number of samples Range Average Median
Number of samples Range Average Median
American and Sacramento River stations American River at E.A. Fairbairn WTP 59 51–92 69 66 22 32–57 41 41 West Sacramento WTP Intake 61 117–245 172 167 23 80–138 104 104 Sacramento River at Hood
101 114–239 163 160 27 72–138 100 102
San Joaquin River station San Joaquin River near Vernalis
103 352–1,180 748 715 27 208–654 445 414
Delta channel stations Old River at Station 9 62 182–738 388 324 24 110–411 240 203 Old River at Bacon Island
62 168–868 384 285 22 101–459 240 179
Diversion stations Banks Pumping Plant 24 173–666 407 387 24 104–409 239 212 Delta-Mendota Canal 24 184–1,140 511 479 24 111–686 303 282 Contra Costa Pumping Plant
21 262–1,120 616 616 21 158–676 363 361
Other Stations Sacramento River at Mallard Island 24 188–15,900 4,502 2,615 24 113–9,840 2,670 1,503 Natomas East Main Drainage Canal 70 128–562 313 302 47 85–334 220 234

MWQI Summary and Findings from Data Collected Oct 2001 through Sep 2003 6-19 Chapter 6 Salinity
Table 6-2 Summary of chloride and sulfate data, Oct 2001 through Sep 2003 Chloride (mg/L) Sulfate (mg/L)
Station Number of samples Range Average Median
Number of samples Range Average Median
American and Sacramento River stations American River at E.A. Fairbairn WTP 22 1–3 2 2 22 2–4 2 2 West Sacramento WTP Intake 23 2–10 5 5 23 5–11 7 7 Sacramento River at Hood
27 2–10 6 6 27 4–12 7 7
San Joaquin River station San Joaquin River near Vernalis
26 44–156 98 93 21 40–157 89 85
Delta channel stations Old River at Station 9 23 15–153 62 39 23 10–44 26 25 Old River at Bacon Island
20 12–175 52 32 24 8–40 22 23
Diversion stations Banks Pumping Plant 20 13–134 52 43 22 10–52 29 30 Delta-Mendota Canal 22 15–178 70 57 22 13–167 47 34 Contra Costa Pumping Plant
19 26–239 94 68 18 15–163 51 36
Other stations Sacramento River at Mallard Island 20 13–5,510 1,264 394 16 12–767 151 60 Natomas East Main Drainage Canal 47 7–64 32 35 47 8–37 21 21

MWQI Summary and Findings from Data Collected Oct 2001 through Sep 2003 7-i Chapter 7 Nutrients
Chapter 7 Nutrients
Contents Chapter 7 Nutrients.................................................................................................. 7-1
Stations on American and Sacramento Rivers..................................................... 7-1 San Joaquin River near Vernalis.......................................................................... 7-2 Channel and Diversion Stations........................................................................... 7-2 Mallard Island...................................................................................................... 7-3 Natomas East Main Drainage Canal.................................................................... 7-3
Figures
Figure 7-1 Nutrient concentrations at the Hood station.......................................... 7-6 Figure 7-2 Nutrient concentrations at the San Joaquin River near Vernalis ........... 7-7 Figure 7-3 Nutrient concentrations at Old River at Station 9 ................................. 7-8 Figure 7-4 Nutrient concentrations at Old River at Bacon Island station ............... 7-9 Figure 7-5 Nutrient concentrations at Banks .........................................................7-10 Figure 7-6 Nutrient concentrations at Contra Costa Pumping Plant #1.................7-11
Tables Table 7-1 Summary of ammonia data at 10 MWQI stations .................................7-12 Table 7-2 Summary of nitrate data at 11 MWQI stations......................................7-13 Table 7-3 Summary of combined nitrite and nitrate data at 10 MWQI stations ....7-14 Table 7-4 Summary of Kjeldahl nitrogen data at 10 MWQI stations ....................7-15 Table 7-5 Summary of orthophosphate data at 10 MWQI stations .......................7-16 Table 7-6 Summary of total phosphorus data at 10 MWQI stations......................7-17
Chapter 7 figures and tables

MWQI Summary and Findings from Data Collected Oct 2001 through Sep 2003 7-1 Chapter 7 Nutrients
Chapter 7 Nutrients For discussion purposes in this report, nutrients refer to various forms of nitrogen and phosphorus in the water. Among many compounds of nutrients, nitrate and nitrite are mandatory health-related constituents with established drinking water standards that require monitoring. The primary maximum contaminant levels (MCLs) for nitrate and combined nitrate and nitrite are 45 mg nitrate/L or 10 mg N/L (DWR 2001). To date no federal or State drinking water standards have been developed for phosphorus. However, high levels of nitrogen and phosphorus act collectively to promote growth of algae and, subsequently, degrade water quality by increasing organic carbon, turbidity, and by forming taste and odor-producing compounds. Excessive growth of algae can also clog filters in water treatment plants (WTPs). The US Environmental Protection Agency (EPA) released information supporting the development of State and tribal nutrient criteria in California rivers, streams, and reservoirs (EPA 2000). The final guidelines have not yet been developed for implementation. Because of the adverse effect of nutrient-rich source waters on finished drinking water, the Municipal Water Quality Investigations Program (MWQI) resumed exploratory nutrient monitoring at most stations in November 2002. Monitoring frequency was monthly. Monitored nutrients include dissolved nitrate, combined nitrate and nitrite, ammonia, total Kjeldahl nitrogen (TKN), total phosphorus, and orthophosphates. This chapter summarizes data collected during the reporting period.
Stations on American and Sacramento Rivers Among all stations, except for ammonia, the lowest median concentrations of nutrients were found at the 3 stations on American and Sacramento Rivers (Tables 7-1 to 7-6). Levels of nitrate and combined nitrate and nitrite never approached the primary MCL of 45 mg/L despite some seasonal variations. The highest median ammonia level was observed at Sacramento River at Hood (Table 7-1); average and median ammonia concentrations at the Hood station were 0.23 and 0.17 mg N/L. High ammonia concentrations at Hood apparently did not come from upper river inflows because the lowest median ammonia levels were found at both the American River and at West Sacramento WTP Intake (Table 7-1). Ammonia at Hood probably came from wastewater discharges and possibly urban runoff. Upstream from the Hood station, 2 wastewater treatment plants—the Sacramento Regional Wastewater Treatment Plant and West Sacramento Wastewater Treatment Plant—and the Morrison Creek outfall pump discharge water into the Sacramento River between the West Sacramento WTP Intake and the Hood station. Morrison Creek discharges urban drainage water into the Sacramento River. An active marina also is upstream of the Hood station; therefore, elevated concentrations of ammonia detected at the Hood station could be due to the inflows of wastewater and urban drainage into this section of the Sacramento River.
Table 7-1 Summary of ammonia data at 10 MWQI stations

MWQI Summary and Findings from Data Collected Oct 2001 through Sep 2003 7-2 Chapter 7 Nutrients
Apparent seasonality was observed with nutrients at the Hood station. For all nutrients, concentrations were higher during the wet months than during the dry months (Figure 7-1). From May to August of each water year, concentrations of nitrate, TKN, and total phosphorus decreased with time or remained constantly low (Figure 7-1). This decrease in nutrient concentrations coincided with atmospheric temperature increases during the summer months and aquatic vegetation growth in the Sacramento River. TKN and total phosphorus in 2002 WY appeared to increase from August to September (Figure 7-1), which probably was attributable to rice drainage from the Sacramento Valley.
San Joaquin River near Vernalis Among all stations, the highest median nitrate and combined nitrate and nitrite concentrations were found at the San Joaquin River near Vernalis (Tables 7-2 and 7-3). Nitrogen fertilizers were applied on agricultural lands along the SJR and its tributaries. Nitrogen mostly in the form of nitrates or bound with organic carbon is mobile in organic rich soils and enters the SJR mostly through surface runoff and seepage. Because a considerable portion of nitrogen is bound with organic carbon, TKN at the SJR near Vernalis was the highest among all river, channel, and diversion stations; however, TKN at Natomas East Main Drainage Canal was higher than at Vernalis (Table 7-4). Like TKN, orthophosphates and total phosphorus concentrations at this station were among the highest, and were only lower than those found at NEMDC (Tables 7-5 and 7-6). However, ammonia at the SJR near Vernalis was among the lowest (Table 7-1). The seasonality pattern of nutrients, nitrate in particular, at the SJR near Vernalis was different from that at the Hood station. In addition to occasional spikes in concentration, nitrate concentrations remained high during both water years except during May to June when nitrate levels dropped to their lowest due to Vernalis Adaptive Management Plan (VAMP) measures in April and May (Figure 7-2). An apparent decrease in nutrients due to aquatic activity during the dry months was observed for nitrate; nitrate concentrations were generally lower from May to August during each water year (Figure 7-2). However, changes in concentrations of TKN and phosphorus appeared to follow drainage discharge pattern of the San Joaquin Valley. TKN and phosphorus increased during the growing season in the San Joaquin Valley, generally from April to September (Figure 7-2) when drainage was high. During and right after the VAMP period, however, TKN remained unchanged, and nitrate and phosphorus decreased, apparently because of the dilutional effects of water releases from reservoirs.
Channel and Diversion Stations The water at channel and diversion stations came from multiple sources. Consequently, except for ammonia, the ranges and median concentrations of nutrients at both channel and diversion stations were between those at the American and Sacramento River stations and the San Joaquin River station (Tables 7-1 to 7-6). Median concentrations of nitrate and combined nitrate and nitrite at the diversion stations were generally higher than those from the two channel stations (Tables 7-2 and 7-3). The Delta-Mendota Canal station had the highest nitrate concentration (Table 7-2) because the DMC draws
Figure 7-1 Nutrient concentrations at the Hood station
Table 7-2 Summary of nitrate data at 11 MWQI stations
Table 7-3 Summary of combined nitrite and nitrate data at 10 MWQI stations
Table 7-4 Summary of Kjeldahl nitrogen data at 10 MWQI stations
Table 7-5 Summary of orthophosphate data at 10 MWQI stations
Table 7-6 Summary of total phosphorus data at 10 MWQI stations
Figure 7-2 Nutrient concentrations at the San Joaquin River near Vernalis
Oct-01
Nov-01
Dec-01
Jan-02 Feb-02 M
ar-02 Apr-02 M
ay-02 Jun-02
Jul-02 Aug-02 Sep-02 O
ct-02 N
ov-02 D
ec-02 Jan-03 Feb-03 M
ar-03 Apr-03 M
ay-03 Jun-03
Jul-03 Aug-03 Sep-03 O
ct-03
Nitrate
mg/L 2.0
4.0
6.0
8.0
10.0
12.0
14.0
Sep-02 O
ct-02 N
ov-02 D
ec-02 Jan-03 Feb-03 M
ar-03 Apr-03 M
ay-03 Jun-03
Jul-03 Aug-03 Sep-03 O
ct-03
TKN
, mg N
/L 0.2
0.3
0.4
0.5
0.6
0.7
0.8
0.9
0.00
0.05
0.10
0.15
0.20
0.25
0.30
0.35
Nitrate
Total Kjeldahl nitrogen
Orthophosphates
Total P
VAMP VAMP
VAMP
VAMP
Oct-01
Nov-01
Dec-01
Jan-02 Feb-02 M
ar-02 Apr-02 M
ay-02 Jun-02
Jul-02 Aug-02 Sep-02 O
ct-02 N
ov-02 D
ec-02 Jan-03 Feb-03 M
ar-03 Apr-03 M
ay-03 Jun-03
Jul-03 Aug-03 Sep-03 O
ct-03
0.0
0.5
1.0
1.5
2.0
2.5
Aug-02 Sep-02 O
ct-02 N
ov-02 D
ec-02 Jan-03 Feb-03 M
ar-03 Apr-03 M
ay-03 Jun-03
Jul-03 Aug-03 Sep-03 O
ct-03
TKN
mg
N/L 0.2
0.3
0.4
0.5
0.6
0.7
0.8
Aug
Sep
Oct-
Nov
Dec
Jan
Feb
Mar
Apr-
Ma
Jun
Jul-0
Aug
Sep
Oct
/
0.02
0.04
0.06
0.08
0.10
0.12
0.14
Nitrate
Total Kjeldahl nitrogen
Orthophosphates
Total P

MWQI Summary and Findings from Data Collected Oct 2001 through Sep 2003 7-3 Chapter 7 Nutrients
more water from the SJR. However, concentrations never approached the primary MCLs of nitrate and combined nitrate and nitrite. Median TKN concentrations at the diversion stations were also higher than those at the 2 channel stations (Table 7-4). However, such a consistent pattern was not observed for phosphorus (Tables 7-5 and 7-6). Concentrations of ammonia at both the channel and diversion stations were among the lowest of all stations (Table 7-1). Despite the fact that water at channel and diversion stations came from multiple sources, seasonality of nutrients at the channel and diversion stations resembled that at the Sacramento River at Hood station (Figures 7-1 7-3, 7-4, 7-5, and 7-6). Concentrations of nutrients were generally higher from December to February in response to heavy rainfall events at the beginning of the wet months in the watersheds (Figures 7-3, 7-4, 7-5, and 7-6), which occurred before December. As precipitation increased, concentrations of nutrients gradually decreased and reached the lowest around April (Figures 7-3, 7-4, 7-5, and 7-6). Between June and September, concentrations of nitrogen and phosphorus decreased farther (Figures 7-3, 7-4, 7-5, and 7-6), presumably in response to nutrient demands of aquatic vegetation growth during the summer.
Mallard Island Except for ammonia, concentrations of nutrients at the Mallard Island station were comparable to those at the 2 channel stations (Tables 7-1 to 7-6). Concentrations of nitrate and combined nitrate and nitrite never approached the MCL of 45 mg/L. Low nutrient concentrations at the Mallard Island station may be attributable to several factors, including seawater influence, water diversion through pumping, and biological consumption of nutrients within the Delta. Mallard Island is the most susceptible to tidal and seawater influence from the bay. Low-nitrogen seawater causes a dilutional effect on nitrogen concentrations. The Banks Pumping Plant and DMC are in operation most of the time during each water year. The DMC diverts water from Old River, a bifurcation from the SJR. The SJR near Vernalis had the highest nitrogen levels among all stations measured. The DMC sometimes pumps water mostly from the SJR, possibly reducing the amount of nitrogen reaching the Mallard Island station. In addition, when water passes the biologically diverse and complex Delta, much of the nitrogen may be consumed before it reaches the Mallard Island station. Despite low nutrient concentrations at Mallard Island, median ammonia at this station was 0.08 mg/L as N (Table 7-1). The source of ammonia remains unknown and warrants further monitoring.
Natomas East Main Drainage Canal Median nitrate and combined nitrate and nitrite concentrations at NEMDC were nearly as high as the SJR near Vernalis (Tables 7-2 and 7-3). Elevated inorganic nitrogen may be attributable to nitrogen fertilizers used in some areas of the watershed. Concentrations of TKN and phosphorus at NEMDC were the highest among all monitored stations (Tables 7-4 to 7-6). NEMDC
Figure 7-3 Nutrient concentrations at Old River at Station 9
Figure 7-4 Nutrient concentrations at Old River at Bacon Island station
Figure 7-5 Nutrient concentrations at Banks
Oct-01
Nov-01
Dec-01
Jan-02 Feb-02 M
ar-02 Apr-02 M
ay-02 Jun-02
Jul-02 Aug-02 Sep-02 O
ct-02 N
ov-02 D
ec-02 Jan-03 Feb-03 M
ar-03 Apr-03 M
ay-03 Jun-03
Jul-03 Aug-03 Sep-03 O
ct-03
Nitrate, m
g/L 0.0
1.0
2.0
3.0
4.0
5.0
6.0
7.0
8.0
Nov-02
Dec-02
Jan-03
Feb-03 M
ar-03
Apr-03
May-03
Jun-03
Jul-03
Aug-03
Sep-03
Oct-03
TKN
, mg N
/L 0.15
0.20
0.25
0.30
0.35
0.40
0.45
0.50
0.55
No De
Ja Fe Ma
Ap M Ju
Jul-
Au Se
Oc
Phosphorus, mg/L
0.02
0.04
0.06
0.08
0.10
0.12
0.14
Nitrate
Total Kjeldahl nitrogen
Orthophosphates
Total P
Dry months Dry months
Dry months
Oct-01
Nov-01
Dec-01
Jan-02 Feb-02 M
ar-02 Apr-02 M
ay-02 Jun-02
Jul-02 Aug-02 Sep-02 O
ct-02 N
ov-02 D
ec-02 Jan-03 Feb-03 M
ar-03 Apr-03 M
ay-03 Jun-03
Jul-03 Aug-03 Sep-03 O
ct-03
Nitrate, m
g/L 0.0
1.0
2.0
3.0
4.0
5.0
Nov-02
Dec-02
Jan-03
Feb-03
Mar-03
Apr-03
May-03
Jun-03
Jul-03
Aug-03
Sep-03
Oct-03
TKNm
gN
/L 0.15
0.20
0.25
0.30
0.35
0.40
0.45
No
De
Ja Fe Ma
Ap Ma
Ju
Jul-
Au Se
Oc
0.02
0.04
0.06
0.08
0.10
0.12
Nitrate
Total Kjeldahl nitrogen
Orthophosphates Total P
Dry monthsDry months
Dry months
Dry months
Oct-01
Nov-01
Dec-01
Jan-02 Feb-02 M
ar-02 Apr-02 M
ay-02 Jun-02
Jul-02 Aug-02 Sep-02 O
ct-02 N
ov-02 D
ec-02 Jan-03 Feb-03 M
ar-03 Apr-03 M
ay-03 Jun-03
Jul-03 Aug-03 Sep-03 O
ct-03
Nitrate, m
g/L 0.0
1.0
2.0
3.0
4.0
5.0
6.0
7.0
Oct-01
Nov-01
Dec-01
Jan-02 Feb-02 M
ar-02 Apr-02 M
ay-02 Jun-02
Jul-02 Aug-02 Sep-02 O
ct-02 N
ov-02 D
ec-02 Jan-03 Feb-03 M
ar-03 Apr-03 M
ay-03 Jun-03
Jul-03 Aug-03 Sep-03 O
ct-03
TKN
, mg N
/L 0.1
0.2
0.3
0.4
0.5
0.6
0.7
Oct
No
De
JanFebM
aAprM
aJun
Jul-Au SeO
ctN
oD
eJanFebM
aAprM
aJun
Jul-Au SeO
ct
Phosphorus, mg/L
0.04
0.06
0.08
0.10
0.12
0.14
0.16
Nitrate
Total Kjeldahl nitrogen
Orthophosphates Total P
Dry monthsDry months
Dry monthsDry months
Dry months Dry months

MWQI Summary and Findings from Data Collected Oct 2001 through Sep 2003 7-4 Chapter 7 Nutrients
collects water from a heavily populated watershed, agricultural drainage pumps, and a wastewater treatment plant. Consequently, organic carbon concentrations in the water were also the highest of all stations (see Chapter 4). Because ammonia concentrations at NEMDC were low (Table 7-1), most nitrogen in the water at NEMDC may be bound with organic carbon; therefore, the highest TKN was found at this station (Table 7-4).
Figure 7-6 Nutrient concentrations at Contra Costa Pumping Plant #1
Oct-01
Nov-01
Dec-01
Jan-02 Feb-02 M
ar-02 Apr-02 M
ay-02 Jun-02
Jul-02 Aug-02 Sep-02 O
ct-02 N
ov-02 D
ec-02 Jan-03 Feb-03 M
ar-03 Apr-03 M
ay-03 Jun-03
Jul-03 Aug-03 Sep-03 O
ct-03
Nitrate
mg/L
0.0
2.0
4.0
6.0
8.0
10.0
12.0
Nov-02
Dec-02
Jan-03
Feb-03
Mar-03
Apr-03
May-03
Jun-03
Jul-03
Aug-03
Sep-03
Oct-03
TKN
, mg N
/L 0.2
0.3
0.4
0.5
0.6
0.7
0.8N
o
De
Jan
Feb
Ma
Apr
Ma
Jun
Jul-0
Aug
Se
Oct
0.00
0.02
0.04
0.06
0.08
0.10
0.12
0.14
Nitrate
Total Kjeldahl nitrogen
Orthophosphates Total P
Dry months Dry months
Dry months
Dry months

MWQI Summary and Findings from Data Collected Sep 2001 through Oct 2003 7-5 Chapter 7 Nutrients
Chapter 7 Nutrients
Figures Figure 7-1 Nutrient concentrations at the Hood station............................................................................................ 7-6 Figure 7-2 Nutrient concentrations at the San Joaquin River near Vernalis ............................................................. 7-7 Figure 7-3 Nutrient concentrations at Old River at Station 9 ................................................................................... 7-8 Figure 7-4 Nutrient concentrations at Old River at Bacon Island station ................................................................. 7-9 Figure 7-5 Nutrient concentrations at Banks .......................................................................................................... 7-10 Figure 7-6 Nutrient concentrations at Contra Costa Pumping Plant #1.................................................................. 7-11
Tables Table 7-1 Summary of ammonia data at 10 MWQI stations .................................................................................. 7-12 Table 7-2 Summary of nitrate data at 11 MWQI stations....................................................................................... 7-13 Table 7-3 Summary of combined nitrite and nitrate data at 10 MWQI stations ..................................................... 7-14 Table 7-4 Summary of Kjeldahl nitrogen data at 10 MWQI stations ..................................................................... 7-15 Table 7-5 Summary of orthophosphate data at 10 MWQI stations ........................................................................ 7-16 Table 7-6 Summary of total phosphorus data at 10 MWQI stations....................................................................... 7-17

MWQI Summary and Findings from Data Collected Sep 2001 through Oct 2003 7-6 Chapter 7 Nutrients
Figure 7-1 Nutrient concentrations at the Hood station
Oct
-01
N
ov-0
1
Dec
-01
Ja
n-02
Fe
b-02
M
ar-0
2
Apr-0
2
May
-02
Ju
n-02
Ju
l-02
Au
g-02
Se
p-02
O
ct-0
2
Nov
-02
D
ec-0
2
Jan-
03
Feb-
03
Mar
-03
Ap
r-03
M
ay-0
3
Jun-
03
Jul-0
3
Aug-
03
Sep-
03
Oct
-03
Nitr
ate
(mg/
L)
0.0
0.5
1.0
1.5
2.0
2.5
Aug-
02
Sep-
02
Oct
-02
N
ov-0
2
Dec
-02
Ja
n-03
Fe
b-03
M
ar-0
3
Apr-0
3
May
-03
Ju
n-03
Ju
l-03
Au
g-03
Se
p-03
O
ct-0
3
TKN
(mg
N/L
)
0.2
0.3
0.4
0.5
0.6
0.7
0.8
Aug-
02
Sep-
02
Oct
-02
N
ov-0
2
Dec
-02
Ja
n-03
Fe
b-03
M
ar-0
3
Apr-0
3
May
-03
Ju
n-03
Ju
l-03
Au
g-03
Se
p-03
O
ct-0
3
Phos
phor
us (m
g/L)
0.02
0.04
0.06
0.08
0.10
0.12
0.14
Nitrate
Total Kjeldahl nitrogen
Orthophosphates Total P

MWQI Summary and Findings from Data Collected Sep 2001 through Oct 2003 7-7 Chapter 7 Nutrients
Figure 7-2 Nutrient concentrations at the San Joaquin River near Vernalis
Oct
-01
N
ov-0
1
Dec
-01
Ja
n-02
Fe
b-02
M
ar-0
2
Apr-0
2
May
-02
Ju
n-02
Ju
l-02
Au
g-02
Se
p-02
O
ct-0
2
Nov
-02
D
ec-0
2
Jan-
03
Feb-
03
Mar
-03
Ap
r-03
M
ay-0
3
Jun-
03
Jul-0
3
Aug-
03
Sep-
03
Oct
-03
Nitr
ate
(mg/
L)
2.0
4.0
6.0
8.0
10.0
12.0
14.0
Sep-
02
Oct
-02
N
ov-0
2
Dec
-02
Ja
n-03
Fe
b-03
M
ar-0
3
Apr-0
3
May
-03
Ju
n-03
Ju
l-03
Au
g-03
Se
p-03
O
ct-0
3
TKN
(mg
N/L
)
0.2
0.3
0.4
0.5
0.6
0.7
0.8
0.9
Sep-
02
Oct
-02
N
ov-0
2
Dec
-02
Ja
n-03
Fe
b-03
M
ar-0
3
Apr-0
3
May
-03
Ju
n-03
Ju
l-03
Au
g-03
Se
p-03
O
ct-0
3
Phos
phor
us (m
g/L)
0.00
0.05
0.10
0.15
0.20
0.25
0.30
0.35
Nitrate
Total Kjeldahl nitrogen
Orthophosphates
Total P
VAMP VAMP
VAMP
VAMP

MWQI Summary and Findings from Data Collected Sep 2001 through Oct 2003 7-8 Chapter 7 Nutrients
Figure 7-3 Nutrient concentrations at Old River at Station 9
Oct
-01
N
ov-0
1
Dec
-01
Ja
n-02
Fe
b-02
M
ar-0
2
Apr-0
2
May
-02
Ju
n-02
Ju
l-02
Au
g-02
Se
p-02
O
ct-0
2
Nov
-02
D
ec-0
2
Jan-
03
Feb-
03
Mar
-03
Ap
r-03
M
ay-0
3
Jun-
03
Jul-0
3
Aug-
03
Sep-
03
Oct
-03
Nitr
ate
(mg/
L)
0.0
1.0
2.0
3.0
4.0
5.0
6.0
7.0
8.0
Nov
-02
Dec
-02
Jan-
03
Feb-
03
Mar
-03
Apr-0
3
May
-03
Jun-
03
Jul-0
3
Aug-
03
Sep-
03
Oct
-03
TKN
(mg
N/L
)
0.15
0.20
0.25
0.30
0.35
0.40
0.45
0.50
0.55
Nov
-02
Dec
-02
Jan-
03
Feb-
03
Mar
-03
Apr-0
3
May
-03
Jun-
03
Jul-0
3
Aug-
03
Sep-
03
Oct
-03
Phos
phor
us (m
g/L)
0.02
0.04
0.06
0.08
0.10
0.12
0.14
Nitrate
Total Kjeldahl nitrogen
Orthophosphates
Total P
Dry months Dry months
Dry months

MWQI Summary and Findings from Data Collected Sep 2001 through Oct 2003 7-9 Chapter 7 Nutrients
Figure 7-4 Nutrient concentrations at Old River at Bacon Island station
Oct
-01
N
ov-0
1
Dec
-01
Ja
n-02
Fe
b-02
M
ar-0
2
Apr-0
2
May
-02
Ju
n-02
Ju
l-02
Au
g-02
Se
p-02
O
ct-0
2
Nov
-02
D
ec-0
2
Jan-
03
Feb-
03
Mar
-03
Ap
r-03
M
ay-0
3
Jun-
03
Jul-0
3
Aug-
03
Sep-
03
Oct
-03
Nitr
ate
(mg/
L)
0.0
1.0
2.0
3.0
4.0
5.0
Nov
-02
Dec
-02
Jan-
03
Feb-
03
Mar
-03
Apr-0
3
May
-03
Jun-
03
Jul-0
3
Aug-
03
Sep-
03
Oct
-03
TKN
(mg
N/L
)
0.15
0.20
0.25
0.30
0.35
0.40
0.45
Nov
-02
Dec
-02
Jan-
03
Feb-
03
Mar
-03
Apr-0
3
May
-03
Jun-
03
Jul-0
3
Aug-
03
Sep-
03
Oct
-03
Pho
spho
rus
(mg/
L)
0.02
0.04
0.06
0.08
0.10
0.12
Nitrate
Total Kjeldahl nitrogen
Orthophosphates Total P
Dry monthsDry months
Dry months
Dry months

MWQI Summary and Findings from Data Collected Sep 2001 through Oct 2003 7-10 Chapter 7 Nutrients
Figure 7-5 Nutrient concentrations at Banks
Oct
-01
N
ov-0
1
Dec
-01
Ja
n-02
Fe
b-02
M
ar-0
2
Apr-0
2
May
-02
Ju
n-02
Ju
l-02
Au
g-02
Se
p-02
O
ct-0
2
Nov
-02
D
ec-0
2
Jan-
03
Feb-
03
Mar
-03
Ap
r-03
M
ay-0
3
Jun-
03
Jul-0
3
Aug-
03
Sep-
03
Oct
-03
Nitr
ate
(mg/
L)
0.0
1.0
2.0
3.0
4.0
5.0
6.0
7.0
Oct
-01
N
ov-0
1
Dec
-01
Ja
n-02
Fe
b-02
M
ar-0
2
Apr-0
2
May
-02
Ju
n-02
Ju
l-02
Au
g-02
Se
p-02
O
ct-0
2
Nov
-02
D
ec-0
2
Jan-
03
Feb-
03
Mar
-03
Ap
r-03
M
ay-0
3
Jun-
03
Jul-0
3
Aug-
03
Sep-
03
Oct
-03
TKN
(mg
N/L
)
0.1
0.2
0.3
0.4
0.5
0.6
0.7
Oct
-01
N
ov-0
1
Dec
-01
Ja
n-02
Fe
b-02
M
ar-0
2
Apr-0
2
May
-02
Ju
n-02
Ju
l-02
Au
g-02
Se
p-02
O
ct-0
2
Nov
-02
D
ec-0
2
Jan-
03
Feb-
03
Mar
-03
Ap
r-03
M
ay-0
3
Jun-
03
Jul-0
3
Aug-
03
Sep-
03
Oct
-03
Phos
phor
us (m
g/L)
0.04
0.06
0.08
0.10
0.12
0.14
0.16
Nitrate
Total Kjeldahl nitrogen
Orthophosphates Total P
Dry monthsDry months
Dry monthsDry months
Dry months Dry months

MWQI Summary and Findings from Data Collected Sep 2001 through Oct 2003 7-11 Chapter 7 Nutrients
Figure 7-6 Nutrient concentrations at Contra Costa Pumping Plant #1
Oct
-01
N
ov-0
1
Dec
-01
Ja
n-02
Fe
b-02
M
ar-0
2
Apr-0
2
May
-02
Ju
n-02
Ju
l-02
Au
g-02
Se
p-02
O
ct-0
2
Nov
-02
D
ec-0
2
Jan-
03
Feb-
03
Mar
-03
Ap
r-03
M
ay-0
3
Jun-
03
Jul-0
3
Aug-
03
Sep-
03
Oct
-03
Nitr
ate
(mg/
L)
0.0
2.0
4.0
6.0
8.0
10.0
12.0
Nov
-02
Dec
-02
Jan-
03
Feb-
03
Mar
-03
Apr-0
3
May
-03
Jun-
03
Jul-0
3
Aug-
03
Sep-
03
Oct
-03
TKN
(mg
N/L
)
0.2
0.3
0.4
0.5
0.6
0.7
0.8
Nov
-02
Dec
-02
Jan-
03
Feb-
03
Mar
-03
Apr-0
3
May
-03
Jun-
03
Jul-0
3
Aug-
03
Sep-
03
Oct
-03
Phos
phor
us (m
g/L)
0.00
0.02
0.04
0.06
0.08
0.10
0.12
0.14
Nitrate
Total Kjeldahl nitrogen
Orthophosphates
Total P
Dry months Dry months
Dry months
Dry months

MWQI Summary and Findings from Data Collected Sep 2001 through Oct 2003 7-12 Chapter 7 Nutrients
Table 7-1 Summary of ammonia data at 10 MWQI stations Positive detects/ Range Average Median
Station sample number -------------------- mg/L as N-------------------- American and Sacramento River stations American River at E.A. Fairbairn WTP 2/11 0.01–0.03 0.02 0.02 West Sacramento WTP Intake 2/10 0.01–0.03 0.02 0.02 Sacramento River at Hood
11/11 0.06–0.57 0.23 0.17
San Joaquin River station San Joaquin River near Vernalis
9/11 0.01–0.07 0.03 0.03
Delta channel stations Old River at Station 9 11/11 0.02–0.11 0.04 0.03 Old River at Bacon Island
10/11 0.02–0.08 0.03 0.02
Diversion stations Banks Pumping Plant 23/24 0.02–0.14 0.06 0.04 Contra Costa Pumping Plant
8/10 0.01–0.05 0.03 0.03
Other Stations Mallard Island 11/11 0.03–0.15 0.08 0.08 Natomas East Main Drainage Canal 42/46 0.01–0.18 0.05 0.04

MWQI Summary and Findings from Data Collected Sep 2001 through Oct 2003 7-13 Chapter 7 Nutrients
Table 7-2 Summary of nitrate data at 11 MWQI stations Positive detects/ Range Average Median
Station sample number -------------------- mg/L -------------------
American and Sacramento River stations American River at E.A. Fairbairn WTP 12/22 0.1–1.2 0.3 0.2 West Sacramento WTP Intake 22/22 0.1–2.6 0.6 0.4 Sacramento River at Hood
27/27 0.2–2.1 0.6 0.5
San Joaquin River station San Joaquin River near Vernalis
26/27 3.5–13.4 7.4 7.3
Delta channel stations Old River at Station 9 24/24 0.5–7.6 2.1 2.0 Old River at Bacon Island
24/24 0.4–4.1 1.5 1.4
Diversion stations Banks Pumping Plant 24/24 0.6–6.5 2.3 2.2 Contra Costa Pumping Plant 20/21 0.1–10.5 2.6 1.4 Delta-Mendota Canal
24/24 1.2–11.4 3.7 3.3
Other Stations Mallard Island 24/24 0.7–2.1 1.5 1.5 Natomas East Main Drainage Canal 47/47 2.7–25.2 8.3 6.4

MWQI Summary and Findings from Data Collected Sep 2001 through Oct 2003 7-14 Chapter 7 Nutrients
Table 7-3 Summary of combined nitrite and nitrate data at 10 MWQI stations Positive detects/ Range Average Median
Station sample number -------------------- mg/L as N ------------------- American and Sacramento River stations American River at E.A. Fairbairn WTP 8/11 0.01–0.09 0.04 0.04 West Sacramento WTP Intake 10/10 0.06–0.25 0.14 0.13 Sacramento River at Hood
11/11 0.06–0.25 0.14 0.13
San Joaquin River station San Joaquin River near Vernalis
11/11 0.85–3.1 1.83 1.97
Delta channel stations Old River at Station 9 11/11 0.15–1.1 0.46 0.42 Old River at Bacon Island
11/11 0.12–0.77 0.33 0.31
Diversion stations Banks Pumping Plant 24/24 0.13–1.7 0.58 0.53 Contra Costa Pumping Plant
10/10 0.03–2.5 0.73 0.55
Other Stations Mallard Island 11/11 0.23–0.47 0.32 0.31 Natomas East Main Drainage Canal 46/46 0.63–5.7 1.89 1.49

MWQI Summary and Findings from Data Collected Sep 2001 through Oct 2003 7-15 Chapter 7 Nutrients
Table 7-4 Summary of Kjeldahl nitrogen data at 10 MWQI stations Positive detects/ Range Average Median
Station sample number -------------------- mg/L as N-------------------- American and Sacramento River stations American River at E.A. Fairbairn WTP 7/10 0.1–0.2 0.1 0.1 West Sacramento WTP Intake 9/10 0.1–0.2 0.2 0.2 Sacramento River at Hood
11/11 0.3–0.7 0.4 0.3
San Joaquin River station San Joaquin River near Vernalis
11/11 0.4–0.8 0.6 0.5
Delta channel stations Old River at Station 9 11/11 0.2–0.5 0.3 0.3 Old River at Bacon Island
11/11 0.2–0.4 0.3 0.3
Diversion stations Banks Pumping Plant 24/24 0.2–0.6 0.4 0.4
Contra Costa Pumping Plant
10/10 0.3–0.7 0.4 0.4
Other Stations Mallard Island 11/11 0.2–0.7 0.3 0.3 Natomas East Main Drainage Canal 46/46 0.5–4.0 0.9 0.8

MWQI Summary and Findings from Data Collected Sep 2001 through Oct 2003 7-16 Chapter 7 Nutrients
Table 7-5 Summary of orthophosphate data at 10 MWQI stations Positive detects/ Range Average Median
Station sample number -------------------- mg/L-------------------- American and Sacramento River stations American River at E.A. Fairbairn WTP 2/11 0.01–0.01 0.01 0.01 West Sacramento WTP Intake 10/10 0.02–0.04 0.03 0.03 Sacramento River at Hood
11/11 0.03–0.08 0.05 0.04
San Joaquin River station San Joaquin River near Vernalis
11/11 0.08–.2 0.14 0.14
Delta channel stations Old River at Station 9 11/11 0.03–0.08 0.05 0.05 Old River at Bacon Island
11/11 0.03–0.09 0.05 0.06
Diversion stations Banks Pumping Plant 24/24 0.05–0.15 0.07 0.07 Contra Costa Pumping Plant
10/10 0.02–0.07 0.04 0.04
Other Stations Mallard Island 11/11 0.04–0.1 0.06 0.06 Natomas East Main Drainage Canal 46/46 0.08–1.3 0.39 0.31

MWQI Summary and Findings from Data Collected Sep 2001 through Oct 2003 7-17 Chapter 7 Nutrients
Table 7-6 Summary of total phosphorus data at 10 MWQI stations Positive detects/ Range Average Median
Station sample number -------------------- mg/L-------------------- American and Sacramento River stations American River at E.A. Fairbairn WTP 7/10 0.01–0.02 0.02 0.02 West Sacramento WTP Intake 10/10 0.04–0.11 0.07 0.06 Sacramento River at Hood
11/11 0.06–0.13 0.09 0.09
San Joaquin River station San Joaquin River near Vernalis
10/11 0.15–0.32 0.23 0.23
Delta channel stations Old River at Station 9 10/11 0.07–0.12 0.09 0.08 Old River at Bacon Island
10/11 0.06–0.10 0.08 0.08
Diversion stations Banks Pumping Plant 24/24 0.07–0.14 0.10 0.10 Contra Costa Pumping Plant
9/10 0.06–0.12 0.08 0.07
Other Stations Mallard Island 10/11 0.07–0.3 0.12 0.10 Natomas East Main Drainage Canal 44/46 0.18–1.5 0.51 0.44

MWQI Summary and Findings from Data Collected Oct 2001 through Sep 2003 8-i Chapter 8 pH, Alkalinity, Hardness, and Turbidity
Chapter 8 pH, Alkalinity, Hardness, and Turbidity
Contents Chapter 8 pH, Alkalinity, Hardness, and Turbidity ................................................ 8-1
pH ........................................................................................................................ 8-1 Alkalinity............................................................................................................. 8-1 Hardness .............................................................................................................. 8-2 Turbidity .............................................................................................................. 8-2
Turbidity in the Rivers..................................................................................... 8-2 Turbidity at Channel and Diversion Stations................................................... 8-3
Figures
Figure 8-1 Alkalinity in eight MWQI stations........................................................ 8-5 Figure 8-2 Hardness in seven MWQI stations........................................................ 8-6 Figure 8-3 Relationship between turbidity and total suspended solids................... 8-7 Figure 8-4 Turbidity in the rivers and Delta channels ............................................ 8-8
Tables Table 8-1 Summary of pH at 11 MWQI monitoring stations ................................. 8-9 Table 8-2 Summary of alkalinity at 11 MWQI monitoring stations......................8-10 Table 8-3 Summary of hardness at 11 MWQI monitoring stations .......................8-11 Table 8-4 Summary of turbidity at 11 MWQI monitoring stations .......................8-12
Chapter 8 figures and tables

MWQI Summary and Findings from Data Collected Oct 2001 through Sep 2003 8-1 Chapter 8 pH, Alkalinity, Hardness, and Turbidity
Chapter 8 pH, Alkalinity, Hardness, and Turbidity
By Sarojini Balachandra
This chapter summarizes data for pH, alkalinity, hardness, and turbidity during the reporting period. A brief overview of the general ranges of these water quality parameters is presented.
pH Source waters in the Delta were slightly alkaline with median pH ranging from 7.4 to 7.9 (Table 8-1). Seawater influence slightly increases pH of the water directly, and phytoplankton activity indirectly increases water pH by consumption of dissolved carbon dioxide in the water.
Alkalinity Alkalinity is defined as the acid-neutralizing capacity of water. Alkalinity is a function of dissolved carbonates, bicarbonates, and hydroxides of the water. These compounds in high concentrations act as pH buffers in the water. The measure of alkalinity is important for water treatment processes. According to the federal Disinfectants and Disinfection Byproducts (D/DBP) Rule (EPA 1998), alkalinity is one of the criteria used for removal of total organic carbon (TOC) by enhanced coagulation and enhanced softening. Adequate alkalinity is needed to aid coagulation and flocculation (Breuer 2002 pers comm). Although alkalinity is unregulated, waters with high alkalinity have an unpleasant taste. The lowest average and median alkalinity was seen in the American River (Table 8-2). Alkalinity decreased at this station during the dry months (Figure 8-1). Such seasonal variation in alkalinity is not seen in the Sacramento River. In the San Joaquin River, alkalinity was lowest in the month of May. This may be due to the dilutional effect of the freshwater pulse introduced into the SJR between April and May when the Vernalis Adaptive Management Plan (VAMP) was implemented. After this period, alkalinity in the SJR increased in both years. The highest mean and median alkalinity was observed at the Vernalis station (Table 8-2). Although 2002 WY was considered a dry runoff year compared to 2003 WY, median alkalinity was the same in both years at the Vernalis station. Changes in alkalinity at the Bacon Island station and Station 9 were very similar in both years (Figure 8-1). Alkalinity at the Mallard Island station was similar to that of the channel stations (Figure 8-1). Alkalinity at the diversion stations did not show large seasonal variations. However, alkalinity reached its lowest levels in June, July, and August of each water year. The VAMP measures implemented between April and May and opening of the Delta Cross Channel gates to bring in Sacramento River water at the end of May could have led to lower alkalinity in the south and central Delta. The relatively drier runoff year of 2002 had higher median
Table 8-1 Summary of pH at 11 MWQI monitoring stations, 2002 and 2003
Table 8-2 Summary of alkalinity at 11 MWQI monitoring stations
Figure 8-1 Alkalinity in eight MWQI stations
Alkalinity at the Diversion Stations
507090
110130150
10/1
/200
1
12/1
/200
1
2/1/
2002
4/1/
2002
6/1/
2002
8/1/
2002
10/1
/200
2
12/1
/200
2
2/1/
2003
4/1/
2003
6/1/
2003
8/1/
2003Alk
alinit
y (mg
/L as
CaC
O3) DMC
BanksContraCostaPP
Alkalinity in the American River
202224262830323436
10/1
/200
1
12/1
/200
1
2/1/
2002
4/1/
2002
6/1/
2002
8/1/
2002
10/1
/200
2
12/1
/200
2
2/1/
2003
4/1/
2003
6/1/
2003
8/1/
2003
Alkali
nity (
mg/L
as C
aCO3
)
Alkalinity at Vernalis station
406080
100120140160
10/2
/200
1
12/2
/200
1
2/2/
2002
4/2/
2002
6/2/
2002
8/2/
2002
10/2
/200
2
12/2
/200
2
2/2/
2003
4/2/
2003
6/2/
2003
8/2/
2003
Date
Alkali
nity (
mg/L
as C
aCO3
)
Alkalinity at Mallard Isl and Delta Channel Stations
525762677277828792
10/1
/200
1
12/1
/200
1
2/1/
2002
4/1/
2002
6/1/
2002
8/1/
2002
10/1
/200
2
12/1
/200
2
2/1/
2003
4/1/
2003
6/1/
2003
8/1/
2003Alk
alinit
y (mg
/L as
CaC
O3) Mallard
Old Riv at Bacon islStation 9

MWQI Summary and Findings from Data Collected Oct 2001 through Sep 2003 8-2 Chapter 8 pH, Alkalinity, Hardness, and Turbidity
alkalinity at all stations except at Vernalis, Contra Costa Pumping Plant #1, and Natomas East Main Drainage Canal (Table 8-2). The higher runoff in 2003 seemed to have brought in more carbonates, bicarbonates, and hydroxides to Contra Costa Pumping Plant #1 and the NEMDC, and increased median alkalinity at both stations.
Hardness Total hardness is defined as the sum of calcium and magnesium concentrations expressed as calcium carbonate in milligrams per liter. During the reporting period, hardness was monitored at all 11 MWQI stations, and temporal data for 7 of the 11 stations are presented in Figure 8-2. Of the 7 stations, American River water had the lowest hardness, and water at the Mallard Island station had the greatest hardness (Table 8-3), which is heavily influenced by seawater. The drier 2002 WY and the wetter 2003 WY were compared in 11 MWQI stations to establish whether the changes in unimpaired runoff in these 2 years affected the hardness (Table 8-3). Hardness increased in 2003 WY compared to 2002 WY at the SJR station, Contra Costa Pumping Plant #1, and NEMDC. The increased hardness may be associated with increased watershed runoff and drainage discharges during wet years. For example, Rock Slough, which delivers water to the Contra Costa Pumping Plant #1, may get more Delta drainage water during a wetter runoff year as compared to a dry runoff year. This could be a reason for the increase in hardness at Contra Costa Pumping Plant #1 during 2003 WY. At all other stations, the increased runoff reduced the hardness of water in 2003. The dilutional effect of wetter conditions was seen mostly at the Mallard Island station where the hardness decreased by 75% in 2003 WY compared to 2002 WY (Table 8-3).
Turbidity Turbidity in water is caused by suspended particulate matter in the water. Fine particles such as clay, silt, microorganisms, and organic and inorganic matter cause turbidity and reduce clarity in the water. Water with few suspended particles is said to have low turbidity. Total suspended solids are determined by pouring water through a filter and weighing the filter before and after filtration to determine the increase in weight. This increase in weight measures the amount of the particles trapped in the filter and is recorded as the total suspended solids. Turbidity changes at Banks Pumping Plant and NEMDC were similar to the variations in total suspended solids at these locations during the 2 water years (Figure 8-3). Turbidity in the Rivers It was observed in previous wet years that the rivers brought in water that made the bay more turbid. Therefore, at 11 MWQI stations, turbidity was compared between the drier 2002 WY and the wetter 2003 WY.
Table 8-3 Summary of hardness at 11 MWQI monitoring stations
Figure 8-2 Hardness in seven MWQI stations
Hardness at the Mallard Island station
0500
100015002000
10/1
/200
1
12/1
/200
1
2/1/
2002
4/1/
2002
6/1/
2002
8/1/
2002
10/1
/200
2
12/1
/200
2
2/1/
2003
4/1/
2003
6/1/
2003
8/1/
2003Ha
rdne
ss (m
g/L as
caCO
3)
Hardness at diversion stations
4090
140190240290
10/1
/200
1
12/1
/200
1
2/1/
2002
4/1/
2002
6/1/
2002
8/1/
2002
10/1
/200
2
12/1
/200
2
2/1/
2003
4/1/
2003
6/1/
2003
8/1/
2003Ha
rdne
ss (m
g/L a
s CaC
O3)
DMCBanksContraCostaPP
Hardness at Delta channel stations
405060708090
100110120
10/1
/200
1
12/1
/200
1
2/1/
2002
4/1/
2002
6/1/
2002
8/1/
2002
10/1
/200
2
12/1
/200
2
2/1/
2003
4/1/
2003
6/1/
2003
8/1/
2003Ha
rdne
ss (m
g/L as
CaC
O3) Old riv at Bacon isl
Station 9
Hardness in the Vernalis station
0
50100
150200
250
10/2
/200
1
12/2
/200
1
2/2/
2002
4/2/
2002
6/2/
2002
8/2/
2002
10/2
/200
2
12/2
/200
2
2/2/
2003
4/2/
2003
6/2/
2003
8/2/
2003
Date
Hard
ness
(mg/L
as
CaCO
3)
Figure 8-3 Relationship between turbidity and total suspended solids
Banks Pumping Plant
05
101520253035404550
11/1
4/01
12/1
4/01
1/14
/02
2/14
/02
3/14
/02
4/14
/02
5/14
/02
6/14
/02
7/14
/02
8/14
/02
9/14
/02
10/1
4/02
11/1
4/02
12/1
4/02
1/14
/03
2/14
/03
3/14
/03
4/14
/03
5/14
/03
6/14
/03
7/14
/03
8/14
/03
9/14
/03
Turb
idity
(NTU
)
0
5
10
15
20
25
30
35
40
45
50
Tota
l sus
pend
ed s
olid
s (m
g/L)
TurbidityTotal Suspended Solids
NEMDC
0
20
40
60
80
100
120
140
160
180
200
Date
Turb
idity
(NTU
)
0
20
40
60
80
100
120
140
160
180
200
Tota
l sus
pend
ed s
olid
s (m
g/L)
TurbidityTo tal Suspended So lids

MWQI Summary and Findings from Data Collected Oct 2001 through Sep 2003 8-3 Chapter 8 pH, Alkalinity, Hardness, and Turbidity
As expected, turbidity at West Sacramento WTP Intake, the Hood station, and the SJR near Vernalis station showed an increase in average and median turbidity in 2003 WY compared to 2002 WY (Table 8-4). However, the American River did not show an increase in median turbidity in 2003 WY. The lowest turbidity readings were observed in the American River (Table 8-4) during both years. However, the range in turbidity readings at this station was greater during 2003 WY compared to 2002 WY. Of the river, channel, and diversion stations, the highest turbidity readings were recorded at West Sacramento WTP Intake and Sacramento River at Hood in 2003 after the first rainfall events in the watersheds (Figure 8-4 and Table 8-4). It was also observed that turbidity in the American River increased during the first rains in the winter of 2003 WY (Figure 8-4). Similarly, the West Sacramento WTP Intake station, the Hood, and the Mallard Island stations, all on the Sacramento River, experienced an increase in turbidity after the first rainfall events. These increases were greater during 2003 WY than in 2002 WY (Figure 8-4). A similar phenomenon was observed in both channel stations (Figure 8-4). These increases could be due to runoff entering the rivers with large amounts of particulate matter from the watershed accumulated during a dry summer. Turbidity at Channel and Diversion Stations An increase in median turbidity in 2003 WY was also observed at the Contra Costa Pumping Plant (Table 8-4). Mallard Island station, Old River at Station 9, Old River at Bacon Island, and Banks Pumping Plant had lower median turbidity in 2003 WY than in 2002 WY (Table 8-4).
Table 8-4 Summary of turbidity at 11 MWQI monitoring stations
Figure 8-4 Turbidity in the rivers and Delta channels
Turbidity in Sacramento River at Hood and West Sac intake
-10
40
90
140
190
240
10/1
/01
12/1
/01
2/1/
02
4/1/
02
6/1/
02
8/1/
02
10/1
/02
12/1
/02
2/1/
03
4/1/
03
6/1/
03
8/1/
03
Turb
idity
(NTU
)
HoodSacWSacInt
Turbidity at Delta channel stations
05
101520253035
10/2
/01
12/2
/01
2/2/
02
4/2/
02
6/2/
02
8/2/
02
10/2
/02
12/2
/02
2/2/
03
4/2/
03
6/2/
03
8/2/
03
Turb
idity
(NTU
) Old riv at Bacon islStation 9
Turbidity in American River
02468
101214
10/1
/01
12/1
/01
2/1/
02
4/1/
02
6/1/
02
8/1/
02
10/1
/02
12/1
/02
2/1/
03
4/1/
03
6/1/
03
8/1/
03
Date
Turb
idity
(NTU
)
Turbidity at the Mallard Island station
020406080
100120
10/1
/01
12/1
/01
2/1/
02
4/1/
02
6/1/
02
8/1/
02
10/1
/02
12/1
/02
2/1/
03
4/1/
03
6/1/
03
8/1/
03
Turb
idity
(NTU
)

MWQI Summary and Findings from Data Collected Oct 2001 through Sep 2003 8-4 Chapter 8 pH, Alkalinity, Hardness, and Turbidity
Chapter 8 pH, Alkalinity, Hardness, and Turbidity
Figures Figure 8-1 Alkalinity in eight MWQI stations.......................................................................................................... 8-5 Figure 8-2 Hardness in seven MWQI stations.......................................................................................................... 8-6 Figure 8-3 Relationship between turbidity and total suspended solids..................................................................... 8-7 Figure 8-4 Turbidity in the rivers and Delta channels .............................................................................................. 8-8
Tables Table 8-1 Summary of pH at 11 MWQI monitoring stations ................................................................................... 8-9 Table 8-2 Summary of alkalinity at 11 MWQI monitoring stations....................................................................... 8-10 Table 8-3 Summary of hardness at 11 MWQI monitoring stations ........................................................................ 8-11 Table 8-4 Summary of turbidity at 11 MWQI monitoring stations ........................................................................ 8-12

MWQI Summary and Findings from Data Collected Oct 2001 through Sep 2003 8-5 Chapter 8 pH, Alkalinity, Hardness, and Turbidity
Figure 8-1 Alkalinity in eight MWQI stations
Alkalinity at the diversion stations
507090
110130150
10/1
/200
1
12/1
/200
1
2/1/
2002
4/1/
2002
6/1/
2002
8/1/
2002
10/1
/200
2
12/1
/200
2
2/1/
2003
4/1/
2003
6/1/
2003
8/1/
2003Alk
alinit
y (mg
/L as
CaC
O3) DMC
Banks
ContraCostaPP
Alkalinity in the American River
202224262830323436
10/1
/200
1
12/1
/200
1
2/1/
2002
4/1/
2002
6/1/
2002
8/1/
2002
10/1
/200
2
12/1
/200
2
2/1/
2003
4/1/
2003
6/1/
2003
8/1/
2003
Alkali
nity (
mg/L
as C
aCO3
)
Alkalinity at Vernalis station
406080
100120140160
10/2
/200
1
12/2
/200
1
2/2/
2002
4/2/
2002
6/2/
2002
8/2/
2002
10/2
/200
2
12/2
/200
2
2/2/
2003
4/2/
2003
6/2/
2003
8/2/
2003
Date
Alkali
nity (
mg/L
as C
aCO3
)Alkalinity at Mallard Island and Delta channel stations
525762677277828792
10/1
/200
1
12/1
/200
1
2/1/
2002
4/1/
2002
6/1/
2002
8/1/
2002
10/1
/200
2
12/1
/200
2
2/1/
2003
4/1/
2003
6/1/
2003
8/1/
2003Alk
alinit
y (mg
/L as
CaC
O3) Mallard
Old Riv at Bacon isl
Station 9

MWQI Summary and Findings from Data Collected Oct 2001 through Sep 2003 8-6 Chapter 8 pH, Alkalinity, Hardness, and Turbidity
Figure 8-2 Hardness in seven MWQI stations
Hardness at the Mallard Island station
0500
100015002000
10/1
/200
1
12/1
/200
1
2/1/
2002
4/1/
2002
6/1/
2002
8/1/
2002
10/1
/200
2
12/1
/200
2
2/1/
2003
4/1/
2003
6/1/
2003
8/1/
2003Ha
rdne
ss (m
g/L as
caCO
3)
Hardness at diversion stations
4090
140190240290
10/1
/200
1
12/1
/200
1
2/1/
2002
4/1/
2002
6/1/
2002
8/1/
2002
10/1
/200
2
12/1
/200
2
2/1/
2003
4/1/
2003
6/1/
2003
8/1/
2003Ha
rdne
ss (m
g/L as
CaC
O3)
DMCBanksContraCostaPP
Hardness at Delta channel stations
405060708090
100110120
10/1
/200
1
12/1
/200
1
2/1/
2002
4/1/
2002
6/1/
2002
8/1/
2002
10/1
/200
2
12/1
/200
2
2/1/
2003
4/1/
2003
6/1/
2003
8/1/
2003Ha
rdne
ss (m
g/L as
CaC
O3) Old riv at Bacon isl
Station 9
Hardness in the Vernalis station
0
50
100
150
200
250
10/2
/200
1
12/2
/200
1
2/2/
2002
4/2/
2002
6/2/
2002
8/2/
2002
10/2
/200
2
12/2
/200
2
2/2/
2003
4/2/
2003
6/2/
2003
8/2/
2003
Date
Hard
ness
(mg/L
as
CaCO
3)

MWQI Summary and Findings from Data Collected Oct 2001 through Sep 2003 8-7 Chapter 8 pH, Alkalinity, Hardness, and Turbidity
Figure 8-3 Relationship between turbidity and total suspended solids
Banks Pumping Plant
05
101520253035404550
11/1
4/20
01
12/1
4/20
01
1/14
/200
2
2/14
/200
2
3/14
/200
2
4/14
/200
2
5/14
/200
2
6/14
/200
2
7/14
/200
2
8/14
/200
2
9/14
/200
2
10/1
4/20
02
11/1
4/20
02
12/1
4/20
02
1/14
/200
3
2/14
/200
3
3/14
/200
3
4/14
/200
3
5/14
/200
3
6/14
/200
3
7/14
/200
3
8/14
/200
3
9/14
/200
3
Turb
idity
(NTU
) .
05101520253035404550
Tota
l sus
pend
ed s
olid
s (m
g/L)Turbidity
Total Suspended Solids
NEMDC
0
20
40
60
80
100
120
140
160
180
200
11/7
/200
1
12/7
/200
1
1/7/
2002
2/7/
2002
3/7/
2002
4/7/
2002
5/7/
2002
6/7/
2002
7/7/
2002
8/7/
2002
9/7/
2002
10/7
/200
2
11/7
/200
2
12/7
/200
2
1/7/
2003
2/7/
2003
3/7/
2003
4/7/
2003
5/7/
2003
6/7/
2003
7/7/
2003
8/7/
2003
9/7/
2003
Date
Turb
idity
(NTU
) .
0
20
40
60
80
100
120
140
160
180
200
Tota
l sus
pend
ed s
olid
s (m
g/L)Turbidity
Total Suspended Solids

MWQI Summary and Findings from Data Collected Oct 2001 through Sep 2003 8-8 Chapter 8 pH, Alkalinity, Hardness, and Turbidity
Figure 8-4 Turbidity in the rivers and Delta channels
Turbidity in Sacramento River at Hood and West Sac intake
-10
40
90
140
190
240
10/1
/01
12/1
/01
2/1/
02
4/1/
02
6/1/
02
8/1/
02
10/1
/02
12/1
/02
2/1/
03
4/1/
03
6/1/
03
8/1/
03
Turb
idity
(NTU
)HoodSacWSacInt
Turbidity at Delta channel stations
05
101520253035
10/2
/01
12/2
/01
2/2/
02
4/2/
02
6/2/
02
8/2/
02
10/2
/02
12/2
/02
2/2/
03
4/2/
03
6/2/
03
8/2/
03
Turb
idity
(NTU
) Old riv at Bacon islStation 9
Turbidity in American River
02468
101214
10/1
/01
12/1
/01
2/1/
02
4/1/
02
6/1/
02
8/1/
02
10/1
/02
12/1
/02
2/1/
03
4/1/
03
6/1/
03
8/1/
03
Date
Turb
idity
(NTU
)
Turbidity at the Mallard Island station
020406080
100120
10/1
/01
12/1
/01
2/1/
02
4/1/
02
6/1/
02
8/1/
02
10/1
/02
12/1
/02
2/1/
03
4/1/
03
6/1/
03
8/1/
03
Turb
idity
(NTU
)

MWQI Summary and Findings from Data Collected Oct 2001 through Sep 2003 8-9 Chapter 8 pH, Alkalinity, Hardness, and Turbidity
Table 8-1 Summary of pH at 11 MWQI monitoring stations
Station Sample number Range (pH units) Median American and Sacramento River stations American River at E.A. Fairbairn WTPa 59 5.9–8.0 7.4 West Sacramento WTP Intake 60 6.6–8.3 7.6 Sacramento River at Hood
97 6.9–8.5 7.5
San Joaquin River stations San Joaquin River near Vernalis
100 7.0–9.0 7.8
Delta channel stations Old River at Station 9 63 6.9–8.8 7.6 Old River at Bacon Island
61 6.7–8.5 7.8
Diversion stations Banks Pumping Plant 20 7.3–8.3 7.8 Delta-Mendota Canal 23 7.5–8.4 7.8 Contra Costa Pumping Plant
21 7.5–8.8 7.9
Other stations Sacramento River at Mallard Island 23 7.2–8.0 7.6 Natomas East Main Drainage Canal 46 6.4–8.5 7.4
a. Field pH except for the American River station where lab pH was used.

MWQI Summary and Findings from Data Collected Oct 2001 through Sept 2003 8-10 Chapter 8 pH, Alkalinity, Hardness, and Turbidity
Table 8-2 Summary of alkalinity at 11 MWQI monitoring stations 2002 Water Year 2003 Water Year Range Average Median Range Average Median %
Station Sample number ----------(mg/L as CaCO3)-----------
Sample number ----------(mg/L as CaCO3)-----------
difference in mediana
American and Sacramento River stations American River at E.A. Fairbairn WTP 27 24–34 30 31 32 22–29 26 27 -13 West Sacramento WTP Intake 30 54–99 72 70 31 50–94 69 66 -6 Sacramento River at Hood
50 52–93 66 63 51 51–84 64 62 -2
San Joaquin River stations San Joaquin River near Vernalis
51 54–155 110 113 52 29–156 108 113 0
Delta channel stations Old River at Station 9 31 64–90 75 75 32 55–80 71 73 -3 Old River at Bacon Island
31 60–89 73 72 31 54–78 69 69 -4
Diversion stations
Banks Pumping Plant 12 60–92 76 77 12 58–83 71 73 -5 Delta-Mendota Canal 11 56–65 83 81 13 57–150 86 78 -4 Contra Costa Pumping Plant
10 67–93 80 81 11 60–138 95 98 20
Other stations Sacramento River at Mallard Island 12 63–93 76 74 12 56–89 70 69 -7 Natomas East Main Drainage Canal 21 38–178 96 76 26 32–209 104 102 34 a. Negative sign denotes a decrease in median

MWQI Summary and Findings from Data Collected Oct 2001 through Sept 2003 8-11 Chapter 8 pH, Alkalinity, Hardness, and Turbidity
Table 8-3 Summary of hardness at 11 MWQI monitoring stations 2002 Water Year 2003 Water Year Range Average Median Range Average Median %
Station Sample number ----------(mg/L as CaCO3)----------
Sample number ----------(mg/L as CaCO3)----------
difference in mediana
American and Sacramento River stations American River at E.A. Fairbairn WTP 10 21–34 26 26 10 21–26 23 23 -12 West Sacramento WTP Intake 12 46–77 62 61 11 46–75 58 59 -3 Sacramento River at Hood
15 43–75 58 55 11 43–68 55 55 0
San Joaquin River stations San Joaquin River near Vernalis
14 75–227 152 151 12 91–141 171 170 13
Delta channel stations Old River at Station 9 12 52–65 95 97 11 56–111 80 75 -23 Old River at Bacon Island
11 59–117 89 90 12 50–110 74 68 -24
Diversion stations Banks Pumping Plant 12 72–113 97 99 12 52–112 84 85 -14 Delta-Mendota Canal 12 75–277 120 109 12 55–234 108 91 -17 Contra Costa Pumping Plant
10 65–141 105 104 11 63–237 135 144 38
Other stations Sacramento River at Mallard Island 10 75–1688 526 366 11 56–1010 328 91 -75 Natomas East Main Drainage Canal 21 41–171 93 75 26 35–179 95 88 17
a. Negative sign denotes a decrease in median

MWQI Summary and Findings from Data Collected Oct 2001 through Sept 2003 8-12 Chapter 8 pH, Alkalinity, Hardness, and Turbidity
Table 8-4 Summary of turbidity at 11 MWQI monitoring stations
2002 Water Year 2003 Water Year Range Average Median Range Average Median %
Station Sample number ------------------NTU-----------------
Sample number ------------------NTU-----------------
difference in mediana
American and Sacramento River stations American River at E.A. Fairbairn WTP 27 1–6 2 2 29 1–13 2 2 0 West Sacramento WTP Intake 29 7–107 27 14 32 5–186 36 17 21 Sacramento River at Hood 50 4–134 19 9 51 3–145 22 11 22 San Joaquin River stations San Joaquin River near Vernalis 51 8–50 21 20 52 11–64 24 23 15 Delta channel stations Old River at Station 9 31 5–25 12 11 32 4–30 11 9 -18 Old River at Bacon Island 31 4–22 11 11 31 4–30 10 7 -36 Division stations Banks Pumping Plant 12 5–33 14 13 12 4–39 14 10 -23 Delta-Mendota Canal 12 9–24 15 13 12 6–35 16 16 23 Contra Costa Pumping Plant 10 5–23 12 11 11 4–21 12 13 18 Other stations Sacramento River at Mallard Island 12 12–59 35 33 12 9–110 31 27 -18 Natomas East Main Drainage Canal 21 6–61 23 18 49 6–141 31 27 50 a. Negative sign denotes a decrease in median

MWQI Summary and Findings from Data Collected Oct 2001 through Sep 2003 9-i Chapter 9 Other Water Quality Constituents
Chapter 9 Other Water Quality Constituents
Contents Chapter 9 Other Water Quality Constituents ........................................................... 9-1
Metallic Constituents ........................................................................................... 9-1 Constituents Affecting Taste, Odor, and Appearance.......................................... 9-2
Aluminum, Iron, and Manganese at Diversion Stations .................................. 9-2 Aluminum, Iron, and Manganese at NEMDC ................................................. 9-2 Boron ............................................................................................................... 9-2
Figure
Figure 9-1 Aluminum, iron, and manganese at NEMDC ....................................... 9-5
Tables Table 9-1 Summary of data for metallic constituents ............................................. 9-6 Table 9-2 Summary of regulated constituents in drinking water having federal and
State primary MCLs .............................................................................. 9-7 Table 9-3 Summary of boron data at MWQI stations............................................. 9-8

MWQI Summary and Findings from Data Collected Oct 2001 through Sep 2003 9-1 Chapter 9 Other Water Quality Constituents
Chapter 9 Other Water Quality Constituents
By Sarojini Balachandra This chapter discusses metallic and nonmetallic constituents monitored in Delta source waters. These constituents include aluminum, boron, copper, iron, manganese, silver, zinc, antimony, arsenic, barium, cadmium, chromium, lead, mercury, nickel, and selenium, which can be harmful to human health when present in drinking waters at high concentrations. Except for boron, these constituents were monitored only at Delta diversion points. Boron was monitored at all 11 MWQI stations. Many of the metals reaching the Sacramento and San Joaquin rivers came from abandoned mines, wastewater treatment plants, and surface flows from agricultural and urban areas. These constituents are either regulated by national and State law or are of current regulatory interests. Federal or California drinking water standards have been established for most of these parameters in the form of primary or secondary maximum contaminant levels. Primary MCLs established by the federal government are enforceable; secondary standards are nonenforceable. The California Department of Health Services (DHS) is given the responsibility for implementing the federal Clean Water Act, which requires the State to establish MCLs that are at least as stringent as the federal standards. California has adopted primary and secondary MCLs meeting this requirement. Secondary MCLs established by California are enforceable. These standards affect characteristics such as taste, odor, and color of drinking water. Metallic constituents that can affect the health of human beings when present above their MCLs are aluminum, antimony, arsenic, barium, beryllium, cadmium, copper, lead, mercury, nickel, selenium, and thalium. Article 19 of the Standard Provisions for Water Supply Contract established water quality objectives for concentrations of copper, zinc, arsenic, chromium, lead, and selenium that should not be exceeded in waters of the State Water Project (DWR 1962). During this reporting period, the concentrations of all these constituents never exceeded the objectives. The concentrations of all these elements reported in this chapter are similar to those from the previous summary period, 1998 to 2001 (DWR 2003a) at the same stations.
Metallic Constituents Historical data indicate that metallic constituents (aluminum, copper, iron, manganese, silver, and zinc) were not a serious concern for Delta source waters. Therefore, regular monitoring of these constituents is not considered to be necessary at all stations. Thus, only 3 stations were monitored: Banks Pumping Plant, Delta-Mendota Canal (DMC) at McCabe Road, and Natomas East Main Drainage Canal, (NEMDC) (Tables 9-1 and 9-2). Data collected during the reporting period suggested that concentrations of antimony, arsenic, barium, cadmium, chromium, lead, mercury, nickel, selenium, and copper were never above their respective MCLs (Tables 9-1 and 9- 2).
Table 9-2 Summary of regulated constituents in drinking water having federal and State primary MCLs
Table 9-1 Summary of data for metallic constituents

MWQI Summary and Findings from Data Collected Oct 2001 through Sep 2003 9-2 Chapter 9 Other Water Quality Constituents
Neither silver nor zinc was monitored at NEMDC. Silver and zinc were not detected at DMC at McCabe Road (Table 9-1). Silver was not detected, and zinc was less than the MCL at the Banks Pumping Plant (Table 9-1).
Constituents Affecting Taste, Odor, and Appearance
Turbidity, aluminum, copper, iron, manganese, silver, and zinc affect taste, odor, and appearance of drinking water. Corrosion of iron and copper may stain household fixtures and impart a metallic taste and give a red, blue, or green color to the water (EPA 1992). Iron above 0.3 mg/L can have a metallic taste and cause staining (EPA 1992). Manganese concentrations above 0.05 mg/L can produce a bitter metallic taste to the water and brown-black staining of fixtures (EPA 1992). Aluminum above 0.2 mg/L can color the water (EPA 1992). Aluminum, Iron, and Manganese at Diversion Stations Aluminum was not detected at Banks Pumping Plant and DMC at McCabe Road (Table 9-1). Iron and manganese were found at Banks Pumping Plant and DMC at McCabe Road, but the concentrations never exceeded their respective MCLs (Table 9-1). Aluminum, Iron, and Manganese at NEMDC Aluminum was detected at NEMDC in most of the water samples collected during the 2 water years (Table 9-1). The amounts were above the MCL in some samples collected during the rainy season (Figure 9-1). During the dry months of June, July, and August, concentrations of aluminum, iron, and manganese were below their respective MCLs at this station (Figure 9-1). In some samples, manganese and iron were above the MCL at NEMDC (Figure 9-1). The US Geological Survey also recorded a manganese concentration above the MCL in the Arcade Creek in 1997. Arcade Creek receives runoff from an urban district and discharges into NEMDC (DWR 2003). Inflow from NEMDC is relatively small. Water from NEMDC discharges into the Sacramento River, and the dilutional effect of the river reduces the aluminum, manganese, and iron concentrations. Therefore, concentrations of these metals never increase to levels above the MCLs at the diversion points. Boron Dissolved boron compounds do not produce taste or smell in the drinking water. Seawater has about 5 mg/L of boron as boric acid and boric acid salts. California has boron-rich groundwater in the western San Joaquin Valley. Boron is currently not regulated but generally monitored in drinking water. The DHS action level for boron is 1 mg/L. ALs are based on health advisory levels of contaminants that have no primary MCLs. ALs are not enforceable, but exceeding them prompts statutory requirements and recommendations by DHS for consumer notices. At higher levels, source removal may be recommended.
Figure 9-1 Aluminum, iron, and manganese at NEMDC
NEMDC Aluminum
0
0.2
0.4
0.6
0.8
10/1
/200
1
12/1
/200
1
2/1/
2002
4/1/
2002
6/1/
2002
8/1/
2002
10/1
/200
2
12/1
/200
2
2/1/
2003
4/1/
2003
6/1/
2003
8/1/
2003
Date
Alu
min
um (m
g/L)
NEMDC Iron
0
0.3
0.6
10/1
/200
1
12/1
/200
1
2/1/
2002
4/1/
2002
6/1/
2002
8/1/
2002
10/1
/200
2
12/1
/200
2
2/1/
2003
4/1/
2003
6/1/
2003
8/1/
2003
Date
Iron
(mg/
L)
NEMDC Manganese
0
0.05
0.1
10/1
/200
1
12/1
/200
1
2/1/
2002
4/1/
2002
6/1/
2002
8/1/
2002
10/1
/200
2
12/1
/200
2
2/1/
2003
4/1/
2003
6/1/
2003
8/1/
2003
Date
Man
gane
se (m
g/L)

MWQI Summary and Findings from Data Collected Oct 2001 through Sep 2003 9-3 Chapter 9 Other Water Quality Constituents
During the reporting period, boron was never detected in the American River at E.A. Fairbairn Water Treatment Plant or at Sacramento River at Hood (Table 9-3). Although boron was detected in the water samples from the San Joaquin River station, Delta channel stations, diversion stations, and NEMDC, the concentrations were always below the DHS AL of 1 mg/L (Table 9-3). At the diversion stations, average boron concentration was from 0.1 to 0.2 mg/L, which was below boron’s AL (Table 9-3). Boron concentrations at the diversion stations did not exceed objective levels specified in Standard Provisions for Water Supply Contract Article 19, which was established to protect agriculture (monthly average of 0.6 mg/L). However, one sample out of 24 collected from the DMC at McCabe Road, contained a boron concentration of 0.6 mg/L. Boron was at or above 0.6 mg/L in 6 out of 24 samples collected from the Mallard Island station. Elevated boron at this location came from seawater.
Table 9-3 Summary of boron data at MWQI stations

MWQI Summary and Findings from Data Collected Oct 2001 through Sep 2003 9-4 Chapter 9 Other Water Quality Constituents
Chapter 9 Other Water Quality Constituents
Figure Figure 9-1 Aluminum, iron, and manganese at NEMDC ......................................................................................... 9-5
Tables Table 9-1 Summary of data for metallic constituents ............................................................................................... 9-6 Table 9-2 Summary of regulated constituents in drinking water having federal and State primary MCLs.............. 9-7 Table 9-3 Summary of boron data at MWQI stations............................................................................................... 9-8

MWQI Summary and Findings from Data Collected Oct 2001 through Sep 2003 9-5 Chapter 9 Other Water Quality Constituents
Figure 9-1 Aluminum, iron, and manganese at NEMDC
NEMDC Aluminum
0
0.2
0.4
0.6
0.8
10/1
/200
1
12/1
/200
1
2/1/
2002
4/1/
2002
6/1/
2002
8/1/
2002
10/1
/200
2
12/1
/200
2
2/1/
2003
4/1/
2003
6/1/
2003
8/1/
2003
Date
Alu
min
um (m
g/L)
NEMDC Iron
0
0.3
0.6
10/1
/200
1
12/1
/200
1
2/1/
2002
4/1/
2002
6/1/
2002
8/1/
2002
10/1
/200
2
12/1
/200
2
2/1/
2003
4/1/
2003
6/1/
2003
8/1/
2003
Date
Iron
(mg/
L)
NEMDC Manganese
0
0.05
0.1
10/1
/200
1
12/1
/200
1
2/1/
2002
4/1/
2002
6/1/
2002
8/1/
2002
10/1
/200
2
12/1
/200
2
2/1/
2003
4/1/
2003
6/1/
2003
8/1/
2003
Date
Man
gane
se (m
g/L)

MWQI Summary and Findings from Data Collected Oct 2001 through Sep 2003 9-6 Chapter 9 Other Water Quality Constituents
Table 9-1 Summary of data for metallic constituents Station
MCL Banks DMC NEMDC Constituent ------------------------------------------------mg/L---------------------------------------------
Aluminum 0.2 Detects/sample number 0/23 0/17 40/51 Range <0.01 <0.01 0.01–0.62 Average 0.11 Median 0.03 Copper 1.0 Detects/sample number 24/24 24/24 47/51 Range 0.002–0.009 0.001–0.007 0.002–0.005 Average 0.003 0.002 0.003 Median 0.002 0.002 0.003 Iron 0.3 Detects/sample number 14/24 10/24 47/51 Range 0.005–0.085 0.005–0.06 0.018–0.493 Average 0.032 0.021 0.133 Median 0.024 0.016 0.078 Manganese 0.05 Detects/sample number 20/24 2/24 46/51 Range 0.007–0.028 0.006–0.025 0.009–0.372* Average 0.012 0.016 0.037 Median 0.01 0.03 Silver 0.1 Detects/sample number 0/23 0/17 _ Range <0.001 <0.001 Zinc Detects/sample number 5.0 2/26 0/24 _ Range 0.005–0.015 <0.005 Average 0.01 * The highest value recorded may not be true as the next highest value for the 2-year period was 0.051

MWQI Summary and Findings from Data Collected Oct 2001 through Sep 2003 9-7 Chapter 9 Other Water Quality Constituents
Table 9-2 Summary of regulated constituents in drinking water having federal and State primary MCLs
Station MCL Banks DMC NEMDC Constituent ------------------------------------------------mg/L------------------------------------------------
Antimony 0.006 Detects/sample number 0/26 0/24 _ Range <0.005/<0.001* <0.005/<0.001* Arsenic 0.01 Detects/sample number 24/24 24/24 47/51 Range 0.001–0.003 0.001–0.003 0.002–0.006 Average 0.002 0.002 0.003 Median 0.002 0.002 0.003
Barium 2.0 or 1.0 (DHS) Detects/sample number 0/23 15/17 _ Range <0.05 0.05–0.06 Average 0.06 Median Cadmium 0.005 Detects/sample number 0/17 0/24 _ Range <0.001 <0.001 Chromium 0.1 or 0.05 (DHS) Detects/sample number 21/24 23/24 _ Range 0.001–0.007 0.001–0.009 Average 0.004 0.004 Median 0.003 0.003 Lead 0.015a Detects/sample number 0/24 0/24 _ Range <0.001 <0.001 Mercury 0.002 Detects/sample number 0/24 0/17 _ Range <0.0002 <0.0002 Nickel 0.1 (DHS) Detects/sample number 22/24 22/22 _ Range 0.001–0.002 0.001–0.003 Average 0.001 0.001 Median 0.001 0.001 Selenium 0.05 Detects/sample number 9/24 _ _ Range 0.001–0.002 Average 0.001 Median 0.001 * From July 2002 the lab detection limit was improved to 0.001. The previous detection limit was 0.005. a. Action level that triggers treatment actions if exceeded in more than 10% of tap water samples.

MWQI Summary and Findings from Data Collected Oct 2001 through Sep 2003 9-8 Chapter 9 Other Water Quality Constituents
Table 9-3 Summary of boron data at MWQI stations Positive detects/ Range Average Median
Station sample number ---------------------mg/L--------------- American and Sacramento River stations American River at E.A. Fairbairn WTP 0/22 _ _ _ West Sacramento WTP Intake 1/23 <0.1–1.0 _ _ Sacramento River at Hood 0/27 _ _ _ San Joaquin River stations San Joaquin River near Vernalis 26/27 0.2–0.8 0.4 0.4 Delta channel stations Old River at Station 9 11/26 0.1–0.3 0.2 0.1 Old River at Bacon Island 7/24 0.1–0.1 0.1 0.1 Diversion stations Banks Pumping Plant 18/24 0.1–0.3 0.1 0.1 Delta-Mendota Canal 22/24 0.1–0.6 0.2 0.2 Contra Costa Pumping Plant 15/21 0.1–0.5 0.2 0.2 Other stations Sacramento River at Mallard Island 17/24 0.1–1.4 0.5 0.3 Natomas East Main Drainage Canal 36/49 0.1–0.3 0.2 0.2 Note: Boron is currently an unregulated constituent that requires monitoring.

MWQI Summary and Findings from Data Collected Oct 2001 through Sep 2003 10-i Chapter 10 Data Quality Control
Chapter 10 Data Quality Control
Contents Chapter 10 Data Quality Control ........................................................................... 10-1
Overview ........................................................................................................... 10-1 Field Procedures Quality Control ...................................................................... 10-1
Field Duplicates............................................................................................. 10-1 Field Blanks................................................................................................... 10-1 Internal Quality Controls ............................................................................... 10-1 Sample Holding Times .................................................................................. 10-2 Method Blanks............................................................................................... 10-2 Laboratory Control Samples (LCS)............................................................... 10-2 Matrix Spike Recovery .................................................................................. 10-3 Matrix Spike Duplicates ................................................................................ 10-4 Sample Duplicates ......................................................................................... 10-4
Tables
Table 10-1 Field duplicates ...................................................................................10-6 Table 10-2 Field blanks exceeding control limits................................................10-11 Table 10-3 Total internal QC batches grouped by analyte ..................................10-12 Table 10-4 Holding time exceedances.................................................................10-14 Table 10-5 Method blank exceedances................................................................10-15 Table 10-6 Number of batches with method blank exceedances.........................10-16 Table 10-7 Environmental samples associated with method blank
exceedances ......................................................................................10-17 Table 10-8 LCS recovery exceedances................................................................10-20 Table 10-9 Frequency of QC batches with LCS recovery exceedances ..............10-20 Table 10-10 Samples with LCS recovery exceedances .......................................10-20 Table 10-11 Matrix spike recovery exceedances.................................................10-21 Table 10-12 Frequency of QC batches with matrix spike recovery
exceedances.....................................................................................10-22 Table 10-13 Samples with matrix spike recovery exceedances...........................10-23 Table 10-14 Matrix spike duplicate recovery exceedances .................................10-28 Table 10-15 Number of matrix spike duplicate recovery exceedances ...............10-28 Table 10-16 Samples with matrix spike duplicate exceedances ..........................10-29 Table 10-17 Sample duplicate exceedances ........................................................10-30 Table 10-18 Number of sample duplicate exceedances.......................................10-30 Table 10-19 Samples with sample duplicate exceedances...................................10-30
Chapter 10 tables

MWQI Summary and Findings from Data Collected Oct 2001 through Sep 2003 10-1 Chapter 10 Data Quality Control
Chapter 10 Data Quality Control
Overview This data quality review covers the reporting period from October 1, 2001, through September 30, 2003. The Municipal Water Quality Investigations (MWQI) Program monitored and collected data from 11 stations during this reporting period. The data review was performed using the available quality control (QC) data stored in the California Department of Water Resources (DWR) Field and Laboratory Information Management System (FLIMS) database. The database was used to retrieve the data and flag the analyses that were outside established control limits. The data quality review indicated that overall the 2001–2003 MWQI project data were of acceptable quality. A few analyses were outside the control limits, but they were not considered to have a significant impact on the overall data quality of the project. The results of the review are presented below.
Field Procedures Quality Control
Field Duplicates Field duplicates are replicate samples taken at a randomly selected station during each field run to evaluate precision of field and laboratory procedures. The results of field duplicate analyses are evaluated by calculating relative percent differences and comparing the RPDs with established control limits. The equation for expressing precision is:
RPD= (D1 -D2)/[(D1+D2)/2] x100, where D1 is the first sample value and D2 is the second sample value. During the study period, 2,066 field duplicate analyses were performed and 134 (6.5%) of the RPDs exceeded the acceptable control limits (Table 10-1). The results indicate that field and laboratory procedures were of acceptable precision for the project. Field Blanks Field blanks are purified water samples taken to the field and filtered or left unfiltered. Filtered blanks help check for contamination from field sample processing procedures. Unfiltered blanks check for contamination from containers and preservatives. In the study period, 569 field blank analyses were performed, and 9 of the field blanks (1.6%) exceeded the control limit (Table 10-2). Internal Quality Controls Internal QCs are procedures used in the laboratory to ensure that the analytical methods are in control. Environmental samples are grouped in “batches,” with approximately 20 samples per batch. Generally, one of each
Table 10-1 Field duplicates
Table 10-2 Field blanks exceeding control limits

MWQI Summary and Findings from Data Collected Oct 2001 through Sep 2003 10-2 Chapter 10 Data Quality Control
QC measure such as method blank, matrix spike, etc., is performed with each batch to confirm that the analytical method is in control. In some cases the laboratory performs more than one of each of the QC measures to ensure the quality of the batch. The total number of internal QC analyses performed per analyte is shown in Table 10-3. The following is a review of the internal QC for the project. Sample Holding Times Holding time is the period during which a sample can be stored after collection and preservation without significantly affecting the accuracy of its analysis. During the 2001-2003 study period, approximately 8,904 environmental analyses were conducted and 12 analyses (0.13 %) exceeded the holding time. The analyses that exceeded the holding times are listed in Table 10-4. The analytes that exceeded holding times were chromium, orthophosphate, and ultraviolet absorbance (UVA). Chromium has a holding time limit of 24 hours and orthophosphate 48 hours, whereas UVA has a holding time limit of 14 days. The table shows the number of hours or days that the samples were held by the laboratory compared to their holding time limits. The analytes in the table exceeded holding time limits from a few hours to several days. Although the frequency of these exceedances was low, the results of the specific analyses should be interpreted with caution. Method Blanks The purpose of method blanks is to detect and quantify contamination introduced through sample preparation or analytical procedures in the laboratory (some “background noise” is allowed). A total of 2,978 method blanks were performed from October 2001 through September 2003, and 17 (0.6%) exceeded the control limits. Table 10-5 shows the number of method blanks outside the control limits. The analytes were dissolved organic carbon (DOC) and total organic carbon (TOC). Table 10-6 shows the frequency of method blank contamination for these analytes. The frequency of method blanks out of the control limits was 4.2% for DOC by method EPA 415.1 (D) Ox and 4.7% for TOC by method EPA 415.1 (T) Ox. The samples affected by method blank contamination are shown in Table 10-7. Laboratory Control Samples (LCS) Laboratory control sample recoveries are used to assess the accuracy of the analytical method especially when matrix interference occurs in the analyses of the environmental samples. LCSs are prepared by adding a known concentration of analyte of interest into a clean medium. The LCS is then analyzed, and the results are compared to the laboratory’s control limits. During the period of October 2001 through September 2003, 5,080 LCS analyses were performed (Table 10-3). Only 1 LCS exceeded the control limits (Table10-8). Therefore, the laboratory analyses for the project were of acceptable accuracy. Table 10-9 shows the frequency of exceedance and Table 10-10 shows the environmental samples associated with this batch.
Table 10-7 Environmental samples associated with method blank exceedances
Table 10-6 Number of batches with method blank exceedances
Table 10-5 Method blank exceedances
Table 10-4 Holding time exceedances
Table 10-3 Total internal QC batches grouped by analyte
Table 10-8 LCS recovery exceedances
Table 10-9 Frequency of QC batches with LCS recovery exceedances
Table 10-10 Samples with LCS recovery exceedances

MWQI Summary and Findings from Data Collected Oct 2001 through Sep 2003 10-3 Chapter 10 Data Quality Control
Matrix Spike Recovery Matrix spike recoveries indicate the accuracy of recovering a known concentration of substance in a matrix of interest. The results of matrix spike recoveries indicate the accuracy of analysis given the interference peculiar to a given matrix. Matrix spikes are prepared by adding a known concentration of method analytes to an environmental sample with known background concentration. The percent recovery must fall within acceptable limits. During the study period, 6,801 matrix spike recoveries were performed, and 49 (0.7%) exceeded the control limits. The batches with matrix spike recoveries outside the control limits are shown in Table 10-11. The analytes that had matrix spike exceedances were boron, calcium, chromium, Kjeldahl nitrogen, magnesium, phosphorus, sodium, and sulfate. Phosphorus had a frequency of exceedance of 7.1% and sodium 6.3% (Table 10-12). Some of the recoveries were high, but the RPDs and LCS for those batches were within limits; therefore, the batch is considered in control. Recoveries that were lower than the control limits can be attributed to matrix interference, but the LCS for those batches were in control. The analytes with the highest frequency of exceedance were Kjeldahl nitrogen, phosphorus and sodium (Table 10-8). Calcium, Kjeldahl nitrogen and phosphorus were out of recovery limits for both matrix spikes and spike duplicate, which suggests matrix interference. The LCS and RPDs were within limits for all of these analytes; therefore, the batch was considered in control. The low frequency of recoveries outside the control limits for the remaining analytes was considered insignificant to the overall data quality of the project. Therefore, the laboratory analyses were of acceptable accuracy, and matrix interference did not have significant effects on the analyses. The environmental samples in these batches are shown in Table 10-13.
Table 10-13 Samples with matrix spike recovery exceedances
Table 10-12 Frequency of QC batches with matrix spike recovery exceedances
Table 10-11 Matrix spike recovery exceedances

MWQI Summary and Findings from Data Collected Oct 2001 through Sep 2003 10-4 Chapter 10 Data Quality Control
Matrix Spike Duplicates Matrix spike duplicate results indicate the precision of the analytical method in a given matrix. The difference between the duplicate samples is reported as an RPD. This difference is compared against the laboratory’s control limits as a conservative approach to determining precision. During the study period, 3,380 matrix spike duplicates were performed. Six matrix spike duplicate batches exceeded the control limits (0.2%), shown in Table 10-14. The analytes were calcium, Kjeldahl nitrogen, and phosphorus and the frequency of exceedance is shown in Table 10-15. These analytes were out of recovery limits for the matrix spikes as well as the spike duplicates, which suggests matrix interference. The LCS recoveries are within limits for these analytes; therefore the batch is considered in control. The environmental samples are shown in Table 10-16. Sample Duplicates Sample duplicates are environmental samples that are divided into 2 aliquots in the laboratory and analyzed independently to determine the repeatability of the analytical method. The RPD for the duplicate results must fall within the established control limits. During the study period, there were 760 RPD sample duplicate analyses performed, and only 1 sample duplicate (0.1%) exceeded the control limits. The sample duplicate batch outside of the control limits is shown in Table 10-17. The analyte was turbidity and the frequency of exceedance was 0.4% (Table 10-18). These results indicate the laboratory had acceptable precision in its analysis of the project samples. The environmental samples are shown in Table 10-19.
Table 10-16 Samples with matrix spike duplicate exceedances
Table 10-15 Number of matrix spike duplicate recovery exceedances
Table 10-14 Matrix spike duplicate recovery exceedances
Table 10-19 Samples with sample duplicate exceedances
Table 10-17 Sample duplicate exceedances
Table 10-18 Number of sample duplicate exceedances

MWQI Summary and Findings from Data Collected Oct 2001 through Sep 2003 10-5 Chapter 10 Data Quality Control
Chapter 10 Data Quality Control
Tables Table 10-1 Field duplicates .................................................................................................................................... 10-6 Table 10-2 Field blanks exceeding control limits................................................................................................. 10-11 Table 10-3 Total internal QC batches grouped by analyte ................................................................................... 10-12 Table 10-4 Holding time exceedances.................................................................................................................. 10-14 Table 10-5 Method blank exceedances................................................................................................................. 10-15 Table 10-6 Number of batches with method blank exceedances.......................................................................... 10-16 Table 10-7 Environmental samples associated with method blank exceedances ................................................. 10-17 Table 10-8 LCS recovery exceedances................................................................................................................. 10-20 Table 10-9 Frequency of QC batches with LCS recovery exceedances ............................................................... 10-20 Table 10-10 Samples with LCS recovery exceedances ........................................................................................ 10-20 Table 10-11 Matrix spike recovery exceedances.................................................................................................. 10-21 Table 10-12 Frequency of QC batches with matrix spike recovery exceedances................................................. 10-22 Table 10-13 Samples with matrix spike recovery exceedances............................................................................ 10-23 Table 10-14 Matrix spike duplicate recovery exceedances .................................................................................. 10-28 Table 10-15 Number of matrix spike duplicate recovery exceedances ................................................................ 10-28 Table 10-16 Samples with matrix spike duplicate exceedances ........................................................................... 10-29 Table 10-17 Sample duplicate exceedances ......................................................................................................... 10-30 Table 10-18 Number of sample duplicate exceedances........................................................................................ 10-30 Table 10-19 Samples with sample duplicate exceedances.................................................................................... 10-30

MWQI Summary and Findings from Data Collected Oct 2001 through Sep 2003 10-6 Chapter 10 Data Quality Control
Table 10-1 Field duplicates
Analyte Collection
date Sample number
Sample duplicate Result 1 Result 2 RPD % Units RPD limit
Conductance (EC) 9/3/2002 CB0902B0639 CB0902B0643 277 196 34.25% µS/cm 15 Conductance (EC) 11/4/2002 CB1102B0817 CB1102B0820 172 62 94.02% µS/cm 15 Conductance (EC) 5/19/2003 CB0503B0429 CB0503B0431 588 496 16.97% µS/cm 15 Conductance (EC) 8/11/2003 CC0803B0691 CC0803B0693 141 613 125.20% µS/cm 15 Dissolved Ammonia 11/4/2002 CB1102B0817 CB1102B0820 0 0.01 200.00% mg/L as N 20 Dissolved Ammonia 9/2/2003 CB0903B0589 CB0903B0590 0.04 0.03 28.57% mg/L as N 20 Dissolved Boron 10/2/2001 CB1001B1002 CB1001B1004 0 0.1 200.00% mg/L 25 Dissolved Boron 2/5/2002 CB0202B0012 CB0202B0013 0.4 0.3 28.57% mg/L 25 Dissolved Boron 12/3/2002 CB1202B0883 CB1202B0885 0.2 0 200.00% mg/L 25 Dissolved Boron 5/6/2003 CB0503B0400 CB0503B0401 0.1 0 200.00% mg/L 25 Dissolved Bromide 10/15/2001 CB1001B1032 CB1001B1034 0 0.01 200.00% mg/L 20 Dissolved Bromide 11/13/2001 CB1101B1104 CB1101B1107 0.03 0.02 40.00% mg/L 20 Dissolved Bromide 11/19/2001 CB1101B1138 CB1101B1141 0.02 0.03 40.00% mg/L 20 Dissolved Bromide 12/26/2001 CB1201B1276 CB1201B1279 0.02 0.01 66.67% mg/L 20 Dissolved Bromide 12/27/2001 CB1201B1280 CB1201B1282 0.23 0.3 26.42% mg/L 20 Dissolved Bromide 1/7/2002 CC0102B0032 CC0102B0033 0.01 0 200.00% mg/L 20 Dissolved Bromide 2/13/2002 CB0102B0101 CB0102B0104 0.09 0.05 57.14% mg/L 20 Dissolved Bromide 2/19/2002 CB0202B0111 CB0202B0112 0 0.02 200.00% mg/L 20 Dissolved Bromide 5/6/2002 CC0502B1820 CC0502B1821 0.01 0.02 66.67% mg/L 20 Dissolved Bromide 6/3/2002 CB0602B0449 CB0602B0453 0.01 0.02 66.67% mg/L 20 Dissolved Bromide 11/12/2002 CC1102B3651 CC1102B3654 0.02 0.01 66.67% mg/L 20 Dissolved Bromide 12/19/2002 CB1202B0923 CB1202B0926 0.51 0.34 40.00% mg/L 20 Dissolved Bromide 12/30/2002 CC1202B4258 CC1202B4259 0 0.01 200.00% mg/L 20 Dissolved Bromide 1/14/2003 CC0103B0045 CC0103B0048 0.01 0 200.00% mg/L 20 Dissolved Bromide 2/10/2003 CB0203B0096 CB0203B0099 0.04 0.03 28.57% mg/L 20 Dissolved Bromide 4/15/2003 CB0403B0304 CB0403B0307 0.04 0.05 22.22% mg/L 20 Dissolved Bromide 8/11/2003 CC0803B0691 CC0803B0693 0.01 0.25 184.62% mg/L 20 Dissolved Calcium 11/4/2002 CB1102B0817 CB1102B0820 13 5 88.89% mg/L 20 Table 10-1 continued on next page

MWQI Summary and Findings from Data Collected Oct 2001 through Sep 2003 10-7 Chapter 10 Data Quality Control
Analyte Collection
date Sample number
Sample duplicate Result 1 Result 2 RPD % Units RPD limit
Table 10-1 Field duplicates (continued)
Dissolved Chloride 11/4/2002 CB1102B0817 CB1102B0820 5 2 85.71% mg/L 20 Dissolved Chloride 1/6/2003 CC0103B0019 CC0103B0020 5 3 50.00% mg/L 20 Dissolved Magnesium 11/4/2002 CB1102B0817 CB1102B0820 7 3 80.00% mg/L 20 Dissolved Nitrate 11/6/2001 CB1101B1079 CB1101B1081 0.4 0.5 22.22% mg/L 20 Dissolved Nitrate 8/6/2002 CB0802B0584 CB0802B0588 0.1 0 200.00% mg/L 20 Dissolved Nitrate 1/6/2003 CC0103B0019 CC0103B0020 1 0.7 35.29% mg/L 20 Dissolved Nitrate 6/2/2003 CB0603B0452 CB0603B0453 0.4 0.3 28.57% mg/L 20 Dissolved Organic Carbon 12/3/2001 CB1201B1185 CB1201B1189 11.6 4.6 86.42% mg/L as C 30 Dissolved Organic Carbon 3/18/2002 CB0302B0278 CB0302B0280 2 3.3 49.06% mg/L as C 30 Dissolved Organic Carbon 3/19/2002 CB0302B0288 CB0302B0291 5.6 4 33.33% mg/L as C 30 Dissolved Organic Carbon 4/2/2002 CB0402B0349 CB0402B0351 6.7 4.9 31.03% mg/L as C 30 Dissolved Organic Carbon 11/4/2002 CB1102B0817 CB1102B0820 1.8 1.3 32.26% mg/L as C 30 Dissolved Organic Carbon 3/17/2003 CB0303B0195 CB0303B0198 4.5 2.9 43.24% mg/L as C 30 Dissolved Sodium 11/4/2002 CB1102B0817 CB1102B0820 10 2 133.33% mg/L 20 Dissolved Sulfate 11/4/2002 CB1102B0817 CB1102B0820 7 2 111.11% mg/L 20 Dissolved Sulfate 1/6/2003 CC0103B0019 CC0103B0020 7 4 54.55% mg/L 20 Hardness 11/4/2002 CB1102B0817 CB1102B0820 61 21 97.56% mg/L as CaCO3 20 Orthophosphate 11/4/2002 CB1102B0817 CB1102B0820 0.03 0.01 100.00% mg/L as P 20 Orthophosphate 2/3/2003 CB0203B0066 CB0203B0069 0 0.01 200.00% mg/L as P 20 Orthophosphate 3/3/2003 CB0303B0159 CB0303B0161 0.02 0.03 40.00% mg/L as P 20 Orthophosphate 9/2/2003 CB0903B0589 CB0903B0590 0.08 0.06 28.57% mg/L as P 20 pH 4/2/2002 CB0402B0340 CB0402B0343 7.9 6.6 17.93% pH Units 3 pH 7/29/2002 CB0702B0558 CB0702B0559 5.4 6.5 18.49% pH Units 3 pH 8/5/2002 CB0802B0576 CB0802B0579 6.5 6.7 3.03% pH Units 3 pH 11/4/2002 CB1102B0817 CB1102B0820 6.5 6.2 4.72% pH Units 3 pH 11/12/2002 CC1102B3651 CC1102B3654 7.7 6.6 15.38% pH Units 3 pH 11/18/2002 CC1102B3674 CC1102B3675 6.5 6.7 3.03% pH Units 3 pH 11/25/2002 CB1102B0846 CB1102B0849 7.1 6.7 5.80% pH Units 3 Table 10-1 continued on next page

MWQI Summary and Findings from Data Collected Oct 2001 through Sep 2003 10-8 Chapter 10 Data Quality Control
Analyte Collection
date Sample number
Sample duplicate Result 1 Result 2 RPD % Units RPD limit
Table 10-1 Field duplicates (continued)
pH 12/2/2002 CB1202B0873 CB1202B0877 5.4 6.7 21.49% pH Units 3 pH 1/21/2003 CC0103B0073 CC0103B0074 7.5 5.1 38.10% pH Units 3 pH 1/27/2003 CC0103B0084 CC0103B0087 6.4 6.6 3.08% pH Units 3 pH 2/3/2003 CB0203B0066 CB0203B0069 6 6.2 3.28% pH Units 3 pH 2/10/2003 CB0203B0092 CB0203B0095 6.5 6.7 3.03% pH Units 3 pH 6/2/2003 CB0603B0452 CB0603B0453 6.4 6.2 3.17% pH Units 3 pH 6/10/2003 CB0603B0488 CB0603B0489 6.3 5.9 6.56% pH Units 3 pH 6/23/2003 CB0603B0511 CB0603B0513 6 6.2 3.28% pH Units 3 pH 7/21/2003 CC0703B0617 CC0703B0618 5.8 6 3.39% pH Units 3 pH 8/11/2003 CC0803B0691 CC0803B0693 5.8 6.3 8.26% pH Units 3 Total Alkalinity 4/2/2002 CB0402B0340 CB0402B0343 35 30 15.38% mg/L as CaCO3 15 Total Alkalinity 11/4/2002 CB1102B0817 CB1102B0820 75 26 97.03% mg/L as CaCO3 15 Total Alkalinity 1/21/2003 CC0103B0073 CC0103B0074 155 29 136.96% mg/L as CaCO3 15 Total Alkalinity 8/11/2003 CC0803B0691 CC0803B0693 60 102 51.85% mg/L as CaCO3 15 Total Dissolved Solids 9/3/2002 CB0902B0639 CB0902B0643 168 118 34.97% mg/L 15 Total Dissolved Solids 11/4/2002 CB1102B0817 CB1102B0820 105 38 93.71% mg/L 15 Total Kjeldahl Nitrogen 11/4/2002 CB1102B0817 CB1102B0820 0.2 0.1 66.67% mg/L as N 25 Total Kjeldahl Nitrogen 1/6/2003 CC0103B0019 CC0103B0020 0.4 0.3 28.57% mg/L as N 25 Total Kjeldahl Nitrogen 6/2/2003 CB0603B0452 CB0603B0453 0.2 0.3 40.00% mg/L as N 25 Total Kjeldahl Nitrogen 7/7/2003 CC0703B0588 CC0703B0592 0.3 0.4 28.57% mg/L as N 25 Total Organic Carbon 1/14/2002 CC0102B0064 CC0102B0067 3.2 5.2 47.62% mg/L as C 30 Total Organic Carbon 3/12/2002 CB0302B0266 CB0302B0268 7.2 10.1 33.53% mg/L as C 30 Total Organic Carbon 3/19/2002 CB0302B0288 CB0302B0291 7.5 4.6 47.93% mg/L as C 30 Total Organic Carbon 4/2/2002 CB0402B0349 CB0402B0351 9.6 6.7 35.58% mg/L as C 30 Total Organic Carbon 9/3/2002 CB0902B0639 CB0902B0643 6.2 2.4 88.37% mg/L as C 30 Total Organic Carbon 9/4/2002 CB0902B0657 CB0902B0659 3.5 2.4 37.29% mg/L as C 30 Total Organic Carbon 11/4/2002 CB1102B0817 CB1102B0820 2 1.4 35.29% mg/L as C 30 Total Organic Carbon 3/17/2003 CB0303B0195 CB0303B0198 5.3 3.9 30.43% mg/L as C 30 Table 10-1 continued on next page

MWQI Summary and Findings from Data Collected Oct 2001 through Sep 2003 10-9 Chapter 10 Data Quality Control
Analyte Collection
date Sample number
Sample duplicate Result 1 Result 2 RPD % Units RPD limit
Table 10-1 Field duplicates (continued)
Total Phosphorus 11/4/2002 CB1102B0817 CB1102B0820 0.06 0.02 100.00% mg/L 25 Total Phosphorus 11/5/2002 CB1102B0827 CB1102B0829 0.05 0.07 33.33% mg/L 25 Total Phosphorus 2/3/2003 CB0203B0066 CB0203B0069 0 0.01 200.00% mg/L 25 Turbidity 10/1/2001 CB1001B0993 CB1001B0996 0 1 200.00% N.T.U. 15 Turbidity 10/29/2001 CB1001B1068 CB1001B1070 5 4 22.22% N.T.U. 15 Turbidity 11/5/2001 CC1101B0790 CC1101B0792 5 6 18.18% N.T.U. 15 Turbidity 11/13/2001 CB1101B1104 CB1101B1107 17 13 26.67% N.T.U. 15 Turbidity 11/19/2001 CB1101B1138 CB1101B1141 17 14 19.35% N.T.U. 15 Turbidity 11/26/2001 CB1101B1159 CB1101B1161 1 2 66.67% N.T.U. 15 Turbidity 12/3/2001 CB1201B1185 CB1201B1189 140 107 26.72% N.T.U. 15 Turbidity 12/27/2001 CB1201B1280 CB1201B1282 13 11 16.67% N.T.U. 15 Turbidity 1/7/2002 CC0102B0032 CC0102B0033 110 134 19.67% N.T.U. 15 Turbidity 2/20/2002 CB0202B0199 CB0202B0202 6 8 28.57% N.T.U. 15 Turbidity 2/26/2002 CB0202B0213 CB0202B0216 10 12 18.18% N.T.U. 15 Turbidity 3/18/2002 CB0302B0278 CB0302B0280 3 2 40.00% N.T.U. 15 Turbidity 3/26/2002 CB0302B0316 CB0302B0319 12 10 18.18% N.T.U. 15 Turbidity 4/15/2002 CB0402B0393 CB0402B0395 1 2 66.67% N.T.U. 15 Turbidity 4/16/2002 CB0402B0397 CB0402B0399 10 21 70.97% N.T.U. 15 Turbidity 4/23/2002 CB0402B0419 CB0402B0422 20 12 50.00% N.T.U. 15 Turbidity 4/29/2002 CB0402B0441 CB0402B0443 2 1 66.67% N.T.U. 15 Turbidity 6/17/2002 CC0602B1926 CC0602B1927 6 7 15.38% N.T.U. 15 Turbidity 7/1/2002 CC0702B2047 CC0702B2051 11 7 44.44% N.T.U. 15 Turbidity 8/12/2002 CB0802B0615 CB0802B0616 6 7 15.38% N.T.U. 15 Turbidity 8/26/2002 CB0802B0636 CB0802B0637 11 8 31.58% N.T.U. 15 Turbidity 9/9/2002 CB0902B0680 CB0902B0681 5 6 18.18% N.T.U. 15 Turbidity 9/16/2002 CB0902B0698 CB0902B0699 5 9 57.14% N.T.U. 15 Turbidity 9/30/2002 CC0902B3322 CC0902B3323 8 6 28.57% N.T.U. 15 Turbidity 10/8/2002 CB1002B0725 CB1002B0727 5 13 88.89% N.T.U. 15 Table 10-1 continued on next page

MWQI Summary and Findings from Data Collected Oct 2001 through Sep 2003 10-10 Chapter 10 Data Quality Control
Analyte Collection
date Sample number
Sample duplicate Result 1 Result 2 RPD % Units RPD limit
Table 10-1 Field duplicates (continued)
Turbidity 10/15/2002 CB1002B0733 CB1002B0734 3 5 50.00% N.T.U. 15 Turbidity 10/21/2002 CB1002B0751 CB1002B0753 36 25 36.07% N.T.U. 15 Turbidity 10/28/2002 CB1002B0793 CB1002B0794 2 3 40.00% N.T.U. 15 Turbidity 11/4/2002 CB1102B0817 CB1102B0820 4 1 120.00% N.T.U. 15 Turbidity 11/18/2002 CC1102B3674 CC1102B3675 6 5 18.18% N.T.U. 15 Turbidity 11/19/2002 CC1102B3678 CC1102B3680 5 6 18.18% N.T.U. 15 Turbidity 11/26/2002 CB1102B0850 CB1102B0852 7 6 15.38% N.T.U. 15 Turbidity 12/3/2002 CB1202B0883 CB1202B0885 5 6 18.18% N.T.U. 15 Turbidity 12/10/2002 CB1202B0904 CB1202B0907 3 4 28.57% N.T.U. 15 Turbidity 2/3/2003 CB0203B0066 CB0203B0069 2 3 40.00% N.T.U. 15 Turbidity 2/10/2003 CB0203B0096 CB0203B0099 11 9 20.00% N.T.U. 15 Turbidity 3/24/2003 CB0303B0262 CB0303B0263 14 11 24.00% N.T.U. 15 Turbidity 4/1/2003 CB0403B0362 CB0403B0363 13 16 20.69% N.T.U. 15 Turbidity 4/15/2003 CB0403B0304 CB0403B0307 6 7 15.38% N.T.U. 15 Turbidity 4/21/2003 CB0403B0329 CB0403B0330 21 25 17.39% N.T.U. 15 Turbidity 6/10/2003 CB0603B0488 CB0603B0489 13 11 16.67% N.T.U. 15 Turbidity 7/28/2003 CC0703B0629 CC0703B0630 10 12 18.18% N.T.U. 15 Turbidity 8/11/2003 CC0803B0691 CC0803B0693 9 25 94.12% N.T.U. 15 UV Absorbance @254nm 7/29/2002 CB0702B0558 CB0702B0559 0.055 0.034 47.19% absorbance/cm 10 UV Absorbance @254nm 10/28/2002 CB1002B0793 CB1002B0794 0.028 0.038 30.30% absorbance/cm 10 UV Absorbance @254nm 11/4/2002 CB1102B0817 CB1102B0820 0.05 0.028 56.41% absorbance/cm 10 UV Absorbance @254nm 8/11/2003 CC0803B0691 CC0803B0693 0.042 0.089 71.76% absorbance/cm 10

MWQI Summary and Findings from Data Collected Oct 2001 through Sep 2003 10-11 Chapter 10 Data Quality Control
Table 10-2 Field blanks exceeding control limits Analyte Collection date Sample number Result Reporting limit Units
Dissolved Organic Carbon 10/25/2002 11:06 CC1002B3648 0.9 0.1 mg/L as C Dissolved Organic Carbon 10/25/2002 11:07 CC1002B3649 0.2 0.1 mg/L as C Dissolved Organic Carbon 11/8/2002 11:00 CC1102B4051 0.2 0.1 mg/L as C Orthophosphate 2/3/2003 10:40 CB0203B0084 0.03 0.01 mg/L as P Total Organic Carbon 10/25/2002 11:03 CC1002B3647 0.2 0.1 mg/L as C Total Organic Carbon 11/8/2002 11:00 CC1102B4050 0.2 0.1 mg/L as C Total Organic Carbon 11/8/2002 11:00 CC1102B4049 0.2 0.1 mg/L as C Total Phosphorus 6/2/2003 13:10 CB0603B0461 0.04 0.01 mg/L Total Phosphorus 6/4/2003 11:20 CB0603B0470 0.05 0.01 mg/L

MWQI Summary and Findings from Data Collected Oct 2001 through Sep 2003 10-12 Chapter 10 Data Quality Control
Table 10-3 Total internal QC batches grouped by analyte
Analyte Method LCS
recovery RPD-LCS duplicate Matrix spike
RPD- Matrix spike duplicate
Method blank
RPD sample
duplicate Minor elements
Aluminum EPA 200.8 (D) 106 53 172 86 53 Arsenic EPA 200.8 (D) 106 53 160 80 53 Barium EPA 200.8 (D) 84 42 140 70 42 Boron EPA 200.8 (D) 152 74 290 140 87 Cadmium EPA 200.8 (D) 66 33 122 61 33 Chromium EPA 200.8 (D) 72 36 130 65 36 Copper EPA 200.8 (D) 106 53 174 87 53 Iron EPA 200.8 (D) 106 53 174 87 53 Lead EPA 200.8 (D) 70 35 124 62 35 Manganese EPA 200.8 (D) 106 53 160 80 53 Nickel EPA 200.8 (D) 60 30 94 47 30 Selenium EPA 200.8 (D) 92 46 112 56 46 silver EPA 200.8 (D) 66 33 122 61 33 Zinc EPA 200.8 (D) 68 34 124 62 34 Bromide EPA 300.0 28d Hold 297 148 696 352 165
Organic carbon Dissolved Organic Carbon (DOC) EPA 415.1 (D) Ox 288 143 144 13 Dissolved Organic Carbon (DOC) 212 104 106 3 Total Organic Carbon (TOC) EPA 415.1 (T) Ox 296 144 148 Total Organic Carbon (TOC) EPA 415_1 (T) Cmbst 246 123 123 UV Absorbance @254nm Std Method 5910B 136 67 129 160
EC and salts Conductance (EC) Std Method 2510-B 125 20 Calcium EPA 200.7 (D) 152 74 300 144 87 Magnesium EPA 200.7 (D) 152 74 300 144 87 Chloride Std Method 4500-Cl-E 319 159 1062 532 159
Table 10-3 continued on next page

MWQI Summary and Findings from Data Collected Oct 2001 through Sep 2003 10-13 Chapter 10 Data Quality Control
Analyte Method LCS
recovery RPD-LCS duplicate Matrix spike
RPD- Matrix spike duplicate
Method blank
RPD sample
duplicate Table 10-3 Total internal QC batches grouped by analyte (continued)
Sulfate EPA 300.0 28 day 309 154 972 487 154 Sodium 200.7 ICP 152 74 300 144 87
Nutrients Nitrate Std Method 4500-NO3-F or EPA 353.2 28 day 114 56 168 84 56 Ammonia Std Method 4500-NH3 or
EPA 350.1
166 82 215 106 80
Kjeldahl nitrogen EPA 351.2 134 67 80 40 66 Orthophosphate 161 80 116 58 79 Phosphorus EPA 365.4 134 67 98 49 67
Miscellaneous pH pH - Std Method 2320 B 58 pH Std Method 5910 B 30 Hardness Std Method 2340 B Alkalinity Std Method 2320 B 246 121 396 196 123 Methyl tert-butyl ether (MTBE)
Turbidity Turbidity EPA 180.1 EPA 180.1 306 147 294 233 Turbidity Std Method 2130 B Total Suspended Solids (TSS) EPA 160.2 174 Solids (TDS) Std Method 2540-C 127
Total 5080 2512 6801 3380 2978 760 LCS LCS dup MS MS dup MB Sample
dup

MWQI Summary and Findings from Data Collected Oct 2001 through Sep 2003 10-14 Chapter 10 Data Quality Control
Table 10-4 Holding time exceedances
Analyte Collection
date Sample number Holding
time Limit Chromium, Hexavalent by Ion Chromatography 5/15/2002 DZ0502B7522 25 hours 24 Chromium, Hexavalent by Ion Chromatography 7/17/2002 DZ0702B0631 50 hours 24 Chromium, Hexavalent by Ion Chromatography 7/17/2002 DZ0702B0634 45 hours 24 Chromium, Hexavalent by Ion Chromatography 8/21/2002 DZ0802B2698 25 hours 24 Chromium, Hexavalent by Ion Chromatography 8/21/2002 DZ0802B2706 25 hours 24 Orthophosphate (Dissolved) 1/7/2002 CC0102B0034 164 hours 48 Orthophosphate (Dissolved) 1/2/2002 CC0102B0098 286 hours 48 Orthophosphate (Dissolved) 7/17/2002 DZ0702B0631 76 hours 48 Orthophosphate (Dissolved) 7/17/2002 DZ0702B0634 71 hours 48 UVA 10/29/2001 CB1001B1068 16 days 14 UVA 10/29/2001 CB1001B1069 16 days 14 UVA 10/29/2001 CB1001B1070 16 days 14

MWQI Summary and Findings from Data Collected Oct 2001 through Sep 2003 10-15 Chapter 10 Data Quality Control
Table 10-5 Method blank exceedances Analyte Method Batch number Result Reporting limit Units
DOC EPA 415.1 (D) Ox BL02B10636 0.11 0.1 mg/L as C DOC EPA 415.1 (D) Ox BL02B12647 0.16 0.1 mg/L as C DOC EPA 415.1 (D) Ox BL01B9475 0.15 0.1 mg/L as C DOC EPA 415.1 (D) Ox BL02B10066 0.2 0.1 mg/L as C DOC EPA 415.1 (D) Ox BL02B12541 0.46 0.1 mg/L as C DOC EPA 415.1 (D) Ox BL02B12602 0.18 0.1 mg/L as C DOC EPA 415.1 (D) Cmbst BL02B11049 0.6 0.5 mg/L as C DOC EPA 415.1 (D) Cmbst BL02B11073 0.7 0.5 mg/L as C TOC EPA 415.1 (T) Ox BL02B10637 0.11 0.1 mg/L as C TOC EPA 415.1 (T) Ox BL02B12648 0.16 0.1 mg/L as C TOC EPA 415.1 (T) Ox BL01B9476 0.15 0.1 mg/L as C TOC EPA 415.1 (T) Ox BL01B9605 0.2 0.1 mg/L as C TOC EPA 415.1 (T) Ox BL02B10067 0.2 0.1 mg/L as C TOC EPA 415.1 (T) Ox BL02B12542 0.46 0.1 mg/L as C TOC EPA 415.1 (T) Ox BL02B12603 0.18 0.1 mg/L as C TOC EPA 415.1 (T) Cmbst BL02B11048 0.6 0.5 mg/L as C TOC EPA 415.1 (T) Cmbst BL02B11072 0.7 0.5 mg/L as C

MWQI Summary and Findings from Data Collected Oct 2001 through Sep 2003 10-16 Chapter 10 Data Quality Control
Table 10-6 Number of batches with method blank exceedances
Analyte Method Total batches Batches with method blanks out of limits
Frequency of samples out of limits (%)
DOC EPA 415.1 (D) Ox 144 6 4.2 DOC EPA 415.1 (D) Cmbst 106 2 1.9 TOC EPA 415.1 (T) Ox 148 7 4.7 TOC EPA 415.1 (T) Cmbst 123 2 1.6

MWQI Summary and Findings from Data Collected Oct 2001 through Sep 2003 10-17 Chapter 10 Data Quality Control
Table 10-7 Environmental samples associated with method blank exceedances Analyte Method Batch number Sample number Collection date
DOC EPA 415.1 (D) Ox BL01B9475 CB1001B1069 10/29/2001 DOC EPA 415.1 (D) Ox BL01B9475 CB1001B1070 10/29/2001 DOC EPA 415.1 (D) Ox BL01B9475 CB1001B1037 10/22/2001 DOC EPA 415.1 (D) Ox BL01B9475 CB1001B1068 10/29/2001 DOC EPA 415.1 (D) Ox BL01B9475 CB1001B1037 10/22/2001 DOC EPA 415.1 (D) Ox BL01B9475 CB1001B1069 10/29/2001 DOC EPA 415.1 (D) Ox BL02B10636 CB0402B0415 4/22/2002 DOC EPA 415.1 (D) Ox BL02B10636 CB0402B0416 4/22/2002 DOC EPA 415.1 (D) Ox BL02B10636 CB0402B0418 4/22/2002 DOC EPA 415.1 (D) Ox BL02B10066 CB0202B0089 2/11/2002 DOC EPA 415.1 (D) Ox BL02B10066 CB0202B0090 2/11/2002 DOC EPA 415.1 (D) Ox BL02B10066 CB0202B0091 2/11/2002 DOC EPA 415.1 (D) Ox BL02B10066 CB0202B0092 2/11/2002 DOC EPA 415.1 (D) Ox BL02B12541 CB1202B0888 12/3/2002 DOC EPA 415.1 (D) Ox BL02B12541 CB1202B0900 12/9/2002 DOC EPA 415.1 (D) Ox BL02B12541 CB1202B0901 12/9/2002 DOC EPA 415.1 (D) Ox BL02B12541 CB1202B0902 12/9/2002 DOC EPA 415.1 (D) Ox BL02B12541 CB1202B0903 12/9/2002 DOC EPA 415.1 (D) Ox BL02B12541 CB1202B0904 12/10/2002 DOC EPA 415.1 (D) Ox BL02B12541 CB1202B0905 12/10/2002 DOC EPA 415.1 (D) Ox BL02B12541 CB1202B0906 12/10/2002 DOC EPA 415.1 (D) Ox BL02B12541 CB1202B0907 12/10/2002 DOC EPA 415.1 (D) Ox BL02B12602 DZ1202B0259 12/18/2002 DOC EPA 415.1 (D) Ox BL02B12602 SLA1202B0236 12/18/2002 DOC EPA 415.1 (D) Ox BL02B12602 DZ1202B0262 12/18/2002 DOC EPA 415.1 (D) Ox BL02B12647 CB1202B0918 12/16/2002 DOC EPA 415.1 (D) Ox BL02B12647 CB1202B0915 12/16/2002 DOC EPA 415.1 (D) Ox BL02B12647 CB1202B0916 12/16/2002 DOC EPA 415.1 (D) Ox BL02B12647 CB1202B0917 12/16/2002 DOC EPA 415.1 (D) Ox BL02B12647 CB1202B0923 12/19/2002 DOC EPA 415.1 (D) Ox BL02B12647 CB1202B0924 12/19/2002 DOC EPA 415.1 (D) Ox BL02B12647 CB1202B0925 12/19/2002 DOC EPA 415.1 (D) Ox BL02B12647 CB1202B0926 12/19/2002 DOC EPA 415.1 (D) Ox BL02B12647 CC1202B4231 12/16/2002 DOC EPA 415.1 (D) Cmbst BL02B11049 CC0502B1867 5/28/2002 DOC EPA 415.1 (D) Cmbst BL02B11049 CC0502B1868 5/28/2002 DOC EPA 415.1 (D) Cmbst BL02B11049 CC0502B1869 5/28/2002 DOC EPA 415.1 (D) Cmbst BL02B11049 CB0602B0449 6/3/2002 DOC EPA 415.1 (D) Cmbst BL02B11049 CB0602B0450 6/3/2002 DOC EPA 415.1 (D) Cmbst BL02B11049 CB0602B0451 6/3/2002 DOC EPA 415.1 (D) Cmbst BL02B11049 CB0602B0452 6/3/2002 Table 10-7 continued on next page

MWQI Summary and Findings from Data Collected Oct 2001 through Sep 2003 10-18 Chapter 10 Data Quality Control
Analyte Method Batch number Sample number Collection date Table 10-7 Environmental samples associated with method blank exceedances (continued) DOC EPA 415.1 (D) Cmbst BL02B11049 CB0602B0453 6/3/2002 DOC EPA 415.1 (D) Cmbst BL02B11073 CB0602B0459 6/4/2002 DOC EPA 415.1 (D) Cmbst BL02B11073 CB0602B0460 6/4/2002 DOC EPA 415.1 (D) Cmbst BL02B11073 CB0602B0461 6/4/2002 DOC EPA 415.1 (D) Cmbst BL02B11073 CB0602B0462 6/4/2002 DOC EPA 415.1 (D) Cmbst BL02B11073 CB0602B0458 6/4/2002 DOC EPA 415.1 (D) Cmbst BL02B11073 CB0602B0463 6/5/2002 TOC EPA 415.1 (T) Ox BL01B9476 CB1001B1068 10/29/2001 TOC EPA 415.1 (T) Ox BL01B9476 CB1001B1069 10/29/2001 TOC EPA 415.1 (T) Ox BL01B9476 CB1001B1070 10/29/2001 TOC EPA 415.1 (T) Ox BL01B9476 CB1001B1037 10/22/2001 TOC EPA 415.1 (T) Ox BL01B9476 CB1001B1037 10/22/2001 TOC EPA 415.1 (T) Ox BL01B9476 CB1001B1069 10/29/2001 TOC EPA 415.1 (T) Ox BL01B9476 CB1001B1069 10/29/2001 TOC EPA 415.1 (T) Ox BL01B9476 CB1001B1069 10/29/2001 TOC EPA 415.1 (T) Ox BL01B9605 CC1101B0918 11/7/2001 TOC EPA 415.1 (T) Ox BL01B9605 CC1101B0919 11/7/2001 TOC EPA 415.1 (T) Ox BL01B9605 CC1101B0920 11/7/2001 TOC EPA 415.1 (T) Ox BL01B9605 CC1101B0921 11/7/2001 TOC EPA 415.1 (T) Ox BL01B9605 CC1101B0922 11/7/2001 TOC EPA 415.1 (T) Ox BL01B9605 CC1101B0923 11/7/2001 TOC EPA 415.1 (T) Ox BL01B9605 CC1101B0924 11/7/2001 TOC EPA 415.1 (T) Ox BL01B9605 CC1101B0925 11/7/2001 TOC EPA 415.1 (T) Ox BL01B9605 CC1101B0926 11/7/2001 TOC EPA 415.1 (T) Ox BL01B9605 CC1101B0927 11/7/2001 TOC EPA 415.1 (T) Ox BL01B9605 CC1101B0928 11/7/2001 TOC EPA 415.1 (T) Ox BL02B10067 CC0202B0862 2/7/2002 TOC EPA 415.1 (T) Ox BL02B10067 CC0202B0863 2/7/2002 TOC EPA 415.1 (T) Ox BL02B10067 CC0202B0864 2/7/2002 TOC EPA 415.1 (T) Ox BL02B10067 CC0202B0865 2/7/2002 TOC EPA 415.1 (T) Ox BL02B10067 CC0202B0866 2/7/2002 TOC EPA 415.1 (T) Ox BL02B10067 CC0202B0867 2/7/2002 TOC EPA 415.1 (T) Ox BL02B10067 CC0202B0868 2/7/2002 TOC EPA 415.1 (T) Ox BL02B10067 CC0202B0869 2/7/2002 TOC EPA 415.1 (T) Ox BL02B10067 CC0202B0870 2/7/2002 TOC EPA 415.1 (T) Ox BL02B10067 CC0202B0871 2/7/2002 TOC EPA 415.1 (T) Ox BL02B10067 CC0202B0872 2/7/2002 TOC EPA 415.1 (T) Ox BL02B10067 CB0202B0089 2/11/2002 TOC EPA 415.1 (T) Ox BL02B10067 CB0202B0090 2/11/2002 TOC EPA 415.1 (T) Ox BL02B10067 CB0202B0091 2/11/2002 TOC EPA 415.1 (T) Ox BL02B10067 CB0202B0092 2/11/2002 Table 10-7 continued on next page

MWQI Summary and Findings from Data Collected Oct 2001 through Sep 2003 10-19 Chapter 10 Data Quality Control
Analyte Method Batch number Sample number Collection date Table 10-7 Environmental samples associated with method blank exceedances (continued) TOC EPA 415.1 (T) Ox BL02B10637 CB0402B0415 4/22/2002 TOC EPA 415.1 (T) Ox BL02B10637 CB0402B0416 4/22/2002 TOC EPA 415.1 (T) Ox BL02B10637 CB0402B0418 4/22/2002 TOC EPA 415.1 (T) Ox BL02B12542 CB1202B0888 12/3/2002 TOC EPA 415.1 (T) Ox BL02B12542 CB1202B0900 12/9/2002 TOC EPA 415.1 (T) Ox BL02B12542 CB1202B0901 12/9/2002 TOC EPA 415.1 (T) Ox BL02B12542 CB1202B0902 12/9/2002 TOC EPA 415.1 (T) Ox BL02B12542 CB1202B0903 12/9/2002 TOC EPA 415.1 (T) Ox BL02B12542 CB1202B0904 12/10/2002 TOC EPA 415.1 (T) Ox BL02B12542 CB1202B0905 12/10/2002 TOC EPA 415.1 (T) Ox BL02B12542 CB1202B0906 12/10/2002 TOC EPA 415.1 (T) Ox BL02B12542 CB1202B0907 12/10/2002 TOC EPA 415.1 (T) Ox BL02B12603 DZ1202B0259 12/18/2002 TOC EPA 415.1 (T) Ox BL02B12603 DZ1202B0262 12/18/2002 TOC EPA 415.1 (T) Ox BL02B12603 SLA1202B0236 12/18/2002 TOC EPA 415.1 (T) Ox BL02B12648 CB1202B0917 12/16/2002 TOC EPA 415.1 (T) Ox BL02B12648 CB1202B0918 12/16/2002 TOC EPA 415.1 (T) Ox BL02B12648 CB1202B0915 12/16/2002 TOC EPA 415.1 (T) Ox BL02B12648 CB1202B0916 12/16/2002 TOC EPA 415.1 (T) Ox BL02B12648 CB1202B0923 12/19/2002 TOC EPA 415.1 (T) Ox BL02B12648 CB1202B0924 12/19/2002 TOC EPA 415.1 (T) Ox BL02B12648 CB1202B0925 12/19/2002 TOC EPA 415.1 (T) Ox BL02B12648 CB1202B0926 12/19/2002 TOC EPA 415.1 (T) Cmbst BL02B11048 CC0502B1867 5/28/2002 TOC EPA 415.1 (T) Cmbst BL02B11048 CC0502B1868 5/28/2002 TOC EPA 415.1 (T) Cmbst BL02B11048 CC0502B1869 5/28/2002 TOC EPA 415.1 (T) Cmbst BL02B11048 CB0602B0449 6/3/2002 TOC EPA 415.1 (T) Cmbst BL02B11048 CB0602B0450 6/3/2002 TOC EPA 415.1 (T) Cmbst BL02B11048 CB0602B0451 6/3/2002 TOC EPA 415.1 (T) Cmbst BL02B11048 CB0602B0452 6/3/2002 TOC EPA 415.1 (T) Cmbst BL02B11048 CB0602B0453 6/3/2002 TOC EPA 415.1 (T) Cmbst BL02B11072 CB0602B0460 6/4/2002 TOC EPA 415.1 (T) Cmbst BL02B11072 CB0602B0461 6/4/2002 TOC EPA 415.1 (T) Cmbst BL02B11072 CB0602B0462 6/4/2002 TOC EPA 415.1 (T) Cmbst BL02B11072 CB0602B0458 6/4/2002 TOC EPA 415.1 (T) Cmbst BL02B11072 CB0602B0459 6/4/2002 TOC EPA 415.1 (T) Cmbst BL02B11072 CB0602B0463 6/5/2002

MWQI Summary and Findings from Data Collected Oct 2001 through Sep 2003 10-20 Chapter 10 Data Quality Control
Table 10-8 LCS recovery exceedances Analyte Method Batch number Recovery (%) Control limits (%)
Kjeldahl nitrogen EPA 351.2 BL02B9841 124 80-120
Table 10-9 Frequency of QC batches with LCS recovery exceedances
Analyte Total laboratory control
samples LCS recoveries
out of limits
Frequency of samples
out of limits (%) Kjeldahl nitrogen 134 1 0.75
Table 10-10 Samples with LCS recovery exceedances
Analyte Method Batch
number Sample number Collection
date Kjeldahl nitrogen EPA 351.2 BL02B9841 CC0102B0098 1/2/2002

MWQI Summary and Findings from Data Collected Oct 2001 through Sep 2003 10-21 Chapter 10 Data Quality Control
Table 10-11 Matrix spike recovery exceedances Analyte Method Batch number Recovery (%) Control limits (%)
Boron EPA 200.7 (D) BL02B12193 128.7 80–120 Calcium EPA 200.7 (D) BL01B9580 70.7 80–120 Calcium EPA 200.7 (D) BL02B12193 129.3 80–120 Calcium EPA 200.7 (D) BL02B12193 128.3 80–120 Calcium EPA 200.7 (D) BL02B12275 120.9 80–120 Calcium EPA 200.7 (D) BL02B9810 135.77 80–120 Calcium EPA 200.7 (D) BL02B9810 132.77 80–120 Calcium EPA 200.7 (D) BL03B14698 130 80–120 Chromium, hexavalent (Cr6+) EPA 218.6 BL01B9383 80.6 85–115 Chromium, hexavalent (Cr6+) EPA 218.6 BL01B9383 83 85–115 Kjeldahl Nitrogen EPA 351.2 BL01B9460 147.25 70–130 Kjeldahl Nitrogen EPA 351.2 BL01B9460 149.5 70–130 Kjeldahl Nitrogen EPA 351.2 BL03B14019 138.5 70–130 Kjeldahl Nitrogen EPA 351.2 BL02B9901 52.13 70–130 Magnesium EPA 200.7 (D) BL02B12275 79.6 80–120 Magnesium EPA 200.7 (D) BL02B12275 79.6 80–120 Magnesium EPA 200.7 (D) BL02B9810 126.54 80–120 Phosphorus EPA 365.4 BL02B10072 79 80.7–120.7 Phosphorus EPA 365.4 BL02B10072 74 80.7–120.7 Phosphorus EPA 365.4 BL02B10431 39 80.7–120.7 Phosphorus EPA 365.4 BL02B10431 42 80.7–120.7 Phosphorus EPA 365.4 BL03B14018 125 80.7–120.7 Phosphorus EPA 365.4 BL02B9900 52 80.7–120.7 Phosphorus EPA 365.4 BL02B9900 133 80.7–120.7 Sodium EPA 200.7 (D) BL01B9580 70.88 80–120 Sodium EPA 200.7 (D) BL02B10000 121 80–120 Sodium EPA 200.7 (D) BL02B10615 123.3 80–120 Sodium EPA 200.7 (D) BL02B11132 77.3 80–120 Sodium EPA 200.7 (D) BL02B11768 75 80–120 Sodium EPA 200.7 (D) BL02B11768 79 80–120 Sodium EPA 200.7 (D) BL02B12193 135.9 80–120 Sodium EPA 200.7 (D) BL02B12193 120.9 80–120 Sodium EPA 200.7 (D) BL02B12196 72.9 80–120 Sodium EPA 200.7 (D) BL02B12275 70 80–120 Sodium EPA 200.7 (D) BL02B12513 40 80–120 Sodium EPA 200.7 (D) BL02B12513 50 80–120 Sodium EPA 200.7 (D) BL02B9810 129.85 80–120 Sodium EPA 200.7 (D) BL02B9810 122.85 80–120 Sodium EPA 200.7 (D) BL02B12513 172.9 80–120 Sodium EPA 200.7 (D) BL03B13176 142.9 80–120 Table 10-11 continued on next page

MWQI Summary and Findings from Data Collected Oct 2001 through Sep 2003 10-22 Chapter 10 Data Quality Control
Analyte Method Batch number Recovery (%) Control limits (%) Table 10-11 Matrix spike recovery exceedances (continued) Sodium EPA 200.7 (D) BL03B13270 149.5 80–120 Sodium EPA 200.7 (D) BL03B13270 69.5 80–120 Sodium EPA 200.7 (D) BL03B13720 72.4 80–120 Sulfate EPA 300.0 28d Hold BL02B11412 127.88 80–120 Sulfate EPA 300.0 28d Hold BL02B11412 127.88 80–120 Sulfate EPA 300.0 28d Hold BL03B13681 160.8 80–120 Sulfate EPA 300.0 28d Hold BL03B13681 160.8 80–120 Sulfate EPA 300.0 28d Hold BL03B14318 122.1 80–120 Sulfate EPA 300.0 28d Hold BL03B14318 123 80–120
Table 10-12 Frequency of QC batches with matrix spike recovery exceedances
Analyte Total matrix
spikes Matrix spike
recoveries out of limits Frequency of samples
out of limits (%) Boron 290 1 0.34 Calcium 300 7 2.3 Chromium 130 2 1.5 Kjeldahl Nitrogen 80 4 5 Magnesium 300 3 1 Phosphorus 98 7 7.1 Sodium 300 19 6.3 Sulfate 972 6 0.6

MWQI Summary and Findings from Data Collected Oct 2001 through Sep 2003 10-23 Chapter 10 Data Quality Control
Table 10-13 Samples with matrix spike recovery exceedances Analyte Method Batch number Sample number Collection date
Boron EPA 200.8 (D) BL02B12193 CC0902B3419 9/26/2002 11:00 Calcium EPA 200.8 (D) BL02B9810 CB1201B1210 12/3/2001 12:15 Calcium EPA 200.8 (D) BL02B9810 CB1201B1193 12/3/2001 15:15 Calcium EPA 200.8 (D) BL02B9810 CB1201B1192 12/3/2001 13:55 Calcium EPA 200.8 (D) BL02B9810 CB1201B1212 12/3/2001 12:15 Calcium EPA 200.8 (D) BL02B9810 CB1201B1187 12/3/2001 10:50 Calcium EPA 200.8 (D) BL02B9810 CB1201B1213 12/3/2001 13:00 Calcium EPA 200.8 (D) BL02B9810 CB1201B1211 12/3/2001 11:00 Calcium EPA 200.8 (D) BL02B9810 CB1201B1186 12/3/2001 10:05 Calcium EPA 200.8 (D) BL02B9810 CB1201B1189 12/3/2001 9:20 Calcium EPA 200.8 (D) BL02B9810 CB1201B1194 12/3/2001 13:55 Calcium EPA 200.8 (D) BL02B9810 CB1201B1188 12/3/2001 11:40 Calcium EPA 200.8 (D) BL02B9810 CB1201B1185 12/3/2001 13:10 Calcium EPA 200.8 (D) BL01B9580 CB1101B1181 11/13/2001 13:45 Calcium EPA 200.8 (D) BL01B9580 DZ1101B0889 11/14/2001 10:00 Calcium EPA 200.8 (D) BL01B9580 DZ1101B0892 11/14/2001 12:40 Calcium EPA 200.8 (D) BL01B9580 SLA1101B0838 11/14/2001 10:00 Calcium EPA 200.8 (D) BL02B12193 CC0902B3419 9/26/2002 11:00 Calcium EPA 200.8 (D) BL02B12275 CB1102B0830 11/5/2002 14:10 Calcium EPA 200.8 (D) BL02B12275 CB1102B0827 11/5/2002 12:05 Calcium EPA 200.8 (D) BL02B12275 CB1102B0819 11/4/2002 13:00 Calcium EPA 200.8 (D) BL02B12275 CB1102B0832 11/6/2002 10:50 Calcium EPA 200.8 (D) BL02B12275 CB1102B0831 11/5/2002 13:10 Calcium EPA 200.8 (D) BL02B12275 CB1102B0829 11/5/2002 12:05 Calcium EPA 200.8 (D) BL02B12275 CB1102B0821 11/4/2002 9:40 Calcium EPA 200.8 (D) BL02B12275 CB1102B0818 11/4/2002 10:45 Calcium EPA 200.8 (D) BL02B12275 CB1102B0817 11/4/2002 9:40 Calcium EPA 200.8 (D) BL02B12275 CB1102B0818 11/4/2002 10:45 Calcium EPA 200.8 (D) BL02B12275 CB1102B0817 11/4/2002 9:40 Calcium EPA 200.8 (D) BL02B12275 CB1102B0820 11/4/2002 12:10 Calcium EPA 200.8 (D) BL02B12275 CB1102B0828 11/5/2002 10:45 Calcium EPA 200.8 (D) BL03B14698 CB0903B0591 9/10/2003 9:30 Chromium, hexavalent (Cr6+)
EPA 218.6 BL01B9383 DZ1001B0742 10/17/2001 14:35
Chromium, hexavalent (Cr6+)
EPA 218.6 BL01B9383 DZ1001B0739 10/17/2001 7:45
Kjeldahl Nitrogen EPA 351.2 BL01B9460 DZ1001B0739 10/17/2001 7:45 Kjeldahl Nitrogen EPA 351.2 BL01B9460 DZ1001B0742 10/17/2001 14:35 Kjeldahl Nitrogen EPA 351.2 BL02B9901 CC0102B0034 1/7/2002 14:25 Magnesium EPA 200.7 (D) BL02B12275 CB1102B0828 11/5/2002 10:45 Table 10-13 continued on next page

MWQI Summary and Findings from Data Collected Oct 2001 through Sep 2003 10-24 Chapter 10 Data Quality Control
Analyte Method Batch number Sample number Collection date Table 10-13 Samples with matrix spike recovery exceedances (continued)
Magnesium EPA 200.7 (D) BL02B12275 CB1102B0821 11/4/2002 9:40 Magnesium EPA 200.7 (D) BL02B12275 CB1102B0829 11/5/2002 12:05 Magnesium EPA 200.7 (D) BL02B12275 CB1102B0830 11/5/2002 14:10 Magnesium EPA 200.7 (D) BL02B12275 CB1102B0827 11/5/2002 12:05 Magnesium EPA 200.7 (D) BL02B12275 CB1102B0832 11/6/2002 10:50 Magnesium EPA 200.7 (D) BL02B12275 CB1102B0819 11/4/2002 13:00 Magnesium EPA 200.7 (D) BL02B12275 CB1102B0818 11/4/2002 10:45 Magnesium EPA 200.7 (D) BL02B12275 CB1102B0817 11/4/2002 9:40 Magnesium EPA 200.7 (D) BL02B12275 CB1102B0831 11/5/2002 13:10 Magnesium EPA 200.7 (D) BL02B12275 CB1102B0820 11/4/2002 12:10 Magnesium EPA 200.7 (D) BL02B9810 CB1201B1212 12/3/2001 12:15 Magnesium EPA 200.7 (D) BL02B9810 CB1201B1211 12/3/2001 11:00 Magnesium EPA 200.7 (D) BL02B9810 CB1201B1189 12/3/2001 9:20 Magnesium EPA 200.7 (D) BL02B9810 CB1201B1187 12/3/2001 10:50 Magnesium EPA 200.7 (D) BL02B9810 CB1201B1194 12/3/2001 13:55 Magnesium EPA 200.7 (D) BL02B9810 CB1201B1188 12/3/2001 11:40 Magnesium EPA 200.7 (D) BL02B9810 CB1201B1193 12/3/2001 15:15 Magnesium EPA 200.7 (D) BL02B9810 CB1201B1210 12/3/2001 12:15 Magnesium EPA 200.7 (D) BL02B9810 CB1201B1185 12/3/2001 13:10 Magnesium EPA 200.7 (D) BL02B9810 CB1201B1192 12/3/2001 13:55 Magnesium EPA 200.7 (D) BL02B9810 CB1201B1186 12/3/2001 10:05 Magnesium EPA 200.7 (D) BL02B9810 CB1201B1213 12/3/2001 13:00 Phosphorus EPA 365.4 BL02B9900 CC0102B0034 1/7/2002 14:25 Phosphorus EPA 365.4 BL02B10072 CC0102B0665 1/28/2002 13:50 Phosphorus EPA 365.4 BL02B10072 CB0202B0003 2/4/2002 12:30 Phosphorus EPA 365.4 BL02B10431 CB0302B0233 3/4/2002 12:45 Phosphorus EPA 365.4 BL02B10431 CB0302B0328 3/7/2002 12:20 Phosphorus EPA 365.4 BL03B14018 CB0603B0465 6/2/2003 12:30 Phosphorus EPA 365.4 BL03B14018 CB0603B0467 6/4/2003 13:00 Phosphorus EPA 365.4 BL03B14018 CB0603B0470 6/4/2003 11:20 Phosphorus EPA 365.4 BL03B14018 CB0603B0464 6/4/2003 11:00 Phosphorus EPA 365.4 BL03B14018 CB0603B0466 6/2/2003 11:40 Phosphorus EPA 365.4 BL03B14018 CB0603B0462 6/2/2003 10:30 Phosphorus EPA 365.4 BL03B14018 CB0603B0463 6/2/2003 10:00 Phosphorus EPA 365.4 BL03B14018 CB0603B0461 6/2/2003 13:10 Phosphorus EPA 365.4 BL03B14018 CB0603B0454 6/2/2003 13:10 Sodium EPA 200.7 (D) BL02B10000 CC0102B0665 1/28/2002 13:50 Sodium EPA 200.7 (D) BL02B10615 SLA0402B0135 4/17/2002 7:35 Sodium EPA 200.7 (D) BL02B10615 DZ0402B6068 4/17/2002 7:10 Sodium EPA 200.7 (D) BL02B10615 DZ0402B6071 4/17/2002 12:40 Sodium EPA 200.7 (D) BL02B11132 CB0602B0460 6/4/2002 12:45 Table 10-13 continued on next page

MWQI Summary and Findings from Data Collected Oct 2001 through Sep 2003 10-25 Chapter 10 Data Quality Control
Analyte Method Batch number Sample number Collection date Table 10-13 Samples with matrix spike recovery exceedances (continued) Sodium EPA 200.7 (D) BL02B11132 CB0602B0461 6/4/2002 13:45 Sodium EPA 200.7 (D) BL02B11132 CB0602B0462 6/4/2002 12:45 Sodium EPA 200.7 (D) BL02B11132 CB0602B0452 6/3/2002 11:00 Sodium EPA 200.7 (D) BL02B11132 CB0602B0453 6/3/2002 8:50 Sodium EPA 200.7 (D) BL02B11132 CB0602B0458 6/4/2002 12:45 Sodium EPA 200.7 (D) BL02B11132 CB0602B0459 6/4/2002 10:15 Sodium EPA 200.7 (D) BL02B11132 SLB0602B0010 6/19/2002 12:00 Sodium EPA 200.7 (D) BL02B11132 DZ0602B9305 6/19/2002 7:00 Sodium EPA 200.7 (D) BL02B11132 DZ0602B9308 6/19/2002 0:05 Sodium EPA 200.7 (D) BL02B11132 CB0602B0459 6/4/2002 10:15 Sodium EPA 200.7 (D) BL02B11132 CB0602B0463 6/5/2002 9:40 Sodium EPA 200.7 (D) BL02B11768 CB0902B0657 9/4/2002 11:40 Sodium EPA 200.7 (D) BL02B11768 CB0902B0662 9/4/2002 9:50 Sodium EPA 200.7 (D) BL02B11768 CB0902B0639 9/3/2002 9:05 Sodium EPA 200.7 (D) BL02B11768 CB0902B0640 9/3/2002 10:15 Sodium EPA 200.7 (D) BL02B11768 CB0902B0641 9/3/2002 12:15 Sodium EPA 200.7 (D) BL02B11768 CB0902B0643 9/3/2002 9:05 Sodium EPA 200.7 (D) BL02B11768 CB0902B0658 9/4/2002 10:30 Sodium EPA 200.7 (D) BL02B11768 CB0902B0660 9/4/2002 13:45 Sodium EPA 200.7 (D) BL02B11768 CB0902B0661 9/4/2002 12:45 Sodium EPA 200.7 (D) BL02B11768 CB0902B0659 9/4/2002 11:40 Sodium EPA 200.7 (D) BL02B12196 CB1002B0814 10/1/2002 11:45 Sodium EPA 200.7 (D) BL02B12196 CB1002B0717 10/7/2002 10:30 Sodium EPA 200.7 (D) BL02B12196 CB1002B0718 10/7/2002 12:30 Sodium EPA 200.7 (D) BL02B12196 CB1002B0726 10/8/2002 10:40 Sodium EPA 200.7 (D) BL02B12196 CB1002B0720 10/7/2002 9:25 Sodium EPA 200.7 (D) BL02B12196 CB1002B0725 10/8/2002 11:45 Sodium EPA 200.7 (D) BL02B12196 CB1002B0727 10/8/2002 11:45 Sodium EPA 200.7 (D) BL02B12196 CB1002B0719 10/9/2002 9:00 Sodium EPA 200.7 (D) BL02B12196 CB1002B0728 10/9/2002 12:50 Sodium EPA 200.7 (D) BL02B12196 SLB1002B0157 10/16/2002 6:30 Sodium EPA 200.7 (D) BL02B12196 CB1002B0729 10/9/2002 12:00 Sodium EPA 200.7 (D) BL02B12196 CB1002B0730 10/9/2002 10:45 Sodium EPA 200.7 (D) BL02B12196 DZ1002B7414 10/16/2002 6:40 Sodium EPA 200.7 (D) BL02B12196 DZ1002B7418 10/16/2002 10:50 Sodium EPA 200.7 (D) BL02B12513 CB1202B0886 12/3/2002 10:15 Sodium EPA 200.7 (D) BL02B12513 CB1202B0887 12/3/2002 11:25 Sodium EPA 200.7 (D) BL02B12513 CB1202B0883 12/3/2002 12:15 Sodium EPA 200.7 (D) BL02B12513 CB1202B0884 12/3/2002 12:15 Sodium EPA 200.7 (D) BL02B12513 CB1202B0888 12/3/2002 10:20 Sodium EPA 200.7 (D) BL02B12513 CB1202B0883 12/3/2002 12:15 Table 10-13 continued on next page

MWQI Summary and Findings from Data Collected Oct 2001 through Sep 2003 10-26 Chapter 10 Data Quality Control
Analyte Method Batch number Sample number Collection date Table 10-13 Samples with matrix spike recovery exceedances (continued)
Sodium EPA 200.7 (D) BL02B12513 CB1202B0888 12/3/2002 10:20 Sodium EPA 200.7 (D) BL02B12513 CB1202B0885 12/3/2002 12:15 Sodium EPA 200.7 (D) BL02B12513 CB1202B0884 12/3/2002 12:15 Sodium EPA 200.7 (D) BL03B13176 CB0303B0164 3/5/2003 11:18 Sodium EPA 200.7 (D) BL03B13270 CC0303B0408 3/17/2003 13:30 Sodium EPA 200.7 (D) BL01B9580 CB1101B1181 11/13/2001 13:45 Sodium EPA 200.7 (D) BL01B9580 DZ1101B0892 11/14/2001 12:40 Sodium EPA 200.7 (D) BL01B9580 DZ1101B0889 11/14/2001 10:00 Sodium EPA 200.7 (D) BL01B9580 SLA1101B0838 11/14/2001 10:00 Sodium EPA 200.7 (D) BL02B12193 CC0902B3419 9/26/2002 11:00 Sodium EPA 200.7 (D) BL02B12275 CB1102B0820 11/4/2002 12:10 Sodium EPA 200.7 (D) BL02B12275 CB1102B0828 11/5/2002 10:45 Sodium EPA 200.7 (D) BL02B12275 CB1102B0832 11/6/2002 10:50 Sodium EPA 200.7 (D) BL02B12275 CB1102B0818 11/4/2002 10:45 Sodium EPA 200.7 (D) BL02B12275 CB1102B0817 11/4/2002 9:40 Sodium EPA 200.7 (D) BL02B12275 CB1102B0830 11/5/2002 14:10 Sodium EPA 200.7 (D) BL02B12275 CB1102B0821 11/4/2002 9:40 Sodium EPA 200.7 (D) BL02B12275 CB1102B0829 11/5/2002 12:05 Sodium EPA 200.7 (D) BL02B12275 CB1102B0831 11/5/2002 13:10 Sodium EPA 200.7 (D) BL02B12275 CB1102B0827 11/5/2002 12:05 Sodium EPA 200.7 (D) BL02B12275 CB1102B0819 11/4/2002 13:00 Sodium EPA 200.7 (D) BL02B9810 CB1201B1188 12/3/2001 11:40 Sodium EPA 200.7 (D) BL02B9810 CB1201B1194 12/3/2001 13:55 Sodium EPA 200.7 (D) BL02B9810 CB1201B1211 12/3/2001 11:00 Sodium EPA 200.7 (D) BL02B9810 CB1201B1193 12/3/2001 15:15 Sodium EPA 200.7 (D) BL02B9810 CB1201B1189 12/3/2001 9:20 Sodium EPA 200.7 (D) BL02B9810 CB1201B1186 12/3/2001 10:05 Sodium EPA 200.7 (D) BL02B9810 CB1201B1212 12/3/2001 12:15 Sodium EPA 200.7 (D) BL02B9810 CB1201B1192 12/3/2001 13:55 Sodium EPA 200.7 (D) BL02B9810 CB1201B1187 12/3/2001 10:50 Sodium EPA 200.7 (D) BL02B9810 CB1201B1213 12/3/2001 13:00 Sodium EPA 200.7 (D) BL02B9810 CB1201B1210 12/3/2001 12:15 Sodium EPA 200.7 (D) BL02B9810 CB1201B1185 12/3/2001 13:10 Sodium EPA 200.7 (D) BL03B13720 CB0503B0400 5/6/2003 10:15 Sodium EPA 200.7 (D) BL03B13720 CB0503B0404 5/6/2003 12:55 Sodium EPA 200.7 (D) BL03B13720 CB0503B0403 5/6/2003 13:35 Sodium EPA 200.7 (D) BL03B13720 CB0503B0401 5/6/2003 10:15 Sodium EPA 200.7 (D) BL03B13720 CB0503B0405 5/8/2003 13:05 Sodium EPA 200.7 (D) BL03B13720 CB0503B0402 5/6/2003 12:05 Sulfate EPA 300.0 28d Hold BL02B11412 CB0702B0558 7/29/2002 9:25 Sulfate EPA 300.0 28d Hold BL02B11412 CB0702B0559 7/29/2002 9:25 Table 10-13 continued on next page

MWQI Summary and Findings from Data Collected Oct 2001 through Sep 2003 10-27 Chapter 10 Data Quality Control
Analyte Method Batch number Sample number Collection date Table 10-13 Samples with matrix spike recovery exceedances (continued)
Sulfate EPA 300.0 28d Hold BL02B11412 CB0702B0560 7/29/2002 11:00 Sulfate EPA 300.0 28d Hold BL03B13681 CB0503B0405 5/8/2003 13:05 Sulfate EPA 300.0 28d Hold BL03B13681 CB0503B0405 5/8/2003 13:05 Sulfate EPA 300.0 28d Hold BL03B13681 CB0503B0405 5/8/2003 13:05 Sulfate EPA 300.0 28d Hold BL03B14318 CC0703B0629 7/28/2003 9:05 Sulfate EPA 300.0 28d Hold BL03B14318 CC0703B0630 7/28/2003 9:05 Sulfate EPA 300.0 28d Hold BL03B14318 CC0703B0631 7/28/2003 11:40

MWQI Summary and Findings from Data Collected Oct 2001 through Sep 2003 10-28 Chapter 10 Data Quality Control
Table 10-14 Matrix spike duplicate recovery exceedances Analyte Method Batch number Recovery (%) Control limits (%)
Calcium EPA 200.7 (D) BL01B9580 24.783 0–20 Calcium EPA 200.7 (D) BL03B14698 36.36 0–20 Kjeldahl Nitrogen EPA 351.2 BL03B14019 44.86 0–25 Kjeldahl Nitrogen EPA 351.2 BL02B9901 52.128 0–25 Phosphorus EPA 365.4 BL03B14018 30.41 0–25 Phosphorus EPA 365.4 BL02B9900 87.568 0–25
Table 10-15 Number of matrix spike duplicate recovery exceedances
Analyte Total matrix spike
duplicates Matrix spike duplicate recoveries out of limits
Frequency of samples out of limits (%)
Calcium 144 2 1.4 Kjeldahl Nitrogen 40 2 5 Phosphorus 49 2 4

MWQI Summary and Findings from Data Collected Oct 2001 through Sep 2003 10-29 Chapter 10 Data Quality Control
Table 10-16 Samples with matrix spike duplicate exceedances Analyte Method Batch number Sample number Collection date
Calcium EPA 200.7 (D) BL01B9580 DZ1101B0889 11/14/2001 Calcium EPA 200.7 (D) BL01B9580 SLA1101B0838 11/14/2001 Calcium EPA 200.7 (D) BL03B14698 CB0903B0591 9/10/2003 Calcium EPA 200.7 (D) BL01B9580 DZ1101B0892 11/14/2001 Calcium EPA 200.7 (D) BL01B9580 CB1101B1181 11/13/2001 Kjeldahl Nitrogen EPA 351.2 BL02B9901 CC0102B0034 1/7/2002 Kjeldahl Nitrogen EPA 351.2 BL03B14019 CB0603B0465 6/2/2003 Kjeldahl Nitrogen EPA 351.2 BL03B14019 CB0603B0467 6/4/2003 Kjeldahl Nitrogen EPA 351.2 BL03B14019 CB0603B0470 6/4/2003 Kjeldahl Nitrogen EPA 351.2 BL03B14019 CB0603B0464 6/4/2003 Kjeldahl Nitrogen EPA 351.2 BL03B14019 CB0603B0466 6/2/2003 Kjeldahl Nitrogen EPA 351.2 BL03B14019 CB0603B0462 6/2/2003 Kjeldahl Nitrogen EPA 351.2 BL03B14019 CB0603B0463 6/2/2003 Kjeldahl Nitrogen EPA 351.2 BL03B14019 CB0603B0461 6/2/2003 Phosphorus EPA 365.4 BL02B9900 CC0102B0034 1/7/2002 Phosphorus EPA 365.4 BL03B14018 CB0603B0465 6/2/2003 Phosphorus EPA 365.4 BL03B14018 CB0603B0467 6/4/2003 Phosphorus EPA 365.4 BL03B14018 CB0603B0470 6/4/2003 Phosphorus EPA 365.4 BL03B14018 CB0603B0464 6/4/2003 Phosphorus EPA 365.4 BL03B14018 CB0603B0466 6/2/2003 Phosphorus EPA 365.4 BL03B14018 CB0603B0462 6/2/2003 Phosphorus EPA 365.4 BL03B14018 CB0603B0463 6/2/2003 Phosphorus EPA 365.4 BL03B14018 CB0603B0461 6/2/2003 Phosphorus EPA 365.4 BL03B14018 CB0603B0454 6/2/2003

MWQI Summary and Findings from Data Collected Oct 2001 through Sep 2003 10-30 Chapter 10 Data Quality Control
Table 10-17 Sample duplicate exceedances Analyte Method Batch number Recovery (%) Control limits (%)
Turbidity EPA 180.1 BL03B13070 66.67 0-15
Table 10-18 Number of sample duplicate exceedances
Analyte Total sample
duplicates Sample duplicates
out of limits Frequency of samples
out of limits (%) Turbidity 233 1 0.4
Table 10-19 Samples with sample duplicate exceedances
Analyte Method Batch
number Sample number
Collection date
Turbidity EPA 180.1 BL03B13070 CB0203B0123 2/24/2003 Turbidity EPA 180.1 BL03B13070 CB0203B0124 2/24/2003 Turbidity EPA 180.1 BL03B13070 CB0203B0125 2/24/2003 Turbidity EPA 180.1 BL03B13070 CB0203B0126 2/24/2003 Turbidity EPA 180.1 BL03B13070 CB0203B0139 2/24/2003 Turbidity EPA 180.1 BL03B13070 CB0203B0140 2/24/2003 Turbidity EPA 180.1 BL03B13070 CB0203B0141 2/24/2003 Turbidity EPA 180.1 BL03B13070 CB0203B0142 2/24/2003 Turbidity EPA 180.1 BL03B13070 CB0203B0125 2/24/2003

MWQI Summary and Findings from Data Collected Oct 2001 through Sep 2003 References-1
Cited References Literature cited Craft D, Housewright R, and Fields J. 2003. Tracy Fish Facility Studies, California, Volume 22, Semicontinuous water quality
measurements at the Tracy Fish Collection Facility, Tracy, California, April 2001 to March 2002. Sacramento, CA: US Bureau of Reclamation. USBR Tracy Fish Facility Applied Research. Tracy Research Technical Report Abstract. http://www.usbr.gov/pmts/tech_services/tracy_research/tracyfacility/tracyreports/TracyReportsVolume22Abstract.html Accessed on 18 Aug 2004.
Dubrovsky NM, Kratzer CR, Brown LR, Gronberg JM, and Burow KR. 1998. Water Quality in the San Joaquin-Tulare Basins, California, 1992-95. US Geological Survey Circular 1159. Availability: http://water.usgs.gov/pubs/circ/circ1159/sec4.html (updated April 17, 1998). Accessed on September 13, 2004.
[DWR] California Department of Water Resources. 1962. Article 19. Water Quality. Standard Provisions for Water Supply Contract. First approved 3 Aug 1962 and subsequently executed with each of the State Water Project contractors.
[DWR] California Department of Water Resources, Division of Planning and Local Assistance, Water Quality Assessment Branch, Municipal Water Quality Investigations Program. 2001. California State Water Project Watershed Sanitary Survey Update Report 2001. Sacramento: Under the direction of State Water Contractors. 2 v. Dec.
[DWR] California Department of Water Resources, San Joaquin District. 2002. San Joaquin Valley Drainage Monitoring Program 1998. District report. July.
[DWR] California Department of Water Resources, Division of Environmental Services, Office of Water Quality. 2003a. The Municipal Water Quality Investigations Program Summary and Findings from Data Collected August 1998 to September 2001. July.
[DWR] California Department of Water Resources, Division of Environmental Services, Office of Water Quality. 2003b. Natomas East Main Drainage Canal Water Quality Investigation. Prepared for State Water Contractors by the Municipal Water Quality Investigations Program Urban Sources and Loads Project. Initial technical report. Nov.
[DWR] California Department of Water Resources. 2003c. Vernalis Adaptive Management Plan: Operating to Environmental Flow Targets. California Cooperative Snow Surveys Program. PowerPoint presentation by Mike Archer, MBK Engineers. 20 Nov. http://cdec.water.ca.gov/snow/meeting/CCSS_2003_Meeting/ Vernalis_Adaptive_Management_Program.pdf
[DWR] California Department of Water Resources, Bay-Delta Office, South Delta Branch. Temporary Barriers Operating Schedule. http://sdelta.water.ca.gov/web_pg/tempbsch.htm. Accessed on 11 Aug 2004.
Eaton AD, Clesceri LS, Greenberg AE, Franson MAH, editors. 1995. Standard methods for the examination of water and wastewater / prepared and published jointly by American Public Health Association, American Water Works Association, Water Environment Federation. 19th ed. Washington, DC: American Public Health Association. 1 v. (various pagings)
[EPA] US Environmental Protection Agency, Office of Water. 1998 (Dec). Stage 1 Disinfectants and Disinfection Byproducts Rule. http://www.epa.gov/cgi-bin/epaprintonly.cgi. Accessed on 20 Sep 2002.
[EPA] U.S. Environmental Protection Agency. Secondary drinking water regulations: Guidance for nuisance chemicals. EPA 810/K-92-001 July 1992. http:www.epa.gov/safewater/consumer/2ndstandards.html
[EPA] US Environmental Protection Agency, Office of Water. 1998 (Dec). Stage 1 Disinfectants and Disinfection Byproducts Rule. http://www.epa.gov/cgi-bin/epaprintonly.cgi. Accessed on 20 Sep 2002.
[EPA] US Environmental Protection Agency, Office of Water. 2000. Nutrient criteria technical guidance manual for lakes and reservoirs. 1st edition. Washington, DC: EPA-822-B00-001.
[EPA] Environmental Protection Agency, Office of Water. 2000. Ambient Water Quality Criteria Recommendations. Information Supporting the Development of State and Tribal Nutrient Criteria. Rivers and Streams in Nutrient Ecoregion III. EPA 822-B-00-016. Availability: http://www.epa.gov/waterscience/criteria/nutrient/ecoregions/rivers/rivers_3.pdf. Accessed on 14 Sep 2004.
Fong S. 2002. Bryte Chemical Laboratory quality assurance manual. Quality Assurance Technical Document 8. Sacramento: Bryte Chemical Laboratory, Water Quality Assessment Branch, Environmental Services Division, California Department of Water Resources. Apr.
[SFEP] San Francisco Estuary Project. 1992. Agriculture Drainage Fact Sheet. Aug. http://www.abag.ca.gov/bayarea/sfep/reports/fact/agdrain.html. Accessed on 17 Sep 2004.
MWQI Summary and Findings from Data Collected Oct 2001 through Sep 2003 References-2
[SJR Group Authority] San Joaquin River Group Authority. 2003 Jan. 2002 Annual Technical Report. On Implementation and Monitoring of the San Joaquin River Agreement and the Vernalis Adaptive Management Plan. Prepared for the California State Water Resources Control Board in Compliance with D-1641.
[SJR Group Authority] San Joaquin River Group Authority. 2004 Jan. 2003 Annual Technical Report on Implementation and Monitoring of the San Joaquin River Agreement and the Vernalis Adaptive Management Plan. Prepared for the California Water Resources Control Board in compliance with D-1641. 123 p.
[SWRCB] California State Water Resource Control Board. 2000. Water Right Decision 1641 (revised). http://www.waterrights.ca.gov/baydelta/d1641.htm, Accessed on 1 Oct 2004.
Personal communication Breuer RS, MWQI. 2002. Office discussion with Fengmao Guo. 14 Nov.
Holm L. 2003. Review comments on draft MWQI three-year data report. Sent to RS Breuer via Richard Woodard. 10 Feb.
Holm L and Denton R. 2003. Review comments on draft MWQI three-year data report. Sent to RS Breuer via Richard Woodard.
McCune William J. MWQI. 2002. Office discussion on boron in San Joaquin Valley and rice drainage to NEMDC from Reclamation District 1000 Pump #6. 18 Dec.

MWQI Summary and Findings from Data Collected Oct 2001 through Sep 2003 A-1 Appendix A Data File
Appendix A
Find raw data files for this report on the CD version or on the Internet at