the natural gas industry-an overvie production gas wells & lease equipment gathering /...
TRANSCRIPT

Natural Gas
From prospect to burner tip
J. Richard Moore
Puget Sound EnergySource:

EXPLORATION
PRODUCTION
GAS WELLS & LEASE EQUIPMENT
GATHERING / PROCESSING
TRANSMISSION
PLANTS , PIPELINES & STORAGE
DISTRIBUTION
CONSUMERS
LDC PIPELINES & EQUIPMENT
CONSUMERS
U.S. natural gas industry-segmentsGas industry function Gas industry segment Gas industry facilities
Upstream
Midstream
Downstream
LNG
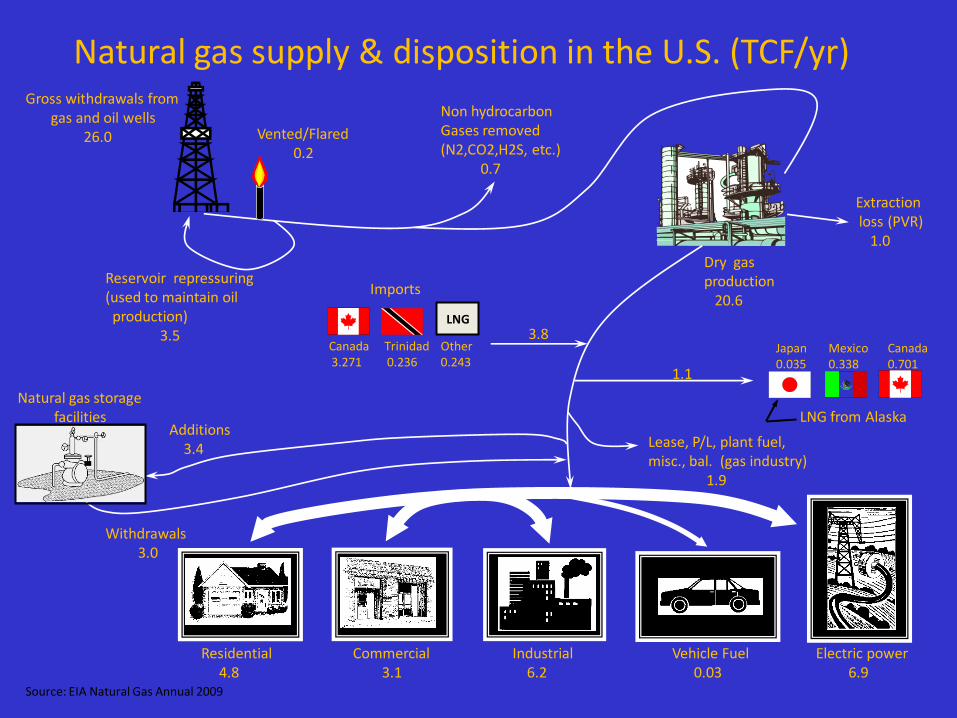
Gross withdrawals fromgas and oil wells
26.0 Vented/Flared0.2
Non hydrocarbonGases removed(N2,CO2,H2S, etc.)
0.7
Extraction loss (PVR)
1.0
Dry gasproduction
20.6Imports
Canada3.271
Trinidad0.236
Other0.243
3.8
1.1
Japan0.035
Mexico0.338
Canada0.701
LNG from Alaska
Reservoir repressuring(used to maintain oilproduction)
3.5
Natural gas storagefacilities
Additions3.4
Withdrawals3.0
Lease, P/L, plant fuel, misc., bal. (gas industry)
1.9
Residential4.8
Commercial3.1
Industrial6.2
Vehicle Fuel0.03
Electric power6.9
Source: EIA Natural Gas Annual 2009
Natural gas supply & disposition in the U.S. (TCF/yr)
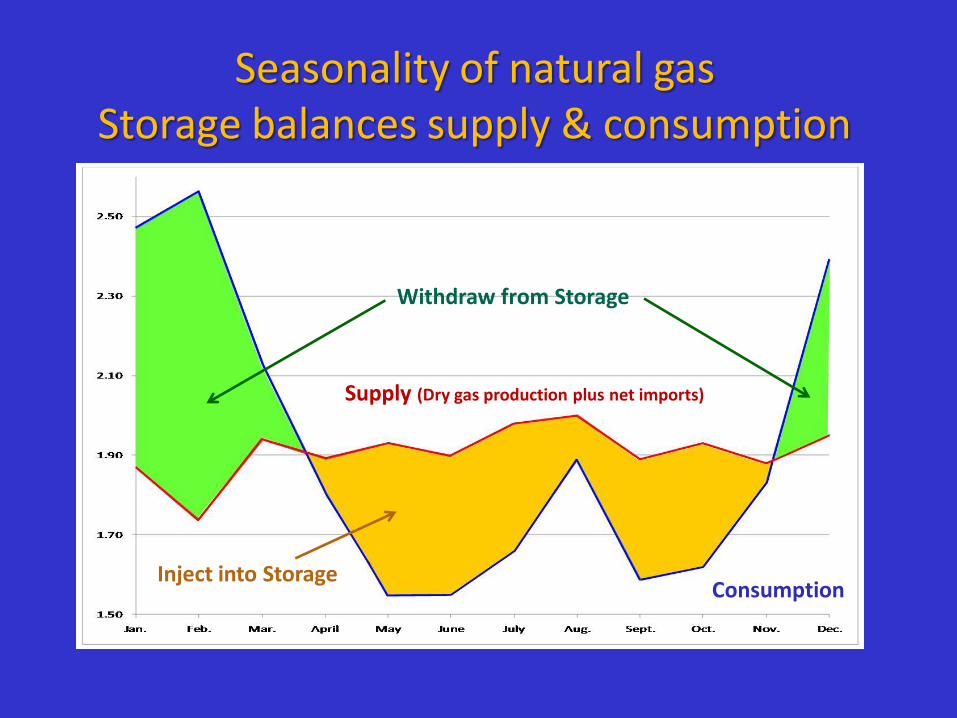
Seasonality of natural gas Storage balances supply & consumption
Withdraw from Storage
Consumption
Supply (Dry gas production plus net imports)
Inject into Storage

Principal Interstate Natural Gas Flow Summary
Source: EIA
Map pattern of gas movements

Natural Gas Formation & Exploration

GEOLOGIC TIME
Years Ago Headlines
CENOZOIC ERA
MESOZOIC ERA
PALEOZOIC ERA
PRECAMBRIAN ERA
Man Appears
Horses AppearDinosaurs Disappear
Dinosaurs Appear
First AbundantFossil Record
Ozone Layer FormedBig Bang Heard
0
65 Million
225 Million
570 Million
4,600 Million
OIL AND GAS FORMATION
Depth Pressure & Temp
SurfaceSurface
5,000’
10,000’
SUCCEEDING
LAYERS
OF ROCK
ADD WEIGHT
AND
PRESSURE
ON EARLIER
LAYERSHeat and Pressure Convert
Organic Debris to Oil & Gas
“BASEMENT” ROCK
IncreasingWith Depth
(5,000 PSI, 220 F)o
Rock Layers Deposited
Over Time
Geology and formation of natural gas
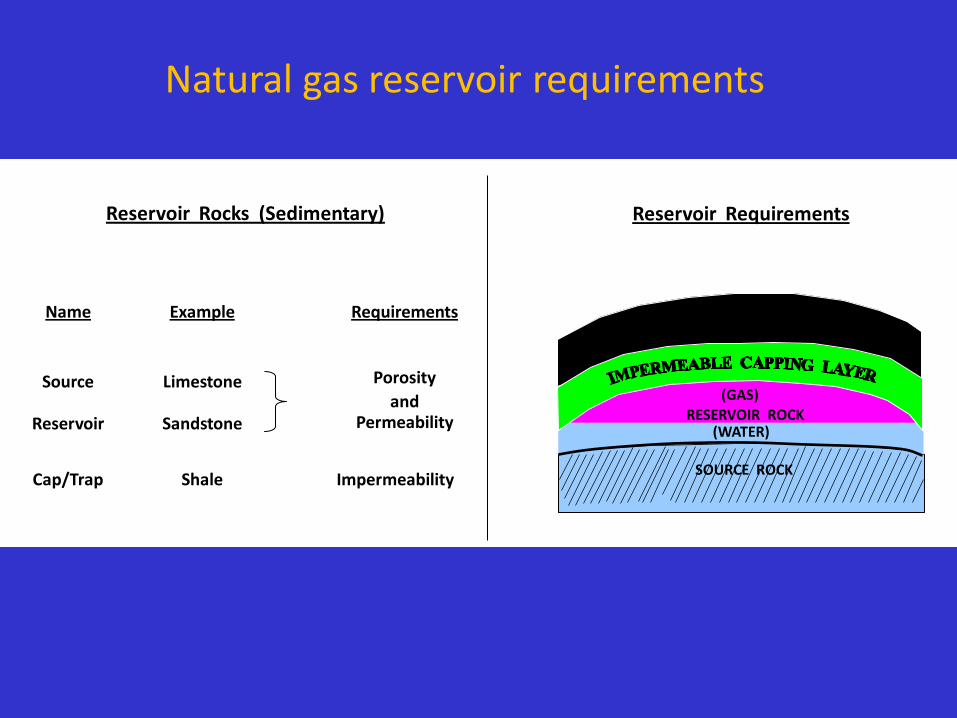
Reservoir Rocks (Sedimentary)
Name Example Requirements
Source Limestone Porosity
andPermeabilityReservoir Sandstone
Cap/Trap Shale Impermeability
Reservoir Requirements
(GAS)RESERVOIR ROCK
(WATER)
SOURCE ROCK
Natural gas reservoir requirements

Porosity and permeability
Conventional formation Unconventional formation
Source: Natural Gas.org, USGS

1. Identify ProspectA. SeismicB. Log Correlation
2. Obtain Mineral Lease3. Obtain Drilling Permit4. Prepare Site
Preliminary
1. Drilling ContractA. Rate: Day, Footage, TurnkeyB. Equipment & Start Date
2. Design Casing Program3. Evaluate Surface Equipment
Requirements
Contract & Design Issues
1. Well Control - Blow Outs / Lost Holes2. MWD - Directional Wells3. Logging and Analysis4. Decision to Complete5. Tight Hole - Confidential
Activities While Drilling
CirculatingSystem(Mud)
PowerSystem
(Engines)
Major Rig Systems
1. Hoisting - Mast & Drawworks
2. Rotating - Turntable / Top Drive and Drill String
3. Circulating - Pumps and Mud
4. Power - Engines (Diesel / Electric)
Drilling a well

Horizontal drilling benefits
• Improved project economics
(> production rates = > PV)
• Reduced total field CAPEX
(fewer wells/locations required)
• Reduced environmental
disturbance
(fewer sites/wells/roads)

Completion & Production Operations
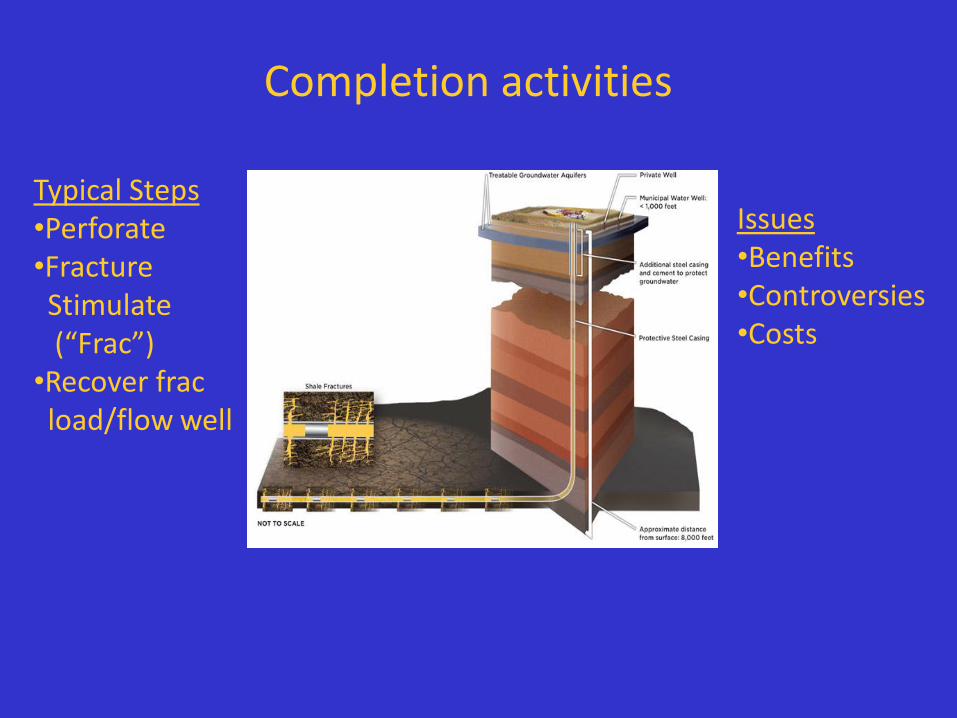
Typical Steps•Perforate•FractureStimulate(“Frac”)
•Recover fracload/flow well
Issues•Benefits•Controversies•Costs
Completion activities

Source: DOE NETL “Shale Primer” 4/09
“Fracing” & water quality concerns
Depth000 ft
0
1
Frac zone
6
10
Water for human consumption is taken
from top 1000 feet of the earth.
EPA says 20 Billion* barrels of sewage
( containing toxins and diseases) leakannually from US sewage systems. Leaks are intotop of water supply zone and can go downthrough entire zone. (Daily volume is: (1) > than 10times the total BP Macondo well spill (2) equal tototal fluid needed for 550 to 1100 frac jobs)
Typical frac job 50-100k barrels—thousandsof feet below water supply
Which is the greater threat?
*Source: www.epa.gov/npdes/pubs/csosso_rtc_factsheet.pdf

“Fracing” & water supply concerns
Some facts:
1. Water used to frac one horizontal well = 50k -100k bbls
2. Golf course water consumption in U.S.*• Average golf course in U.S. consumes 50K bbls per weeK• Average U.S. golf course consumes 2.5 million bbls per year • U.S. has 16,000 golf courses• Annual U.S. golf course water consumption = 40 billion bbls
U.S. golf courses consume enough water every yearto frac 400,000 to 800,00 wells--shall we ban golf?
Source: May 2008 Golf Digest (“How green is my golf?”), EIA

Natural Gas Gathering and Processing

HYDROGENSULFIDE
METHANE PROPANENITROGEN
HELIUMNATURALGASOLINE
ISO-BUTANE
ETHANEDIRT
&RUST
CARBONDIOXIDE
WATER
NORMALBUTANE
RECOVERABLE HYDROCARBONS
RESIDUE GAS
NON-HYDOCARBONS AND CONTAMINANTS
FROM
WELLHEAD
SEPARATORS
TO GAS
PROCESSING
PLANTSPIPELINE
Typical natural gas stream

Condensate
LineHeater
Separator
Treating
(CO2, H2S) DehydrationUnit
Sales Gas
Liquid Sales
To Disposal
Water
Gas
Gas well surface flow schematic

Site / Facilities
Wellhead
C Compressor
P Pig Launcher/Retriever
High Pressure Gathering Line
Medium Pressure Gathering Line
Low Pressure Gathering Line
Gas Transmission Pipeline
P P C
PP
P
P
P PP
P
C
C
High Pressure
(300 – 500 PSI)
PC P
Gas Tran
smissio
n P
/L
TOPipeline,
Truck,Barge
NGLS
Natural Gas
Pipeline QualityGas
ProcessingPlant
Functions / Activities
• Gathering – Connects Wells to Transmission Pipeline System
• Compression – Raises Pressure of Gas From Wellheads Permitting Gas to Flow Into Transmission System. Lengthens Well Life.
• Treating – Removes Impurities
• Processing – Removes NGLS
Natural gas gathering and processing
Place in physical distribution network

Natural Gas Transmission

Natural gas transmission pipelines
Place in physical distribution network
FUNCTIONS / ACTIVITIES
• Provide high pressure / long distance
transportation of gas
• Pipeline uses pressure from reservoir or
compressors (pumps) to move gas
• Pipeline uses storage facilities and line
pack to meet supply / demand swings
• Safety & environmental regulation - DOT,
OSHA, EPA, DOI
• Intrastate rate regulation - state agencies
• Interstate rate regulation - FERC
SITE / FACILITIES
Supply Source
Market
Gathering Lines
Intrastate Transmission Pipeline
Interstate Transmission Pipeline “A”
Interstate Transmission Pipeline “B”
City Gate
Local Distribution Company Pipelines
Compressor
Underground Storage
M
CG
US
C
S

Natural Gas Distribution

Tran
smis
sio
n P
ipel
ine
1. PressureRegulator
2. Measurement
3. Odorization
Distribution Main - Trunk (100 PSIG)
1. Storage2. LNG3. CNG4. Propane/Air
Distribution Main (20 PSIG)
(1/4 PSIG)4 oz.
PressureRegulator
CityGate
PeakingSupply
PressureRegulator
CustomerMeter
Customer(House)
Miles of Main
Steel - 551,000Plastic - 621,000Other - 38,000
Total - 1,210,000
Local Distribution Utilities*
Type
Investor OwnedMunicipal
Number
260930
Regulation
StateLocal
Residential 4.9 Trillion BTUCommercial 3.1 Trillion BTUIndustrial 3.9 Trillion BTUElec. Gen . 1.8 Trillion BTU
13.7 Trillion BTUTotal
LDC Deliveries
Natural gas distribution
Place in physical distribution network
*Source: AGA: AGA

Most natural gas is consumed as fuel
Lease, P/L and plant fuel = 1.9 TCF (8% of total consumption)
R&C = 7.9 TCF (37% of consumer use)
Electric power generation = 6.9 TCF (33% of consumer use)
Industrial = 6.2 TCF (30% of consumer use)
Gas as feedstock = <10% of industrial use or < 3% of total (MECS)
Natural gas consumption(22.9 tcf consumed-21.0 tcf by consumers)
Source: EIA Natural Gas Annual 2009

Natural Gas Supply

Conventional & unconventional gas
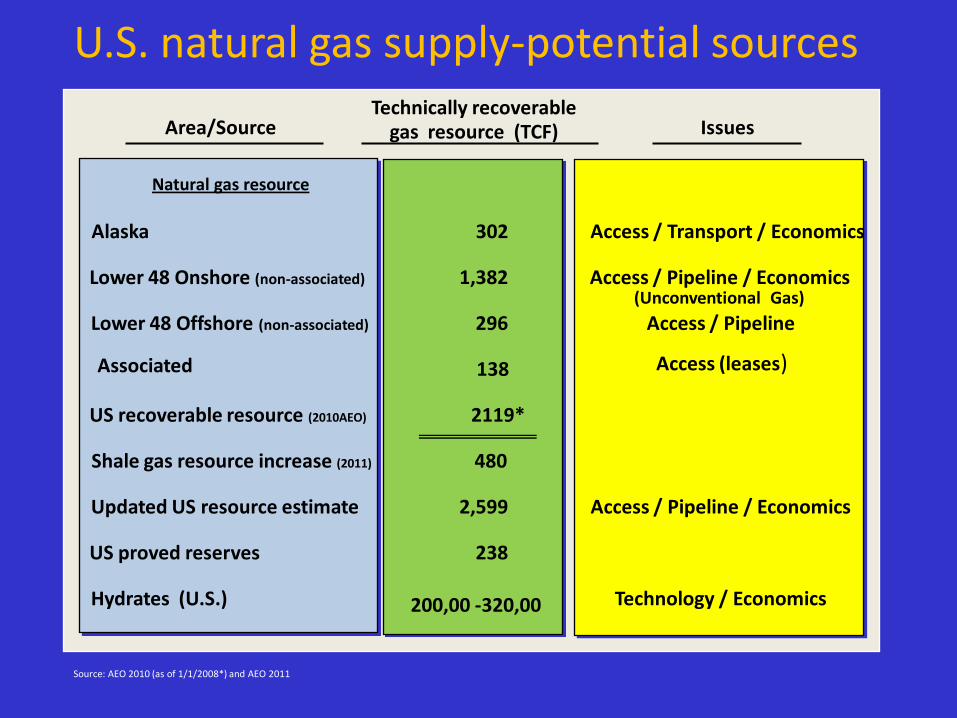
Alaska
Lower 48 Onshore (non-associated)
Lower 48 Offshore (non-associated)
US recoverable resource (2010AEO)
Shale gas resource increase (2011)
Updated US resource estimate
US proved reserves
Hydrates (U.S.)
302
1,382
296
138
2119*
480
2,599
238
200,00 -320,00
Access / Transport / Economics
Access / Pipeline / Economics
Access / Pipeline
Access / Pipeline / Economics
Technology / Economics
Area/SourceTechnically recoverable
gas resource (TCF) Issues
Natural gas resource
(Unconventional Gas)
U.S. natural gas supply-potential sources
Source: AEO 2010 (as of 1/1/2008*) and AEO 2011
Associated Access (leases)

Source: EIA Annual Energy Outlook (AEO) 2011
Source
U. S. Dry Production
Lower 48 - Onshore
Lower 48 - Offshore
Alaska
Total U. S. Dry Production
Imports (Net)
Pipeline
LNG
Total Imports
Total U. S. Dry Supply
TCF
18.6
2.4
0.3
21.3
2.4
0.4
2.8
24.1
%
77
10
1
88
10
2
12
100
2010
TCF
21.0
2.4
0.2
23.6
1.0
0.3
1.3
24.9
%
84
10
1
95
4
1
100
2025
TCF
23.0
2.9
0.2
26.1
-0.2
0.1
0.3
26.4
%
87
11
1
99
1
-
1
100
2035
Unconventional gas (Tight Gas, Shale, CBM) growth more than offsets decline in conventional lower 48 onshore production
2010 AEO Alaska gas pipeline begins operation in 2023. 2011 AEO: no AGP 2010 AEO: LNG imports surpass pipeline imports in 2017. 2011 AE0: LNG < P/L imports.
5
U.S. dry natural gas supply/forecasted sources
Lower 48 year end reserves 264 287 266

Unconventional Natural Gas Supply

Category
Deep Gas (15,000’ +)
“Tight” Gas
Shale
Coal Bed Methane
Geo-Pressurized Zone
(10,000 – 25,000 Ft)
Methane Hydrates
Extraction Difficulty
Drilling Cost
Low Production Rates
(Low Permeability)
Low Production Rates
Low Production Rates/Water Disposal
Depth and High Pressure
•Extracting Methane from•Ice Crystal Lattice
Solution
Technology / Higher Gas Prices
Fracture / Acid Stimulation Horizontal Wells
Fracture Stimulation & Horizontal Drilling
Improved Drilling & Production Technology CO2
Injection
Improved Drilling & Production Technology
Not Yet Known
Recoverable TCF
90 (30% of US resource)
254 (6000)
827 (650-1135)
163
1,100
(5,000-49,000)
?(200,000-320,000)
Unconventional gas sources
Source: 2011 NETL,USGS,NG.org websites

What is shale gas/oil?
Shale gas refers to natural gas that is trapped within shale formations. Shales are fine-grained sedimentary rocks that can be rich sources of petroleum and natural gas. Long known as source rock, shale’s limited permeability has rendered the resource uneconomic until recently.

Worldwide shale gas resource
•48 shale basins (70 formations) in 32 countries•5,670 TCF of recoverable resource (plus 862 TCF in US)•Conservative. Excluded; offshore, Russia, Middle East
Source: EIA, “World shale gas resources” 4/5/11

US shale resource:•Abundance of gas will hold down US energy costs•Lower energy costs improve US competitiveness•Expand US employment/taxes/royalties•Environmental benefits: low emissions•Reduce imports and improve energy supply security•Reduce cash flow and influence of enemies of US
Why is shale gas important?
Worldwide resource: (shale located in 688 formations in 142 basins)
{i.e. China=540 TCF, Europe=108 TCF, Canada=72 TCF with resource likely to expand with drilling)
•Reduce energy cost and emissions worldwide•Improve living standards and promote trade•Reduce potential for conflict

Liquefied Natural Gas (LNG)

Source: FERC, EIA, IEO 09, O&GJ 12/06/10,LNG World News
• US 2009 Imports of LNG = 479 BCF = 6% of 8.6 TCF World LNG Market (2007 = 771 BCF = 10%)
• Worldwide Proved Gas Reserves = 6,647 TCF (57 times projected 2011 Worldwide Consumption of 117 TCF)
(400 BCF)
LNG value chain

• 333 Vessels in LNG Trade , 34 Ships on Order (03/06/10 www.shipbuildinghistory.com)
• LNG Transported at - 163 C (-260 F) and Atmospheric Pressure (1/600 Reduction)
• Ship Fuel may be Cargo “Boil Off” = 0.15% Per Day or Dual Fuel (diesel)
• Standard Vessel is Increasing from 125,000m / 138,000m (3 BCF) to 145,000m / 250,000m3 3
oo
~
Source: FERC and BP
3 3
LNG shipping
Source: EIA, FERC, web

Natural Gas Storage
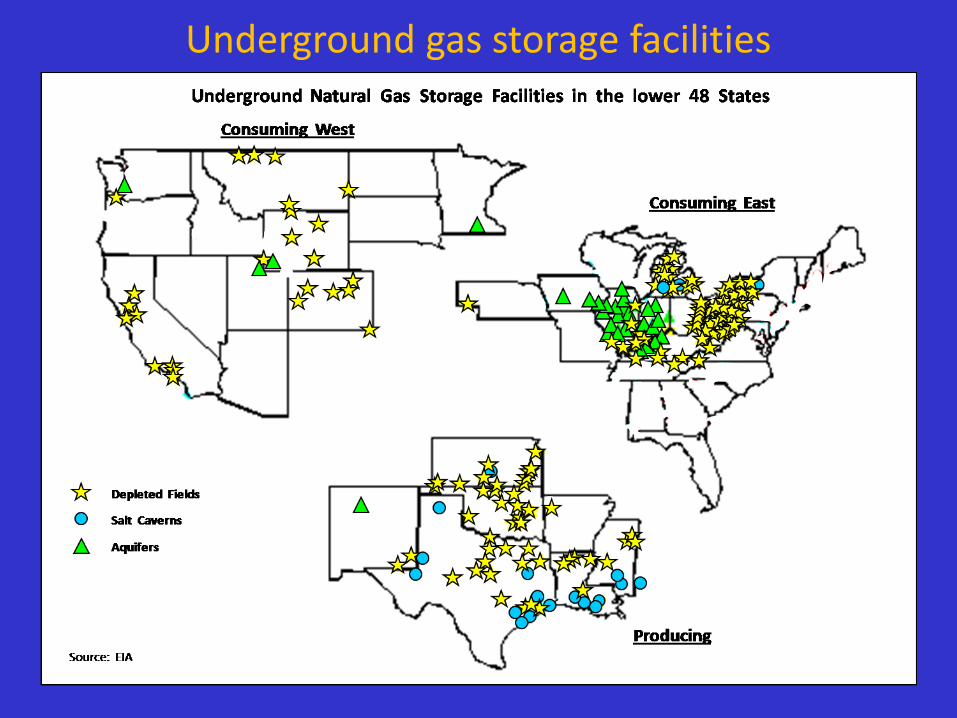
Underground gas storage facilities

Statistics
Sites
326
43
31
400
# %
81
11
8
100
Working GasCapacity
3,528
390
173
4,091
BCF %
86
10
4
100
DailyDeliverability
66,130
8,393
13,703
88,226
75
9
16
100
MMCF/D %
Working Gas /Deliverability Ratio
52
46
13
46
Type
Depleted Gas / Oil
Aquifer
Salt Cavern
Total
Source: EIA
Underground gas storage facilities
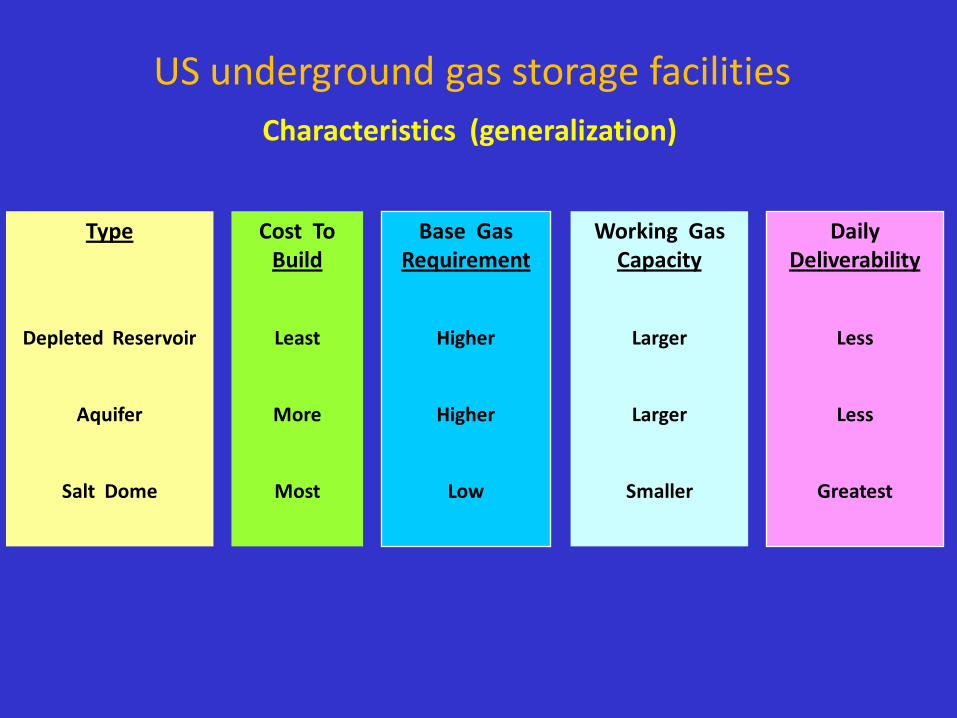
Characteristics (generalization)
Type
Depleted Reservoir
Aquifer
Salt Dome
Cost ToBuild
Least
More
Most
Base GasRequirement
Higher
Higher
Low
Working GasCapacity
Larger
Larger
Smaller
DailyDeliverability
Less
Less
Greatest
US underground gas storage facilities
