the nature conservancy eastern regional office resources/files/eflows/sab... · the nature...
TRANSCRIPT

Northeast Aquatic Habitat Classification
and Mapping
Arlene Olivero and Mark AndersonThe Nature Conservancy Eastern Regional Office
ObjectiveProcessResultsNext Steps
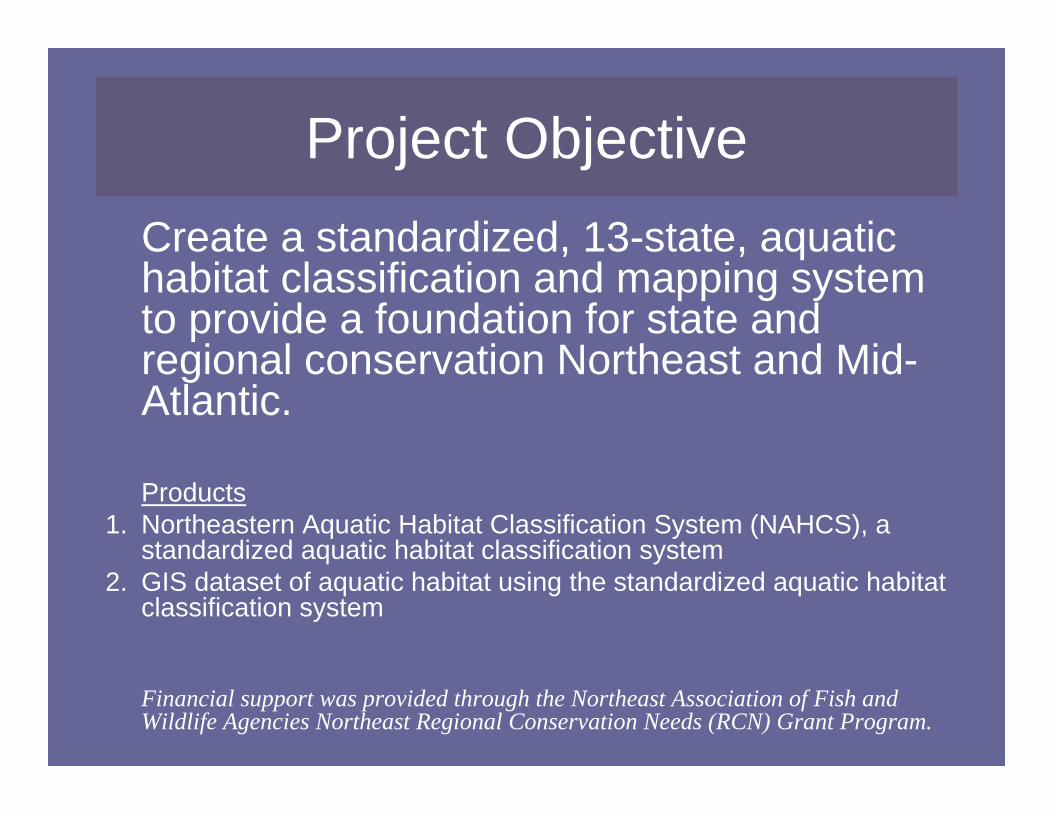
Project ObjectiveCreate a standardized, 13-state, aquatic habitat classification and mapping system to provide a foundation for state and regional conservation Northeast and Mid-Atlantic.
Products1. Northeastern Aquatic Habitat Classification System (NAHCS), a
standardized aquatic habitat classification system2. GIS dataset of aquatic habitat using the standardized aquatic habitat
classification system
Financial support was provided through the Northeast Association of Fish and Wildlife Agencies Northeast Regional Conservation Needs (RCN) Grant Program.
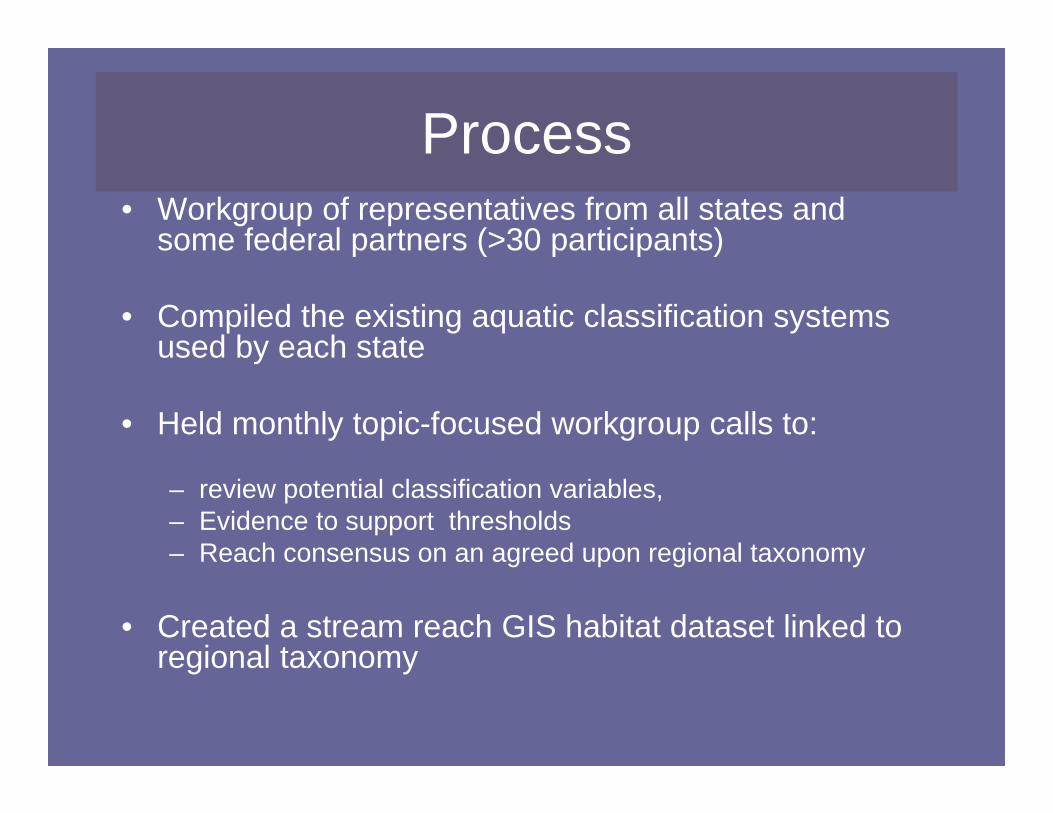
• Workgroup of representatives from all states and some federal partners (>30 participants)
• Compiled the existing aquatic classification systems used by each state
• Held monthly topic-focused workgroup calls to:
– review potential classification variables, – Evidence to support thresholds– Reach consensus on an agreed upon regional taxonomy
• Created a stream reach GIS habitat dataset linked to regional taxonomy
Process

State Name Email AgencyME Dave Halliwell [email protected] ME Dept. of Environmental ProtectionME Dave Coutemach [email protected] ME Dept. of Environmental Protection
ME Katherine Webster [email protected] Dept. of Biological Sciences, UMOME Merry Gallagher [email protected] ME Dept. of Inland Fisheries and WildlifeME Peter Vaux [email protected] Mitchell Center for Env. & Watershed Research, UMONH Ben Nugent [email protected] NH Fish and Game Commission, Dept. of Inland Fisheries
NH Mat Carpenter [email protected] NH Fish and Game Commission, Dept. of Inland FisheriesNH Brian Frappier [email protected] Department of Natural Resources, UNHVT Rich Langdon [email protected] VT Fish and Wildlife Dept.VT Steve Fiske [email protected] VT Dept. of Env. Conservation, Biomonitoring ProgramMA Todd Richards [email protected] MA Division of Fisheries and Wildlife, Field HeadquartersMA Alicia Norris [email protected] MA Division of Fisheries & WildlifeMA Margaret Kearns [email protected] MA Dept.of Fish and Game, Riverways Program
MA/NE Jeffrey Legros [email protected] Northeast Instream Habitat Program, UMASS AmherstMA Robert Brooks [email protected] USDA Forest Service, Northern Research Unit NE-4251CT Neal Hagstrom [email protected] CT Dept. of Environmental ProtectionNY Marcia Meixler [email protected] Dept. of Natural Resources, Cornell UniversityNY Tracey Tomajer [email protected] Division of Fish, Wildlife, & Marine Resources - NYSDECNJ Lisa Barno [email protected] NJ Department of Environmental ProtectionPA Mary Walsh [email protected] PA Natural Heritage ProgramPA Jeremy Deeds [email protected] PA Natural Heritage ProgramPA Mike Pruss [email protected] PA Game Commission - State Wildlife Management AgencyPA Brian Chalfant [email protected] PA Dept. of Environmental ProtectionPA David Day [email protected] PA Fish and Boat CommissionPA Michael Bialousz [email protected] PA Fish and Boat CommissionDE Kevin Kalasz [email protected] DE Division of Fish and WildlifeMD Scott Stranko [email protected] MD Dept. of Natural ResourcesVA Dave Morton [email protected] VA Dept. of Game and Inland FisheriesVA Brian Roosa [email protected] VA Dept. of Game and Inland FisheriesWV Walter Kordek [email protected] WV Division of Natural ResourcesWV David Thorne [email protected] WV Division of Natural ResourcesWV Dan Cincotta [email protected] WV Division of Natural ResourcesMI Paul Seelbach [email protected] MI Dept.of Natural Resources, University of Michigan
PA/DE Cara Campbell [email protected] USGS Northern Appalachian Research BranchNY James McKenna [email protected] Unites States Geological Survey
MA/NE Ken Sprankle [email protected] USFWS - Wildlife & Sport Fish Restoration Program, Region 5
MA/NE Willa Nehlsen [email protected] U.S. Fish & Wildlife Service - Regional Fisheries Program
WorkgroupParticipants35+
State Fish and Wildlife Agency, DEP, Natural Heritage Program, Federal Agency, University, NGO Partners….
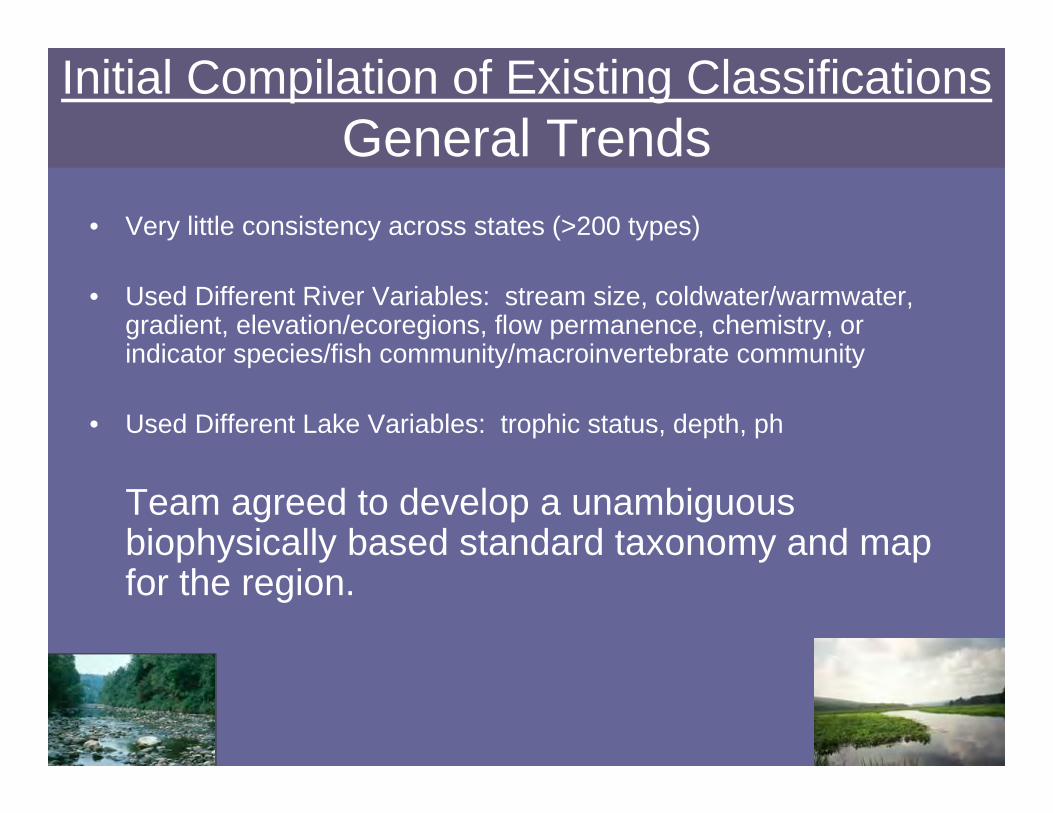
Initial Compilation of Existing ClassificationsGeneral Trends
• Very little consistency across states (>200 types)
• Used Different River Variables: stream size, coldwater/warmwater, gradient, elevation/ecoregions, flow permanence, chemistry, or indicator species/fish community/macroinvertebrate community
• Used Different Lake Variables: trophic status, depth, ph
Team agreed to develop a unambiguous biophysically based standard taxonomy and map for the region.
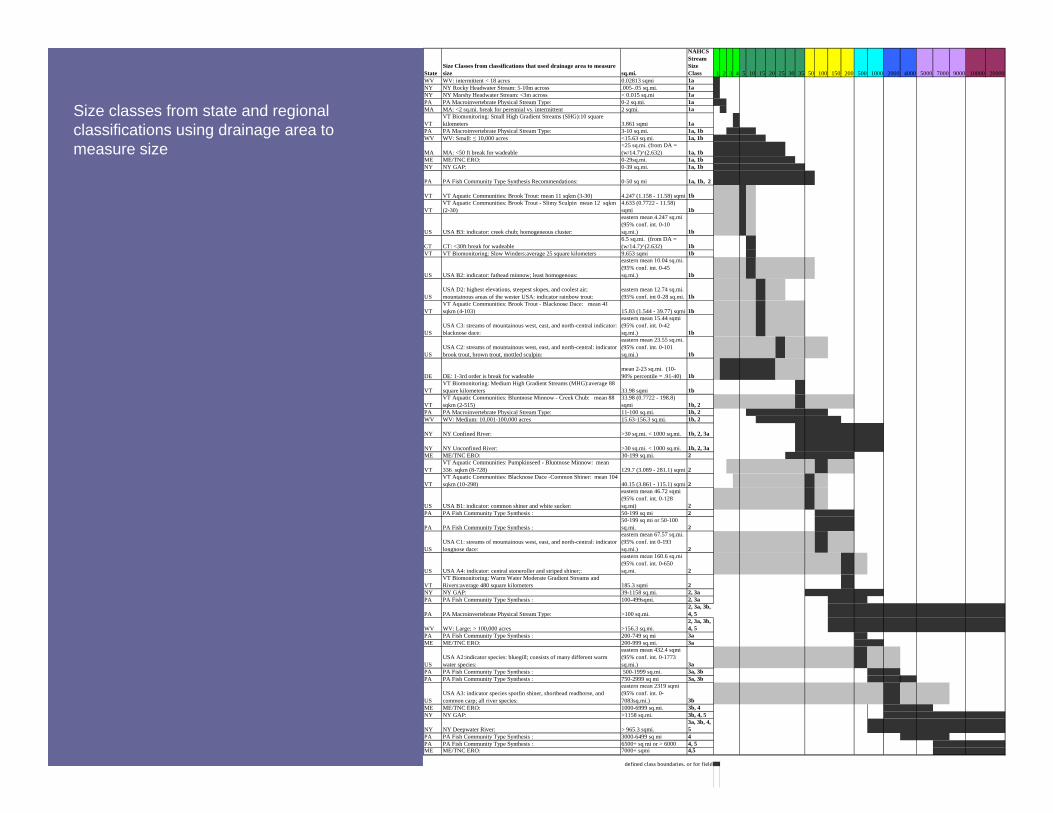
Size classes from state and regional classifications using drainage area to measure size
StateSize Classes from classifications that used drainage area to measure size sq.mi.
NAHCS Stream Size Class 1 2 3 4 5 10 15 20 25 30 35 50 100 150 200 500 1000 2000 4000 5000 7000 9000 10000 20000
WV WV: intermittent < 18 acres 0.02813 sqmi 1aNY NY Rocky Headwater Stream: 5-10m across .005-.05 sq.mi. 1aNY NY Marshy Headwater Stream: <3m across < 0.015 sq.mi 1aPA PA Macroinvertebrate Physical Stream Type: 0-2 sq.mi. 1aMA MA: <2 sq.mi. break for perennial vs. intermittent 2 sqmi. 1a
VTVT Biomonitoring: Small High Gradient Streams (SHG):10 square kilometers 3.861 sqmi 1a
PA PA Macroinvertebrate Physical Stream Type: 3-10 sq.mi. 1a, 1bWV WV: Small: ≤ 10,000 acres <15.63 sq.mi. 1a, 1b
MA MA: <50 ft break for wadeable<25 sq.mi. (from DA = (w/14.7)^(2.632) 1a, 1b
ME ME/TNC ERO: 0-29sq.mi. 1a, 1bNY NY GAP: 0-39 sq.mi. 1a, 1b
PA PA Fish Community Type Synthesis Recommendations: 0-50 sq mi 1a, 1b, 2
VT VT Aquatic Communities: Brook Trout: mean 11 sqkm (3-30) 4.247 (1.158 - 11.58) sqmi 1b
VTVT Aquatic Communities: Brook Trout - Slimy Sculpin mean 12 sqkm (2-30)
4.633 (0.7722 - 11.58) sqmi 1b
US USA B3: indicator: creek chub; homogeneous cluster:
eastern mean 4.247 sq.mi (95% conf. int. 0-10 sq.mi.) 1b
CT CT: <30ft break for wadeable6.5 sq.mi. (from DA = (w/14.7)^(2.632) 1b
VT VT Biomonitoring: Slow Winders:average 25 square kilometers 9.653 sqmi 1b
US USA B2: indicator: fathead minnow; least homogenous:
eastern mean 10.04 sq.mi. (95% conf. int. 0-45 sq.mi.) 1b
USUSA D2: highest elevations, steepest slopes, and coolest air; mountainous areas of the wester USA: indicator rainbow trout:
eastern mean 12.74 sq.mi. (95% conf. int 0-28 sq.mi. 1b
VTVT Aquatic Communities: Brook Trout - Blacknose Dace: mean 41 sqkm (4-103) 15.83 (1.544 - 39.77) sqmi 1b
USUSA C3: streams of mountainous west, east, and north-central indicator: blacknose dace:
eastern mean 15.44 sqmi (95% conf. int. 0-42 sq.mi.) 1b
USUSA C2: streams of mountainous west, east, and north-central: indicator brook trout, brown trout, mottled sculpin:
eastern mean 23.55 sq.mi. (95% conf. int. 0-101 sq.mi.) 1b
DE DE: 1-3rd order is break for wadeablemean 2-23 sq.mi. (10-90% percentile = .91-40) 1b
VTVT Biomonitoring: Medium High Gradient Streams (MHG):average 88 square kilometers 33.98 sqmi 1b
VTVT Aquatic Communities: Bluntnose Minnow - Creek Chub: mean 88 sqkm (2-515)
33.98 (0.7722 - 198.8) sqmi 1b, 2
PA PA Macroinvertebrate Physical Stream Type: 11-100 sq.mi. 1b, 2WV WV: Medium: 10,001-100,000 acres 15.63-156.3 sq.mi. 1b, 2
NY NY Confined River: >30 sq.mi. < 1000 sq.mi. 1b, 2, 3a
NY NY Unconfined River: >30 sq.mi. < 1000 sq.mi. 1b, 2, 3aME ME/TNC ERO: 30-199 sq.mi. 2
VTVT Aquatic Communities: Pumpkinseed - Bluntnose Minnow: mean 336 sqkm (8-728) 129.7 (3.089 - 281.1) sqmi 2
VTVT Aquatic Communities: Blacknose Dace -Common Shiner: mean 104 sqkm (10-298) 40.15 (3.861 - 115.1) sqmi 2
US USA B1: indicator: common shiner and white sucker:
eastern mean 46.72 sqmi (95% conf. int. 0-128 sq.mi) 2
PA PA Fish Community Type Synthesis : 50-199 sq mi 2
PA PA Fish Community Type Synthesis : 50-199 sq mi or 50-100 sq.mi. 2
USUSA C1: streams of mountainous west, east, and north-central: indicator longnose dace:
eastern mean 67.57 sq.mi. (95% conf. int 0-193 sq.mi.) 2
US USA A4: indicator: central stoneroller and striped shiner;:
eastern mean 160.6 sq.mi (95% conf. int. 0-650 sq.mi. 2
VTVT Biomonitoring: Warm Water Moderate Gradient Streams and Rivers:average 480 square kilometers 185.3 sqmi 2
NY NY GAP: 39-1158 sq.mi. 2, 3aPA PA Fish Community Type Synthesis : 100-499sqmi. 2, 3a
PA PA Macroinvertebrate Physical Stream Type: >100 sq.mi.2, 3a, 3b, 4, 5
WV WV: Large: > 100,000 acres >156.3 sq.mi.2, 3a, 3b, 4, 5
PA PA Fish Community Type Synthesis : 200-749 sq mi 3aME ME/TNC ERO: 200-999 sq.mi. 3a
USUSA A2:indicator species: bluegill; consists of many different warm water species:
eastern mean 432.4 sqmi (95% conf. int. 0-1773 sq.mi.) 3a
PA PA Fish Community Type Synthesis : 500-1999 sq.mi. 3a, 3bPA PA Fish Community Type Synthesis : 750-2999 sq mi 3a, 3b
USUSA A3: indicator species spotfin shiner, shorthead readhorse, and common carp; all river species:
eastern mean 2319 sqmi (95% conf. int. 0-7083sq.mi.) 3b
ME ME/TNC ERO: 1000-6999 sq.mi. 3b, 4NY NY GAP: >1158 sq.mi. 3b, 4, 5
NY NY Deepwater River: > 965.3 sqmi.3a, 3b, 4, 5
PA PA Fish Community Type Synthesis : 3000-6499 sq mi 4PA PA Fish Community Type Synthesis : 6500+ sq mi or > 6000 4, 5ME ME/TNC ERO: 7000+ sqmi 4,5
defined class boundaries, or for field

Product was not intended to override state classifications, but was meant to complement state classifications and provide a
means for looking at patterns across the region.
+ + + +
=
Classification ApproachWorkgroup determined most important classification variables and thresholds for our region within this Higgins et al 2006. framework.

Initial Classification Variables …
• Size - upstream drainage area, order, mean annual flow …• Channel Gradient (slope)• Geology and Chemistry – bedrock types, surficial types, PH,
ANC, channel substrate (cobble, gravel, sand…) • Water Temperature• Network Position• Elevation• Air Temperature• Precipitation• Baseflow and flow stability• Watershed average slope, surrounding landforms• Riparian wetlands and floodplains
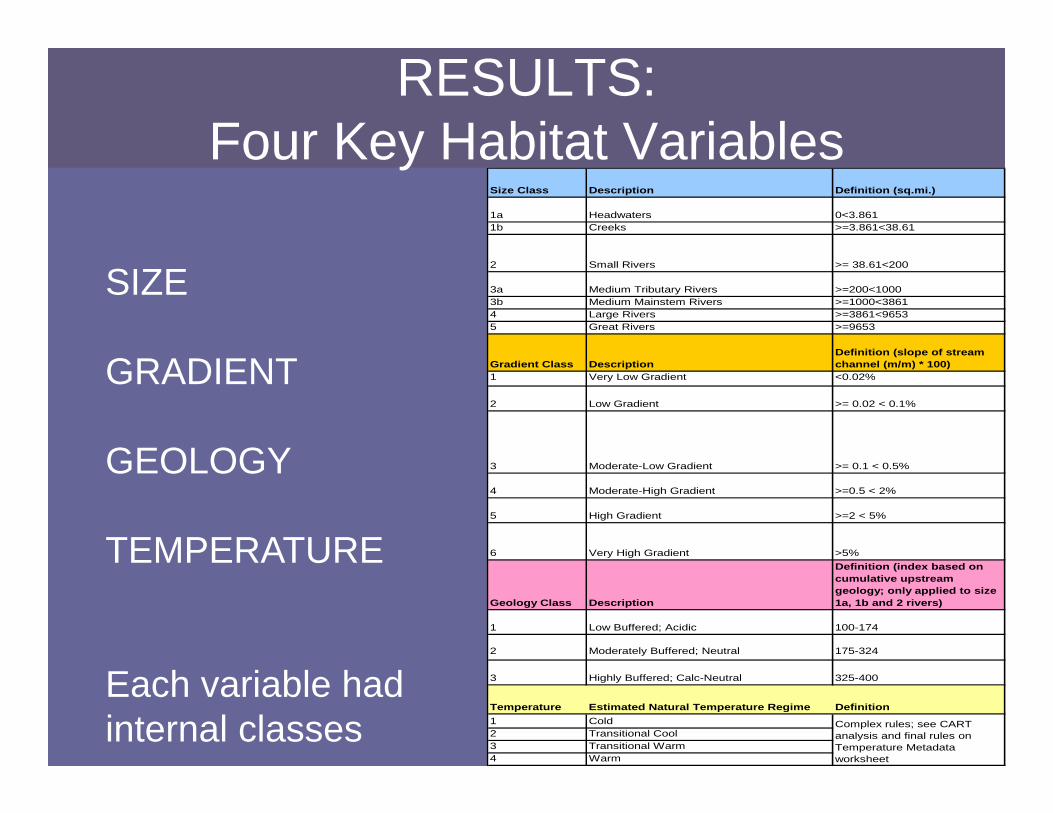
RESULTS: Four Key Habitat Variables
SIZE
GRADIENT
GEOLOGY
TEMPERATURE
Each variable had internal classes
Size Class Description Definition (sq.mi.)
1a Headwaters 0<3.8611b Creeks >=3.861<38.61
2 Small Rivers >= 38.61<200
3a Medium Tributary Rivers >=200<1000 3b Medium Mainstem Rivers >=1000<3861 4 Large Rivers >=3861<96535 Great Rivers >=9653
Gradient Class DescriptionDefinition (slope of stream channel (m/m) * 100)
1 Very Low Gradient <0.02%
2 Low Gradient >= 0.02 < 0.1%
3 Moderate-Low Gradient >= 0.1 < 0.5%
4 Moderate-High Gradient >=0.5 < 2%
5 High Gradient >=2 < 5%
6 Very High Gradient >5%
Geology Class Description
Definition (index based on cumulative upstream geology; only applied to size 1a, 1b and 2 rivers)
1 Low Buffered; Acidic 100-174
2 Moderately Buffered; Neutral 175-324
3 Highly Buffered; Calc-Neutral 325-400
Temperature Estimated Natural Temperature Regime Definition1 Cold2 Transitional Cool3 Transitional Warm4 Warm
Complex rules; see CART analysis and final rules on Temperature Metadata worksheet
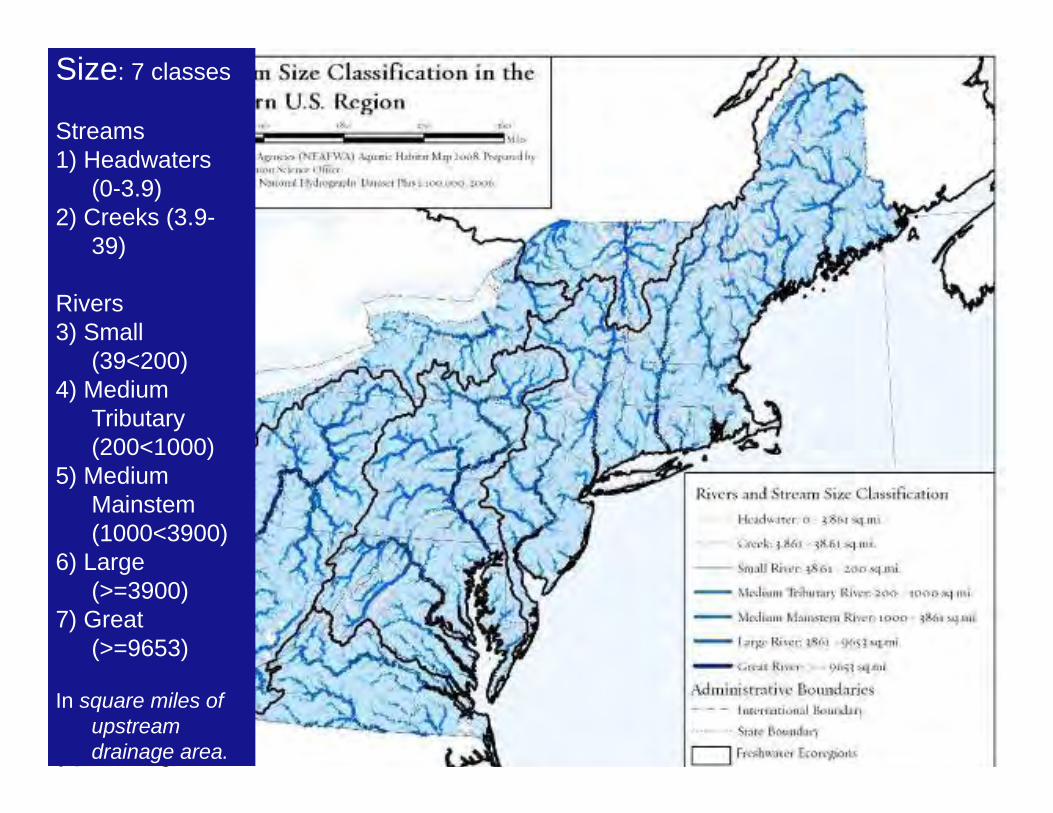
Size
Results: 7 agreed upon classes
1) Headwaters (0-3.9)2) Creeks (3.9-39)3) Small River (39<200)4) Medium Tributary Rivers
(200<1000)5) Medium Mainstem Rivers
(1000<3900)6) Large Rivers
(>=3900) 7) Great Rivers
(>=9653)
( square miles of upstream drainage area. Rounding 3.89 to 3.9)
Size: 7 classes
Streams1) Headwaters
(0-3.9)2) Creeks (3.9-
39)
Rivers3) Small
(39<200)4) Medium
Tributary (200<1000)
5) Medium Mainstem(1000<3900)
6) Large (>=3900)
7) Great (>=9653)
In square miles of upstream drainage area.

Stream Size Classes tested with Pennsylvanian Fisheries Data
0.000.020.040.060.080.100.120.140.160.180.20
1 2 3 4 5
Size class Options
Clas
sific
atio
n St
reng
th
Atlantic Basin Fish
Ohio-Great LakesBasins Fish
Option 1 (sq.mi): 1=0-29, 2=30-199, 3=200-999, 4=1000-6999, 5=7000+Option 2 (sq.mi): 1=2-9, 2=10-49, 3=50-99, 4=100-499, 5=500-1999, 6=2000-5999, 7=6000+Option 3 (sq.mi): 1=0-50, 2=50-199, 3=200-749, 4=750-2999, 5=3000-6499, 6=6500+Option 4 (sq.mi): 1=0-9, 2=10-24, 3=25-199, 4=200-499, 5=500-1999, 6=2000-3999, 7=4000-6999, 8=7000+Option 5 (sq.mi): 1=1-9, 2=10-29, 3=30-199, 4=200-999, 5=1000-6999, 6=7000+
Our scheme (Option 1) had high classification strength in both basins

GradientResults: 6 classes
1) Very low 0-0.02%
2) Low 0.02-0.1%
3) Moderate 0.1-0.5%
4) Moderate-High 0.5-2%
5) High 2-5%
6) Very High 5%
Measure = rise/run * 100

Rare Stream Biota and Gradient Classes.
A cluster analysis using 6672 points representing 317 Heritage tracked species of fish, mussels, snails, amphibians, and aquatic insects (317 species, 6672 point occurrences) was used to test gradient classes.
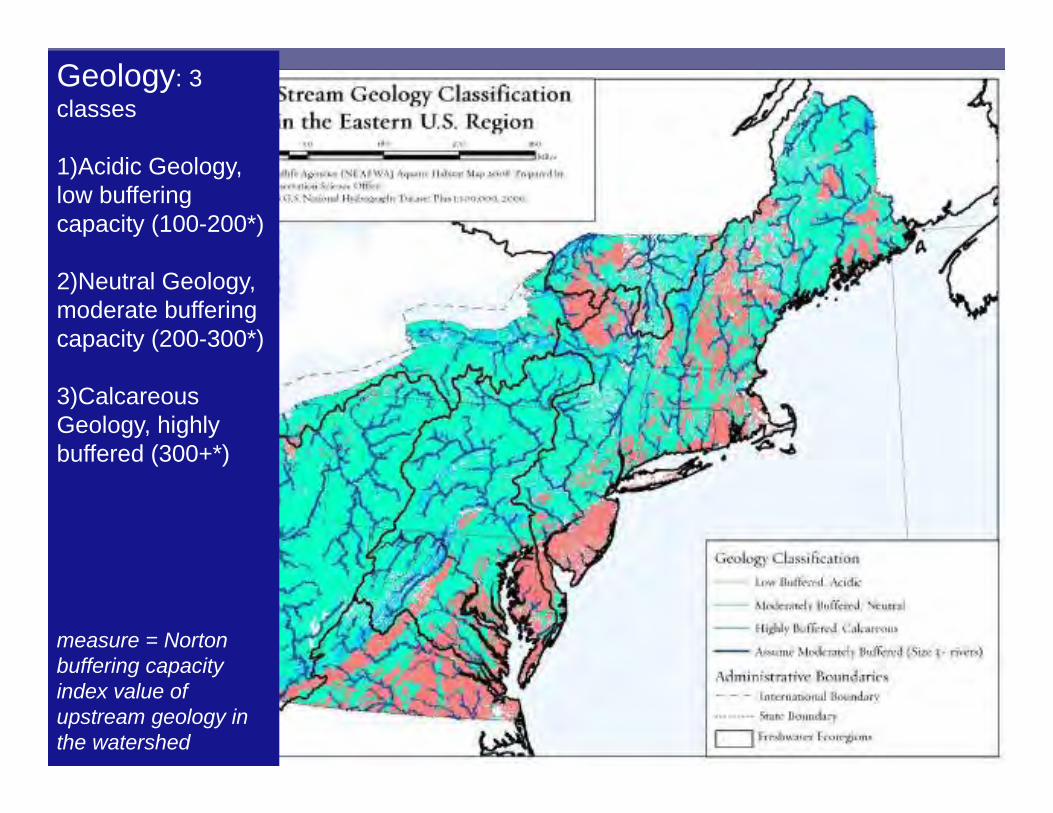
Geology: 3 classes
1)Acidic Geology, low buffering capacity (100-200*)
2)Neutral Geology, moderate buffering capacity (200-300*)
3)Calcareous Geology, highly buffered (300+*)
measure = Norton buffering capacity index value of upstream geology in the watershed

Average Stream pH by underlying geology type
*
*
Norton: 100 200 300 400
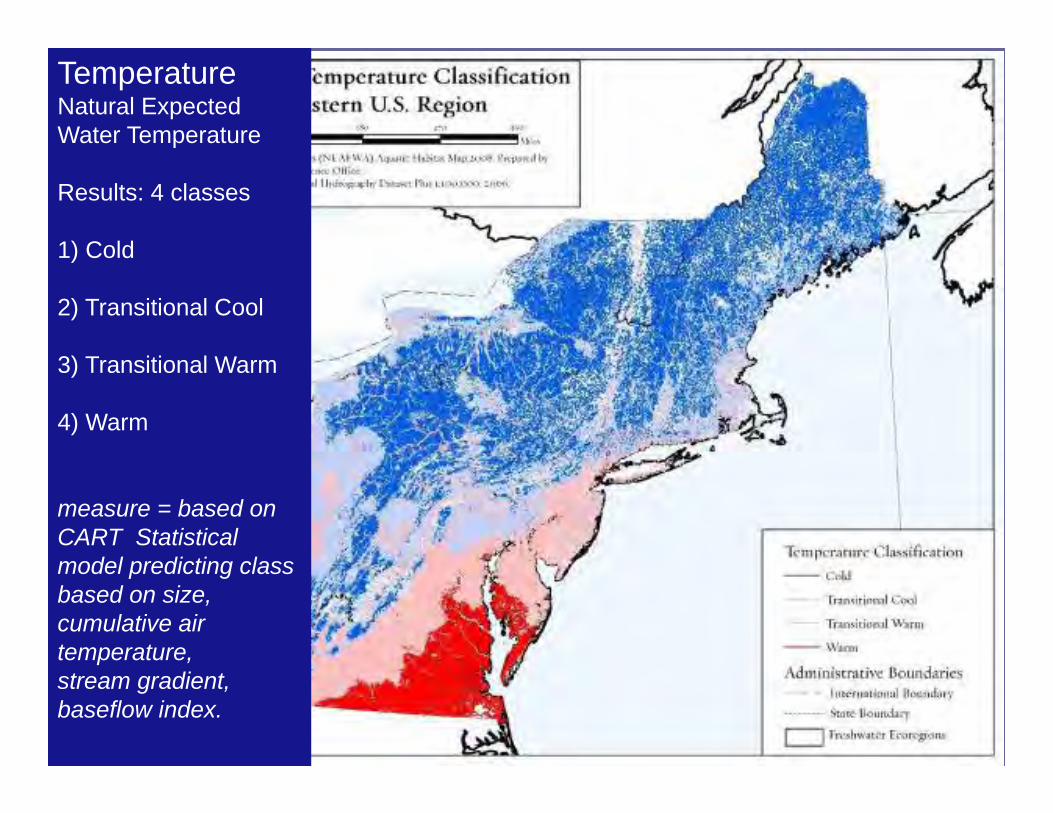
TemperatureNatural Expected Water Temperature
Results: 4 classes
1) Cold
2) Transitional Cool
3) Transitional Warm
4) Warm
measure = based on CART Statistical model predicting class based on size, cumulative air temperature, stream gradient, baseflow index.

Rivers : Temperature was estimated from air temperature models and stream size class.
Streams: Used a slightly different model incorporating base flow
Air Temp Class, w ith USGS PRISM AIR TEMP MODEL: exact ranges of cumulat ive area weighted mean annual temp in detree C * 10
Size 5: >= 9653 sq.mi.
Size 4: 3861-9653 sq.mi.
Size 3b: 1000-3861 sq.mi.
Size 3a: 200-1000 sq.mi.
size 2 200-38 sq.mi. baseflow index < 40%
size 2 200-38 sq.mi. baseflow index >= 40%
2: 15-30 transitional cooltransitional cool
transitional cool cold cold cold
3: 30-45 transitional cooltransitional cool
transitional cool cold cold cold
4: 45-60transitional w arm
transitional cool
transitional cool
transitional cool
transitional cool cold
5: 60-76transitional w arm
transitional w arm
transitional w arm
transitional cool
transitional cool transitional cool
6: 75-90transitional w arm
transitional w arm
transitional w arm pink
transitional cool transitional cool
7: 90-105transitional w arm
transitional w arm
transitional w arm
transitional w arm
transitional w arm transitional cool
8: 105-120transitional w arm
transitional w arm
transitional w arm
transitional w arm
transitional w arm pink
9: 120-135 very w arm very w armtransitional w arm
transitional w arm
transitional w arm pink
10: 135-150 very w arm very w arm very w arm very w arm very w arm very w arm
RIVER MODEL: Definition of Water Temperature Classes

Regional Taxonomy Combine 4 Key Habitat Variables
259 types occur, 208 with more than 10km of length
FromVery high gradient, acidic, cold Headwater stream(1a_6_1_1)
ToVery low gradient, calcareous, warm Great river(5_1_3_4)
Size Class Description Definition (sq.mi.)
1a Headwaters 0<3.8611b Creeks >=3.861<38.61
2 Small Rivers >= 38.61<200
3a Medium Tributary Rivers >=200<1000 3b Medium Mainstem Rivers >=1000<3861 4 Large Rivers >=3861<96535 Great Rivers >=9653
Gradient Class DescriptionDefinition (slope of stream channel (m/m) * 100)
1 Very Low Gradient <0.02%
2 Low Gradient >= 0.02 < 0.1%
3 Moderate-Low Gradient >= 0.1 < 0.5%
4 Moderate-High Gradient >=0.5 < 2%
5 High Gradient >=2 < 5%
6 Very High Gradient >5%
Geology Class Description
Definition (index based on cumulative upstream geology; only applied to size 1a, 1b and 2 rivers)
1 Low Buffered; Acidic 100-174
2 Moderately Buffered; Neutral 175-324
3 Highly Buffered; Calc-Neutral 325-400
Temperature Estimated Natural Temperature Regime Definition1 Cold2 Transitional Cool3 Transitional Warm4 Warm
Complex rules; see CART analysis and final rules on Temperature Metadata worksheetSize, Gradient, Geo, Temp

Example: High gradient, acidic coldwater creeks (1b_5,6_1_1)

Highly Buffered Headwaters/CreeksExample: Highly buffered calcareous headwater creeks(1b_5,6_1_1)
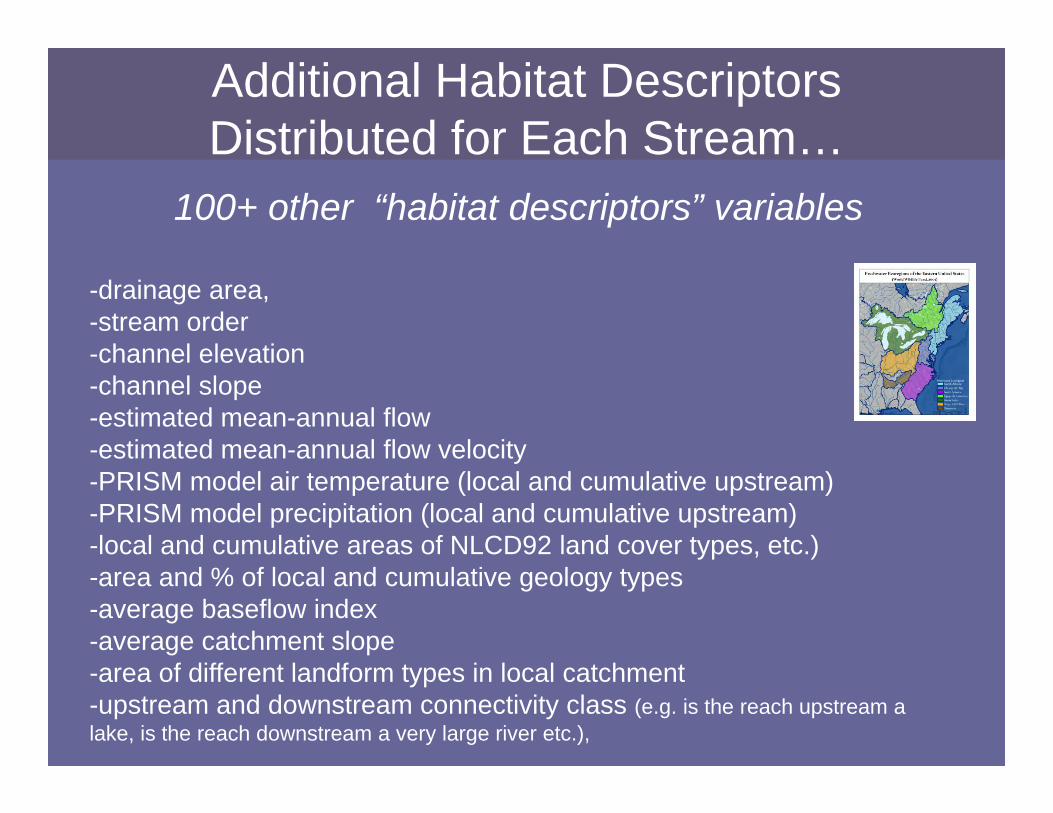
Additional Habitat Descriptors Distributed for Each Stream…
100+ other “habitat descriptors” variables
-drainage area, -stream order-channel elevation-channel slope-estimated mean-annual flow -estimated mean-annual flow velocity-PRISM model air temperature (local and cumulative upstream)-PRISM model precipitation (local and cumulative upstream)-local and cumulative areas of NLCD92 land cover types, etc.)-area and % of local and cumulative geology types-average baseflow index-average catchment slope-area of different landform types in local catchment-upstream and downstream connectivity class (e.g. is the reach upstream a lake, is the reach downstream a very large river etc.),
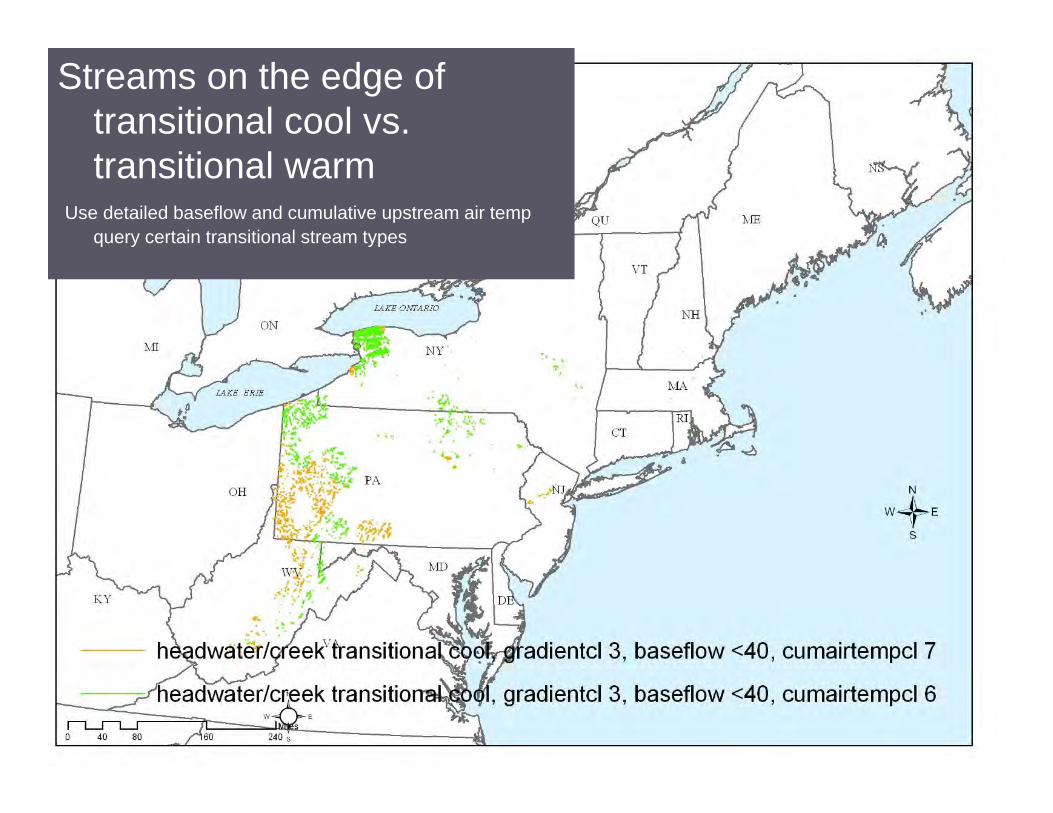
Streams on the edge of transitional cool vs. transitional warm
Use detailed baseflow and cumulative upstream air temp query certain transitional stream types
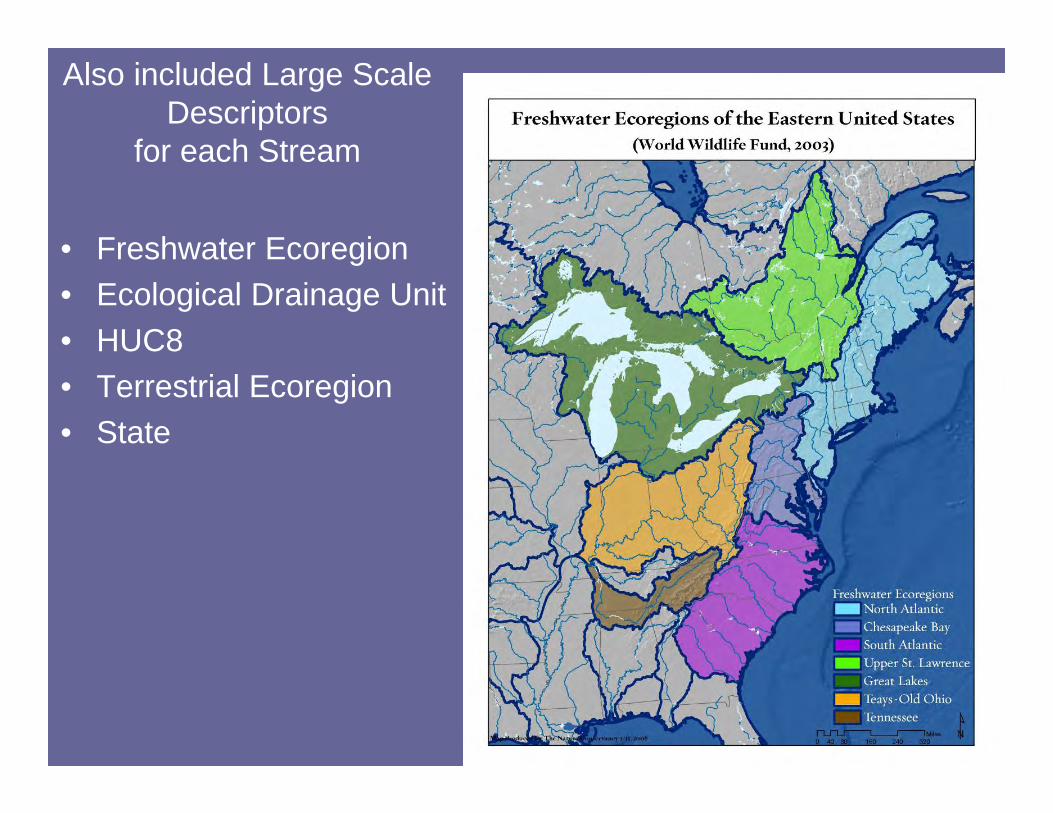
Also included Large Scale Descriptors
for each Stream
• Freshwater Ecoregion• Ecological Drainage Unit• HUC8• Terrestrial Ecoregion• State
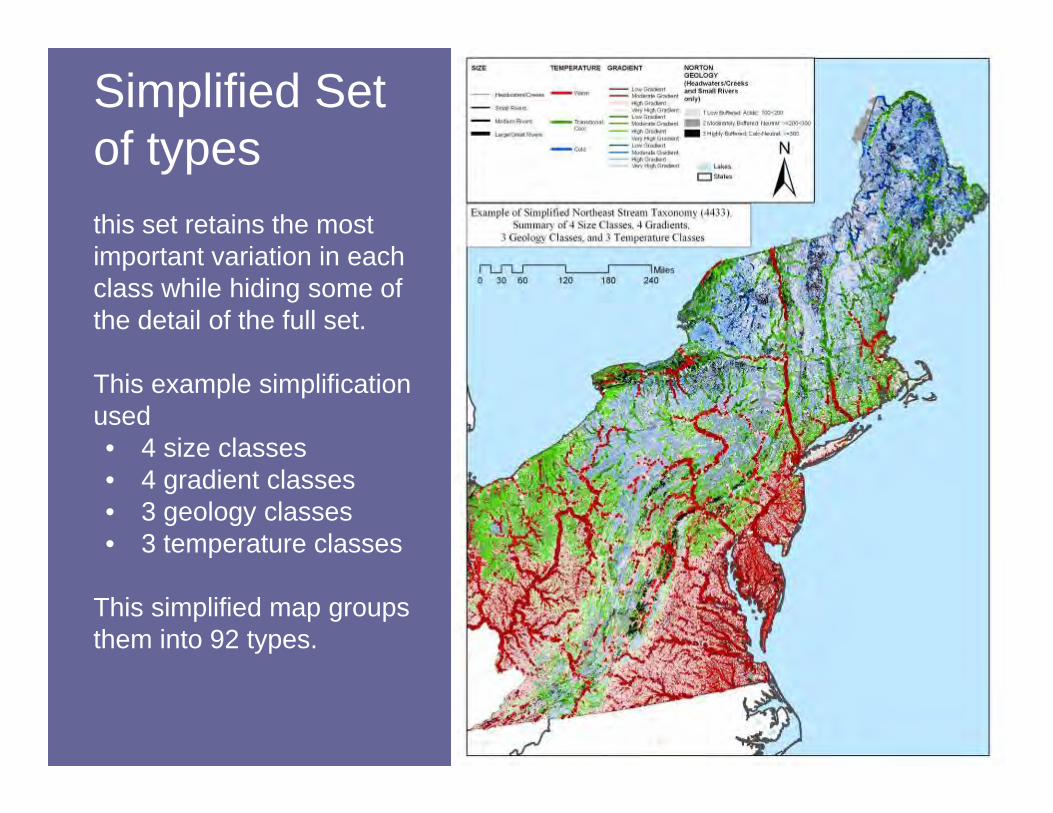
Simplified Set of typesthis set retains the most important variation in each class while hiding some of the detail of the full set.
This example simplification used • 4 size classes• 4 gradient classes• 3 geology classes• 3 temperature classes
This simplified map groups them into 92 types.

Three Simplification MethodsMapping all 259 types is not always practical, nor necessary for certain regional applications. Team developed 3 recommendations regarding simplifying the classification.
1. Variable Prioritization2. Within Variable Collapsing3. Remove Biotically Insignificant Combinations
Allows for the combination of primary variables in simpler forms to create a flexible and most desired reporting scheme for your purpose

Download report from http://rcngrants.org/node/38 and GIS data from…
http://rcngrants.org/spatialData
Anticipated Uses • Provides common definitions and mapping of
aquatic habitats across state lines.
• Facilitate a new understanding of aquatic biota on a regional scale
• Create a new opportunity to assess condition and prioritize habitats
• Facilitate more effective and efficient habitat conservation

Thank You
• Work with states to use the classification. Link types to biota. Stratifying biological and temperature sampling
Contact: [email protected]