the necessity of discretion: a behavioral evaluation of ... · in top-down theories, discretion at...
TRANSCRIPT

© The Author(s) 2018. Published by Oxford University Press on behalf of the Public Management Research Association. This is an Open Access article distributed under the terms of the Creative Commons Attribution Non-Commercial License (http://creativecommons.org/licenses/by-nc/4.0/), which permits non-commercial re-use, distribution, and reproduction in any medium, provided the original work is properly cited. For commercial re-use, please contact [email protected]
1
Journal of Public Administration Research And Theory, 2018, 1–19doi:10.1093/jopart/muy024
Article
Article
The Necessity of Discretion: A Behavioral Evaluation of Bottom-Up Implementation TheoryEva Thomann*, Nadine van Engen†, Lars Tummers‡
*Department of Politics, University of Exeter; †Department of Public Administration, Erasmus University Rotterdam; ‡Utrecht University Utrecht School of Governance
Address correspondence to the author at [email protected]
Abstract
The topic of discretion continues to be hotly debated in policy design and policy implementation. In top-down theories, discretion at the frontline is often seen as a control problem: discretion should be avoided as it can mean that the policy is not implemented as intended. Conversely, bottom-up theories state that discretion can help policy implementers tailor a policy to specific circumstances. However, there has been little systematic research into how the experience of hav-ing discretion motivates frontline workers to implement a policy. We conceptualize and evalu-ate this relationship by combining public administration and motivation literature, using datasets in healthcare and education and large-N set-theoretic configurational analysis. Results robustly show that experiencing discretion is a quasi-necessary condition and, hence, a prerequisite for high implementation willingness. This finding is more in line with bottom-up than with top-down theories. Policy implementers crucially need the freedom to adapt the program to local conditions for being motivated to implement a policy. The evidence encourages scholars and practitioners to move from the question whether frontline workers should be granted discretion to how to best make use of frontline workers’ discretion instead.
Introduction
“The closer one is to the source of the problem, the greater is one’s ability to influence it; and the problem-solving ability of complex systems depends not on hierarchical control but on maxi-mizing discretion at the point where the problem is most immediate.”
Richard F. Elmore (1979: 605)
Discretion is the freedom to decide what should be done in a particular situation. Repeatedly, research has shown that frontline workers—also referred to as public professionals or street-level bureaucrats—have an important role in the successful implementation of policies as they inevitably retain some degree of discre-tion (Barnes and Henly 2018; Davis 1969; Gofen 2013;
Hupe and Hill 2007; Lipsky 1980/2010; Maynard-Moody and Musheno 2012). However, the implemen-tation theory has always held contradictory views on the exact role of discretion (Thomann et al. 2016). Top-down perspectives treat deviations from the policy-on-paper as a control problem: room for interpretation makes it increasingly likely that policy means and ends will be mismatched (Howlett 2004: 5). Conversely, bot-tom-up perspectives put frontline workers’ discretion at the center stage of policy implementation (Lipsky 1980/2010; Sabatier 1986). As the above quotation by Elmore illustrates, from this perspective, frontline workers are seen as de facto policy makers. Discretion helps them to tailor a policy to specific circumstances.
Although research has moved on to hybrid, integra-tive frameworks, the discussion surrounding discretion
Downloaded from https://academic.oup.com/jpart/advance-article-abstract/doi/10.1093/jopart/muy024/5048691by gueston 08 July 2018

Journal of Public Administration Research and Theory, 2018, Vol. xx, No. xx2
at the frontline never lost its practical salience for policy design and implementation (Howlett 2004; Hupe 2013; Hupe and Hill 2007). Scholars continue to discuss the reasons why frontline workers use their discretion in more or less beneficial ways for clients and public goals (e.g., Brodkin 2011; Keiser 1999; Maynard-Moody and Musheno 2012; Thomann 2015). However, little attention has been paid to the implicitly assumed link between frontline workers’ dis-cretion and the motivation to implement government policies. This is surprising, given that “research per-formed in ignorance of the understanding that imple-menting actors have about their circumstances is likely to miss important parts of the explanation” (O’Toole 2000: 269).
To explore the motivational effects of discretion, this article draws on the logic of the seminal Thomas theorem: “If men define situations as real, they are real in their consequences.” (Thomas 1928: 572, see also Lewin 1936). We focus on the perceived degree of discretion, instead of the objective degree of discre-tion, and investigate to what extent frontline work-ers experience discretion. We operationalize perceived discretion via the concept of powerfulness as devel-oped in the policy alienation literature (Loyens 2015; Thomann 2015; Tummers 2011; Van Engen et al. 2016; Van der Voet et al. 2017). Hence, powerfulness is seen as discretion-as-perceived by frontline work-ers. We define powerfulness more formally as frontline workers’ perceived influence on decisions concerning the policy. The research question of this article is then: How does powerfulness motivate frontline workers to implement policies?
Psychologists suggest a positive link between powerfulness and motivation (Gagné and Deci 2005). However, scholars studying policy implementation have not found a strong, consistent relation between powerfulness and implementation willingness (Loyens 2015; Thomann 2015; Tummers 2011; Van Engen et al. 2016). Contrary to these previous studies, we rely on an asymmetric explanation of policy implementers’ motivation: the things that motivate people may be different from those that demotivate them (Herzberg et al. 1959; Matzler and Renzl 2007). Accordingly, we study two interpretations of the motivational role of powerfulness. The first interpretation argues that powerfulness is quasi-necessary, although on its own not sufficient to motivate employees (Goertz and Starr 2003; Herzberg et al. 1959; Lammers et al. 2016). The second interpretation is that powerfulness is only moti-vating when the public policy is consistent with the frontline workers’ values (Dias and Maynard-Moody 2007; Grant and Berry 2011; May et al. 2004).
We study these interpretations using two large sam-ples. By doing so, this study makes two contributions
to the literature. It adds to theory by clarifying a core aspect of the top-down versus bottom-up debate: is discretion beneficial for policy implementation? It does so by connecting the policy implementation lit-erature with the motivation theory from Herzberg. Methodologically, it uses state-of-the-art tools specifi-cally designed for capturing the hypothesized asym-metric patterns: large-N set-theoretic configurational comparative analysis using fuzzy sets, combined with formal theory evaluation, measures of uncertainty, and systematic robustness tests (Misangyi et al. 2017; Ragin 2000; Schneider and Wagemann 2012).
In the next section, we will introduce our theoretical framework and the hypotheses. We then introduce our methods, the research design, and the data collected among 1,004 healthcare workers and 1,087 second-ary school teachers in the Netherlands. After pre-senting the results, we conclude and discuss how our results can inform public administration scholars and practitioners.
Theoretical FrameworkThe concept of discretion often serves as an umbrella term for different aspects of bureaucratic practice. In policy implementation research specifically, discretion concerns the extent of freedom that frontline workers have to choose among possible courses of behavior when implementing policies (Davis 1969; Hupe 2013). Top-down approaches emphasize the degree of free-dom granted by a rule maker to an implementing actor (“discretion-as-granted”; Howlett 2004). Contrary to this, bottom-up approaches presuppose an inevitable existence of discretion and analyze how the degree of freedom is actually used by frontline workers (“discre-tion-as-used”; Hupe 2013).
Next to discretion-as-granted and discretion-as-used, there is also a key role for discretion-as-perceived: the degree to which frontline workers perceive to possess discretion. According to the “Thomas theorem”, peo-ple often feel and behave based on their perceptions of reality, not on the basis of reality itself (Thomas 1928). This perspective highlights the importance of policy-related attitudes for frontline policy implementation (Ewalt and Jennings 2004). The Thomas theorem sug-gests that discretion-as-used (Hupe 2013) presupposes discretion-as-perceived. Frontline workers should feel that they have discretion before they can actually use it. For instance, a social worker should feel that she can grant an exception to a rule before actually doing this. Street-level bureaucracy scholars have recently begun to explore “discretion-as-perceived” under the head-ing of “policy powerfulness”, meaning the perceived degree of influence that frontline workers have over shaping a policy during its design and implementation (Tummers et al. 2009). This power may be exercised at
Downloaded from https://academic.oup.com/jpart/advance-article-abstract/doi/10.1093/jopart/muy024/5048691by gueston 08 July 2018
Journal of Public Administration Research and Theory, 2018, Vol. xx, No. xx 3
the strategic, tactical, or operational level. High policy powerfulness thus indicates perceived discretion; the absence of powerfulness (i.e., powerlessness) indicates a lack of perceived discretion.
We can then connect discretion-as-perceived—here conceptualized as policy powerfulness—to implemen-tation willingness. To actually achieve policy goals, frontline workers should be willing to implement the policy (Ewalt and Jennings 2004; Van der Voet et al. 2017). High willingness to implement means that frontline workers intend to put effort in executing the policy. Bottom-up theories assume that discretion is positively linked with successful implementation. Note, however, that what exactly success entails might differ from a bottom-up or top-down view. “Conformance implementation” refers to the degree to which the cen-trally decided blueprint is implemented from top to down (implementation success). From the bottom-up, “performance implementation” means that a policy achieves outcomes that resolve the policy problem at stake (policy success; Barrett and Fudge 1981). Arguably, implementation willingness matters for both conformance and performance implementation.
The positive link between discretion and implemen-tation willingness assumes that policy powerfulness can have a motivational effect on frontline workers. Scholars agree that perceptions can, and often do, influence behavior (e.g., Ajzen and Fishbein 1980). Experiencing powerfulness is one of the main factors stimulating employees’ willingness to support a change (Greenwood et al. 2002). Related to this, the policy alienation framework asserts that, as frontline work-ers’ policy powerfulness increases, their support for a policy can increase as well (Tummers et al. 2009). This powerfulness can be experienced at either the national (strategic), organizational (tactical), and client (opera-tional) level, or a combination of these. For instance, if a frontline worker has the impression that she—or her colleagues or representatives of a professional organi-zation—is able to influence the content of policies at the national level, she is more likely to be motivated to implement the policy (Tummers et al. 2009). This is because it is more likely, then, that frontline workers’ interests and concerns are reflected in the content of the policy.
Next to powerfulness, policy alienation has a mean-ingfulness dimension. Meaningfulness concerns the perception of the frontline worker that the policy is valuable for society in general (societal meaningful-ness) and for the direct clients of the frontline worker (client meaningfulness). Contrary to expectation, in empirical tests, the relation between powerfulness and implementation willingness repeatedly appears either as weaker than between meaningfulness and implementation willingness (Van Engen et al. 2016),
as ambiguous (Loyens 2015; Thomann 2015), or as nonsignificant (Tummers 2011).
In light of these puzzling empirical findings, we suggest two alternative interpretations of the motiva-tional link of powerfulness on implementation willing-ness. Previous research has assumed symmetric effects, where the same change in implementation willingness is expected both when powerfulness is added and when it is taken away. Contrary to this, motivation theory as developed by among else Herzberg et al. (1959, see for recent discussions Bassett-Jones et al. 2005; Matzler and Renzl 2007; Sachau 2007) suggests that the effects of particular motivational factors are asymmetric. It is a fundamental insight from the motivation theory (Herzberg et al. 1959) that the things that motivate people are often different from the things that demoti-vate them. For example, a low salary makes you dissat-isfied. However, a high salary does not automatically make you satisfied. This means that the influence of policy powerfulness might work only, or mainly, in one direction. Thus, the change in implementation willing-ness might not be of the same magnitude or direc-tion when powerfulness is added as when it is taken away. To detect such patterns, an empirical method that models asymmetric effects is needed. This is why we choose a new, set-theoretic method that enables us to model asymmetric explanatory patterns (Misangyi et al. 2017).
Interpretation 1: Policy Powerfulness is a Necessary ConditionThe first interpretation linking powerfulness and implementation willingness builds upon the idea that discretion is a prerequisite for policy success (Matland 1995: 148). If this is the case, then frontline workers need to feel to be able to influence the policy to be will-ing to implement that policy; they need to feel power-ful. Hence, powerfulness is a necessary condition for implementation willingness.
Policy implementation literature, especially the studies rooted in the bottom-up perspective, suggests that an important factor in this willingness of frontline workers is the extent to which organizations are will-ing and able to delegate decision-making authority to the frontline (Meier and O’Toole 2002; Tummers and Bekkers 2014). This influence may be particularly pro-nounced in frontline workers whose expectations of discretion and autonomy contradict notions of bureau-cratic control (Freidson 2001). As we study teachers and healthcare workers, this seems to be particularly important. Maynard-Moody and Portillo (2010: 259) note, “street-level workers rely on their discre-tion to manage the physical and emotional demands of their jobs. They also rely on their discretion to claim some small successes and redeem some satisfaction.”
Downloaded from https://academic.oup.com/jpart/advance-article-abstract/doi/10.1093/jopart/muy024/5048691by gueston 08 July 2018

Journal of Public Administration Research and Theory, 2018, Vol. xx, No. xx4
The enabling role of powerfulness for implementa-tion willingness can be traced back to the human rela-tions movement (McGregor 1960). One of the central tenets of this movement is that employees have a right to give input into decisions that affect their working lives. Employees enjoy carrying out decisions they have helped create—as compared to decisions they have not helped create or were “forced upon them.” As such, the human relations movement argues that when employ-ees experience discretion during their work, this will positively influence several job indicators, such as implementation willingness, loyalty or responsibil-ity, by fulfilling intrinsic employee needs (for more detailed discussions, see for instance Yukl and Becker 2012). This mechanism was already proposed by Follet (1924)—her work presaged the rise of the human rela-tions movement—who underscored the importance of leaders having the capacity to increase the sense of power among those led. So that those led, in turn, would be empowered to achieve desired changes at the organizational, community, or policy level.
The above argumentation suggests that frontline workers need to feel powerful in order to be willing to implement the policy. However, feeling powerful alone may not be sufficient. Many other factors can influ-ence the willingness of frontline workers to implement a particular policy. This can include resources available in the organization (for instance, is there enough man-power available to make a policy work?) or the value of a policy for society and political processes within organizations (e.g., May and Winter 2009; O’Toole 2000; Thomann 2015). Hence, frontline workers need to feel powerful, but feeling powerful is not enough. This asymmetric interpretation accounts for the fact that not all frontline workers will use their discretion to contribute to successful implementation. Contrary to a symmetric effect, we hence expect that discretion-as-perceived has an enabling effect for motivating frontline workers (Goertz and Starr 2003).
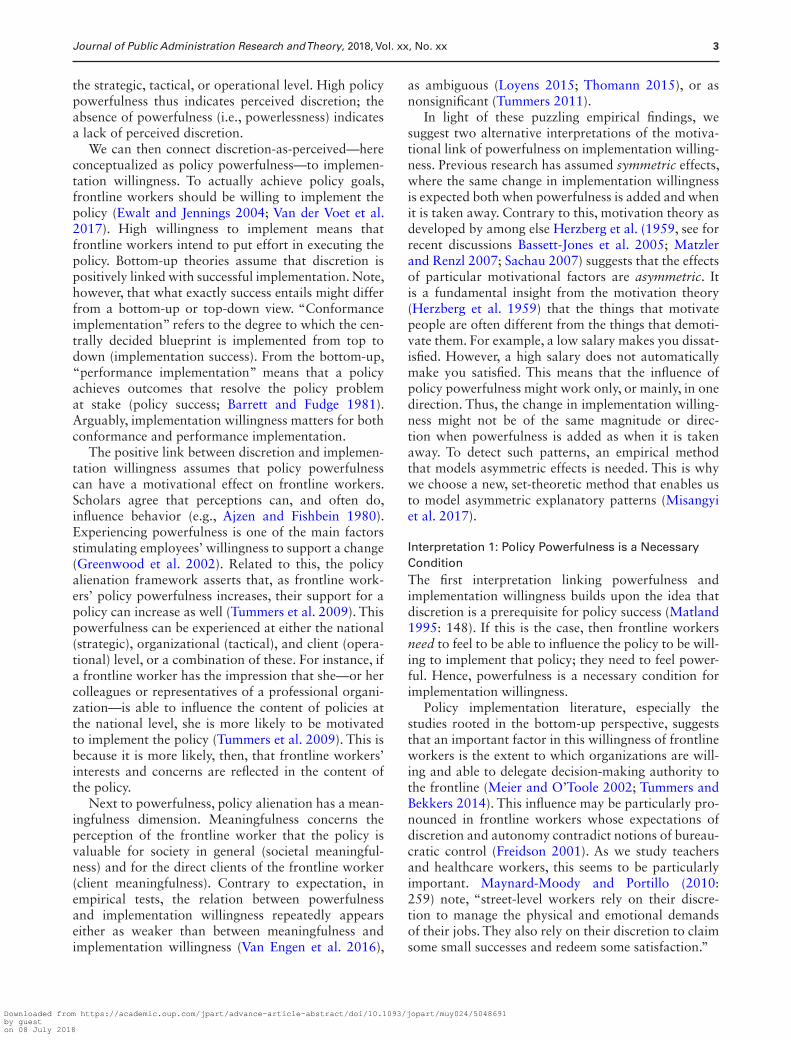
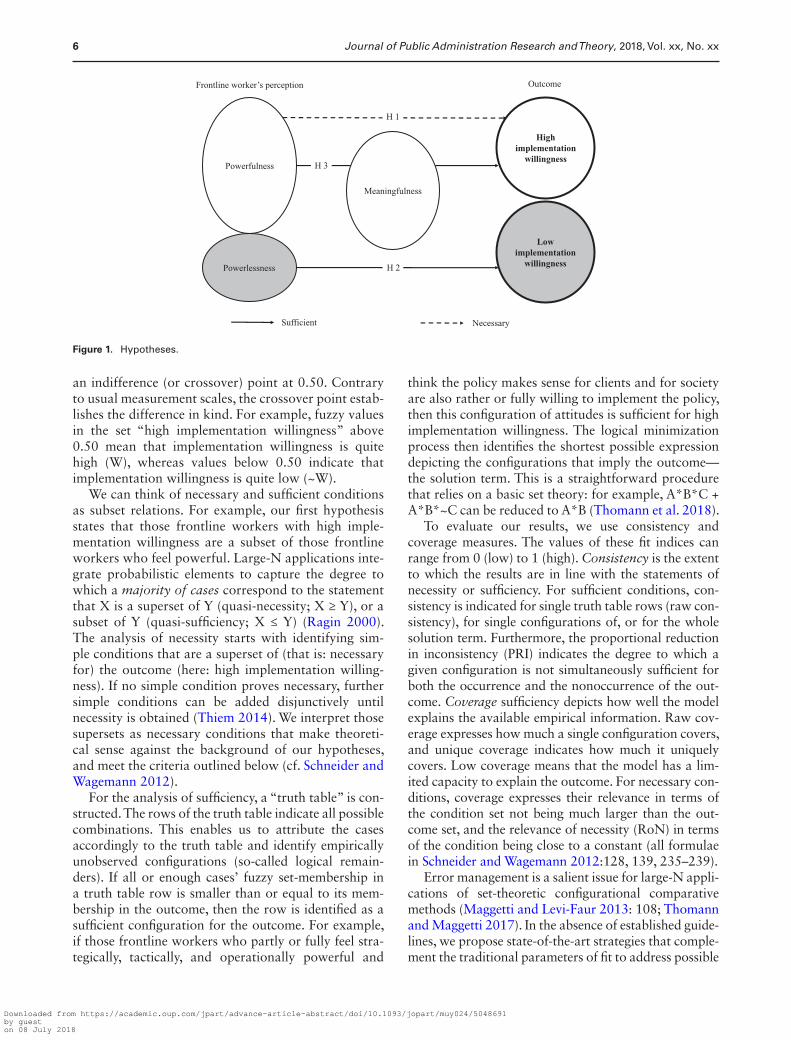
Accordingly, we can derive the first hypothesis. In order to be motivated to implement a public policy, frontline workers need to perceive that they have the power to influence the shaping of a policy program (powerfulness). They should experience this powerful-ness at least at either the strategic, tactical, or operational level in order to feel motivated for policy implementa-tion (Van Engen et al. 2016). Still, this powerfulness does not by definition result in high implementation willingness. Hence, frontline workers with high imple-mentation willingness are a subset of those frontline workers who experience powerfulness. We hypothesize that policy powerfulness (either strategic: SP; tactical: TP or operational: OP) is a quasi-necessary, but not sufficient condition for high implementation willing-ness (W). This is shown in Figure 1. To formalize this
first hypothesis, the backward arrow “←” means “is necessary for” and “+” denotes the logical “OR”.
H1: SP + TP + OP ←W
Similarly, we expect that frontline workers who do not feel powerful are typically unwilling to implement government policies. As Figure 1 illustrates, if high implementation willingness requires the presence of powerfulness, then the frontline workers who do not feel powerful are a subset of those frontline workers with low implementation willingness. Since powerful-ness is indicated by either strategic, tactical, or opera-tional powerfulness (or a combination of these three), all three have to be absent to indicate the absence of powerfulness (Schneider and Wagemann 2012: 82). Our second hypothesis thus states that the absence of the combination of strategic, tactical, and operational powerfulness is quasi-sufficient for low implemen-tation willingness. The “*” sign denotes the logical “AND”, whereas the forward arrow “→” indicates “is sufficient for”. The tilde sign “~” denotes the absence of a factor:
H2: ~SP * ~TP * ~OP → ~W
Interpretation 2: Policy Powerfulness Interplays with Policy MeaningfulnessThe second interpretation takes into account that frontline workers often feel a desire to benefit others with their work (Dias and Maynard-Moody 2007). They seek to help clients achieve long-term success and analyze the perceived added value of a policy for soci-ety. Meaningfulness refers to workers’ perceptions of the contribution a policy makes to a greater purpose, such as societal goals (societal meaningfulness), and the added value of the policy for own clients (client mean-ingfulness) (Tummers et al. 2009). For example, “client meaningfulness” is high when a teacher believes that the policy helps her students to improve their learning outcomes. Meaningful work is of critical importance for frontline workers (Grant and Berry 2011; May et al. 2004) and numerous studies have found a strong and positive correlation between meaningfulness and implementation willingness (Loyens 2015; Tummers 2011; Van Engen et al. 2016; Van der Voet et al. 2017).
The bottom-up view acknowledges that policy changes arise from the interaction of policy and setting and should be consonant with the values of implement-ing agents (Matland 1995). If frontline workers experi-ence discretion, they can tailor the policy to the specific situation of the clients, thereby increasing their percep-tion of its meaningfulness. The implementing actors’ perceptions, in turn, can be decisive for implementa-tion outcomes. In summary, powerfulness adds to meaningfulness, which in turn fosters implementation
Downloaded from https://academic.oup.com/jpart/advance-article-abstract/doi/10.1093/jopart/muy024/5048691by gueston 08 July 2018

Journal of Public Administration Research and Theory, 2018, Vol. xx, No. xx 5
willingness (Lipsky 1980/2010; Matland 1995; Tummers and Bekkers 2014).
Hence, our third hypothesis expects that frontline workers who both feel powerful and perceive the pol-icy as meaningful are willing to implement the policy. This hypothesis does not rule out that high implemen-tation willingness can also result from other factors. As Figure 1 illustrates, it simply assumes that frontline workers who both feel powerful and find the policy meaningful are a subset of the frontline workers who are willing to implement the policy. The combination of policy powerfulness (strategic, tactical, or operational) with policy meaningfulness (societal meaningfulness: SM, or client meaningfulness: CM) is a quasi-sufficient condition for high implementation willingness:
H3: (SP + TP + OP) * (SM + CM) → W
It should be noted that these two interpretations are compatible: powerfulness can be quasi-necessary for implementation willingness (H1) and, in combination with meaningfulness, quasi-sufficient (H3). However, they are not identical: the first interpretation thinks of powerfulness as a prerequisite for implementa-tion willingness (necessity), whereas the second one assumes that powerfulness in situations of meaningful-ness typically results in high willingness to implement (sufficiency). They also represent two different vari-ants of the bottom-up view on discretion-as-perceived. The first interpretation hypothesizes an enabling, but not automatically triggering role of powerfulness for frontline workers’ willingness to implement. The sec-ond interpretation highlights the decisiveness of imple-menting actors’ perceived meaningfulness of policies, and assumes that the degree of policy meaningfulness interacts with policy powerfulness to trigger imple-mentation willingness. We may find that powerfulness enables, but does not always result in implementa-tion willingness (interpretation 1 supported), whereas its combination with meaningfulness is not decisive for implementation willingness (interpretation two rejected)—or vice versa. Finally, we do not rule out that other factors than powerfulness and meaningful-ness influence implementation willingness. Indeed, bot-tom-up perspectives highlights various factors that can impact policy implementation. Furthermore, the effects of motivating factors can differ between individuals and situations. Our goal is to clarify the motivating role of powerfulness for, rather than comprehensively explain, implementation willingness.1 In addition, we identify the empirical relevance of powerfulness and meaningfulness for explaining implementation willing-ness (Sachau 2007: 389).
Methods
Above, we have theorized the role of powerfulness for implementation willingness as an asymmetric and nonlinear effect. Although a variety of techniques can detect nonlinear effects (e.g., polynomials; see also Matzler and Renzl 2007), we use large-N set-theoretic configurational comparative analysis (Ragin 1987, 2000; Schneider and Wagemann 2012). We chose this method as it is the only available technique that mod-els three central theoretical features of our framework (software: R packages QCA and SetMethods; Dusa 2018; Medzihorsky et al. 2016). First, set-theoretic configurational comparative methods are designed to assess subset relations like the ones hypothesized in Figure 1 in terms of necessity and sufficiency. Accordingly, high implementation willingness can have different explanations than low implementation willingness. Second, they also provide the possibility of equifinality, meaning that various scenarios can result in high or low implementation willingness: many (but not all) roads lead to Rome. This allows for motiva-tions to differ between individuals. Third, conjunctural patterns are possible, capturing that case-specific fac-tors affect implementation willingness in combination rather than in isolation (Schneider and Wagemann 2012: 89, 295–305, 307–312). We need this possibil-ity to evaluate our third hypothesis. Set-theoretic con-figurational comparative techniques can be applied to a large-N setting (Fiss 2011). For theory-testing research designs like ours, large case numbers provide for a more robust test of the theory than small sam-ples (Greckhamer et al. 2013; Thomann and Maggetti 2017).
Given that this method is not widely used in pub-lic administration, we shortly explain its rationale (for detailed descriptions, see Fiss 2011; Schneider and Wagemann 2012; Thomann and Maggetti 2017). The set-theoretic method applied focuses on configurations of variables as sets in which cases have membership or not. The attribution of cases to sets is called cali-bration. Fuzzy sets allow us to account for differing degrees to which frontline workers’ perceptions are present. Qualitative anchors determine the stage at which the outcome or condition is deemed fully pre-sent (fuzzy value 1), fully absent (fuzzy value 0), and
1 As Fiss et al. (2013: 195) state: “in a traditional QCA, the notion of “controls” is usually not part of the analysis, as QCA does not consider
isolating and estimating independent effects of causal variables as the central goal of analysis but instead focuses on combinations of causally relevant conditions (…) In contrast, incorporating solutions into a regression analysis would allow QCA researchers to examine whether the solutions identified also hold up when other relevant control variables are entered along with these solutions into a regression model”. We estimated alternative regression models, see Supplementary Appendix II. The results indicate that the relationship between powerfulness and implementation willingness is robust if control variables (age, education level, tenure) are included.
Downloaded from https://academic.oup.com/jpart/advance-article-abstract/doi/10.1093/jopart/muy024/5048691by gueston 08 July 2018
Journal of Public Administration Research and Theory, 2018, Vol. xx, No. xx6
an indifference (or crossover) point at 0.50. Contrary to usual measurement scales, the crossover point estab-lishes the difference in kind. For example, fuzzy values in the set “high implementation willingness” above 0.50 mean that implementation willingness is quite high (W), whereas values below 0.50 indicate that implementation willingness is quite low (~W).
We can think of necessary and sufficient conditions as subset relations. For example, our first hypothesis states that those frontline workers with high imple-mentation willingness are a subset of those frontline workers who feel powerful. Large-N applications inte-grate probabilistic elements to capture the degree to which a majority of cases correspond to the statement that X is a superset of Y (quasi-necessity; X ≥ Y), or a subset of Y (quasi-sufficiency; X ≤ Y) (Ragin 2000). The analysis of necessity starts with identifying sim-ple conditions that are a superset of (that is: necessary for) the outcome (here: high implementation willing-ness). If no simple condition proves necessary, further simple conditions can be added disjunctively until necessity is obtained (Thiem 2014). We interpret those supersets as necessary conditions that make theoreti-cal sense against the background of our hypotheses, and meet the criteria outlined below (cf. Schneider and Wagemann 2012).
For the analysis of sufficiency, a “truth table” is con-structed. The rows of the truth table indicate all possible combinations. This enables us to attribute the cases accordingly to the truth table and identify empirically unobserved configurations (so-called logical remain-ders). If all or enough cases’ fuzzy set-membership in a truth table row is smaller than or equal to its mem-bership in the outcome, then the row is identified as a sufficient configuration for the outcome. For example, if those frontline workers who partly or fully feel stra-tegically, tactically, and operationally powerful and
think the policy makes sense for clients and for society are also rather or fully willing to implement the policy, then this configuration of attitudes is sufficient for high implementation willingness. The logical minimization process then identifies the shortest possible expression depicting the configurations that imply the outcome—the solution term. This is a straightforward procedure that relies on a basic set theory: for example, A*B*C + A*B*~C can be reduced to A*B (Thomann et al. 2018).
To evaluate our results, we use consistency and coverage measures. The values of these fit indices can range from 0 (low) to 1 (high). Consistency is the extent to which the results are in line with the statements of necessity or sufficiency. For sufficient conditions, con-sistency is indicated for single truth table rows (raw con-sistency), for single configurations of, or for the whole solution term. Furthermore, the proportional reduction in inconsistency (PRI) indicates the degree to which a given configuration is not simultaneously sufficient for both the occurrence and the nonoccurrence of the out-come. Coverage sufficiency depicts how well the model explains the available empirical information. Raw cov-erage expresses how much a single configuration covers, and unique coverage indicates how much it uniquely covers. Low coverage means that the model has a lim-ited capacity to explain the outcome. For necessary con-ditions, coverage expresses their relevance in terms of the condition set not being much larger than the out-come set, and the relevance of necessity (RoN) in terms of the condition being close to a constant (all formulae in Schneider and Wagemann 2012:128, 139, 235–239).
Error management is a salient issue for large-N appli-cations of set-theoretic configurational comparative methods (Maggetti and Levi-Faur 2013: 108; Thomann and Maggetti 2017). In the absence of established guide-lines, we propose state-of-the-art strategies that comple-ment the traditional parameters of fit to address possible
Powerfulness
High implementation
willingness
Low implementation
willingness Powerlessness
Frontline worker’s perception
NecessarySufficient
Outcome
Meaningfulness
H 1
H 3
H 2
Figure 1. Hypotheses.
Downloaded from https://academic.oup.com/jpart/advance-article-abstract/doi/10.1093/jopart/muy024/5048691by gueston 08 July 2018

Journal of Public Administration Research and Theory, 2018, Vol. xx, No. xx 7
Table 1. Strategies to Address Errors and Evaluate Models
Issue Definition Strategy Application
Possible error sources
Deviant case and measurement errors
Errors related to sensitivity to one or more flawed cases
Frequency thresholdsrobustness test
Use of three different frequency thresholds; configurations without a certain frequency are treated as logical remainders
Sensitivity to changes in raw consistency levels
Raw consistencyrobustness test
Use of three different raw consistency thresholds (criterion: PRI)
Plausibility and tenability
Limited diversity and contradictions can trigger inferences that are implausible and/or contradictory
Enhanced standard analysis
Intermediate solution, based on directional expectations and exclusion of contradictory rows and untenable assumptions
Criteria for model evaluation
Accuracy Degree to which observations correspond to set relation
Consistency Necessity: ≥ 0.9Sufficiency: ≥0.75
Simultaneous subset relations: degree to which the same condition is not simultaneously sufficient for the negated outcome
Proportional reduction in inconsistency (PRI)
No fixed threshold
Explanatory power
Empirical relevance of model Coverage and relevance of necessity
Necessity: ≥ 0.6RoN ≥ 0.6 (direct calibration) /
0.55 (recoding method)Sufficiency: verbal interpretationLow coverage indicates low
explanatory powerRandom errors Errors that are unpredictable
and inconsistent in their magnitude or direction (e.g., because of estimation and personal factors in surveys)
Probabilistic criteria Right-handed Z-test for proportion of cases with X ≥ X (necessity)/ X ≤ Y (sufficiency)
0.8: “almost always”
Limited empirical diversity
Presence of logical remainders, that is, truth table rows without enough cases with membership >0.5
Limited diversity index% remainders / logically
possible configurations
Models with less limited diversity
have a stronger empirical basis
Ambiguity Patterns in data are unclear: several equally nonredundant solutions can be derived
Ambiguity index(Nr. of equally plausible
models)
Unambiguous models are preferred (row dominance applied)
Robustness Terms of enhanced parsimonious solution remain robust across different models that pass consistency threshold 0.75
Robustness indexAverage % of models in
which (a subset of) a term appears
More robust models are preferred
Skewness Skewed distributions can produce simultaneous subset relations, exacerbate limited diversity, and strongly distort parameters of fit
Skewness statistics % of cases with membership >0.5 in sets is reported
Skewness is problematic if the vast majority (>85%) of the cases cluster in only one of the four possible intersecting areas of the XY plots with two diagonals
Based on Baumgartner and Thiem (2017), Fiss (2011), Maggetti and Levi-Faur (2013), Ragin (2000), Schneider and Wagemann (2012), Skaaning (2011), Thomann and Maggetti (2017).
Downloaded from https://academic.oup.com/jpart/advance-article-abstract/doi/10.1093/jopart/muy024/5048691by gueston 08 July 2018

Journal of Public Administration Research and Theory, 2018, Vol. xx, No. xx8
error sources, as shown in Table 1. To account for differ-ent possible model specifications and to assess robust-ness, we calculated 54 models, using two calibration techniques (see below) and three different raw consist-ency and frequency thresholds. The models presented in the paper rank best on eight criteria for model evalua-tion, see Table 1. The rationale underlying the choice of different analytic thresholds and the “best” models for interpretation is outlined in detail in Box 1.
We assess hypothesis 1 on necessary conditions in Figure 2, see also Table A1, appendix. To assess our hypotheses on sufficient conditions (hypotheses 2 and 3), we apply Ragin’s (1987) principles of formal set-the-oretic theory evaluation, as extended by Schneider and Wagemann (2012) to account for consistency and cov-erage. This procedure identifies the proportion of cases that confirm, refute, or extend our theoretical expecta-tions. To this end, the scenarios expected (T) and those not expected (~T) in the hypotheses were intersected with the scenarios that were empirically (not) observed (S and ~S). This technique helps us answer three ques-tions. First, which parts of the theory are supported by the findings (T*S and ~T*~S)? Second, in which direc-tion should theory be expanded (~T*S)? Third, which parts of the theory need to be dropped (T*~S)? Table 2 summarizes the main analytic steps.
The data, truth tables, directional expectations, conservative and parsimonious solutions, simplifying assumptions, skewness tests, R codes for replication, and the results not reported in the paper are all pro-vided as online Supplementary Material.2
DataWe used two data samples collected in the Netherlands in two sectors (healthcare and education) at two times
2 The online appendix and replication materials are published at data verse, see http://dx.doi.org/10.7910/DVN/G9PYIV.
3 No analysis of sufficiency was possible for dataset 2 using the recoding method, see Supplementary Tables B13 and B20.
Box 1. Procedure for Model Evaluation and Selection, Analysis of Sufficiency
Setting raw consistency thresholds is decisive for determining which conditions are sufficient. Since consistency values strongly depend on the specific dataset, truth table, and case distributions, there are no fixed anchors for setting these thresholds (Schneider and Wagemann 2012; Thomann and Maggetti 2017). Accordingly, using standard-ized thresholds is widely considered bad prac-tice (Wagemann et al. 2016). Therefore, we use a context-sensitive strategy that integrates PRI val-ues for determining raw consistency thresholds. Considering the range of PRI values in a truth table, a context-specific critical PRI value was determined. This procedure ensures that raw consistency is set such that simultaneous subset relations—when the same configuration is considered sufficient for both low and high implementation willingness—are avoided (Schneider and Wagemann 2012). The first raw consistency threshold was set above the first row with a PRI below this critical value; the second threshold was set above the second row with a PRI below that value; and the third threshold, above the third respective row. Hence, the same principle was applied to each analysis, but considering the specificities of the respective truth table.
Supplementary Tables B2–B7 report all resulting models and illustrate their robustness. The “best” models for each dataset, calibration strategy and outcome (high and low implementation willingness) were then identified according to their performance regarding consistency, PRI, coverage, statistical significance, limited diversity, ambiguity, robust-ness, and skewness. These criteria comprehensively capture the main currently discussed challenges to validity with set-theoretic techniques (Thomann and Maggetti 2017; Table 1). The best model is the one whose average rank on each of these indica-tors is the highest amongst those models with a minimum consistency of 0.75. Below this threshold, QCA solutions are usually not considered sufficient (Schneider and Wagemann 2012). The ranking procedure is self-explanatory for consistency, PRI, coverage, Z values, and robustness. Additionally, high levels of limited diversity and model ambigu-ity were punished, by rewarding the lowest levels a ranking of 1; the highest level is attributed the lowest possible rank (eg, 7 if seven models pass the consistency threshold); then the second highest level is attributed the second worst rank, and so on. The motivation for this was that limited diversity poses serious threats to inferences with truth table
analyses (Thomann and Maggetti 2017) and model ambiguities indicate that the results are inconclu-sive (Baumgartner and Thiem 2017).
This left us with six sufficient models, among which the ones with the highest explanatory power (coverage) were preferred for each out-come and dataset, reported in Table 4 and chosen for interpretation.3 This procedure minimizes the weakness of many large-N set-theoretic configu-rational comparative analyses, which often suf-fer from very limited coverage (Wagemann et al. 2016).
Downloaded from https://academic.oup.com/jpart/advance-article-abstract/doi/10.1093/jopart/muy024/5048691by gueston 08 July 2018

Journal of Public Administration Research and Theory, 2018, Vol. xx, No. xx 9
(2010 and 2013). By analyzing these two datasets, we both evaluate whether our hypotheses hold for front-line workers implementing a specific policy (dataset 1), and whether the hypothesized relations hold in another policy sector and from a more general perspec-tive (dataset 2). This allows us to adopt a comparative approach and provides a stronger empirical basis to either accept or reject the hypotheses. Still, in examin-ing two case studies, the possibility to make general claims remains limited. This is acknowledged and will be discussed in the discussion section.
Dataset 1The 2010 study (“study 1”) investigated whether Dutch mental healthcare workers felt alienated from one specific government policy program, namely, the Diagnosis-Related Group (DRG) policy, and their will-ingness to implement this new policy. The DRG policy was developed by the Dutch government as a means to determine the level of financial reward for mental healthcare provision by stipulating a standard rate for each disorder. The sampling frame consisted of 5,199 professionals who were members of two nationwide mental healthcare associations (see Tummers et al. 2012). Using an e-mail and two reminders, 1,317 returns of the questionnaire were received (25% response). The gender composition of the respondents was 66% female. This is consistent with the Dutch average (69%) for mental healthcare professionals. The average age was slightly higher than that of the mental healthcare professional population (48 versus 44). Common reasons for not participating were a lack of time, retirement, change of occupation, or not work-ing with the DRG policy.
Dataset 2The 2013 study (“study 2”) investigated whether Dutch teachers felt alienated from government education poli-cies in general, and the relationship with their general willingness to implement government policies. The sam-pling frame consisted of a nation-wide sample of 2,863 teachers working in secondary education, selected
through the pension fund for all Dutch employees in government and education (ABP) (Van Engen et al. 2016). Using an e-mail and one reminder, 1,096 returns of the questionnaire were received (38% response). On average, the respondents were 51 years old, and 59% were male. Dutch national statistics on secondary school teachers in 2013 have shown that the average age is 46, and 48% are male. In our sample, males were, therefore, somewhat overrepresented, and the respond-ents were on average slightly older than the national average. To rule out a nonresponse bias, we asked the organization managing the sampling frame to analyze whether or not the respondents problematically differed from nonrespondents in terms of variables such as age, gender, and occupation. For instance, the results indi-cated there were no significant differences between the two groups in terms of occupation (respondents with managing responsibilities: 8%; nonrespondents: 9%). They also indicated that the arguments nonrespond-ents gave for not participating usually were “no time”, “forgot the questionnaire”, and “did not open e-mail during response period”. Nevertheless, it is important to highlight that although we argue that our data is fairly representative, it is still possible that some type of response bias could have influenced our results.
Measures
The measures of implementation willingness, pow-erfulness, and meaningfulness were formatted using five-point Likert scales. All measures had adequate Cronbach alphas (ranging between 0.78 and 0.97). Supplementary Table B1 shows all survey items and descriptive statistics for all variables.
In dataset 1, we measured policy powerfulness (stra-tegic, tactical, and operational powerfulness: six indi-cators) and policy meaningfulness (societal: twelve indicators, client: four indicators) for a specific policy using the policy alienation measurement scales of Tummers (2012). In dataset 2, we measured general policy powerfulness (strategic, tactical, and opera-tional powerfulness: six indicators) and general policy
Table 2. Main Steps of the Large-N Set-Theoretic Configurational Comparative Analysis
Step 1 Analysis of necessity (H1) Identify the supersets of high implementation willingness for both datasets, using two calibration strategies
Step 2 Analysis of sufficiency Identify subsets of low and high implementation willingness, using both datasets, two calibration strategies, three different raw consistency thresholds, and three different frequency thresholds
Step 3 Model evaluation, analysis of sufficiency
Identify best-performing model for each outcome, dataset and calibration strategy (criteria see Table 1)
Step 4 Model selection, sufficient conditions
Identify the models with highest explanatory power per dataset and outcome for interpretation
Step 5 Formal set-theoretic theory evaluation (H2 and H3)
Identify how results behave with respect to the hypotheses: which (parts of) the hypotheses are supported, which ones are refuted?
Downloaded from https://academic.oup.com/jpart/advance-article-abstract/doi/10.1093/jopart/muy024/5048691by gueston 08 July 2018

Journal of Public Administration Research and Theory, 2018, Vol. xx, No. xx10
meaningfulness (societal and client: four indicators) using the general policy alienation measurement scales of Van Engen et al. (2016). Implementation willingness was measured using five indicators corresponding to the validated scale by Metselaar (1997). If necessary, we inverted the positive and negative end of the respective scales, so that high scores always indicate high powerful-ness, meaningfulness, and implementation willingness.
CalibrationIndicator variables were calibrated into indicator sets. Set-membership requires a statement about a qualita-tive state: cases are either (more or less) in a set or (more or less) out of a set. The answer categories of Likert scales have a fixed qualitative meaning, which can be directly translated into set-membership scores. For example, if a frontline worker answers “disagree” (score of 2 on 1–5 scale) to the question “In my organi-zation, professionals could take part in conversations regarding the execution of the policy”, then this means that on this item the case “tactical powerfulness” is rather absent, but not totally absent.
The neutral answer (score of 3) poses a conceptual challenge for calibrating set-membership (Wagemann et al. 2016). In Box 2, we discuss in detail the nature of this challenge and how we address it.
In short, we conceive of indifferent values as more out than in of the set. To identify the best calibration strategy, we tested for two different commonly used calibration techniques for Likert scales. First, the direct method of calibration uses a logistic function to fit the raw data in-between the three qualitative set-mem-bership anchors (Schneider and Wagemann, 2012: 35). Using our data, this commonly applied technique results in set-membership scores of 0.05, 0.27, 0.73, and 0.95; indifferent answers were coded as “fully out”. Second, we alternatively treated the answers as a scale using a simple recoding technique. This tech-nique involves the grouping of cases into previously defined set-membership scores (Emmenegger et al. 2014; Schneider and Wagemann 2012), see Table 3 for an example. Based on assessment of their performance (see Supplementary Boxes B1 and B2), we adopted the recoding method for dataset 1 and the direct calibra-tion method for dataset 2 for the results interpreted below (see Supplementary Tables B2–B7). Both strate-gies attribute the same values on the Likert scale as more in / more out of the set, resulting in the same conceptual meaning, but different parameters of fit.
Missing values make it impossible to attribute cases to truth table configurations. This is a potential issue since a high share of cases has missing values on at least one indicator set in dataset 1. This is due to the fact that we gave the possibility to indicate “don’t know” for each item in dataset 1 and doing this on
one out 39 items already indicates a missing value (60% in dataset 1, 7.8% in dataset 2). Excluding these cases from the analysis would result in a biased sample.
The aggregation strategy will affect the analysis. It needs to avoid such excessive dropout, whereas ensur-ing construct validity and avoiding overly skewed condition and outcome sets. The first out of three aggregation options would be building averages across the indicators. Doing so for raw values would nega-tively affect construct validity: the inclusion of neu-tral answers (score 3) leads to average values that are difficult to interpret especially since they are numer-ous. Calculating averages of calibrated sets is equally
Box 2. Procedure to Test for Different Calibration Strategies
The neutral answer (score of 3) poses a concep-tual challenge for calibrating set membership. Neutral answers could indicate that a frontline worker experiences neither the presence nor the absence of, say, tactical powerfulness (point of indifference). However, cases with a set mem-bership score of 0.5 cannot be attributed to truth table rows, which results in excessive dropout rates and should therefore be avoided (Wagemann et al. 2016). Although Likert scales are typically acknowledged to represent ordi-nal rather than interval-level data (Wirth and Edwards 2007), the status of neutral answers in the scale and hence also in the set can be dis-puted. One possible interpretation is that the answer “neither agree nor disagree” indicates less agreement than “rather agree”, but more agreement than “rather disagree”—we can treat the answers as scale. However, another possible interpretation is that “neither agree nor disa-gree” indicates both “no agreement” as well as “no disagreement”—in other words, no pres-ence, of, say, powerfulness at all. Hence, these cases would in fact be “fully out” of the set of, for example, tactical powerfulness.
Different calibration techniques can substan-tially affect the results of set-theoretic configura-tional comparative analyses (Skaaning 2011). To identify the best calibration strategy, we tested for two different commonly used calibration tech-niques for Likert scales. First, the direct method of calibration uses a logistic function to fit the raw data in-between the three qualitative set member-ship anchors (Schneider and Wagemann, 2012: 35). This method is very popular in large-N set-theoretic configurational comparative analyses.
Downloaded from https://academic.oup.com/jpart/advance-article-abstract/doi/10.1093/jopart/muy024/5048691by gueston 08 July 2018

Journal of Public Administration Research and Theory, 2018, Vol. xx, No. xx 11
problematic because it can result in set-memberships of 0.5, producing dropouts during truth table analysis. The second and third options are set-theoretic. Using the logical AND as aggregation strategy (minimum rule) represents a very restrictive conceptualization, as all indicators need to be present simultaneously for an attitude to be present. This results in the excessive dropouts. Moreover, it would produce highly skewed
sets that make it impossible to proceed with the analy-sis of the outcome (Schneider and Wagemann 2012: 244–251). For example, in dataset 1, none of the aggregated sets would have more than 5% cases with membership above 0.5.
Accordingly, as the third and in our view superior option, we use the logical “OR” to aggregate the indi-cators into the five condition sets. This aggregation strategy conceives of different indicators as functional equivalents that indicate the presence of an attitude (Goetz and Starr 2003). For instance, it suffices for a frontline worker to have a score on one of the five indicator sets for “Willingness” (“W”) to obtain a value for “W” (maximum rule). This “optimistic” measure lowers the dropout problem (final N for data-set 1 = 1,004, dropout 23.8%; for dataset 2 = 1,087, dropout 0.8%) and produces acceptable levels of skewness that enable an analysis of the outcome. This has consequences in terms of concept validity: the pos-itive memberships in sets represent a wider range of functionally equivalent attitudes, which are assumed to represent the concept. This conceptualization does justice to the wide range of experiences facing front-line workers on the ground.
Results
We can now evaluate the hypotheses. Supplementary Table B1 displays descriptive statistics. They show that, overall, the Dutch teachers (study 2) have a more positive attitude than the healthcare workers (study 1). They feel more powerful, perceive the policies as more meaningful, and have higher implementation willingness.
Regarding hypothesis 1, we indeed found that feel-ings of powerfulness are almost always necessary for high implementation willingness. This holds for both datasets and regardless of the calibration strategy used (see Table A1, appendix). This is shown in Figure 2. In the Dutch education sector, either strategic, tactical, or operational powerfulness is needed for high imple-mentation willingness. Among Dutch healthcare work-ers, the finding is even stronger: it is enough for high implementation willingness to either feel powerful at the strategic or operational level, or alternatively, to feel powerful at the operational or tactical level. These results provide strong support for the hypothesis that powerfulness at different levels is a prerequisite for implementation willingness.
Hypothesis 2 captured a potential consequence of the first hypothesis, namely, that a lack of powerful-ness might be quasi-sufficient for low implementation willingness. Table 4 reveals three configurations in dataset 1, and five configurations in dataset 2, that are almost always sufficient for low implementation will-ingness. The Dutch health workers who are unwilling
Typically, the crossover point is set right above the indifferent answers, resulting in set memberships extremely close to 0.5 that can hardly be inter-preted in conceptual terms. As Wagemann et al. (2016: 5) point out: “This is arbitrary and should not become common practice. (…) [it] does not have much to do with a decision about set mem-bership”. To avoid this pitfall, we interpret neu-tral answers as “fully out” of the set (the cases remain in the sample, but they have a set member-ship of 0). Answers of 4 (agree) and 5 (fully agree) were recoded into 3 and 4 before calibration (for thresholds see caption of Supplementary Table B1). Second, we alternatively treated the answers as a scale using simple recoding technique, which involves the grouping of cases into previously defined set-membership scores (Schneider and Wagemann 2012: 35). Here, we followed the pro-posal by Emmenegger et al. (2014: 8) (and slightly adapted it to account for degrees of nonmember-ship) and used the calibration anchors shown schematically in Table 3.
Our results indicate that in the analysis of suf-ficiency, the recoding method works better for dataset 1 (the models perform better and explain more cases), while for dataset 2, the direct strat-egy is more feasible—recoding method leads to distorted parameters of fit that prevent a mean-ingful analysis of sufficiency (see Supplementary Tables B13 and B20). Importantly, however, both calibration strategies attribute indifferent answers as more out than in the set, resulting in the same conceptual meaning and attribution of cases to truth table rows. The differences in the results are thus exclusively due to changes in the parameters of fit. The results of necessity are robust regard-less of the calibration strategy. Using the direct strategy for dataset 1 for sufficient conditions leads to the same overall conclusions regarding our hypotheses as with the indirect strategy. For these reasons, we adopted the recoding method for dataset 1 and the direct calibration method for dataset 2 for the results interpreted below (see Supplementary Tables B3, B4, B6, and B7).
Downloaded from https://academic.oup.com/jpart/advance-article-abstract/doi/10.1093/jopart/muy024/5048691by gueston 08 July 2018

Journal of Public Administration Research and Theory, 2018, Vol. xx, No. xx12
to implement the DRG policy consistently experience low levels of powerfulness and, in path 3, meaningful-ness. Conversely, in the education sector, the picture is less clear at first sight: these configurations entail a mix of both positive and negative attitudes. The parame-ters of fit score well in dataset 1, whereas in dataset 2, the results are highly consistent, but have a fairly low empirical relevance (coverage).
Using set-theoretic theory evaluation to assess H2 formally, we find robust support that the absence of tactical, strategic, and operational powerfulness implies low implementation willingness in the health-care sector. This is shown in Table 5. However, quite some cases remain unexplained (lower right quadrant).
In addition and compatible to what we hypothesized, the absence of operational, but not also tactical and strategic powerfulness in some situations also leads to low implementation willingness (lower left quadrant). Conversely, in the education sector, overall the empiri-cal support for the second hypothesis is so weak that we must reject it. The contradictory cases are empiri-cally more frequent than those instances that directly support the hypothesis (left-hand side of Table 5). Here, the solution term only explains a tiny frac-tion of the observed patterns of low implementation willingness.
Overall, the conclusion for H2 is ambiguous. Although powerfulness is a quasi-necessary condition for high willingness, the “flipside” of this argument materializes in the healthcare, but not in the educa-tional sector. Although seemingly puzzling, this finding illustrates that the things that motivate people at the workplace can be different from those that demotivate them (see also Schneider and Wagemann 2012: 42–54, 82–83).
The third hypothesis states that the combination of policy powerfulness (strategic, tactical, or opera-tional) and policy meaningfulness (societal or client meaningfulness) is a quasi-sufficient condition for high implementation willingness. Table 4 indeed suggests that the combination of high powerfulness and mean-ingfulness relate to high implementation willingness. Four configurations are very often sufficient for high
Table 3. From Likert Scale to Indicator Sets: An Example of Recoding Method
Likert scoreSurvey question: “I intend to put effort into achieving the goals of the DRG policy”
Indicator fuzzy set scoreSet: “High implementation willingness, indicator 2”
Completely agree (5) Highly willing (1)Agree (4) Mostly but not highly
willing (0.8)Neutral (3) Rather unwilling (0.4)Disagree (2) Mostly but not fully
unwilling (0.2)Completely disagree (1) Fully unwilling (0)
Figure 2. Evaluation of Hypothesis 1.
Downloaded from https://academic.oup.com/jpart/advance-article-abstract/doi/10.1093/jopart/muy024/5048691by gueston 08 July 2018

Journal of Public Administration Research and Theory, 2018, Vol. xx, No. xx 13
Tab
le 4
. S
uffi
cien
t C
on
dit
ion
s fo
r Im
ple
men
tati
on
Will
ing
nes
s (I
nte
rmed
iate
So
luti
on
), B
est-
Perf
orm
ing
Mo
del
s
Hyp
othe
sis
2: L
ow im
plem
enta
tion
will
ingn
ess
(~W
)H
ypot
hesi
s 3:
Hig
h im
plem
enta
tion
will
ingn
ess
(W)
Dat
aset
1R
ecod
ing
met
hod
Dat
aset
2D
irec
t ca
libra
tion
Dat
aset
1R
ecod
ing
met
hod
Dat
aset
2D
irec
t ca
libra
tion
Con
figur
atio
n1
23
12
34
51
23
41
23
Hig
h st
rate
gic
pow
erfu
lnes
sSP
○○
○○
●●
○●
●
Hig
h ta
ctic
al p
ower
fuln
ess
TP
○○
○○
●●
●●
Hig
h op
erat
iona
l po
wer
fuln
ess
OP
○○
○○
○●
○●
●○
●
1 H
igh
soci
etal
m
eani
ngfu
lnes
s SM
○○
○●
●●
●●
●●
2 H
igh
clie
nt
mea
ning
fuln
ess
CM
○●
●●
○○
●●
●●
●
Con
sist
ency
0.86
50.
855
0.85
80.
872
0.87
30.
883
0.88
30.
881
0.90
90.
935
0.94
20.
942
0.93
90.
936
0.93
8R
aw c
over
age
0.52
50.
531
0.57
30.
487
0.47
50.
419
0.42
60.
442
0.48
80.
451
0.35
00.
313
0.40
90.
396
0.41
5U
niqu
e co
vera
ge0.
010
0.01
70.
037
0.01
20.
013
0.00
10.
006
0.01
20.
046
0.00
80.
022
0.01
30.
005
0.00
60.
007
Solu
tion
con
sist
ency
0.81
8*0.
826*
*0.
890*
**0.
935*
**So
luti
on P
RI
0.62
70.
360
0.72
70.
841
Solu
tion
cov
erag
e0.
640
0.56
70.
565
0.43
6
Thi
s Ta
ble
show
s th
e co
mbi
nati
ons
of c
ondi
tion
s (p
aths
) th
at w
ere
quas
i-su
ffici
ent
for
low
impl
emen
tati
on w
illin
gnes
s (l
eft-
hand
sid
e) a
nd h
igh
impl
emen
tati
on w
illin
gnes
s (r
ight
-han
d si
de).
Bla
ck c
ircl
es i
ndic
ate
the
pres
ence
of
a co
ndit
ion,
and
whi
te c
ircl
es i
ts a
bsen
ce. B
lank
spa
ces
indi
cate
the
irr
elev
ance
of
a co
ndit
ion.
The
dif
fere
nt p
aths
of
one
mod
el a
re i
nter
chan
geab
le. F
or
exam
ple,
in
data
set
one,
low
str
ateg
ic p
ower
fuln
ess
wit
h lo
w o
pera
tion
al p
ower
fuln
ess
typi
cally
led
to
low
im
plem
enta
tion
will
ingn
ess
(pat
h 1)
; al
tern
ativ
ely,
low
ope
rati
onal
pow
erfu
lnes
s co
mbi
ned
wit
h fe
elin
gs o
f cl
ient
and
soc
ieta
l mea
ning
less
ness
als
o ty
pica
lly d
id (
path
3).
Tabl
e 1
expl
ains
the
par
amet
ers
of fi
t. Fo
r ra
w c
onsi
sten
cy t
hres
hold
s, f
requ
ency
thr
esho
lds
and
sim
plif
ying
ass
umpt
ions
app
lied,
see
Sup
plem
enta
ry T
able
s B
10, B
11, B
12, B
16, B
17, B
18,
and
B19
.*S
igni
fican
t at
0.1
leve
l, **
sign
ifica
nt a
t 0.
05 le
vel,
***s
igni
fican
t at
0.0
1 le
vel (
“alm
ost
alw
ays
suffi
cien
t”).
All
sing
le p
aths
are
sig
nific
antl
y su
ffici
ent
at t
he 0
.01
leve
l.
Downloaded from https://academic.oup.com/jpart/advance-article-abstract/doi/10.1093/jopart/muy024/5048691by gueston 08 July 2018

Journal of Public Administration Research and Theory, 2018, Vol. xx, No. xx14
implementation willingness in the Dutch healthcare sector, and three are almost always sufficient config-urations in the education sector. For example, Dutch healthcare workers who feel powerful at the strategic and tactical level and to whom the DRG policy makes sense for the patients typically make efforts to imple-ment the policy. Both models have a good consistency, whereas its explanatory power (coverage) is quite low in the education sector. The left-hand side and lower right quadrant of Table 6 lend full support to our third hypothesis. Powerfulness, in one of its three variants, combined with meaningfulness almost always results in high implementation willingness. This support is empirically stronger in study 2 (education) than in study 1 (healthcare).
However, findings also restrict the hypothesis to cer-tain circumstances. For example, the upper left quad-rant of Table 6 shows that in the healthcare sector,
the positive motivational role of tactical powerfulness together with meaningfulness often unfolds even in the absence of either strategic or operational powerful-ness. In the education sector, regardless of the type of powerfulness typically both societal and client mean-ingfulness must be present. Conversely, the instances in which hypothesis 3 is rejected both datasets are negli-gibly rare (upper right quadrant).
In summary, both bottom-up interpretations (H1 and H3) of how perceived discretion motivates front-line workers are indeed reflected in our data. H2 is supported for the first dataset but rejected for the second. However, for the second interpretation, there is also room for improvement, as quite some cases are not explained (23.4% in dataset 1 and 41.7% in dataset 2 point to overlooked explanations). This is not particularly high, as we aimed to explain willing-ness with just a few indicators and the unexplained
Table 5. Evaluation of Hypothesis 2
Empirics
Detected in solution Not detected in solution
Theory Hypothesized ~SP*~TP*~OP + SP*~TP*~OP *~SM*~CM
~SP*~TP*~OP *~SM*CM + ~SP*~TP*~OP*CM
14.1 % / 0.1 % (~W): support theory4.8 % / 0.6 % (W): contradict
theory & solution
Empty set
~SP*~TP*~OP *~CM + SP*~TP*~OP *~SM*~CM
0 % / 4.5% (~W): support theory0 % / 6.6 % (W): delimit theory
Not hypothesized ~OP*(SP*~TP + SP*~SM*~CM + ~SP*TP + TP*~SM*~CM)
~SP*OP*~SM*CM + ~SP*~TP*OP*SM*~CM + SP*~OP*~SM*CM + SP*~TP*~OP*SM*~CM + TP*~OP*~SM*CM + ~SP*TP*~SM*CM
14 % / 1.4 % (~W): extend theory8 % / 2.9 % (W): empirical
contradictions
OP + SP*TP*OP*CM + SP*TP*OP*SM + SP*OP + SP*TP*CM + SP*TP*SM + TP*OP
OP*~SM*~CM + TP*OP*~CM + OP*SM*CM + SP*OP + SP*OP*SM*CM + TP*OP*SM + SP*~SM*~CM + SP*TP*~CM + SP*SM*CM + SP*TP*SM + ~SP*TP*~OP*~CM + TP*~SM*~CM + TP*~CM + TP*OP*SM*CM + SP*TP*OP + SP*TP*SM*CM + TP*SM
28.5 % / 21.6 % (~W): point to overlooked explanations
30.6 % / 62.3 % (W): support theory
Supports theory Extends theory Delimits theory
Based on Schneider and Wagemann (2012: 301).Bold: hypothesized combinations. No italics: dataset 1 (recoding method), italics: dataset 2 (direct calibration).Hypothesis 2: ~SP*~TP*~OP → ~W.This table shows how the results behave with respect to hypothesis 2. The upper left quadrant shows those attitudes that were both hypoth-
esized and observed with a set-membership > 0.5. The lower left quadrant displays those attitudes that were not expected, but observed empir-ically, revealing additional explanations for low implementation willingness. The upper right quadrant refers to attitudes that were expected but not observed in the solution. The lower right quadrant displays those attitudes that are neither hypothesized nor covered by the solution.
We indicate the percentage of all cases that display these attitudes with different levels of implementation willingness, and what that means for interpreting the results. For example, in the upper left quadrant, those frontline workers that display these attitudes and have low imple-mentation willingness support the hypothesis; those that have high implementation willingness are “contradictions”, that is, they separate the quasi-sufficient results from perfect sufficiency.
Downloaded from https://academic.oup.com/jpart/advance-article-abstract/doi/10.1093/jopart/muy024/5048691by gueston 08 July 2018

Journal of Public Administration Research and Theory, 2018, Vol. xx, No. xx 15
variance is quite low. In field studies in social sciences, we should not expect a perfect theory explaining everything. It suggests that powerfulness combined with meaningfulness is only one of several factors that explain frontline workers’ high implementation willingness.
Discussion
The main conclusion of our study is that discretion-as-perceived is a quasi-necessary condition for high imple-mentation willingness. This aligns with Herzberg’s motivation theory and suggests an enabling (but not
automatically triggering) motivational effect of per-ceived discretion (Goertz and Starr 2003; Herzberg et al. 1959). Frontline workers need to feel that they can influence the policy—this is a necessary condition.
Secondly, we have found mixed evidence for the hypothesized more radical “flipside” of the first inter-pretation. This result resonates with a classic insight from Herzberg’s motivation theory: the things that make people feel satisfied and motivated on the job can be different in kind from the things that make them feel dissatisfied—and this can obviously vary between policy sectors and types of professions (Bassett-Jones et al. 2005; Herzberg et al. 1959; Sachau 2007).
Table 6. Evaluation of Hypothesis 3
Empirics
Detected in solution Not detected in solution
Theory Hypothesized SP*SM*(TP*CM + TP*~OP) + SP*CM*(OP + TP + TP*~OP*SM) + TP*CM* (OP*SM + OP) + OP*SM*(CM + SP*TP*CM + ~SP*TP) + OP*CM + OP*CM*(SP*TP + ~SP*TP*SM + SP* SM)
OP*SM*CM + SP*OP*SM*CM + TP*OP*SM*CM + SP*SM*CM + SP*TP*SM*CM + TP*SM*CM
9.7 % / 15.7 % (W): support theory4.4 %/ 1.2 % (~W): contradict
theory & solution
SP*SM*(OP*~CM + + ~TP*~CM + ~TP*~OP + TP*OP*~CM) + SP*~TP*~OP*CM + ~TP*OP*SM*~CM + ~SP*TP*~OP*SM + ~SP*TP*~OP*CM
OP*SM*~CM + OP*~SM*CM + SP*SM*~CM + SP*~SM*CM + TP*SM*~CM + TP*~SM*CM
10.3% / 15 % (W): support theory
6.3 % / 4.3 % (~W): delimit theory
Not hypothesized Empty set
Empty set
~SP*~TP*~OP*~CM + ~SP*~TP*~OP + ~SP*~TP*~OP*~SM + ~SM*~CM + ~SP*~OP*~SM*~CM + ~TP*~OP*~SM*~CM
~SP*~TP*~OP*~CM + ~SP*~TP*~OP + ~SP*~TP*~OP*~SM + ~SM*~CM + ~SP*~TP*~OP*~SM*~CM
23.4 % / 41.7 % (W): point to overlooked explanations
46 % / 22.1 % (~W): support theory
Supports theory Extends theory Delimits theory
Based on Schneider and Wagemann (2012: 301).Bold: hypothesized combinations. No italics: dataset 1 (recoding method), italics: dataset 2 (direct calibration).Hypothesis 3: OP*SM + OP*CM + SP*SM + SP*CM + TP*SM + TP*CM → W.This table shows how the results behave with respect to hypothesis 3. The upper left quadrant shows those attitudes that were both hypoth-
esized and observed with a set-membership > 0.5. The lower left quadrant displays those attitudes that were not expected, but observed empir-ically. The upper right quadrant refers to attitudes that were expected but not observed in the solution. The lower right quadrant displays those attitudes that are neither hypothesized nor covered by the solution.
We indicate the percentage of all cases that display these attitudes with different levels of implementation willingness, and what that means for interpreting the results. For example, in the upper left quadrant, those frontline workers that display these attitudes and have high imple-mentation willingness support the hypothesis; those that have low implementation willingness are “contradictions”, that is, they separate the quasi-sufficient results from perfect sufficiency.
Downloaded from https://academic.oup.com/jpart/advance-article-abstract/doi/10.1093/jopart/muy024/5048691by gueston 08 July 2018
Journal of Public Administration Research and Theory, 2018, Vol. xx, No. xx16
Thirdly, we also found that—in combination with policy meaningfulness—powerfulness is quasi-suf-ficient for high implementation willingness. When frontline workers felt that they had both high pow-erfulness and that the policy was meaningful for soci-ety, this strengthened their willingness to implement it (Maynard-Moody and Musheno 2012; Van der Voet et al., 2017).
Our results encourage scholars to rethink assump-tions of implementation theory by moving from a cor-relational logic to the consideration of asymmetric patterns. By adapting Herzberg et al.’s (1959) seminal, fundamentally asymmetric two-factor theory of moti-vation to the context of frontline implementation, we are able to refine policy implementation theory. The important role of powerfulness could be uncovered by modeling asymmetric effects via a methodology specifically designed to test these (Ragin 1987, 2000; Schneider and Wagemann 2012). Our analysis sheds more light on the puzzling results of previous stud-ies, which assumed symmetric, correlational patterns (Tummers 2011; Van Engen et al. 2016). The strong and robust asymmetric effect of powerfulness that we detected simply escaped the attention of these stud-ies because their designs are unable to detect such asymmetric relationships (Schneider and Wagemann 2012). This has helped us to identify discretion-as-perceived as a necessary prerequisite for high imple-mentation willingness. Accordingly, implementation theory might fruitfully turn toward more asymmetric and complexity-oriented models of policy in practice (Misangyi et al. 2017; Raab et al. 2015; Thomann et al. 2018).
A number of caveats apply for this study. First, apart from powerfulness and meaningfulness, addi-tional factors such as caseloads, interactions, and resources influence frontline workers’ implementa-tion willingness (e.g., May and Winter 2009; O’Toole 2000; Sabatier 1986). Second, although we analyzed two large-N datasets, we should be careful to gen-eralize these findings to frontline workers in other policy domains or countries. Third, whereas applying an “optimistic” measure of our dependent and inde-pendent variables helped us reducing dropout and countering the skewness of the data, future research should study whether our results also hold applying “pessimistic” measures, ideally using large datasets in multiple sectors and countries where cases with miss-ing values can be completely deleted from the dataset. Fourth, although there is a fairly strong correlation between intended behavior and actual behavior (Armitage and Connor 2001; Randall and Wolf 1994; Sheeran and Orbell 1988), future studies could meas-ure behavior more directly. Fifth, it should be noted
that common method bias could be a problem in our study, since we used the same data source to measure the variables under study (powerfulness, meaningful-ness, implementation willingness). It is recommended that future researchers studying the relationship between powerfulness and implementation willing-ness apply stronger designs and techniques to estab-lish causal inference. We recommend the use of field, lab, or survey experiments.
Conclusion
Despite the fundamental theoretical debate on the role of discretion and its relevance for policy design and implementation, to date, there has been little empirical research to assess the behavioral assump-tions underlying this debate. Our study is the first large-N empirical illustration lending robust support to a bottom-up view on discretion as an inevitable and potentially beneficial aspect of frontline imple-mentation. We find that possibilities to participate in and influence public policies are a prerequisite for frontline workers to be willing to implement the policy. However, this is not enough. It is not suffi-cient. Other factors—including perceiving the policy as meaningful for society and clients—are needed to truly increase the willingness to implement of front-line workers.
Our study contributes to clarifying the behavio-ral underpinnings of the top-down versus bottom-up debate on discretion (Hupe 2013; Sabatier 1986; Thomann et al. 2016). The question whether frontline workers should be granted discretion continues to be hotly debated not only in research on policy imple-mentation, but also on policy, regulatory, and organi-zational design (e.g., Chun and Rainey 2005; Howlett 2004). Our findings lend substantial support to a bot-tom-up view of street-level bureaucrats as problem-solvers who crucially need the freedom to adapt the program to local conditions. Conversely, they lend very little support to top-down assertions that high levels of discretion often or predominantly have a negative impact on policy implementation—at least not at the perceived, motivational level.
The link between implementation willingness and actual implementation behavior—which was not ana-lyzed here—will continue to provide fertile grounds for further exploration (see e.g., Brodkin 1997; Chun and Rainey 2005; Gofen 2013). Committed implementers are a crucial factor for successful policy implementa-tion (May and Winter 2009). Our contribution lies in showing that the overwhelming majority of those frontline workers with high implementation willing-ness also experience high levels of discretion. This
Downloaded from https://academic.oup.com/jpart/advance-article-abstract/doi/10.1093/jopart/muy024/5048691by gueston 08 July 2018

Journal of Public Administration Research and Theory, 2018, Vol. xx, No. xx 17
should encourage scholars and practitioners to move beyond the question whether frontline workers should be granted discretion: our answer to this question is yes.
The more salient question seems to be how to make best use of frontline workers’ discretion to encourage behavior that eventually contributes to the achievement of policy goals. Discretion appears as a defining contextual feature of street-level bur-eaucratic work that changes the daily experiences shared by frontline workers. This emphasizes the importance of future research that singles out how a context of more or less discretion affects frontline workers’ actual behavior, and under which specific circumstances.
Finally, systematic comparative empirical assess-ment of street-level bureaucracy theory like ours demonstrate the potential of large-N comparisons over different policy contexts to facilitate theoretical progress in this field (O’Toole 2000). A micro-level
perspective is useful to evaluate the underlying psy-chology and mechanisms of frontline implementation (Grimmelikhuijsen et al. 2017). It provides valuable information to policymakers and managers engaged in shaping the macro- and meso-level contexts of street-level bureaucracy, in their continuous quest to improve public service delivery.
SUPPLEMENTARY MATERIAL
Supplementary material is available at the Journal of Public Administration Research and Theory online (https://academic.oup.com/jpart/).
ReferencesAjzen, Icek, and Martin Fishbein. 1980. Understanding attitudes and predict-
ing social behavior. Englewood Cliffs, NJ: Prentice Hall.Armitage, Christopher J., and Mark Conner. 2001. Efficacy of the theory
of planned behaviour: A meta‐analytic review. British Journal of Social Psychology 40:471–99.
Appendix
Table A1. Analysis of necessity
Condition
High implementation willingness (W)
Consistency Coverage RoN Z
Dataset 1 (healthcare) TP + OP 0.903 0.619 0.61 8.3***SP + OP 0.908 0.614 0.60 8.5***OP + SM + CM 0.902 0.636 0.64 8.2***SP + TP + SM 0.902 0.621 0.61 8.1***TP + OP 0.917 0.679 0.57 6.6***SP + OP 0.924 0.678 0.56 7.5***SP + TP + SM 0.918 0.681 0.57 6.7***~OP + SP + SM 0.904 0.674 0.57 4.4***OP + SM + CM 0.912 0.698 0.61 6.3***
Dataset 2 (education) TP + ~OP + CM 0.912 0.771 0.62 2.6***TP + ~OP + SM 0.915 0.768 0.61 2.7***SP + ~TP + OP 0.903 0.765 0.61 1.8**SP + TP + OP 0.908 0.76 0.60 2.7***~SP + ~TP + OP + CM 0.904 0.769 0.62 1.3*~SP + ~TP + OP + SM 0.919 0.769 0.61 2.3***~SP + TP + SM + CM 0.91 0.767 0.61 1.9**SP + ~TP + ~OP + SM 0.905 0.764 0.61 1.5*SP + TP + SM + CM 0.904 0.771 0.63 2.4***SP + TP + OP 0.927 0.818 0.57 2.7***
Conditions meeting consistency threshold 0.90, coverage threshold 0.60, Relevance of Necessity (RoN) threshold 0.60 (direct calibration) / 0.55 (recoding method), significance level 0.1 (“almost always necessary”).
***significant at 0.01 level.**significant at 0.05 level.*significant at 0.1 level.Italics: Direct calibration, No italics: recoding method.Bold: results relevant for hypothesis 1.This table shows the consistency, coverage and relevance values of those conditions that meet the consistency, coverage, RoN and signifi-
cance thresholds for necessity. Only if these criteria are met, we say a condition is necessary. Marked bold are those necessary conditions that provide support for hypothesis 1. The other conditions should be seen as alternatives to the ones marked bold that are not of analytic interest for evaluating our hypothesis. Hypothesis 1 would be falsified if no combination indicating the presence of powerfulness was necessary for high implementation willingness.
Downloaded from https://academic.oup.com/jpart/advance-article-abstract/doi/10.1093/jopart/muy024/5048691by gueston 08 July 2018

Journal of Public Administration Research and Theory, 2018, Vol. xx, No. xx18
Barnes, Carolyn Y., and Julia R. Henly. 2018. “They are underpaid and under-staffed”: How clients interpret encounters with street-level bureaucrats. Journal of Public Administration Research and Theory 28:165–81.
Barrett, Susan, and Colin Fudge. 1981. Policy and action: Essays in the imple-mentation of public policy. London: Methuen.
Bassett-Jones, Nigel, and Geoffrey C. Lloyd. 2005. Does Herzberg’s motiva-tion theory have staying power? Journal of Management Development 24:929–43.
Baumgartner, Michael, and Alrik Thiem. 2017. Model ambiguities in con-figurational comparative research. Sociological Methods and Research 464:954–87.
Brodkin, Evelyn Z. 1997. Inside the welfare contract: Discretion and account-ability in state welfare administration. The Social Service Review 71:1–33.
Brodkin, Evelyn Z. 2011. Policy work: Street-level organizations under new managerialism. Journal of Public Administration Research and Theory 21:253–77.
Chun, Young H., and Hal G. Rainey. 2005. Goal ambiguity and organizational performance in US federal agencies. Journal of Public Administration Research and Theory 15:529–57.
Davis, Kenneth C. 1969. Discretionary justice: A preliminary inquiry. Baton Rouge, LA: Louisiana State University Press.
Dias, Janice J., and Steven Maynard-Moody. 2007. For-profit welfare: Contracts, conflicts, and the performance paradox. Journal of Public Administration Research and Theory 17:189–211.
Duşa, Adrian. 2018. QCA with R. A comprehensive resource. New York: Springer International Publishing.
Elmore, Richard F. 1979. Backward mapping: Implementation research and policy decisions. Political Science Quarterly 94:601–16.
Emmenegger, Patrick, Dominik Schraff, and André Walter. 2014. QCA, the truth table analysis and large-N survey data: The benefits of calibra-tion and the importance of robustness tests. COMPASSS Working Paper 2014–79.
Ewalt, Jo A.G., and Edward T. Jennings. 2004. Administration, governance, and policy tools in welfare policy implementation. Public Administration Review 64:449–62.
Fiss, Peer C. 2011. Building better causal theories: A fuzzy set approach to typolo-gies in organization research. Academy of Management Journal 54:393–420.
Fiss, Peer C, Dmitry Sharapov, and Lasse Cronqvist. 2013. Opposites attract? Opportunities and challenges for integrating large-N QCA and economet-ric analysis. Political Research Quarterly 66:191–98.
Follet, Mary P. 1924. The creative class. New York: Longmans, Green.Freidson, Eliot. 2001. Professionalism: The third logic. Cambridge: Cambridge
University Press.Gagné, Marylène, and Edward L. Deci. 2005. Self-determination theory and
work motivation. Journal of Organizational Behavior 26:33–62.Goertz, Gary, and Harvey Starr, eds. 2003. Necessary conditions. Theory,
methodology and applications. New York: Rowman & Littlefield.Gofen, Anat. 2013. Mind the gap: Dimensions and influence of street-level
divergence. Journal of Public Administration Research and Theory 24:473–93.
Grant, Adam M., and James W. Berry 2011. The necessity of others is the mother of invention: Intrinsic and prosocial motivations, perspective tak-ing, and creativity. Academy of Management Journal 54:73–96.
Greckhamer, Thomas, Vilmos F. Misangyi, and Peer C. Fiss. 2013. The two QCAs: From a small-N to a large-N set theoretic approach. Research in the Sociology of Organizations 38:49–75.
Greenwood, Royston, Roy Suddaby, and Bob C.R. Hinings. 2002. Theorizing change: The role of professional associations in the transfor-mation of institutionalized fields. The Academy of Management Journal 45:58–80.
Grimmelikhuijsen, Stephan., Sebastian Jilke, Asmus L. Olsen, and Lars G. Tummers. 2017. Behavioral public administration: Combining insights from public administration and psychology. Public Administration Review 77:45–56.
Herzberg, Frederic, Bernard Mausner, and Barbara B. Snyderman. 1959. The motivation to work. New York: Wiley.
Howlett, Michael. 2004. Beyond good and evil in policy implementation: Instrument mixes, implementation styles, and second generation theories of policy instrument choice. Policy and Society 23:1–17.
Hupe, Peter. 2013. Dimensions of discretion: Specifying the object of street-level bureaucracy research. Der moderne staat–Zeitschrift für Public Policy, Recht und Management 6:425–40.
Hupe, Peter L., and Michael J. Hill. 2007. Street-level bureaucracy and public accountability. Public Administration 85:85–102.
Keiser, Lael R. 1999. State bureaucratic discretion and the administration of social welfare programs: The case of social security disability. Journal of Public Administration Research and Theory 9:87–106.
Lammers, Joris, Janka I. Stoker, Floor Rink, and Adam D. Galinsky. 2016. To have control over or to be free from others? The desire for power reflects a need for autonomy. Personality and Social Psychology 42:498–512.
Lewin, Kurt. 1936. Principles of topological psychology. New York: McGraw-Hill.
Lipsky, Michael. 1980/2010. Street-level bureaucracy. Dilemmas of the indi-vidual in public services. New York: Russell Sage.
Loyens, Kim. 2015. Coping with policy alienation in law enforcement. In Understanding street-level bureaucracy. ed. Peter Hupe, Michael Hill, and Aurelien Buffat. London, UK: Routledge.
Maggetti, Marino, and David Levi-Faur. 2013. Dealing with errors in QCA. Political Research Quarterly 66:198–204.
Matland, Richard E. 1995. Synthesizing the implementation literature: The ambiguity-conflict model of policy implementation. Journal of Public Administration Research and Theory 5:145–74.
Matzler, Kurt, and Birgit Renzl. 2007. Assessing asymmetric effects in the formation of employee satisfaction. Tourism Management 28:1093–103.
May, Douglas R., Richard Gilson, and Lynn Harter. 2004. The psychological conditions of meaningfulness, safety and availability and the engagement of the human spirit at work. Journal of Occupational and Organizational Psychology 77:11–37.
May, Peter J., and Søren C. Winter. 2009. Politicians, managers, and street-level bureaucrats: Influences on policy implementation. Journal of Public Administration Research and Theory 19:453–76.
Maynard-Moody, Steven, and Shannon Portillo. 2010. Street-level bureau-cracy theory. In Oxford handbook of American bureaucracy, ed. Robert Durant, (pp. 252–77). Oxford: Oxford University Press.
McGregor, Douglas. 1960. The human side of enterprise. New York: Wiley.Medzihorsky, Juraj, Ioana-Elena Oana, Mario Quaranta, and Carsten
Q. Schneider. 2016. SetMethods: A package companion to “set-theoretic methods for the social sciences. R Package Version 2.0. URL:.
Meier, Kenneth, and Laurence O’Toole. 2002. Public management and organi-zational performance: The effect of managerial quality. Journal of Policy Analysis and Management 21:629–43.
Metselaar, Erwin E. 1997. Assessing the willingness to change: Construction and validation of the DINAMO. Amsterdam: VU Amsterdam.
Misangyi, Vilmos F., Thomas Greckhamer, Santi Furnari, Peer C. Fiss, Donal Crilly, and Ruth Aguilera. 2017. Embracing causal complexity: The emergence of a neo-configurational perspective. Journal of Management 43:255–82.
O’Toole, Laurence J. 2000. Research on policy implementation: Assessment and prospects. Journal of Public Administration Research and Theory 10:263–88.
Raab, Jörg, Remco S. Mannak, and Bart Cambré. 2015. Combining structure, governance, and context: A configurational approach to network effective-ness. Journal of Public Administration Research and Theory 25:479–511.
Ragin, Charles C. 1987. The comparative method: Moving beyond qualita-tive and quantitative strategies. Chicago, IL: University of California Press.
Ragin, Charles C. 2000. Fuzzy-set social science. Chicago, IL: University of Chicago Press.
Randall, Donna M., and James A. Wolff. 1994. The time interval in the inten-tion‐behaviour relationship: Meta‐analysis. British Journal of Social Psychology 33:405–18.
Downloaded from https://academic.oup.com/jpart/advance-article-abstract/doi/10.1093/jopart/muy024/5048691by gueston 08 July 2018

Journal of Public Administration Research and Theory, 2018, Vol. xx, No. xx 19
Sabatier, Paul A. 1986. Top-down and bottom-up approaches to implementa-tion research: A critical analysis and suggested synthesis. Journal of Public Policy 6:21–48.
Sachau, Daniel A. 2007. Resurrecting the motivation-hygiene theory: Herzberg and the positive psychology movement. Human Resource Development Review 6:377–93.
Schneider, Carsten Q., and Claudius Wagemann. 2012. Set-theoretic methods for the social sciences. A guide to qualitative comparative analysis. New York: Cambridge University Press.
Sheeran, Paschall, and Sheina Orbell. 1998. Do intentions predict condom use? Metaanalysis and examination of six moderator variables. British Journal of Social Psychology 37:231–50.
Skaaning, Svend-Erik. 2011. Assessing the robustness of crisp-set and fuzzy-set QCA results. Sociological Methods and Research 40:391–408.
Thiem, Alrik. 2014. Navigating the complexities of qualitative compara-tive analysis case numbers, necessity relations, and model ambiguities. Evaluation Review 38:487–513.
Thomann, Eva. 2015. Is output performance all about the resources? A fuzzy-set qualitative comparative analysis of street-level bureaucrats in Switzerland. Public Administration 93:177–94.
Thomann, Eva, Peter Hupe, and Fritz Sager. 2017. Serving many masters: Public accountability in private policy implementation. Governance 31:299–319.
Thomann, Eva, Eva Lieberherr, and Karin Ingold. 2016. Torn between state and market: Private policy implementation and conflicting institutional logics. Policy and Society 35:57–69.
Thomann, Eva, and Martino Maggetti. 2018. Designing research with quali-tative comparative analysis (QCA): Approaches, challenges and tools. Sociological Methods & Research. Advance online publication. doi: 10.1177/0049124117729700.
Thomas, William. 1928. The child in America: Behavior problems and pro-grams. New York: A.A. Knopf.
Tummers, Lars G. 2011. Explaining the willingness of public professionals to implement new policies: A policy alienation framework. International Review of Administrative Sciences 77:555–81.
Tummers, Lars G. 2012. Policy alienation of public professionals: The construct and its measurement. Public Administration Review 72:516–25.
Tummers, Lars G., and Victor Bekkers. 2014. Policy implementation, street-level bureaucracy, and the importance of discretion. Public Management Review 16:527–47.
Tummers, Lars G., Victor Bekkers, and Bram Steijn. 2009. Policy alienation of public professionals: Application in a new public management context. Public Management Review 11:685–706.
Tummers, Lars G., Bram Steijn, and Victor Bekkers. 2012. Explaining the willingness of public professionals to implement public policies: Content, context, and personality characteristics. Public Administration 90:716–36.
Van der Voet, Joris, Bram Steijn, and Ben S. Kuipers. 2017. What’s in it for others? The relationship between prosocial motivation and commitment to change among youth care professionals. Public Management Review 19:443–62.
Van Engen, Nadine A.M., Lars G. Tummers, Victor Bekkers, and Bram Steijn. 2016. Bringing history in: Policy accumulation and general policy aliena-tion. Public Management Review 18:1085–1106.
Wagemann, Claudius, Jonas Buche, and Markus B. Siewert. 2016. QCA and business research: Work in progress or a consolidated agenda? Journal of Business Research 69:2531–40.
Wirth, R.J., and Michael C. Edwards. 2007. Item factor analysis: Current approaches and future directions. Psychological Methods 12: 58–79.
Yukl, Gary A., and Wendy S. Becker. 2012. Effective empowerment in organi-zations. Organization Management Journal 3:210–31.
Downloaded from https://academic.oup.com/jpart/advance-article-abstract/doi/10.1093/jopart/muy024/5048691by gueston 08 July 2018