the new normal asc 2010 3 may 2010 maria b. dwight gerontological services, inc. los angeles,...
TRANSCRIPT

The New Normal
ASC 20103 May 2010
Maria B. DwightGerontological Services, Inc.
Los Angeles, [email protected]

"Senior (military) officers say the power point program does come in handy when the goal is not imparting information, as in briefings for reporters.
The news media sessions often last 25 minutes, with 5 minutes left at the end for questions from anyone still awake. Those types of PowerPoint presentations are known as “hypnotizing chickens.”
- New York Times, April 26, 2010
An Aside

THE NEW NORMAL … MORE FUN THAN THE OLD NORMAL?
Are we having fun yet?
Are depression babies enjoying the double whammy?

Introduction:
The purpose of this day is to initiate conversation and dialogue around the post 2008 environment of California and its older population.
We will look at the multi-faceted issues and opportunities that will affect ASC members and their future viability and growth.
Are you going to be part of the problem or part of the solution?
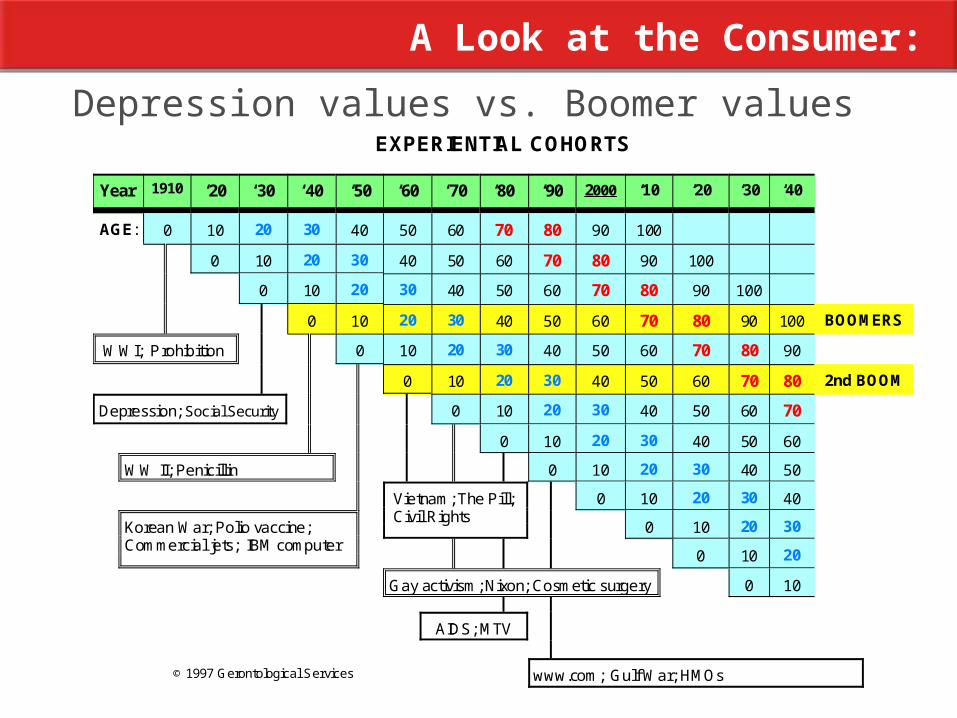
A Look at the Consumer:
Depression values vs. Boomer valuesEXPERIENTIAL COHORTS
Year 1910 ‘20 ‘30 ‘40 ‘50 ‘60 ‘70 ‘80 ‘90 2000 ‘10 ‘20 ‘30 ‘40
AGE: 0 10 20 30 40 50 60 70 80 90 100
0 10 20 30 40 50 60 70 80 90 100
0 10 20 30 40 50 60 70 80 90 100
0 10 20 30 40 50 60 70 80 90 100 BOOMERS
WWI; Prohibition 0 10 20 30 40 50 60 70 80 90
0 10 20 30 40 50 60 70 80 2nd BOOM
Depression; Social Security 0 10 20 30 40 50 60 70
0 10 20 30 40 50 60
WW II; Penicillin 0 10 20 30 40 50
Vietnam; The Pill; Civil Rights
0 10 20 30 40
Korean War; Polio vaccine;Commercial jets; IBM computer
0 10 20 30
0 10 20
Gay activism; Nixon; Cosmetic surgery 0 10
AIDS; MTV
© 1997 Gerontological Services www.com; Gulf War; HMOs

Drivers of the “new normal”
Value driven (quality and durability)
Experience instead of stuff
Vulnerability to income loss
Vulnerability to asset erosion
Wealth transfer to younger generations
Ratings of Types of Opportunities by AgeIn-Movers, Incomes $50K+
How important is it to you to have access to opportunities for:
Under Age 65
Ages 65-74 Ages 75+
Physical recreation
Very important 86% 79% 66%
Social recreation
Very important 78% 74% 65%
Intellectual growth
Very important 83% 75% 63%
Cultural recreation
Very important 80% 71% 58%
Volunteering
Very important 57% 46% 35%
Spiritual growth
Very important 51% 48% 37%

Depression demographic vs. Boomer demographics

Depression demographic vs. Boomer demographics
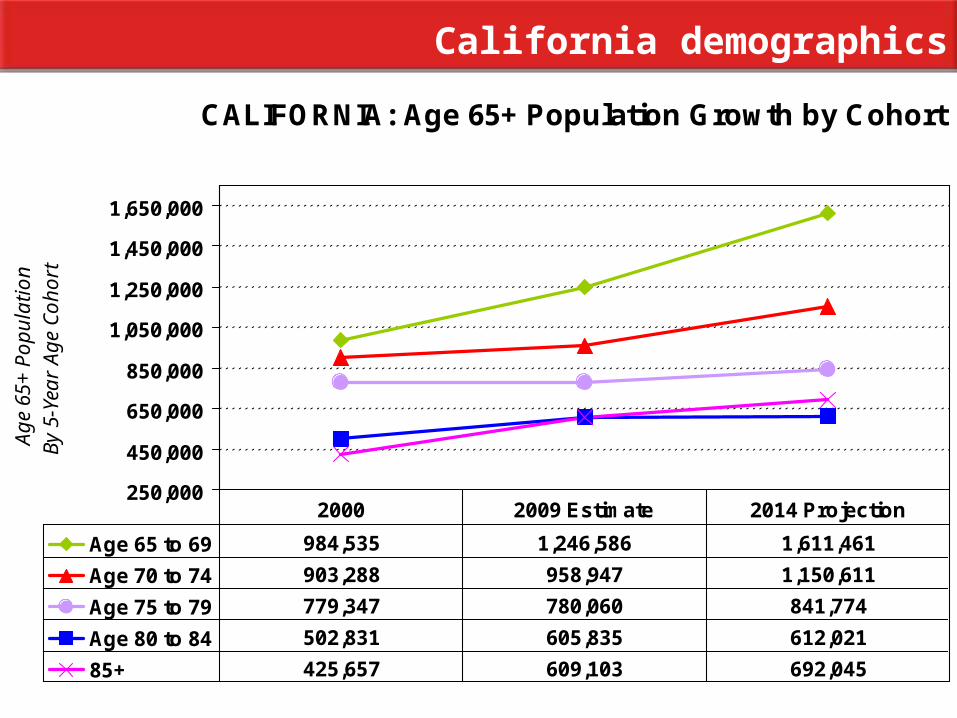
California demographics
CALIFORNIA: Age 65+ Population Growth by Cohort
250,000
450,000
650,000
850,000
1,050,000
1,250,000
1,450,000
1,650,000
Ag
e 6
5+
Po
pu
latio
nB
y 5
-Ye
ar
Ag
e C
oh
ort
Age 65 to 69 984,535 1,246,586 1,611,461
Age 70 to 74 903,288 958,947 1,150,611
Age 75 to 79 779,347 780,060 841,774
Age 80 to 84 502,831 605,835 612,021
85+ 425,657 609,103 692,045
2000 2009 Estimate 2014 Projection

Age 75+ Population Growth by State
0
500,000
1,000,000
1,500,000
2,000,000
2,500,000
Ag
e 7
5+
Po
pu
latio
n
2000 1,707,835 87,154 303,998
2009 Estimate 1,994,998 127,873 413,402
2014 Projection 2,145,840 155,802 468,885
California Nevada Arizona
California demographics

Age 75+ Population Annual Growth by State
0.00%
1.00%
2.00%
3.00%
4.00%
5.00%
6.00%
Ag
e 7
5+
Po
pu
latio
nA
nn
ua
l Gro
wth
2000 - 2009 1.90% 5.20% 4.00%
2009 - 2014 1.50% 4.40% 2.70%
California Nevada Arizona
California demographics

Age 75+ Higher Income Households by State*
0
50,000
100,000
150,000
200,000
250,000
Ag
e 7
5+
Ho
use
ho
lds
With
Hig
he
r In
com
es
2000 ($57K+) 215,007 9,154 31,286
2009 Esitmated ($75K+) 233,040 12,773 37,223
2014 Projected ($85K+) 234,456 14,547 40,473
California Nevada Arizona
* Adjusted dollars: assumes a consistent 2.8% annual increase in GDP from 2000 to 2014.
California demographics

Age 75+ Higher Income Households, % of Total*
0.0%
5.0%
10.0%
15.0%
20.0%
25.0%
Ag
e 7
5+
Hig
he
r In
com
eH
ou
seh
old
s, %
of T
ota
l
2000 ($57K+) 20.5% 17.2% 16.0%
2009 Esitmated ($75K+) 20.0% 16.7% 14.4%
2014 Projected ($85K+) 19.2% 15.8% 13.8%
California Nevada Arizona
* Adjusted dollars: assumes a consistent 2.8% annual increase in GDP from 2000 to 2014.
California demographics

Age 75+ Population Growth in Selected Markets
0
10,000
20,000
30,000
40,000
50,000
60,000
70,000
Ag
e 7
5+
Po
pu
latio
n
2000 35,860 16,641 34,882 50,288
2009 Estimate 41,420 18,523 41,396 56,904
2014 Projection 43,220 19,676 42,436 59,677
Alhambra Marin Oceanside San Francisco
Selected Market demographics
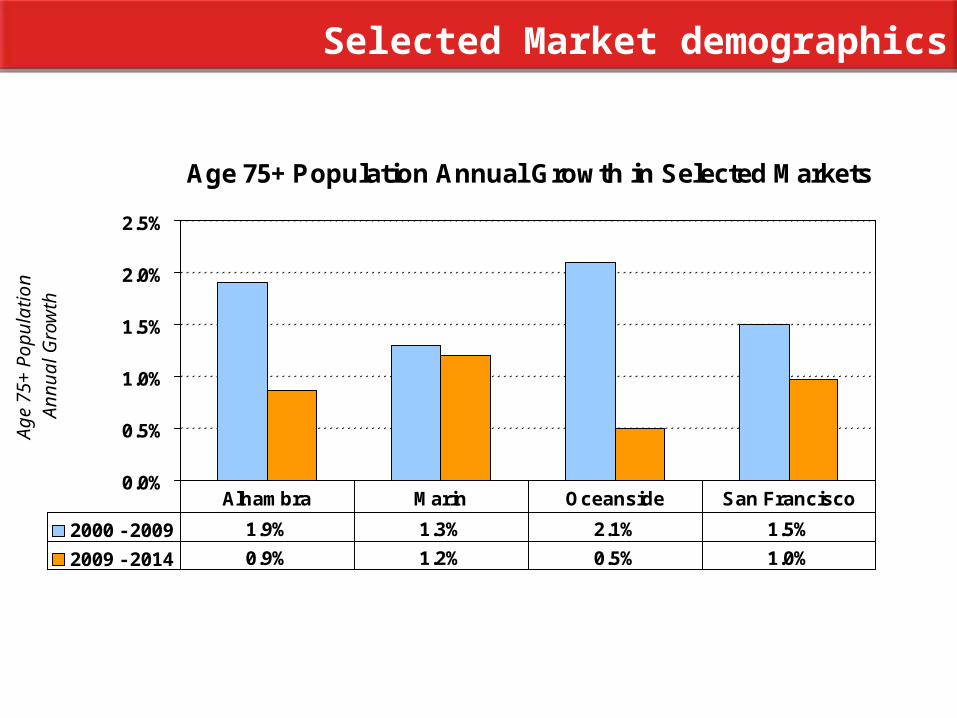
Age 75+ Population Annual Growth in Selected Markets
0.0%
0.5%
1.0%
1.5%
2.0%
2.5%
Ag
e 7
5+
Po
pu
latio
nA
nn
ua
l Gro
wth
2000 - 2009 1.9% 1.3% 2.1% 1.5%
2009 - 2014 0.9% 1.2% 0.5% 1.0%
Alhambra Marin Oceanside San Francisco
Selected Market demographics

Age 75+ Higher Income Households in Selected Markets*
0
2,000
4,000
6,000
8,000
10,000
Ag
e 7
5+
Ho
use
ho
lds
With
Hig
he
r In
com
es
2000 ($57K+) 3,339 3,449 5,078 8,075
2009 Esitmated ($75K+) 3,251 3,617 6,376 8,338
2014 Projected ($85K+) 2,997 3,753 6,139 8,591
Alhambra Marin Oceanside San Francisco
* Adjusted dollars: assumes a consistent 2.8% annual increase in GDP from 2000 to 2014.
Selected Market demographics

Age 75+ Higher Income Households, % of Total*
0.0%
5.0%
10.0%
15.0%
20.0%
25.0%
30.0%
35.0%
Ag
e 7
5+
Hig
he
r In
com
eH
ou
seh
old
s, %
of T
ota
l
2000 ($57K+) 17.0% 31.7% 24.0% 25.5%
2009 Esitmated ($75K+) 15.4% 30.9% 24.5% 25.2%
2014 Projected ($85K+) 14.0% 30.5% 23.0% 25.3%
Alhambra Marin Oceanside San Francisco
* Adjusted dollars: assumes a consistent 2.8% annual increase in GDP from 2000 to 2014.
Selected Market demographics

Changing Ethnicity

Age 65+ Anglo Population Growth in Selected Markets
0
20,000
40,000
60,000
80,000
Ag
e 6
5+
An
glo
Po
pu
latio
n
2000 38,949 31,349 62,003 51,647
2009 Estimate 37,540 36,100 66,974 54,473
2014 Projection 39,079 40,999 74,113 61,489
Alhambra Marin Oceanside San Francisco

Age 65+ Anglo Pop. Annual Growth in Selected Markets
-1.0%
-0.5%
0.0%
0.5%
1.0%
1.5%
2.0%
2.5%
3.0%
Ag
e 6
5+
An
glo
Po
pu
latio
nA
nn
ua
l Gro
wth
2000 - 2009 -0.4% 1.7% 0.9% 0.6%
2009 - 2014 1.1% 2.7% 2.1% 2.6%
Alhambra Marin Oceanside San Francisco

Age 65+ Anglo Population as Percent of Total
0%
20%
40%
60%
80%
100%
Ag
e 6
5+
An
glo
Po
pu
latio
na
s P
erc
en
t of T
ota
l
2000 51% 94% 92% 50%
2009 Esitmated 44% 91% 88% 49%
2014 Projected 41% 89% 87% 49%
Alhambra Marin Oceanside San Francisco
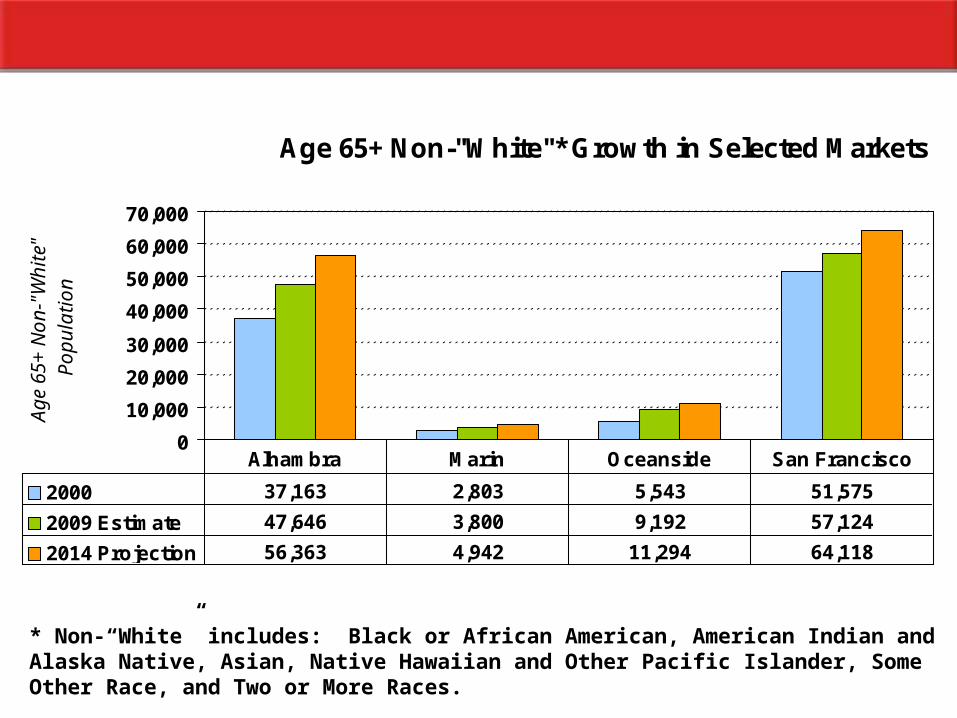
Age 65+ Non-"White"* Growth in Selected Markets
0
10,000
20,000
30,000
40,000
50,000
60,000
70,000
Ag
e 6
5+
No
n-"
Wh
ite"
Po
pu
latio
n
2000 37,163 2,803 5,543 51,575
2009 Estimate 47,646 3,800 9,192 57,124
2014 Projection 56,363 4,942 11,294 64,118
Alhambra Marin Oceanside San Francisco
* Non-“White” includes: Black or African American, American Indian and Alaska Native, Asian, Native Hawaiian and Other Pacific Islander, Some Other Race, and Two or More Races.
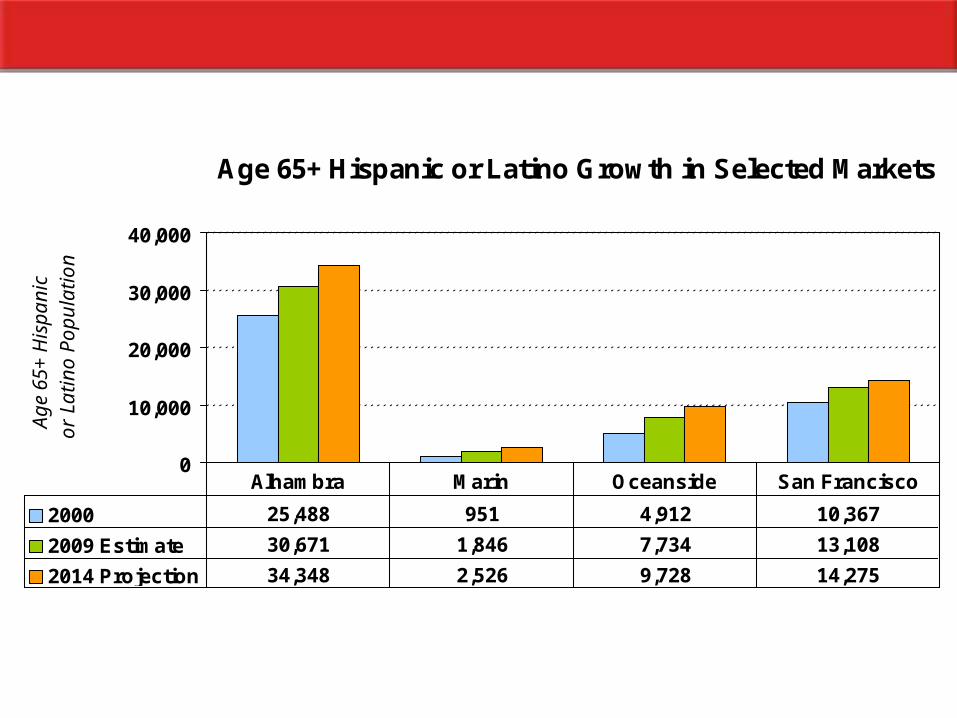
Age 65+ Hispanic or Latino Growth in Selected Markets
0
10,000
20,000
30,000
40,000
Ag
e 6
5+
His
pa
nic
or
La
tino
Po
pu
latio
n
2000 25,488 951 4,912 10,367
2009 Estimate 30,671 1,846 7,734 13,108
2014 Projection 34,348 2,526 9,728 14,275
Alhambra Marin Oceanside San Francisco

Age 65+ Non-"White"* Growth by State
0
500,000
1,000,000
1,500,000
2,000,000
Ag
e 6
5+
No
n-"
Wh
ite"
Po
pu
latio
n
2000 805,166 25,223 52,818
2009 Estimate 1,185,454 54,093 99,603
2014 Projection 1,470,447 79,755 130,844
California Nevada Arizona
* Non-“White” includes: Black or African American, American Indian and Alaska Native, Asian, Native Hawaiian and Other Pacific Islander, Some Other Race, and Two or More Races.

Age 65+ Hispanic or Latino Growth by State
0
200,000
400,000
600,000
800,000
1,000,000
1,200,000
Ag
e 6
5+
His
pa
nic
or
La
tino
Po
pu
latio
n
2000 472,769 12,173 55,504
2009 Estimate 758,218 31,157 102,500
2014 Projection 964,113 48,209 136,919
California Nevada Arizona

Exciting Opportunities:
Niche marketsPent up demandAvailable and expanded professional pool
New productsNew locationsTechnology