the new york state renewable portfolio standard ... · the new york state renewable portfolio...
TRANSCRIPT
New York State Energy Research and Development Authority
The New York State Renewable Portfolio Standard Performance Report
Through December 31, 2012
Energyfor
Table of ConTenTs
Executive Summary .......................................................1New York’s Renewable Portfolio Standard (RPS) ............1RPS Program Highlights ................................................2NY-Sun Initiative .............................................................3NY-Sun Highlights ..........................................................3
Background ....................................................................4Tiered Approach to Implementing the RPS ....................8Maintenance Resource Participation ..............................8Renewable Energy Targets ............................................9
Voluntary Market .........................................................10
Executive Order 111 ....................................................10
Progress and Results ..................................................11Main Tier and Customer-Sited Tier Progress ................11Main Tier .....................................................................12
Wind Power Capacity Additions to New York State ...15 First Main Tier Solicitation .........................................15Second Main Tier Solicitation ....................................16Third Main Tier Solicitation ........................................16Fourth Main Tier Solicitation ......................................16Fifth Main Tier Solicitation .........................................17Sixth Main Tier Solicitation ........................................17Seventh Main Tier Solicitation ...................................17Eighth Main Tier Solicitation ......................................18Changes Subsequent to Solicitation Awards .............18Weighted Average Award Price Trends .....................18Economic and Environmental Impacts ......................18New York Generation Attribute Tracking System (NYGATS) .....................................................19
Customer-Sited Tier.....................................................20
NY-Sun Initiative ..........................................................30Summary of Initiative ....................................................30NY-Sun Targets ........................................................................30Progress Toward NY-Sun Targets .................................30
Program Funding and Budgets ..................................31
Funding Commitments and Expenses ......................33
Appendix A—Main Tier Contracts ........................... A-1
Appendix B—Financial Status Report ..................... B-1
Appendix C—Cash Flow Estimates .........................C-1LaFargeville School
Co2 ver Photo: Steel Winds II

executive summary
This report summarizes activities conducted through resources) targets with the remainder to be made up by December 31, 2012 by the New York State Energy the Voluntary Market, purchases made by state agencies Research and Development Authority (NYSERDA) under Executive Order 111, and purchases made by the and the New York State Department of Public Long Island Power Authority.Service (DPS) in implementing the New York State Renewable Portfolio Standard (RPS). This report Through December 31, 2012, NYSERDA has conducted includes background on the RPS, objectives and seven Main Tier solicitations and has released an eighth performance targets, and a summary of outcomes, competitive solicitation in pursuit of the Main Tier funding, and expenses. This report also introduces renewable energy procurement target. An announcement Governor Andrew M. Cuomo’s groundbreaking NY- of the results of the current solicitation is anticipated to Sun Initiative, a comprehensive policy designed to occur by the summer of 2013, pending a Commission accelerate the penetration of Solar Photovoltaic (PV) Order on a December 2012 Petition by NYSERDA installations through current NYSERDA-administered requesting a revision to the rules of the RPS Program programs, including the RPS, as well as companion Main Tier to limit eligibility to projects located in New programs administered by other state entities such as York State.4
the Long Island Power Authority and the New York 1 From the seven completed solicitations, NYSERDA Power Authority.
currently has contracts with electricity generators
for 54 large-scale projects. These projects will add new York’s RPs approximately 1,834 MW of new renewable capacity
to the state’s energy mix. Through December 31, 2012, New York, through regulations adopted by the Public NYSERDA’s progress at achieving the Main Tier and Service Commission (PSC or Commission), first enacted Customer-Sited Tier 2015 targets are 47% and 33%, its RPS in 2004 with the goal of increasing the amount respectively.of renewable electricity used by consumers to 25% by
2013. Following a comprehensive mid-course review, The RPS Main Tier contracts require that, after three and in an Order issued in January 2010, the Commission years of operation, each contractor is required to provide expanded the RPS target from 25% to 30% and extended
2 supporting documentation to substantiate the direct New the terminal year of the program from 2013 to 2015. In York State economic benefits that were included in their an April 2, 2010 Order, the Commission established static proposals. Through December 31, 2012, NYSERDA NYSERDA Main Tier and Customer-Sited Tier program has completed rigorous reviews of economic benefits targets for supporting the production of approximately documentation furnished by 18 facilities. Those reviews 10.4 million megawatt-hours (MWh) of renewable
3 indicate that the actual economic benefits of the program energy annually by 2015. are substantial, and that they are in line with the findings of the 2009 analysis of bid proposal data completed by Unlike most states with an RPS, New York uses a central KEMA. Key findings of this updated effort included the procurement model whereby NYSERDA administers or
5
verification of over $440 million already spent in New is otherwise responsible for the majority of the program’s York through the first three years of commercial operation goal. Specifically, NYSERDA is responsible for for these 18 facilities. Extrapolation of anticipated long obtaining the Main Tier (larger utility scale resources) and term expenditures such as salaries, Payment-in-lieu Customer-Sited Tier (CST), (smaller, behind the meter of taxes (PILOT) and Host Community Payments,
1 Previous RPS program performance reports and related information can be found at: http://www.nyserda.ny.gov/Program-Planning/Renewable-Portfolio-Standard/Documents.aspx
2 Pr oceeding on Motion of the Commission Regarding a Retail Renewable Portfolio Standard, “Order Establishing New RPS Goal and Resolving Main Tier Issues;” issued and effective January 8, 2010.
3 Proceeding on Motion of the Commission Regarding a Retail Renewable Portfolio Standard, “Order Authorizing Customer-Sited Tier Program Through 2015 and Resolving Geographic Balance and Other Issues Pertaining to the RPS,” issued and effective April 2, 2010.
4 Petition for Modification of RPS Main Tier Program, http://documents.dps.ny.gov/public/Common/ViewDoc.aspx?DocRefId={98BC8B49-D8FB-4054-A6B5-8F34F9EB5A1C}
5 New York Main Tier RPS, Impact and Process Evaluation, KEMA, Inc., March 2009. 1 1
22
operations and maintenance expenses and payments for land use or fuel add over $710 million in expenditures over the projected life of these projects. In total, these projects are anticipated to add over $1.1 billion6 to the New York economy through their respective operating lives.7
A comprehensive analysis which extrapolates these benefits to the remaining Main Tier and Maintenance resource facilities will be published by mid-2013.
The Customer-Sited Tier 2015 target was increased substantially this year (by approximately 40%), largely as a result of the NY-Sun program. The CST program made significant progress in 2012 toward the RPS targets and its newly expanded goal. Through December 31, 2012, CST programs have supported the installation of over 5,000 on-site generation systems which represent over 70 MW of installed capacity. Program Opportunity Notices (PON) for the standard offer Solar Photovoltaic (PV), On-site Wind, Fuel Cell, and Solar Thermal programs are all active through December 31, 2015. In December 2012, the ADG program released a new PON utilizing a combination of funding sources with $23.6 million from the RPS fund and $5 million from the New York Power Authority (NYPA). The Competitive PV (Regional Program) released PON 2484 in early 2012 and made awards to 16 PV developers representing 34 MW of capacity supported by $32 million in incentives. Later in 2012, the Competitive PV Program released PON 2589 valued at $106.9 million in support of three due dates (round one received proposals in December 2012, from which awards are anticipated to be announced in February 2013).
In 2013 the Public Service Commission will undertake an evaluation of the RPS. In support of this evaluation, NYSERDA will update previously completed cost estimates and conduct various cost/benefit analyses. NYSERDA will also assess certain program design elements as well as changes to key program policies. The results of this evaluation will inform Commission decisions regarding the future of New York’s RPS.
RPs Program Highlights
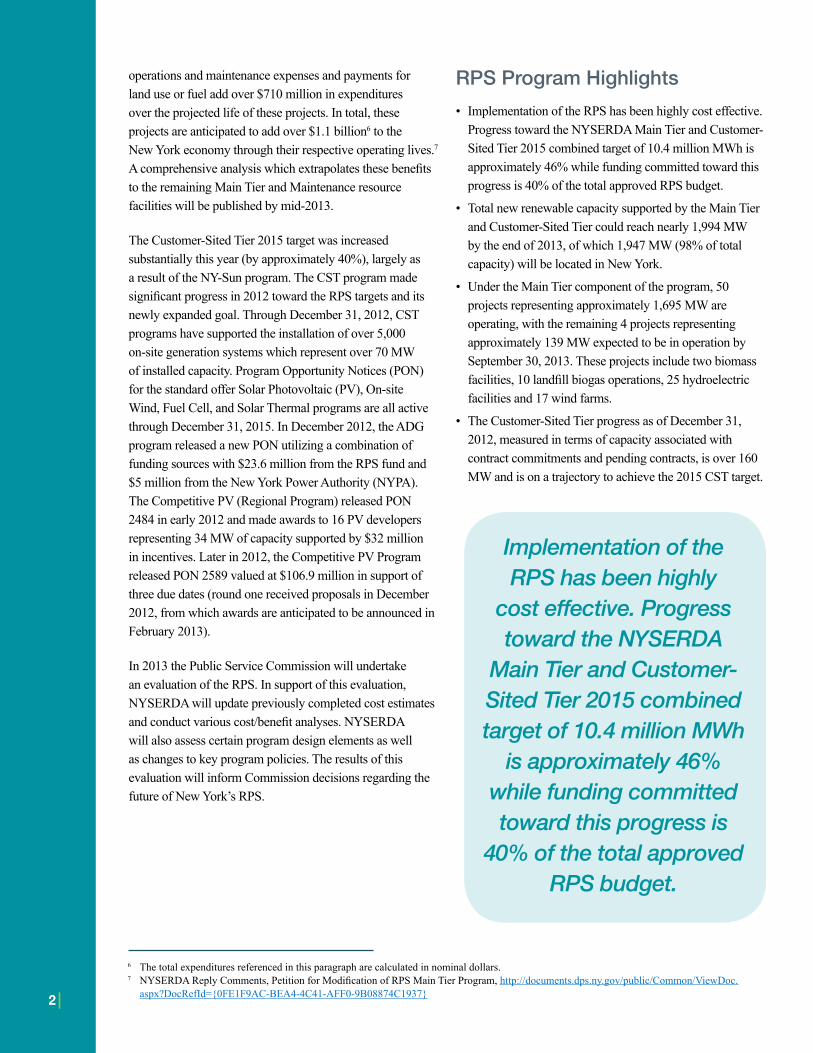
• I mplementation of the RPS has been highly cost effective. Progress toward the NYSERDA Main Tier and Customer-
Sited Tier 2015 combined target of 10.4 million MWh is approximately 46% while funding committed toward this progress is 40% of the total approved RPS budget.
• Total new renewable capacity supported by the Main Tier and Customer-Sited Tier could reach nearly 1,994 MW by the end of 2013, of which 1,947 MW (98% of total capacity) will be located in New York.
• Under the Main Tier component of the program, 50 projects representing approximately 1,695 MW are operating, with the remaining 4 projects representing approximately 139 MW expected to be in operation by September 30, 2013. These projects include two biomass facilities, 10 landfill biogas operations, 25 hydroelectric facilities and 17 wind farms.
• The Customer-Sited Tier progress as of December 31, 2012, measured in terms of capacity associated with contract commitments and pending contracts, is over 160 MW and is on a trajectory to achieve the 2015 CST target.
Implementation of the RPS has been highly
cost effective. Progress toward the NYSERDA
Main Tier and Customer-Sited Tier 2015 combined target of 10.4 million MWh
is approximately 46% while funding committed toward this progress is
40% of the total approved RPS budget.
6 The total expenditures referenced in this paragraph are calculated in nominal dollars.7 NYSERDA Reply Comments, Petition for Modification of RPS Main Tier Program, http://documents.dps.ny.gov/public/Common/ViewDoc.
aspx?DocRefId={0FE1F9AC-BEA4-4C41-AFF0-9B08874C1937}
3
nY-sun Initiative
On January 4, 2012, Governor Andrew M. Cuomo deliveredhis second State of the State address in which he announced that his administration would launch the NY-Sun Initiative to expand solar energy production in the state while keeping costs under control to protect the ratepayer. One objective of NY-Sun is to increase competitive procurement of large, commercial-sized solar projects and expand standard offer programs for residential and commercial small-to-medium systems. Additional information on the NY-Sun Initiative canbe found at http://ny-sun.ny.gov/.
The NY-Sun Initiative brought together and expanded existing programs administered by NYSERDA, the LongIsland Power Authority (LIPA), and the New York PowerAuthority (NYPA), to ensure a coordinated, well-funded solar energy expansion plan with the ultimate 2012 target of installing twice the customer-sited PV capacity added during 2011; and quadrupling that amount in 2013. NYSERDA’s portion of the NY-Sun target will be achieved through expansions of the existing standard offer and competitive Geographic Balance Program (after expansion with NY-Sun funds in 2012; renamed the Competitive PV Program), which are administered within the RPS Customer-Sited Tier.
nY-sun Highlights
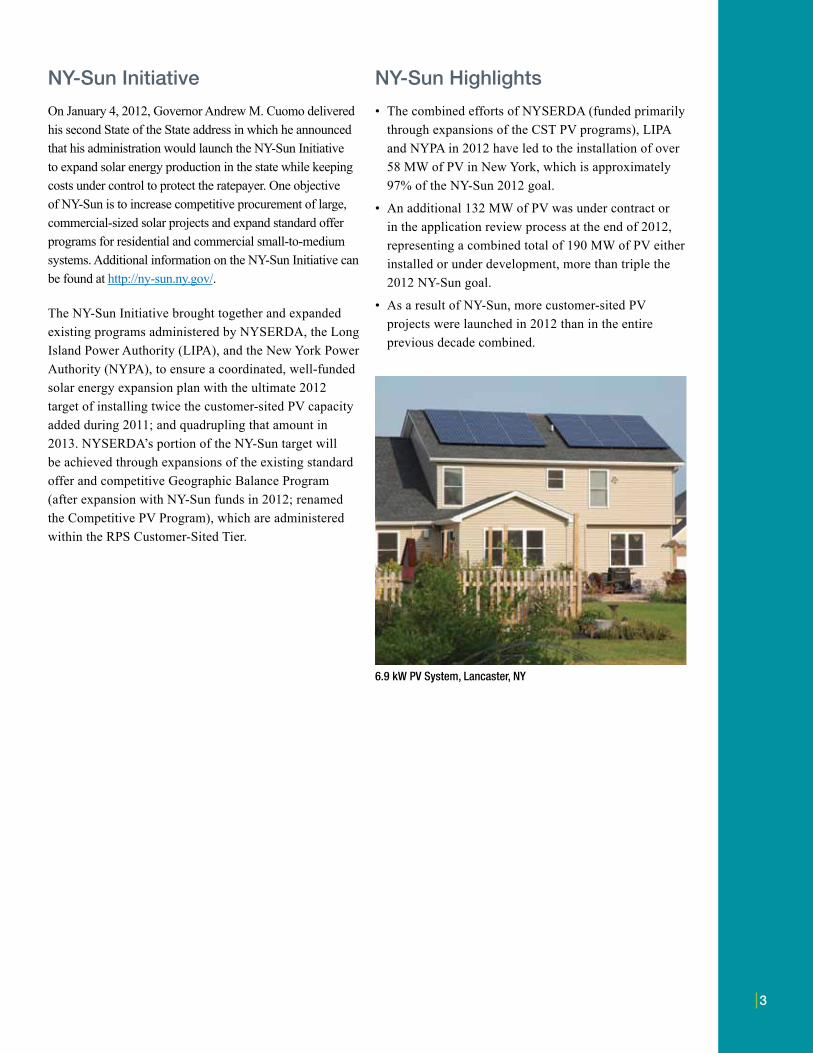
• The combined efforts of NYSERDA (funded primarily through expansions of the CST PV programs), LIPA and NYPA in 2012 have led to the installation of over 58 MW of PV in New York, which is approximately 97% of the NY-Sun 2012 goal.
• An additional 132 MW of PV was under contract or in the application review process at the end of 2012, representing a combined total of 190 MW of PV either
installed or under development, more than triple the 2012 NY-Sun goal.
• As a result of NY-Sun, more customer-sited PV projects were launched in 2012 than in the entire previous decade combined.
6.9 kW PV System, Lancaster, NY
44
background
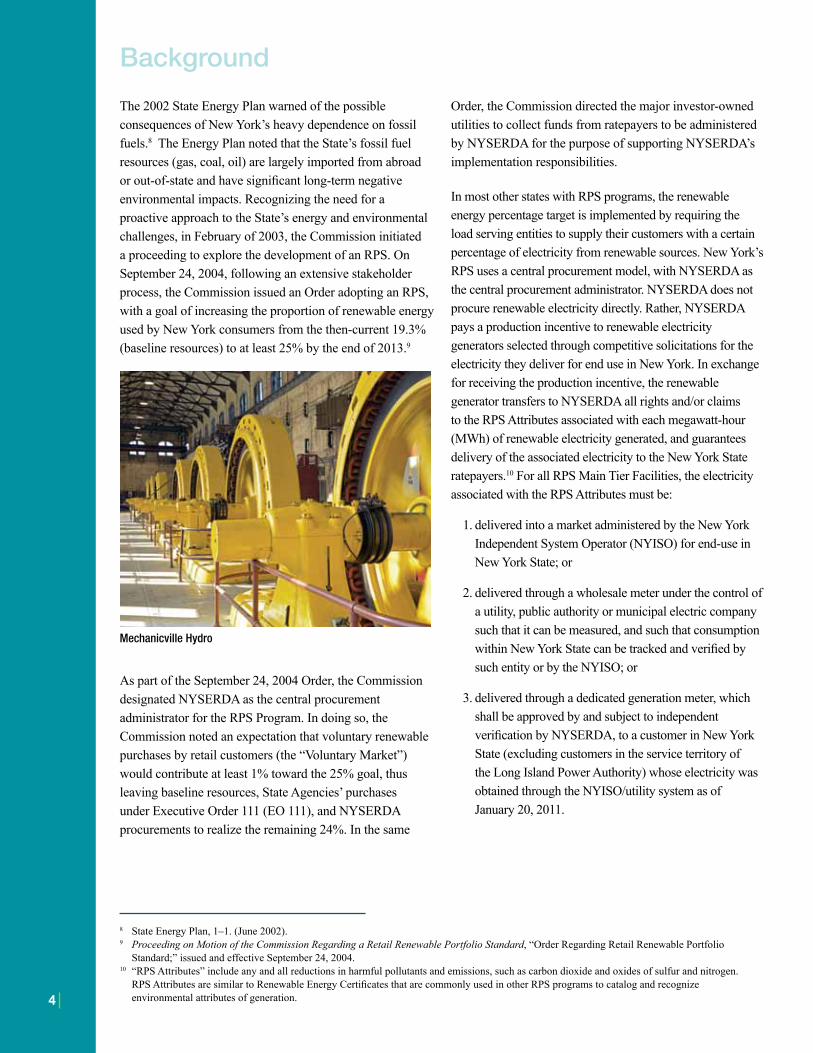
The 2002 State Energy Plan warned of the possible consequences of New York’s heavy dependence on fossil fuels.8 The Energy Plan noted that the State’s fossil fuel resources (gas, coal, oil) are largely imported from abroad or out-of-state and have significant long-term negative environmental impacts. Recognizing the need for a proactive approach to the State’s energy and environmental challenges, in February of 2003, the Commission initiated a proceeding to explore the development of an RPS. On September 24, 2004, following an extensive stakeholder process, the Commission issued an Order adopting an RPS, with a goal of increasing the proportion of renewable energy used by New York consumers from the then-current 19.3% (baseline resources) to at least 25% by the end of 2013.9
Mechanicville Hydro
As part of the September 24, 2004 Order, the Commission designated NYSERDA as the central procurement administrator for the RPS Program. In doing so, the Commission noted an expectation that voluntary renewable purchases by retail customers (the “Voluntary Market”) would contribute at least 1% toward the 25% goal, thus leaving baseline resources, State Agencies’ purchases under Executive Order 111 (EO 111), and NYSERDA procurements to realize the remaining 24%. In the same
Order, the Commission directed the major investor-owned utilities to collect funds from ratepayers to be administered by NYSERDA for the purpose of supporting NYSERDA’s implementation responsibilities.
In most other states with RPS programs, the renewable energy percentage target is implemented by requiring the load serving entities to supply their customers with a certain percentage of electricity from renewable sources. New York’s RPS uses a central procurement model, with NYSERDA as the central procurement administrator. NYSERDA does not procure renewable electricity directly. Rather, NYSERDA pays a production incentive to renewable electricity generators selected through competitive solicitations for the electricity they deliver for end use in New York. In exchange for receiving the production incentive, the renewable generator transfers to NYSERDA all rights and/or claims to the RPS Attributes associated with each megawatt-hour (MWh) of renewable electricity generated, and guarantees delivery of the associated electricity to the New York State ratepayers.10 For all RPS Main Tier Facilities, the electricity associated with the RPS Attributes must be:
1. delivered into a market administered by the New York Independent System Operator (NYISO) for end-use in New York State; or
2. delivered through a wholesale meter under the control of a utility, public authority or municipal electric company such that it can be measured, and such that consumption within New York State can be tracked and verified by such entity or by the NYISO; or
3. delivered through a dedicated generation meter, which shall be approved by and subject to independent verification by NYSERDA, to a customer in New York State (excluding customers in the service territory of the Long Island Power Authority) whose electricity was obtained through the NYISO/utility system as of January 20, 2011.
8 State Energy Plan, 1–1. (June 2002).9 Proceeding on Motion of the Commission Regarding a Retail Renewable Portfolio Standard, “Order Regarding Retail Renewable Portfolio
Standard;” issued and effective September 24, 2004. 10 “RPS Attributes” include any and all reductions in harmful pollutants and emissions, such as carbon dioxide and oxides of sulfur and nitrogen.
RPS Attributes are similar to Renewable Energy Certificates that are commonly used in other RPS programs to catalog and recognize environmental attributes of generation.
5
The RPS Attributes include any and all reductions in harmful pollutants and emissions, such as carbon dioxide and oxides of sulfur and nitrogen. By acquiring the RPS Attributes, rather than the associated electricity, the program ensures that increasing amounts of renewable electricity will be injected into the State’s power system, while minimizing interference with the State’s competitive wholesale power markets.
Tiered approach to Implementing the RPs
The Commission established two tiers of resource types under the RPS. The first, or Main Tier, consists primarily of medium to large-scale electric generation facilities that deliver their electrical output into the wholesale power market administered by the NYISO. Noting the importance of accelerating the development of emerging technologies, because of their environmental benefits and ability to be sited in urban, heavily-loaded areas, the Commission also established a second tier, the Customer-Sited Tier (CST). The CST consists of smaller, “behind-the-meter” resources, such as photovoltaic systems, fuels cells, customer-sited wind facilities, anaerobic digester gas, and similar technologies that for the most part produce electricity for use on site. 11
Only renewable energy systems installed on or after January 1, 2003 or existing facilities that generate renewable energy that is incremental to historical levels of renewable energy generation are eligible to participate in the RPS. While the Main Tier and Geographic Balance (Competitive Photovoltaic) program operate through the issuance of periodic competitive solicitations, all other CST resources are supported through first-come/first-served open enrollment programs that provide a combination of standard offer incentives for the “buy-down” of capital costs and/or energy production.
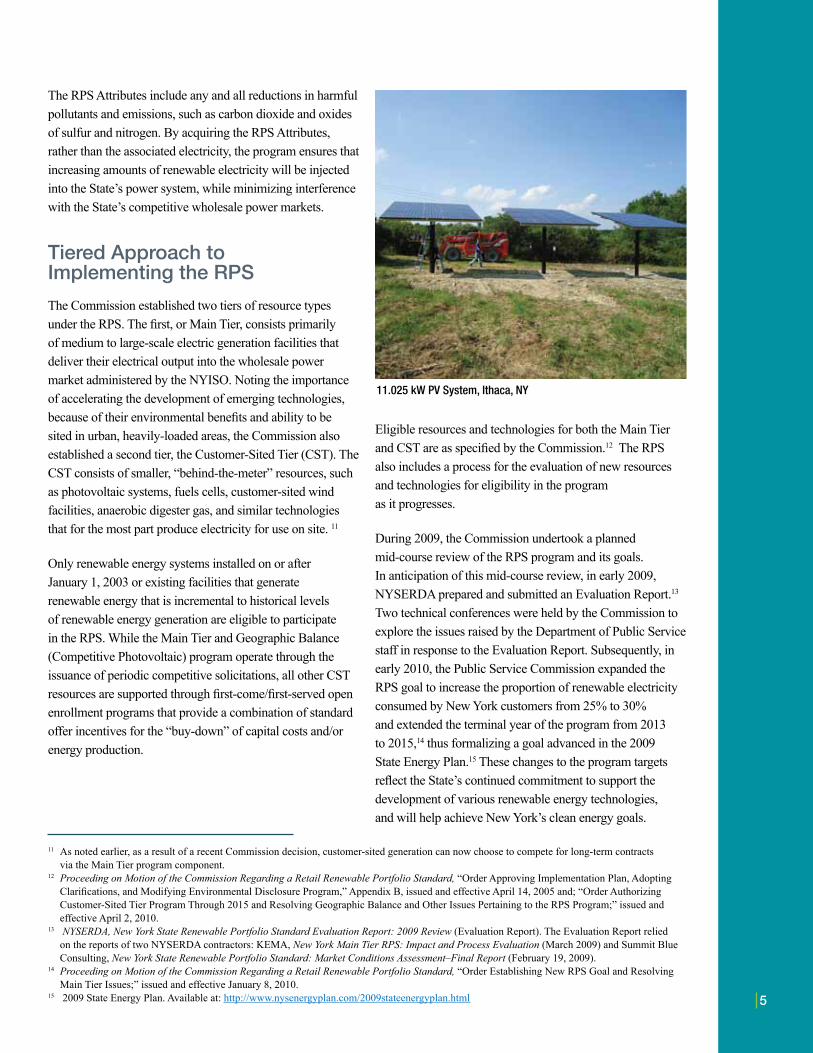
11.025 kW PV System, Ithaca, NY
Eligible resources and technologies for both the Main Tier and CST are as specified by the Commission.12 The RPS also includes a process for the evaluation of new resources and technologies for eligibility in the program as it progresses.
During 2009, the Commission undertook a planned mid-course review of the RPS program and its goals. In anticipation of this mid-course review, in early 2009, NYSERDA prepared and submitted an Evaluation Report.13 Two technical conferences were held by the Commission to explore the issues raised by the Department of Public Service staff in response to the Evaluation Report. Subsequently, in early 2010, the Public Service Commission expanded the RPS goal to increase the proportion of renewable electricity consumed by New York customers from 25% to 30% and extended the terminal year of the program from 2013 to 2015,14 thus formalizing a goal advanced in the 2009 State Energy Plan.15 These changes to the program targets reflect the State’s continued commitment to support the development of various renewable energy technologies, and will help achieve New York’s clean energy goals.
11 As noted earlier, as a result of a recent Commission decision, customer-sited generation can now choose to compete for long-term contracts via the Main Tier program component.
12 Proceeding on Motion of the Commission Regarding a Retail Renewable Portfolio Standard, “Order Approving Implementation Plan, Adopting Clarifications, and Modifying Environmental Disclosure Program,” Appendix B, issued and effective April 14, 2005 and; “Order Authorizing Customer-Sited Tier Program Through 2015 and Resolving Geographic Balance and Other Issues Pertaining to the RPS Program;” issued and effective April 2, 2010.
13 NYSERDA, New York State Renewable Portfolio Standard Evaluation Report: 2009 Review (Evaluation Report). The Evaluation Report relied on the reports of two NYSERDA contractors: KEMA, New York Main Tier RPS: Impact and Process Evaluation (March 2009) and Summit Blue Consulting, New York State Renewable Portfolio Standard: Market Conditions Assessment–Final Report (February 19, 2009).
14 Proceeding on Motion of the Commission Regarding a Retail Renewable Portfolio Standard, “Order Establishing New RPS Goal and Resolving Main Tier Issues;” issued and effective January 8, 2010.
15 2009 State Energy Plan. Available at: http://www.nysenergyplan.com/2009stateenergyplan.html
66
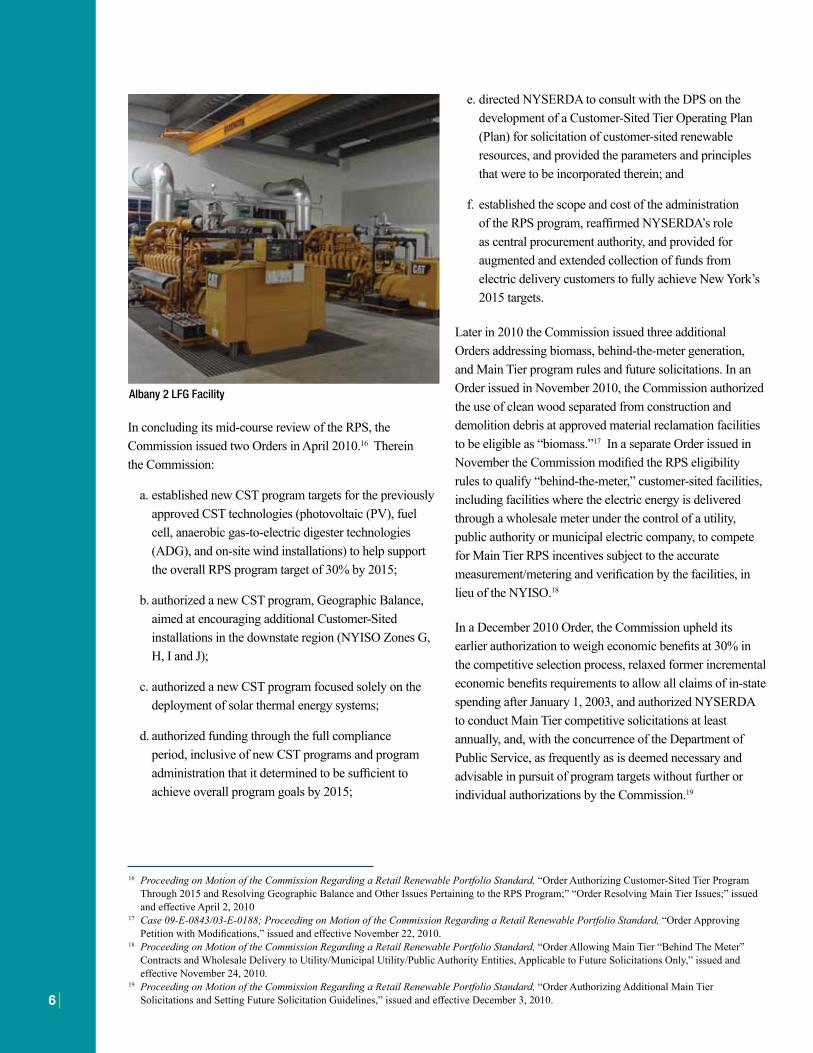
Albany 2 LFG Facility
In concluding its mid-course review of the RPS, the Commission issued two Orders in April 2010.16 Therein the Commission:
a. established new CST program targets for the previously approved CST technologies (photovoltaic (PV), fuel cell, anaerobic gas-to-electric digester technologies (ADG), and on-site wind installations) to help support the overall RPS program target of 30% by 2015;
b. authorized a new CST program, Geographic Balance, aimed at encouraging additional Customer-Sited installations in the downstate region (NYISO Zones G, H, I and J);
c. a uthorized a new CST program focused solely on the deployment of solar thermal energy systems;
d. authorized funding through the full compliance period, inclusive of new CST programs and program administration that it determined to be sufficient to achieve overall program goals by 2015;
e. directed NYSERDA to consult with the DPS on the development of a Customer-Sited Tier Operating Plan (Plan) for solicitation of customer-sited renewable resources, and provided the parameters and principles that were to be incorporated therein; and
f. established the scope and cost of the administration of the RPS program, reaffirmed NYSERDA’s role as central procurement authority, and provided for augmented and extended collection of funds from electric delivery customers to fully achieve New York’s 2015 targets.
Later in 2010 the Commission issued three additional Orders addressing biomass, behind-the-meter generation, and Main Tier program rules and future solicitations. In an Order issued in November 2010, the Commission authorized the use of clean wood separated from construction and demolition debris at approved material reclamation facilities to be eligible as “biomass.”17 In a separate Order issued in November the Commission modified the RPS eligibility rules to qualify “behind-the-meter,” customer-sited facilities, including facilities where the electric energy is delivered through a wholesale meter under the control of a utility, public authority or municipal electric company, to compete for Main Tier RPS incentives subject to the accurate measurement/metering and verification by the facilities, in lieu of the NYISO.18
In a December 2010 Order, the Commission upheld its earlier authorization to weigh economic benefits at 30% in the competitive selection process, relaxed former incremental economic benefits requirements to allow all claims of in-state spending after January 1, 2003, and authorized NYSERDA to conduct Main Tier competitive solicitations at least annually, and, with the concurrence of the Department of Public Service, as frequently as is deemed necessary and advisable in pursuit of program targets without further or individual authorizations by the Commission.19
16 Proceeding on Motion of the Commission Regarding a Retail Renewable Portfolio Standard, “Order Authorizing Customer-Sited Tier Program Through 2015 and Resolving Geographic Balance and Other Issues Pertaining to the RPS Program;” “Order Resolving Main Tier Issues;” issued and effective April 2, 2010
17 Case 09-E-0843/03-E-0188; Proceeding on Motion of the Commission Regarding a Retail Renewable Portfolio Standard, “Order Approving Petition with Modifications,” issued and effective November 22, 2010.
18 Proceeding on Motion of the Commission Regarding a Retail Renewable Portfolio Standard, “Order Allowing Main Tier “Behind The Meter” Contracts and Wholesale Delivery to Utility/Municipal Utility/Public Authority Entities, Applicable to Future Solicitations Only,” issued and effective November 24, 2010.
19 Proceeding on Motion of the Commission Regarding a Retail Renewable Portfolio Standard, “Order Authorizing Additional Main Tier Solicitations and Setting Future Solicitation Guidelines,” issued and effective December 3, 2010.
7
In a September 2011 Order, the Commission authorized NYSERDA to (a) reallocate unencumbered 2010 Customer-Sited Tier program funds so that such unused funds remained available for additional projects for 2011 in the same technology category from which they originated, except for $900,000 in unencumbered solar thermal funds that were re-allocated to fund a Solar Thermal awareness and outreach campaign during 2011 through 2013; (b) exceed the $2 million cumulative monthly cap on incentive payments in the Solar Photovoltaic category specifying that only funds reallocated from 2010 may be used in excess of the cap; (c) modify the equipment size cap for the on-site wind category from 600 kW per installation to 2-MW per installation; and (d) use accumulated unencumbered interest earnings and unencumbered administration funds to pay any New York State Cost Recovery Fee amount that exceeds the amount previously budgeted for such fee. Quality assurance and quality control expenses continue to be paid using program administration account funds.20
In a April 20, 2012 Order, the Commission authorized NYSERDA to modify the existing RPS maintenance resource contract with Boralex New York LP for its Chateaugay facility, by the minimum necessary to have a likely chance of keeping the facility solvent. ReEnergy Holdings LLC (as successor to Boralex New York LP) was offered an incremental RPS production incentive of $11.00 per MWh for its Chateaugay facility. This order requested that NYSERDA modify the April 1, 2006 RPS Maintenance Resource Contract Agreement between NYSERDA and ReEnergy and begin making payments subject to the modifications for the electricity produced on or after April 1, 2012.21
In response to a petition filed by NYSERDA on January 31, 2012, the Commission, in an April 20, 2012 Order, authorized NYSERDA to reallocate $19,093,556 in unencumbered Renewable Portfolio Standard Customer-Sited Tier 2011 program funds to enhance program funding
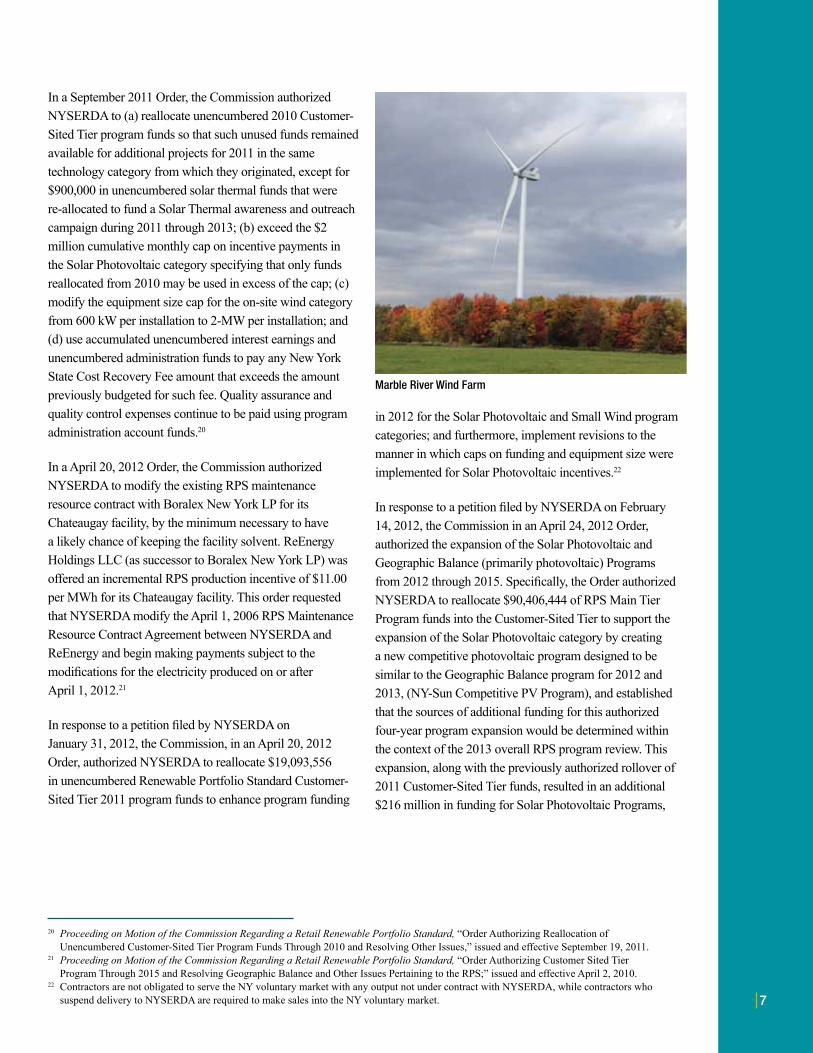
Marble River Wind Farm
in 2012 for the Solar Photovoltaic and Small Wind program categories; and furthermore, implement revisions to the manner in which caps on funding and equipment size were implemented for Solar Photovoltaic incentives.22
In response to a petition filed by NYSERDA on February 14, 2012, the Commission in an April 24, 2012 Order, authorized the expansion of the Solar Photovoltaic and Geographic Balance (primarily photovoltaic) Programs from 2012 through 2015. Specifically, the Order authorized NYSERDA to reallocate $90,406,444 of RPS Main Tier Program funds into the Customer-Sited Tier to support the expansion of the Solar Photovoltaic category by creating a new competitive photovoltaic program designed to be similar to the Geographic Balance program for 2012 and 2013, (NY-Sun Competitive PV Program), and established that the sources of additional funding for this authorized four-year program expansion would be determined within the context of the 2013 overall RPS program review. This expansion, along with the previously authorized rollover of 2011 Customer-Sited Tier funds, resulted in an additional $216 million in funding for Solar Photovoltaic Programs,
20 Proceeding on Motion of the Commission Regarding a Retail Renewable Portfolio Standard, “Order Authorizing Reallocation of Unencumbered Customer-Sited Tier Program Funds Through 2010 and Resolving Other Issues,” issued and effective September 19, 2011.
21 Proceeding on Motion of the Commission Regarding a Retail Renewable Portfolio Standard, “Order Authorizing Customer Sited Tier Program Through 2015 and Resolving Geographic Balance and Other Issues Pertaining to the RPS;” issued and effective April 2, 2010.
22 Contractors are not obligated to serve the NY voluntary market with any output not under contract with NYSERDA, while contractors who suspend delivery to NYSERDA are required to make sales into the NY voluntary market.

8
and annual budgets for the Solar Photovoltaic Program in the Customer-Sited Tier of $108 million per year for 2012 through 2015.23 NYSERDA also was instructed to develop a revised Customer-Sited Tier Operating Plan which would define the budgets and programs to be implemented through 2015. NYSERDA, in consultation with the DPS, issued the 2012-2015 CST Operating Plan on June 29, 2012, which setsforth general program specifications, capacity and generationtargets, and associated budgets.24
Two Orders were filed on August 16, 2012, both denying petitions from Niagara Generation, LLC. The first Order denied a request to restructure the price terms of Niagara Generation, LLC’s April 17, 2007 Renewable Portfolio Standard Main Tier contract.25 The second Order denied the petition of Niagara Generation, LLC for authorization to receive incentive payments for production derived from the burning of glued woods.26
In 2013 the Public Service Commission will undertake an evaluation of the Renewable Portfolio Standard (RPS). In support of this evaluation, NYSERDA will update previously completed cost estimates and conduct various cost/benefit analyses. NYSERDA will also assess certain program design elements as well as changes to key program policies. The
results of this evaluation will inform Commission decisions regarding the future of New York’s RPS.
Maintenance Resource Participation
In creating the Program, the Commission recognized that 19.3% of the energy sold at retail in New York was being generated by renewable resources that existed prior to the RPS being adopted in 2004 (baseline resources). For the purpose of ensuring the continuing operation of these valuable existing resources, the Commission’s September 24, 2004 Order established an additional Maintenance Resource program.27 To be eligible to receive RPS program funding as a Maintenance Resource, a baseline resource is required to demonstrate financial hardship through a formal request to the Commission. The Commission then determines the existence and degree of hardship and makes a determination as to the eligibility of the facility for Maintenance Resource treatment. The Commission may or may not grant Maintenance Resource status. If this status is granted, the Commission determines the form and magnitude of support to be offered. In the April 2010 Order, the Commission reaffirmed that baseline resources demonstrating financial hardship could, through a formal request to the Commission, be considered for Maintenance Resource Treatment.28
23 Proceeding on Motion of the Commission Regarding a Retail Renewable Portfolio Standard, “Order Authorizing the Expansion of the Solar Photovoltaic and Geographic Balance Programs from 2012 through 2015 and the Reallocation of Main-Tier Unencumbered Funds,” issued and effective April 24, 2012.
24 Proceeding on Motion of the Commission Regarding a Retail Renewable Portfolio Standard, Renewable Portfolio Standard Customer-Sited Tier Program Operating Plan (2012-2015), filed June 29, 2012.
25 Proceeding on Motion of the Commission Regarding a Retail Renewable Portfolio Standard, “Order Denying Request for Restructuring of a Contract,” issued and effective August 16, 2012.
26 Proceeding on Motion of the Commission Regarding a Retail Renewable Portfolio Standard, “Order Denying Request to Make Glued Wood Eligible for Burning as an up to 10% Portion of Biomass Fuel,” issued and effective August 16, 2012.
27 Proceeding on Motion of the Commission Regarding a Retail Renewable Portfolio Standard, “Order Regarding Retail Renewable Portfolio Standard;” issued and effective September 24, 2004.
28 Proceeding on Motion of the Commission Regarding a Retail Renewable Portfolio Standard, “Order Authorizing Customer-Sited Tier Program Through 2015 and Resolving Geographic Balance and Other Issues Pertaining to the RPS;” issued and effective April 2, 2010.
Dutch Hill Wind Farm
9
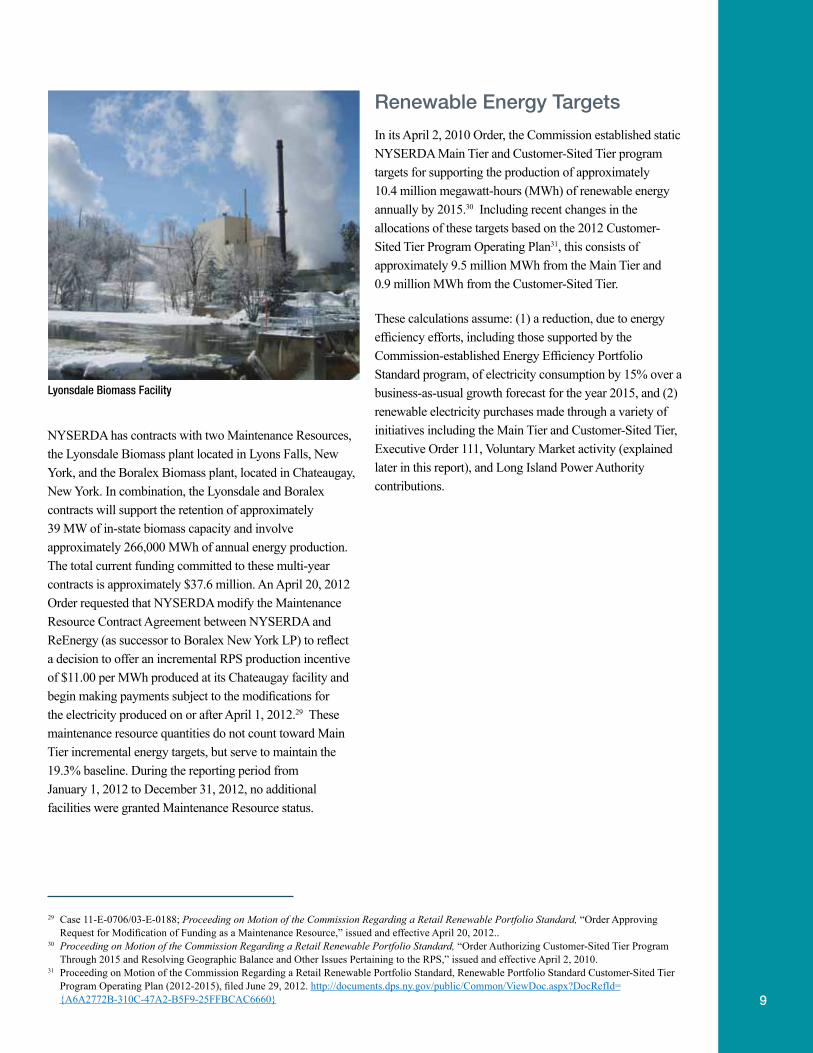
Lyonsdale Biomass Facility
NYSERDA has contracts with two Maintenance Resources, the Lyonsdale Biomass plant located in Lyons Falls, New York, and the Boralex Biomass plant, located in Chateaugay, New York. In combination, the Lyonsdale and Boralex contracts will support the retention of approximately 39 MW of in-state biomass capacity and involve approximately 266,000 MWh of annual energy production. The total current funding committed to these multi-year contracts is approximately $37.6 million. An April 20, 2012 Order requested that NYSERDA modify the Maintenance Resource Contract Agreement between NYSERDA and ReEnergy (as successor to Boralex New York LP) to reflect a decision to offer an incremental RPS production incentive of $11.00 per MWh produced at its Chateaugay facility and begin making payments subject to the modifications for the electricity produced on or after April 1, 2012.29 These maintenance resource quantities do not count toward Main Tier incremental energy targets, but serve to maintain the 19.3% baseline. During the reporting period from January 1, 2012 to December 31, 2012, no additional facilities were granted Maintenance Resource status.
Renewable energy Targets
In its April 2, 2010 Order, the Commission established static NYSERDA Main Tier and Customer-Sited Tier program targets for supporting the production of approximately 10.4 million megawatt-hours (MWh) of renewable energy annually by 2015.30 Including recent changes in the allocations of these targets based on the 2012 Customer-Sited Tier Program Operating Plan31, this consists of approximately 9.5 million MWh from the Main Tier and 0.9 million MWh from the Customer-Sited Tier.
These calculations assume: (1) a reduction, due to energy efficiency efforts, including those supported by the Commission-established Energy Efficiency Portfolio Standard program, of electricity consumption by 15% over a business-as-usual growth forecast for the year 2015, and (2) renewable electricity purchases made through a variety of initiatives including the Main Tier and Customer-Sited Tier, Executive Order 111, Voluntary Market activity (explained later in this report), and Long Island Power Authority contributions.
29 Case 11-E-0706/03-E-0188; Proceeding on Motion of the Commission Regarding a Retail Renewable Portfolio Standard, “Order Approving Request for Modification of Funding as a Maintenance Resource,” issued and effective April 20, 2012..
30 Proceeding on Motion of the Commission Regarding a Retail Renewable Portfolio Standard, “Order Authorizing Customer-Sited Tier Program Through 2015 and Resolving Geographic Balance and Other Issues Pertaining to the RPS,” issued and effective April 2, 2010.
31 Proceeding on Motion of the Commission Regarding a Retail Renewable Portfolio Standard, Renewable Portfolio Standard Customer-Sited Tier Program Operating Plan (2012-2015), filed June 29, 2012. http://documents.dps.ny.gov/public/Common/ViewDoc.aspx?DocRefId={A6A2772B-310C-47A2-B5F9-25FFBCAC6660}
10
32 Contractors are not obligated to serve the NY voluntary market with any output not under contract with NYSERDA, while contractors who suspend delivery to NYSERDA are required to make sales into the NY voluntary market.
33 Preliminary Statewide Annual Energy Report for State Fiscal Year 2010-2011 Executive Order No. 111 “Green and Clean” State Buildings and Vehicles. (Executive Order progress may include generation from Customer-Sited Tier resources.)
Voluntary Market executive order 111Several program design features have been incorporated into Executive Order 111 required New York State agencies to the Main Tier in an effort to support the ultimate program procure 20% of their electricity from renewable sources goal of transitioning to the voluntary market. For example, by 2010. The affected state agencies have reported to as a result of a Commission Order and beginning with NYSERDA that, during State Fiscal Year 2010/2011 (April 1 the second Main Tier solicitation, NYSERDA instituted through March 31), 360 GWh of the electricity used in state a limitation that caps bids at 95% of a facility’s attributes, buildings was produced from renewable sources.33 thus guaranteeing that a minimum of 5% of the renewable energy generated by contracted resources is available for Executive Order 88 was issued in December 2012 and voluntary sales. Also, an increasing percentage of Main Tier revoked and superseded Executive Order 111. Executive projects have taken advantage of a program design feature Order 88 does not continue the New York State agency that permits partial bidding, thus leaving additional output renewable purchasing targets, instead focusing on energy available for non-RPS sales including the voluntary market efficiency targets for the affected State Agencies. in New York. In addition, NYSERDA provides flexibility for contractors to suspend deliveries to NYSERDA in order to make sales to the New York voluntary green market and, as of December 31, 2012, three facilities have exercised this option.32
According to DPS, in 2010, 395,212 MWh were purchased by 27 Energy Service Companies, six Investor-owned utilities, 2 public authorities, 1 educational institution and 1 municipality (read more at: http://www3.dps.ny.gov/e/energylabel.nsf/ ) This generation excludes Long Island Power Authority (LIPA) transactions and those associated with baseline (pre-existing) resources. The total voluntary market purchases including LIPA and baseline resources for 2010 was 1,750,991 MWh. This total does not include bilateral contractual purchases of renewable energy by Load Serving Entities.
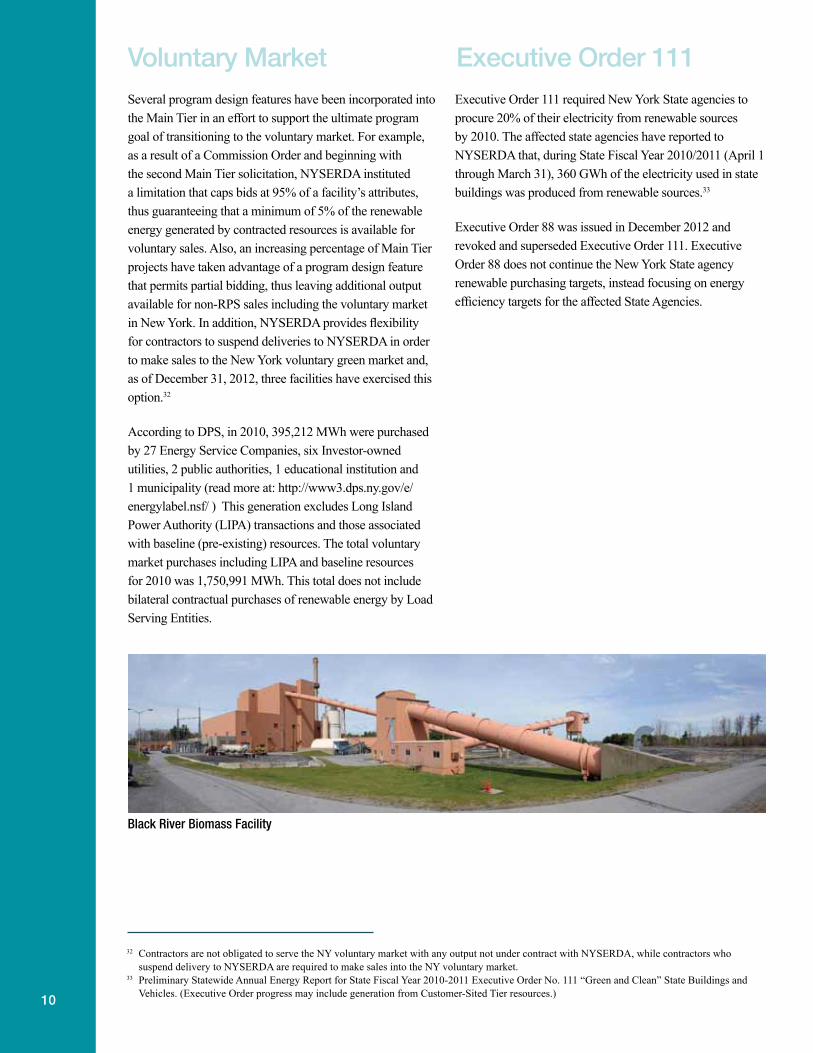
Black River Biomass Facility
11
Progress and Results
Main Tier and Customer- sited Tier Progress
The NYSERDA program target, established in the Commission’s April 2, 2010 Order, for the combined Main Tier and Customer-Sited Tier, is approximately 10.4 million MWh by 2015.34 In response to an April 24, 2012 Commission Order, NYSERDA published the 2012-2015 Customer-Sited Tier Program Operating Plan (Plan) on June 29, 2012 which revised the Customer-Sited Tier targets based on increased funding allocations for some programs.35 The Plan set forth the program goals and implementation strategies for the Customer-Sited Tier program for the 2012 through 2015 period.
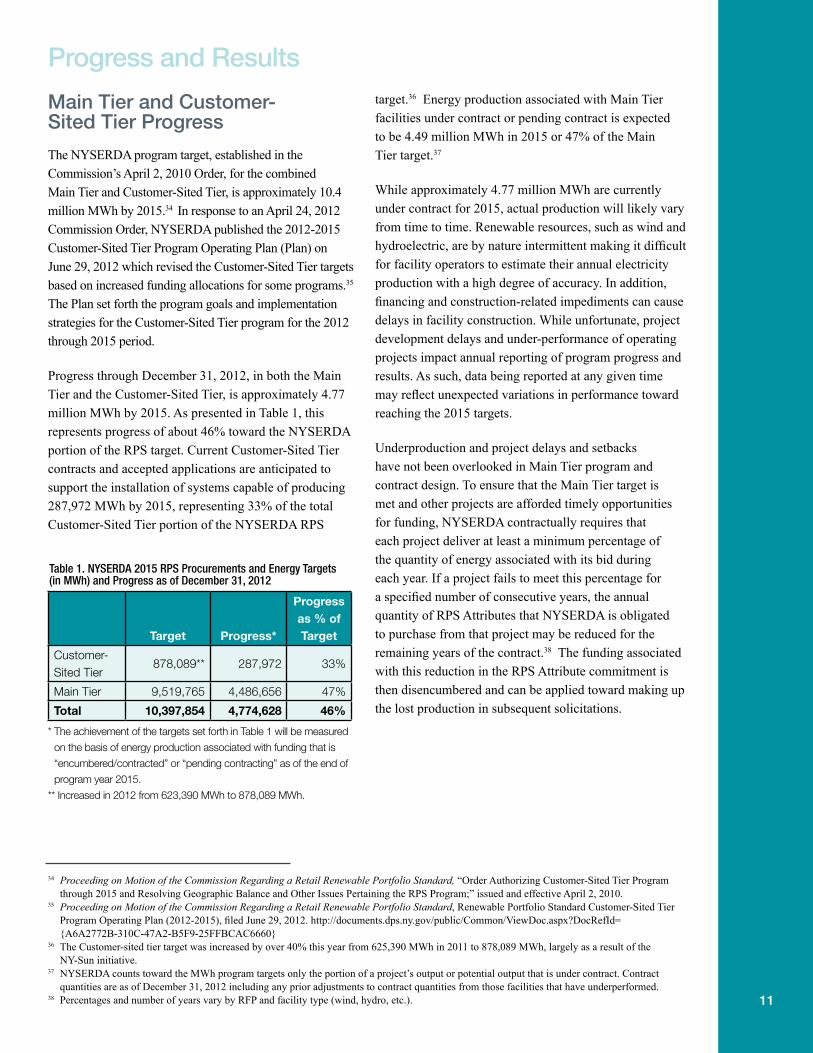
Progress through December 31, 2012, in both the Main Tier and the Customer-Sited Tier, is approximately 4.77 million MWh by 2015. As presented in Table 1, this represents progress of about 46% toward the NYSERDA portion of the RPS target. Current Customer-Sited Tier contracts and accepted applications are anticipated to support the installation of systems capable of producing 287,972 MWh by 2015, representing 33% of the total Customer-Sited Tier portion of the NYSERDA RPS
Table 1. NYSERDA 2015 RPS Procurements and Energy Targets (in MWh) and Progress as of December 31, 2012
Progress as % of
Target Progress* Target
Customer- Sited Tier
878,089** 287,972 33%
Main Tier 9,519,765 4,486,656 47%
Total 10,397,854 4,774,628 46%
* The achievement of the targets set forth in Table 1 will be measured
on the basis of energy production associated with funding that is
“encumbered/contracted” or “pending contracting” as of the end of
program year 2015.
** Increased in 2012 from 623,390 MWh to 878,089 MWh.
target.36 Energy production associated with Main Tier facilities under contract or pending contract is expected to be 4.49 million MWh in 2015 or 47% of the Main Tier target.37
While approximately 4.77 million MWh are currently under contract for 2015, actual production will likely vary from time to time. Renewable resources, such as wind and hydroelectric, are by nature intermittent making it difficult for facility operators to estimate their annual electricity production with a high degree of accuracy. In addition, financing and construction-related impediments can cause delays in facility construction. While unfortunate, project development delays and under-performance of operating projects impact annual reporting of program progress and results. As such, data being reported at any given time may reflect unexpected variations in performance toward reaching the 2015 targets.
Underproduction and project delays and setbacks have not been overlooked in Main Tier program and contract design. To ensure that the Main Tier target is met and other projects are afforded timely opportunities for funding, NYSERDA contractually requires that each project deliver at least a minimum percentage of the quantity of energy associated with its bid during each year. If a project fails to meet this percentage for a specified number of consecutive years, the annual quantity of RPS Attributes that NYSERDA is obligated to purchase from that project may be reduced for the remaining years of the contract.38 The funding associated with this reduction in the RPS Attribute commitment is then disencumbered and can be applied toward making up the lost production in subsequent solicitations.
34 Proceeding on Motion of the Commission Regarding a Retail Renewable Portfolio Standard, “Order Authorizing Customer-Sited Tier Program through 2015 and Resolving Geographic Balance and Other Issues Pertaining the RPS Program;” issued and effective April 2, 2010.
35 Proceeding on Motion of the Commission Regarding a Retail Renewable Portfolio Standard, Renewable Portfolio Standard Customer-Sited Tier Program Operating Plan (2012-2015), filed June 29, 2012. http://documents.dps.ny.gov/public/Common/ViewDoc.aspx?DocRefId= {A6A2772B-310C-47A2-B5F9-25FFBCAC6660}
36 The Customer-sited tier target was increased by over 40% this year from 625,390 MWh in 2011 to 878,089 MWh, largely as a result of the NY-Sun initiative.
37 NYSERDA counts toward the MWh program targets only the portion of a project’s output or potential output that is under contract. Contract quantities are as of December 31, 2012 including any prior adjustments to contract quantities from those facilities that have underperformed.
38 Percentages and number of years vary by RFP and facility type (wind, hydro, etc.).

12
For example, the Noble Altona and Chateaugay repowering. Contracts with four generators ended prior Windparks did not meet their contract obligation to to the end of 2012.39 Three projects are located out of deliver the required 80% minimum of contracted energy state (one project is located in Quebec, two projects are output for three consecutive years (February 2009– located in Pennsylvania), and the remaining projects are February 2012). As a result, the facilities’ contracted in New York. When all of the projects reach commercial bid quantity was reduced for the remaining seven years operation, approximately 1,834 MW of new renewable on each contract. This adjustment represented a loss of capacity40 will be added, of which 1,787 MW will be approximately 154,000 MWh per year toward program located in New York. Wind power is the predominant targets. The funds associated with that quantity were generating technology in the Main Tier, representing disencumbered from the contracts and are now available 1,653 MW of new renewable capacity under contract, of for subsequent solicitations. which 1,561 MW was in operation at the end of 2012.
The balance of new capacity is comprised of hydroelectric If a project overproduces, no contract modification is upgrades, landfill gas to electricity, and biomass (direct made; NYSERDA is not obligated to purchase more RPS and co-fired) facilities. As of December 31, 2012, 50 Attributes than were bid. Considering that the majority of projects representing approximately 1,695 MW are RPS resources are intermittent, it is likely that additional operating, with the remaining 4 projects representing contract adjustments will be implemented in future years. approximately 139 MW expected to be in operation by These contract adjustments may be implemented prior to September 30, 2013. Further details on the status of Main 2015 for those projects that have only recently entered Tier projects can be found in Table 2.commercial operation or are under construction.
The Main Tier facilities with active RPS contracts are
Main Tier owned by or affiliated with 29 different entities, as shown in Table 3.
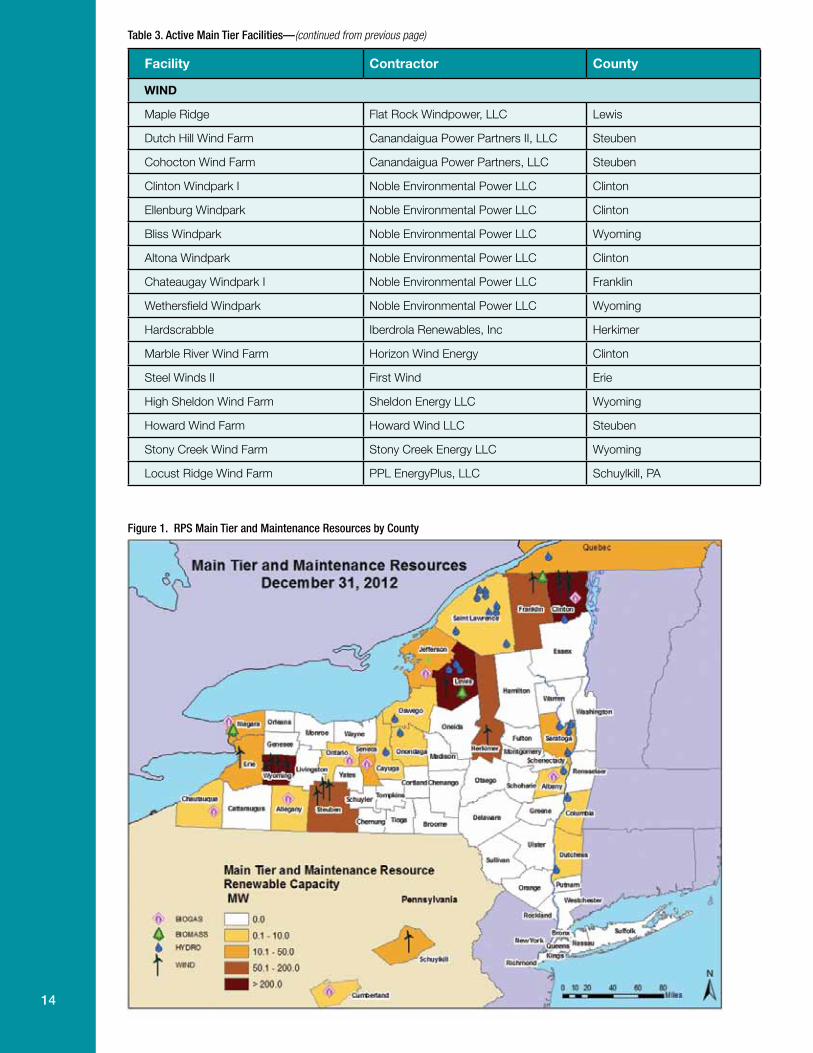
NYSERDA has conducted seven competitive Main A map identifying the location of each Main Tier and Tier solicitations and is in the process of conducting Maintenance Resource facility either under contract or an eighth Main Tier solicitation in pursuit of the Main having a pending contract with NYSERDA can be found Tier target as set forth in Table 1. Through these seven in Figure 1. Additional details about each Main Tier and completed solicitations; NYSERDA has existing Maintenance Resource facility currently participating in contracts to procure RPS Attributes from 54 large-scale the RPS can be found in Appendix A. electricity generation projects, facility upgrades or facility
Table 2. Project Development Status for Active Main Tier Projects
MW Operating
MW In Development/ Construction
Total MW
# Operating
# In Development/ Construction Total #
Wind 1,560.6 92.8 1,653.4 16 1 17
Hydroelectric 48.4 2.9 51.3 23 2 25
Biomass 26.0 43.33 69.3 1 1 2
Biogas 60.1 0 60.1 10 0 10
Totals 1,695.1 138.9 1,834.0 50 4 54
39 RFP 916 permitted contract delivery terms of less than 10 years. 40 “New Renewable Capacity” generally refers to the Nameplate Capacity of facilities under contract in the RPS that did not exist prior to the start of
the RPS program, including any portion not under contract with NYSERDA.
13
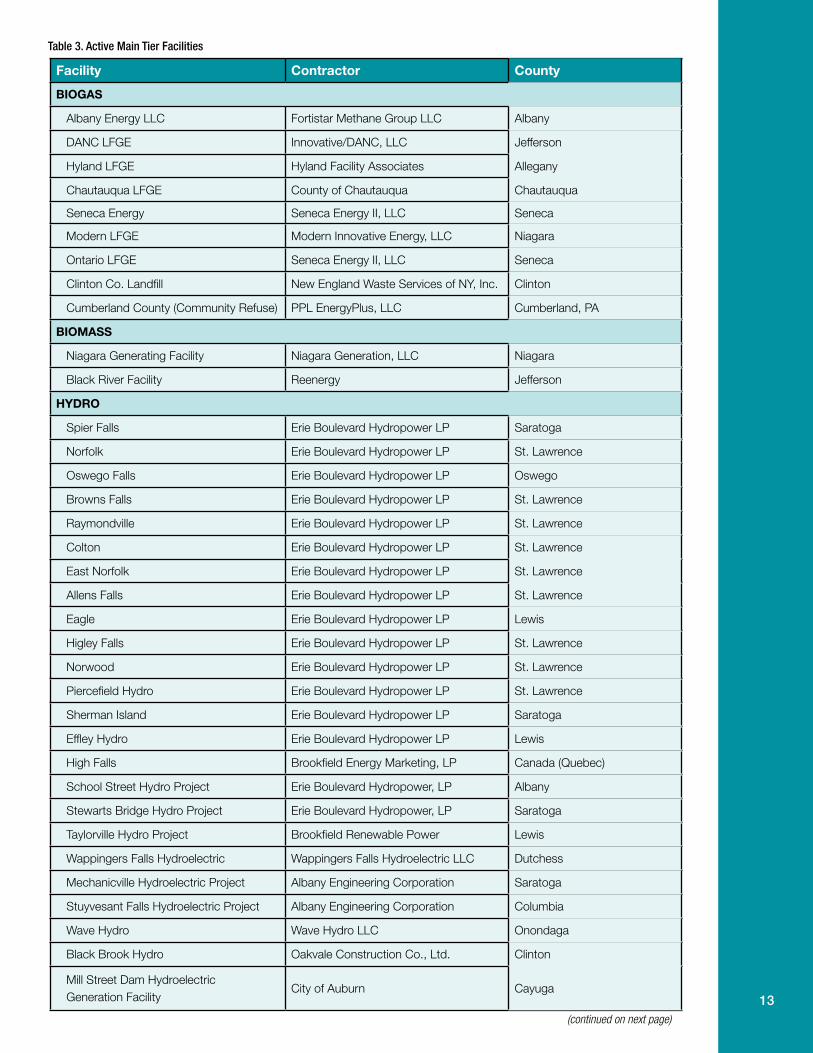
Table 3. Active Main Tier Facilities
Facility Contractor County
BIOGAS
Albany Energy LLC Fortistar Methane Group LLC Albany
DANC LFGE Innovative/DANC, LLC Jefferson
Hyland LFGE Hyland Facility Associates Allegany
Chautauqua LFGE County of Chautauqua Chautauqua
Seneca Energy Seneca Energy II, LLC Seneca
Modern LFGE Modern Innovative Energy, LLC Niagara
Ontario LFGE Seneca Energy II, LLC Seneca
Clinton Co. Landfill New England Waste Services of NY, Inc. Clinton
Cumberland County (Community Refuse) PPL EnergyPlus, LLC Cumberland, PA
BIOMASS
Niagara Generating Facility Niagara Generation, LLC Niagara
Black River Facility Reenergy Jefferson
HYDRO
Spier Falls Erie Boulevard Hydropower LP Saratoga
Norfolk Erie Boulevard Hydropower LP St. Lawrence
Oswego Falls Erie Boulevard Hydropower LP Oswego
Browns Falls Erie Boulevard Hydropower LP St. Lawrence
Raymondville Erie Boulevard Hydropower LP St. Lawrence
Colton Erie Boulevard Hydropower LP St. Lawrence
East Norfolk Erie Boulevard Hydropower LP St. Lawrence
Allens Falls Erie Boulevard Hydropower LP St. Lawrence
Eagle Erie Boulevard Hydropower LP Lewis
Higley Falls Erie Boulevard Hydropower LP St. Lawrence
Norwood Erie Boulevard Hydropower LP St. Lawrence
Piercefield Hydro Erie Boulevard Hydropower LP St. Lawrence
Sherman Island Erie Boulevard Hydropower LP Saratoga
Effley Hydro Erie Boulevard Hydropower LP Lewis
High Falls Brookfield Energy Marketing, LP Canada (Quebec)
School Street Hydro Project Erie Boulevard Hydropower, LP Albany
Stewarts Bridge Hydro Project Erie Boulevard Hydropower, LP Saratoga
Taylorville Hydro Project Brookfield Renewable Power Lewis
Wappingers Falls Hydroelectric Wappingers Falls Hydroelectric LLC Dutchess
Mechanicville Hydroelectric Project Albany Engineering Corporation Saratoga
Stuyvesant Falls Hydroelectric Project Albany Engineering Corporation Columbia
Wave Hydro Wave Hydro LLC Onondaga
Black Brook Hydro Oakvale Construction Co., Ltd. Clinton
Mill Street Dam Hydroelectric Generation Facility
City of Auburn Cayuga
(continued on next page)
14
Table 3. Active Main Tier Facilities—(continued from previous page)
Facility Contractor County
WIND
Maple Ridge Flat Rock Windpower, LLC Lewis
Dutch Hill Wind Farm Canandaigua Power Partners II, LLC Steuben
Cohocton Wind Farm Canandaigua Power Partners, LLC Steuben
Clinton Windpark I Noble Environmental Power LLC Clinton
Ellenburg Windpark Noble Environmental Power LLC Clinton
Bliss Windpark Noble Environmental Power LLC Wyoming
Altona Windpark Noble Environmental Power LLC Clinton
Chateaugay Windpark I Noble Environmental Power LLC Franklin
Wethersfield Windpark Noble Environmental Power LLC Wyoming
Hardscrabble Iberdrola Renewables, Inc Herkimer
Marble River Wind Farm Horizon Wind Energy Clinton
Steel Winds II First Wind Erie
High Sheldon Wind Farm Sheldon Energy LLC Wyoming
Howard Wind Farm Howard Wind LLC Steuben
Stony Creek Wind Farm Stony Creek Energy LLC Wyoming
Locust Ridge Wind Farm PPL EnergyPlus, LLC Schuylkill, PA
Figure 1. RPS Main Tier and Maintenance Resources by County
15
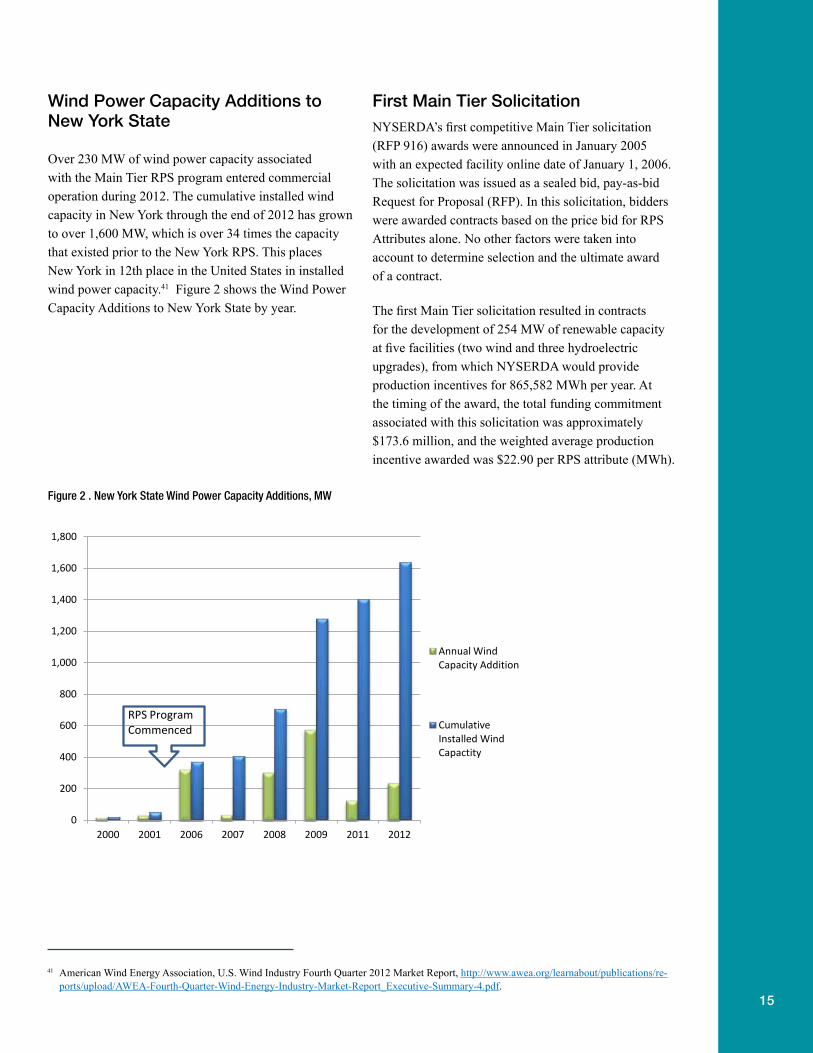
Wind Power Capacity additions to first Main Tier solicitationnew York state NYSERDA’s first competitive Main Tier solicitation
(RFP 916) awards were announced in January 2005 Over 230 MW of wind power capacity associated with an expected facility online date of January 1, 2006. with the Main Tier RPS program entered commercial The solicitation was issued as a sealed bid, pay-as-bid operation during 2012. The cumulative installed wind Request for Proposal (RFP). In this solicitation, bidders capacity in New York through the end of 2012 has grown were awarded contracts based on the price bid for RPS to over 1,600 MW, which is over 34 times the capacity Attributes alone. No other factors were taken into that existed prior to the New York RPS. This places account to determine selection and the ultimate award New York in 12th place in the United States in installed of a contract.wind power capacity.41 Figure 2 shows the Wind Power Capacity Additions to New York State by year. The first Main Tier solicitation resulted in contracts
for the development of 254 MW of renewable capacity at five facilities (two wind and three hydroelectric upgrades), from which NYSERDA would provide production incentives for 865,582 MWh per year. At the timing of the award, the total funding commitment associated with this solicitation was approximately $173.6 million, and the weighted average production incentive awarded was $22.90 per RPS attribute (MWh).
Figure 2 . New York State Wind Power Capacity Additions, MW
0
200
400
600
800
1,000
1,200
1,400
1,600
1,800
2000 2001 2006 2007 2008 2009 2011 2012
Annual Wind Capacity Addition
Cumulative Installed Wind Capactity
RPS Program Commenced
41 American Wind Energy Association, U.S. Wind Industry Fourth Quarter 2012 Market Report, http://www.awea.org/learnabout/publications/re-ports/upload/AWEA-Fourth-Quarter-Wind-Energy-Industry-Market-Report_Executive-Summary-4.pdf.
16
42 Proceeding on Motion of the Commission Regarding a Retail Renewable Portfolio Standard, “Order Authorizing Solicitation Methods and Con-sideration of Bid Evaluation Criteria;” issued and effective October 19, 2006.
43 Proceeding on Motion of the Commission Regarding a Retail Renewable Portfolio Standard, “Order Authorizing Additional Main Tier Solicita-tion and Setting Solicitation Guidelines;” issued and effective August 21, 2009.
second Main Tier solicitationThe second competitive Main Tier solicitation (RFP 1037) awards were announced in February 2007 with anexpected facility online date of January 1, 2008. Unlikethe first Main Tier solicitation, awards were based on two evaluation components: (1) the bid price, weighted at 70%; and (2) the ability of the bidder to demonstrate economic benefits to New York State created by the development, construction and operation of the bid facility, weighted at 30%.42 The solicitation was designas a two-step process, consisting of: (1) an application step that pre-qualified bidders; and (2) a competitive bid proposal submission step. Only those bidders foundpre-qualified through the Step 1 application process, wepermitted to submit bid proposals in Step 2.
The second solicitation resulted in NYSERDA awardingcontracts to provide production incentives to 20 new or upgraded facilities, all located in New York. One facilityNoble Chateaugay Windpark, was split into two contracat the request of the contractor for reasons related to physical substation configurations and interconnection, creating two windparks: Noble Bellmont Windpark and Noble Chateaugay Windpark. The Noble Bellmont Windpark was only partially constructed and its contracwas terminated in 2011.
Under the awarded contracts, 671 MW of new renewable capacity were selected, from which NYSERDA could provide production incentives for approximately 1,800,000 MWh per year. At the time of the award, the total funding commitment associated with this solicitation
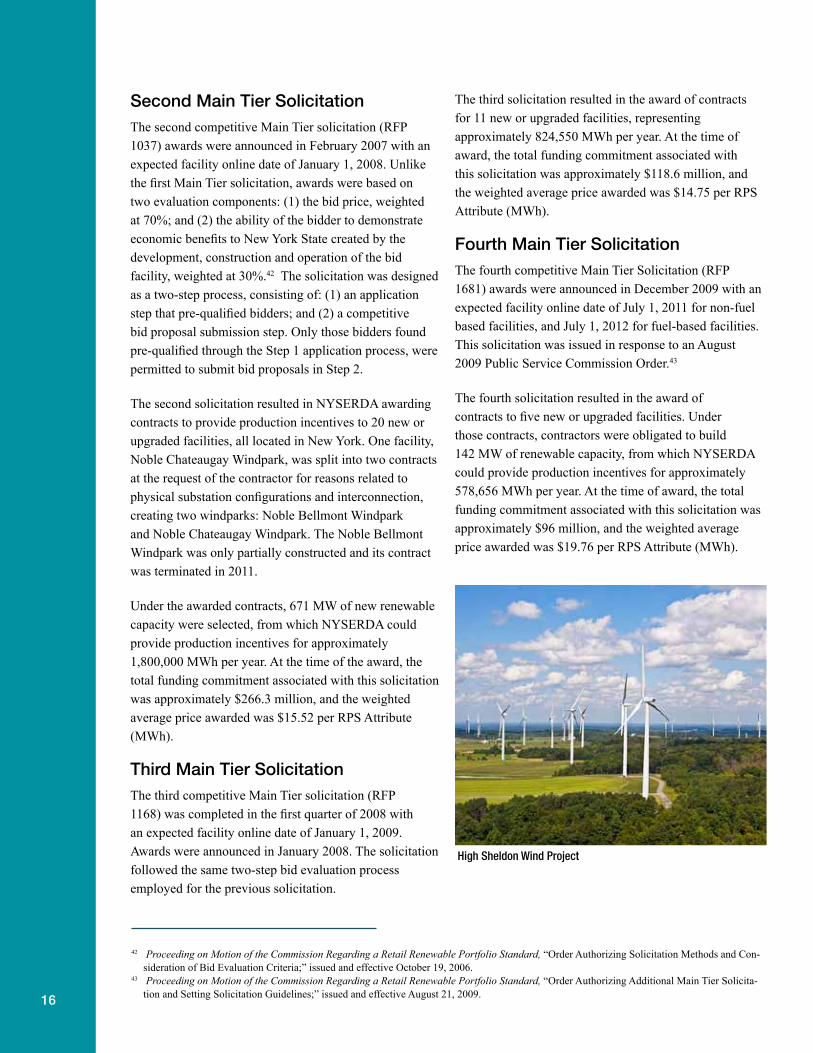
High Sheldon Wind Project
was approximately $266.3 million, and the weighted average price awarded was $15.52 per RPS Attribute (MWh).
Third Main Tier solicitationThe third competitive Main Tier solicitation (RFP 1168) was completed in the first quarter of 2008 with an expected facility online date of January 1, 2009. Awards were announced in January 2008. The solicitationfollowed the same two-step bid evaluation process employed for the previous solicitation.
The third solicitation resulted in the award of contracts for 11 new or upgraded facilities, representing approximately 824,550 MWh per year. At the time of
award, the total funding commitment associated with
this solicitation was approximately $118.6 million, and the weighted average price awarded was $14.75 per RPS Attribute (MWh).
fourth Main Tier solicitationThe fourth competitive Main Tier Solicitation (RFP ed 1681) awards were announced in December 2009 with an expected facility online date of July 1, 2011 for non-fuel based facilities, and July 1, 2012 for fuel-based facilities. This solicitation was issued in response to an August re 2009 Public Service Commission Order.43
The fourth solicitation resulted in the award of contracts to five new or upgraded facilities. Under those contracts, contractors were obligated to build , 142 MW of renewable capacity, from which NYSERDA ts could provide production incentives for approximately 578,656 MWh per year. At the time of award, the total funding commitment associated with this solicitation was approximately $96 million, and the weighted average price awarded was $19.76 per RPS Attribute (MWh).t

17
fifth Main Tier solicitationThe fifth competitive Main Tier Solicitation (RFP 1851) awards were made in March 2010, with an expected facility online date of December 31, 2011. This solicitation was issued in response to a January 2010 Public Service Commission Order.44
The fifth solicitation resulted in the award of contracts to provide production incentives to eight new or upgraded facilities. Under these contracts, contractors were obligated to build 318 MW of renewable capacity, from which NYSERDA could provide production incentives for approximately 1,100,000 MWh per year. The total funding commitment associated with this solicitation was approximately $204 million, and the weighted average price awarded was $21.17 per RPS Attribute (MWh).
Following the announcement of the awards for RFP 1851, one bidder’s award was rescinded and contract awards were made to the next highest ranked bidders that could be funded with the approved solicitation budget. This included two hydroelectric facilities and one wind farm. Also, an agreement awarded as a result of this solicitation for the Marble River Wind Farm was combined with an agreement awarded under a subsequent solicitation to reflect an increase in the size of the facility. The combined capacity under contract for this facility is reflected in Appendix A under the Sixth Main Tier Solicitation but the committed funding remains separated in the respective solicitation balances shown in Appendix B.
sixth Main Tier solicitationThe sixth competitive Main Tier Solicitation (RFP 2226) awards were made in April 2011, with an expected facility online date of July 31, 2012. This solicitation was issued by NYSERDA per the December 2010 Order by which the Commission authorized NYSERDA to conduct Main Tier competitive solicitations at least annually, and with the concurrence of the Department of Public Service, as frequently as is deemed necessary and advisable in pursuit of program targets without further or individual authorizations by the Commission.45
The sixth solicitation resulted in the award of contracts to provide production incentives to 17 new or upgraded facilities. Under those contracts, contractors are obligated to build 315 MW of renewable capacity, from which NYSERDA could provide production incentives for over 1,100,000 MWh per year. At the time of award, the total funding commitment associated with this solicitation was approximately $191 million, and the weighted average price awarded was $22.01 per RPS Attribute (MWh).
seventh Main Tier solicitationThe seventh competitive Main Tier Solicitation (RFP 2389) awards were made in December 2011, with an expected facility online date of December 31, 2012. This solicitation was issued by NYSERDA per the December 2010 Order by which the Commission authorized NYSERDA to conduct Main Tier competitive solicitations at least annually, and with the concurrence of the Department of Public Service, as frequently as is deemed necessary and advisable in pursuit of program targets without further or individual authorizations by the Commission.
Steel Winds II
44 Proceeding on Motion of the Commission Regarding a Retail Renewable Portfolio Standard, “Order Establishing New RPS Goal and Resolving Main Tier Issues;” issued and effective January 8, 2010.
45 Proceeding on Motion of the Commission Regarding a Retail Renewable Portfolio Standard, “Order Authorizing Additional Main Tier Solicitations and Setting Future Solicitation Guidelines;” issued and effective December 3, 2010.

18
The seventh solicitation resulted in the award of contracts Changes subsequent to to provide production incentives to seven new or solicitation awardsupgraded facilities. Under those contracts, contractors are
As discussed above, changes may arise after the obligated to build over 88 MW of renewable capacity, announcement of solicitation awards. Awarded contracts from which NYSERDA could provide production may not be signed, facilities may not be built as proposed, incentives for approximately 460,000 MWh per year. and contractual adjustments may be instituted based At the time of award, the total funding commitment on repeated underperformance, or other contractual associated with this solicitation was approximately nonperformance. Contractual adjustments reflecting $132 million, and the weighted average price awarded these inevitable circumstances occur regularly. Data was $28.70 per RPS Attribute (MWh).presented in Appendix A and B of this report includes
eighth Main Tier solicitation any adjustments that have been instituted through December 31, 2012.
The eighth competitive Main Tier Solicitation (RFP 2554) was issued on December 20, 2012 and reissued Weighted average award Price Trendson January 4, 2013.46 Through the issuance of RFP 2554
The aggregate MWh weighted average award price from NYSERDA seeks to purchase RPS Attributes associated the seven Main Tier solicitations is $19.25. The seventh with electricity generated from eligible Bid Facilities solicitation yielded the highest weighted average award that enter Commercial Operation on or before May price ($28.70) while the third solicitation resulted in the 1, 2014 (unless extended to December 31, 2014). An lowest ($14.75). As is illustrated in Figure 3, average announcement of the results of the current solicitation is contract award prices for the second (RFP 1037) through anticipated to occur by the summer of 2013, pending a the sixth (RFP 2226) Main Tier solicitation were lower Commission decision on a December 2012 NYSERDA than the first Main Tier solicitation (RFP 916). Prices for Petition requesting that rules of the RPS Program Main the seventh (RFP 2389) trended higher. Tier be revised to limit eligibility in the program to
projects located in New York State.47
$
$
$
$
$
$
Fi
$22.90
$15.52 $14.75
$19.76 $21.17 $22.01
$28.70
$0
$5
10
15
20
25
30
35
RFP 916 Jan. 2005
RFP 1037 Dec. 2006
RFP 1168 Nov. 2007
RFP 1681 Oct. 2009
RFP 1851 Mar. 2010
RFP 2226 Apr. 2011
RFP 2389 Dec. 2011
Weighted Avg. Attribute Price
gure 3. Main Tier Solicitations –Weighted Average Award Price by RFP
46 RFP 2554 - Renewable Portfolio Standard Program Purchase of Renewable Energy Attributes, http://www.nyserda.ny.gov/Funding-Opportunities/Current-Funding-Opportunities/RFP-2554-Renewable-Portfolio-Standard-Program-Purchase-of-Renewable-Energy-Attributes.aspx
47 Petition for Modification of RPS Main Tier Program, http://documents.dps.ny.gov/public/Common/ViewDoc.aspx?DocRefId={98BC8B49-D8FB-4054-A6B5-8F34F9EB5A1C}
19
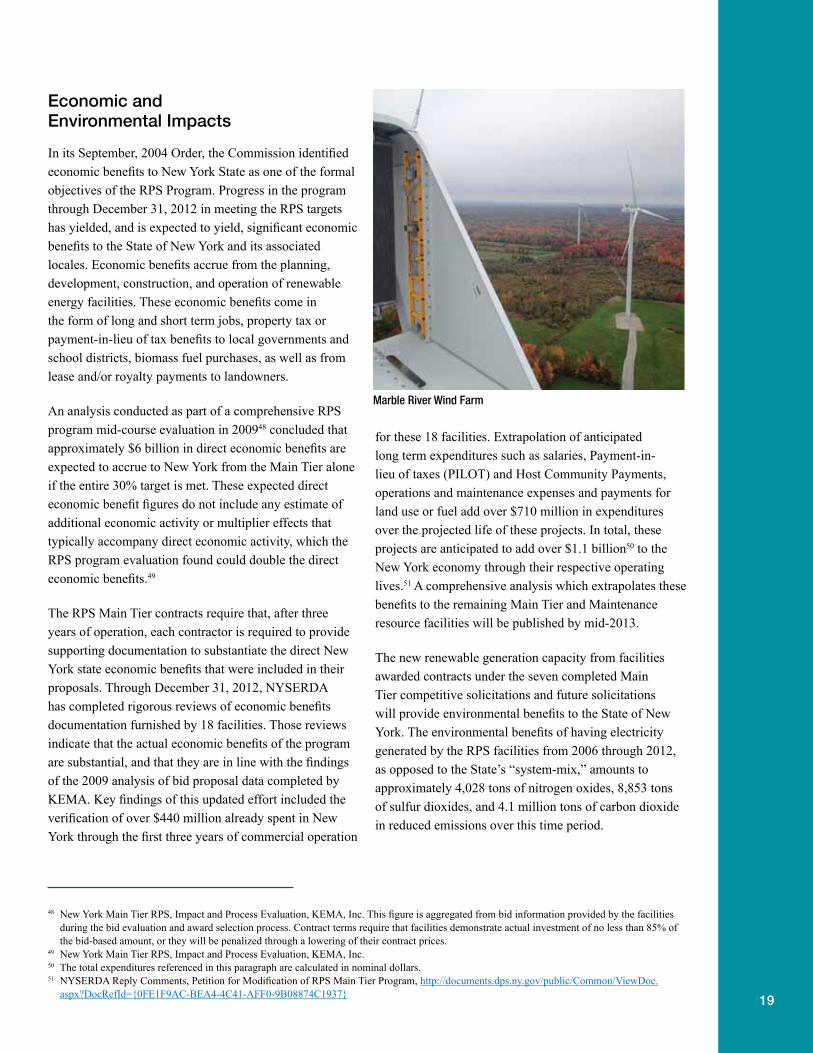
economic and environmental Impacts
In its September, 2004 Order, the Commission identified economic benefits to New York State as one of the formal objectives of the RPS Program. Progress in the program through December 31, 2012 in meeting the RPS targets has yielded, and is expected to yield, significant economic benefits to the State of New York and its associated locales. Economic benefits accrue from the planning, development, construction, and operation of renewable energy facilities. These economic benefits come in the form of long and short term jobs, property tax or payment-in-lieu of tax benefits to local governments and school districts, biomass fuel purchases, as well as from lease and/or royalty payments to landowners.
An analysis conducted as part of a comprehensive RPS program mid-course evaluation in 200948 concluded that approximately $6 billion in direct economic benefits are expected to accrue to New York from the Main Tier alone if the entire 30% target is met. These expected direct economic benefit figures do not include any estimate of additional economic activity or multiplier effects that typically accompany direct economic activity, which the RPS program evaluation found could double the direct economic benefits.49
The RPS Main Tier contracts require that, after three years of operation, each contractor is required to provide supporting documentation to substantiate the direct New York state economic benefits that were included in their proposals. Through December 31, 2012, NYSERDA has completed rigorous reviews of economic benefits documentation furnished by 18 facilities. Those reviews indicate that the actual economic benefits of the program are substantial, and that they are in line with the findings of the 2009 analysis of bid proposal data completed by KEMA. Key findings of this updated effort included the verification of over $440 million already spent in New York through the first three years of commercial operation
for these 18 facilities. Extrapolation of anticipated long term expenditures such as salaries, Payment-in-lieu of taxes (PILOT) and Host Community Payments, operations and maintenance expenses and payments for land use or fuel add over $710 million in expenditures over the projected life of these projects. In total, these projects are anticipated to add over $1.1 billion50 to the New York economy through their respective operating lives.51 A comprehensive analysis which extrapolates these benefits to the remaining Main Tier and Maintenance resource facilities will be published by mid-2013.
The new renewable generation capacity from facilities awarded contracts under the seven completed Main Tier competitive solicitations and future solicitations will provide environmental benefits to the State of New York. The environmental benefits of having electricity generated by the RPS facilities from 2006 through 2012, as opposed to the State’s “system-mix,” amounts to approximately 4,028 tons of nitrogen oxides, 8,853 tons of sulfur dioxides, and 4.1 million tons of carbon dioxide in reduced emissions over this time period.
48 New York Main Tier RPS, Impact and Process Evaluation, KEMA, Inc. This figure is aggregated from bid information provided by the facilities during the bid evaluation and award selection process. Contract terms require that facilities demonstrate actual investment of no less than 85% of the bid-based amount, or they will be penalized through a lowering of their contract prices.
49 New York Main Tier RPS, Impact and Process Evaluation, KEMA, Inc.50 The total expenditures referenced in this paragraph are calculated in nominal dollars.51 NYSERDA Reply Comments, Petition for Modification of RPS Main Tier Program, http://documents.dps.ny.gov/public/Common/ViewDoc.
aspx?DocRefId={0FE1F9AC-BEA4-4C41-AFF0-9B08874C1937}
Marble River Wind Farm
20
new York Generation attribute Tracking system (nYGaTs)
In 2012, the State Legislature passed Assembly Bill A6114-C (the same as S 3872-C) which requires NYSERDA to establish a generation attribute tracking system that records electricity generation attribute information within the state, and processes generation attribute information from energy imported and consumed within the state, in part to support the market for tradable Renewable Energy Certificates (RECs). NYSERDA has been tasked to design and administer this new initiative by engaging stakeholders and executing activities to design, implement, operate, and maintain an internet-based electronic information system called the New York Generation Attribute Tracking System (NYGATS). Partnering with NYSERDA in this new initiative will be the New York State Department of Public Service (DPS) and the administrator of the New York wholesale electricity market, the New York Independent System Operator (NYISO).
NYGATS will support New York’s Environmental Disclosure Program (including fuel mix and emissions for electricity consumed in state), the Renewable Portfolio Standard, and voluntary green power or renewable energy certificate transactions (among other policies and programs). It will also characterize the attributes of electricity imports and exports, and have the capability to interface and exchange information with other certificate tracking systems. Through the development of NYGATS, entities with accounts in NYGATS will be able to verify and substantiate ownership of RECs to support compliance or voluntary market claims.
Customer-sited Tier
NYSERDA, in consultation with the DPS, issued the 2012-2015 CST Operating Plan on June 29, 2012, which sets forth general program specifications, capacity and generation targets, and associated budgets.52 The revised targets and associated budgets were significantly increased in 2012 primarily as a result of the NY-Sun initiative. Table 4 shows the current Customer-Sited Tier Funding Budget by Program through 2015.
Budgets provided in Table 4 are for program costs only. Costs for program administration and evaluation were provided for separately in the April 24, 2012 Order.53
Table 4. Customer-Sited Tier Funding Budget by Program through 2015 under the CST Operating Plan (millions of dollars)54
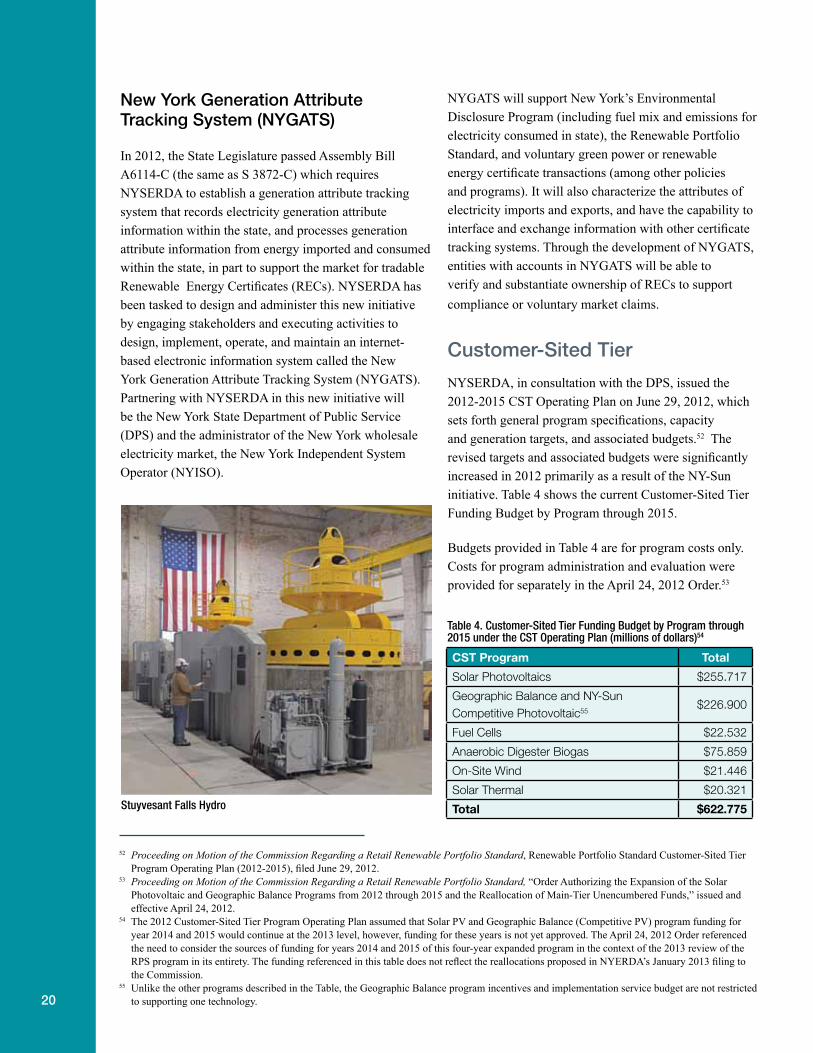
Stuyvesant Falls Hydro
CST Program Total
Solar Photovoltaics $255.717
Geographic Balance and NY-Sun Competitive Photovoltaic55
$226.900
Fuel Cells $22.532
Anaerobic Digester Biogas $75.859
On-Site Wind $21.446
Solar Thermal $20.321
Total $622.775
52 Proceeding on Motion of the Commission Regarding a Retail Renewable Portfolio Standard, Renewable Portfolio Standard Customer-Sited TierProgram Operating Plan (2012-2015), filed June 29, 2012.
53 Proceeding on Motion of the Commission Regarding a Retail Renewable Portfolio Standard, “Order Authorizing the Expansion of the Solar Photovoltaic and Geographic Balance Programs from 2012 through 2015 and the Reallocation of Main-Tier Unencumbered Funds,” issued and effective April 24, 2012.
54 The 2012 Customer-Sited Tier Program Operating Plan assumed that Solar PV and Geographic Balance (Competitive PV) program funding for year 2014 and 2015 would continue at the 2013 level, however, funding for these years is not yet approved. The April 24, 2012 Order referenced the need to consider the sources of funding for years 2014 and 2015 of this four-year expanded program in the context of the 2013 review of the RPS program in its entirety. The funding referenced in this table does not reflect the reallocations proposed in NYERDA’s January 2013 filing to the Commission.
55 Unlike the other programs described in the Table, the Geographic Balance program incentives and implementation service budget are not restricted to supporting one technology.
21
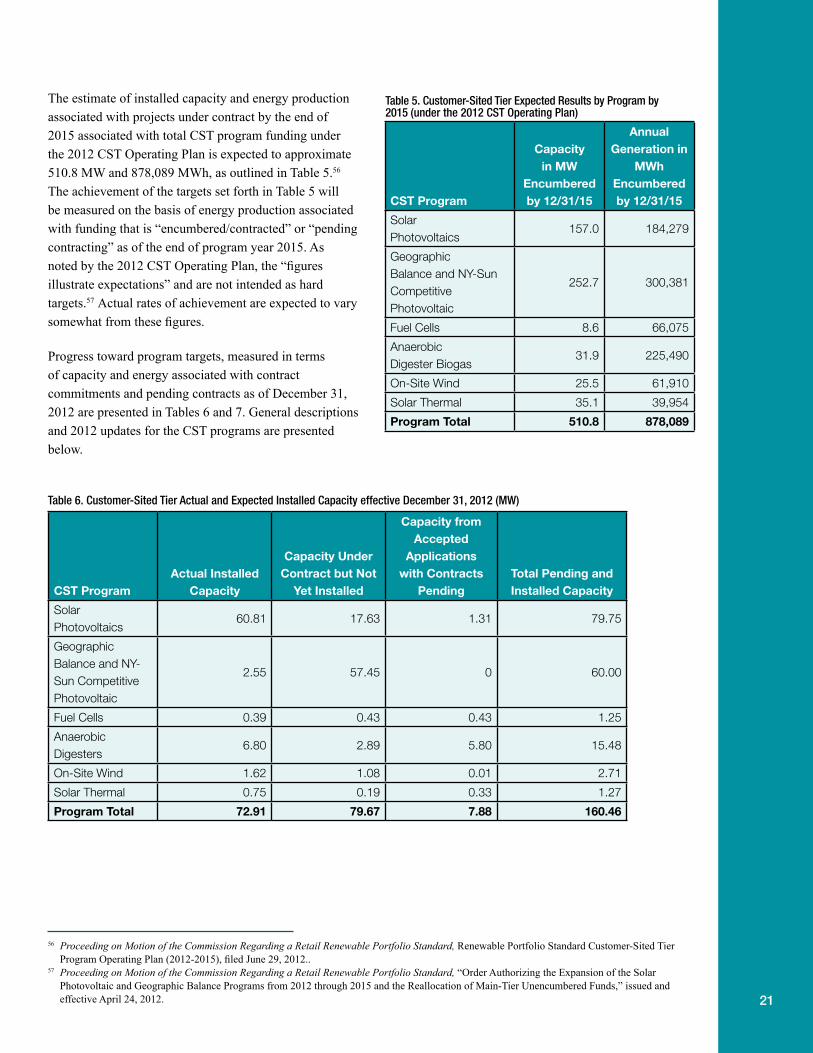
The estimate of installed capacity and energy production associated with projects under contract by the end of 2015 associated with total CST program funding under the 2012 CST Operating Plan is expected to approximate 510.8 MW and 878,089 MWh, as outlined in Table 5.56 The achievement of the targets set forth in Table 5 will be measured on the basis of energy production associated with funding that is “encumbered/contracted” or “pending contracting” as of the end of program year 2015. As noted by the 2012 CST Operating Plan, the “figures illustrate expectations” and are not intended as hard targets.57 Actual rates of achievement are expected to vary somewhat from these figures.
Progress toward program targets, measured in terms of capacity and energy associated with contract commitments and pending contracts as of December 31, 2012 are presented in Tables 6 and 7. General descriptions and 2012 updates for the CST programs are presented below.
Table 5. Customer-Sited Tier Expected Results by Program by 2015 (under the 2012 CST Operating Plan)
Annual Capacity
in MW Generation in
MWh Encumbered Encumbered
CST Program by 12/31/15 by 12/31/15
Solar Photovoltaics
157.0 184,279
Geographic Balance and NY-Sun Competitive Photovoltaic
252.7 300,381
Fuel Cells 8.6 66,075
Anaerobic Digester Biogas
31.9 225,490
On-Site Wind 25.5 61,910
Solar Thermal 35.1 39,954
Program Total 510.8 878,089
Table 6. Customer-Sited Tier Actual and Expected Installed Capacity effective December 31, 2012 (MW)
CST ProgramActual Installed
Capacity
Capacity Under Contract but Not
Yet Installed
Capacity from Accepted
Applications with Contracts
PendingTotal Pending and Installed Capacity
Solar Photovoltaics
60.81 17.63 1.31 79.75
Geographic Balance and NSun CompetitiPhotovoltaic
Y-ve
2.55 57.45 0 60.00
Fuel Cells 0.39 0.43 0.43 1.25
Anaerobic Digesters
6.80 2.89 5.80 15.48
On-Site Wind 1.62 1.08 0.01 2.71
Solar Thermal 0.75 0.19 0.33 1.27
Program Total 72.91 79.67 7.88 160.46
56 Proceeding on Motion of the Commission Regarding a Retail Renewable Portfolio Standard, Renewable Portfolio Standard Customer-Sited Tier Program Operating Plan (2012-2015), filed June 29, 2012..
57 Proceeding on Motion of the Commission Regarding a Retail Renewable Portfolio Standard, “Order Authorizing the Expansion of the Solar Photovoltaic and Geographic Balance Programs from 2012 through 2015 and the Reallocation of Main-Tier Unencumbered Funds,” issued and effective April 24, 2012.
22
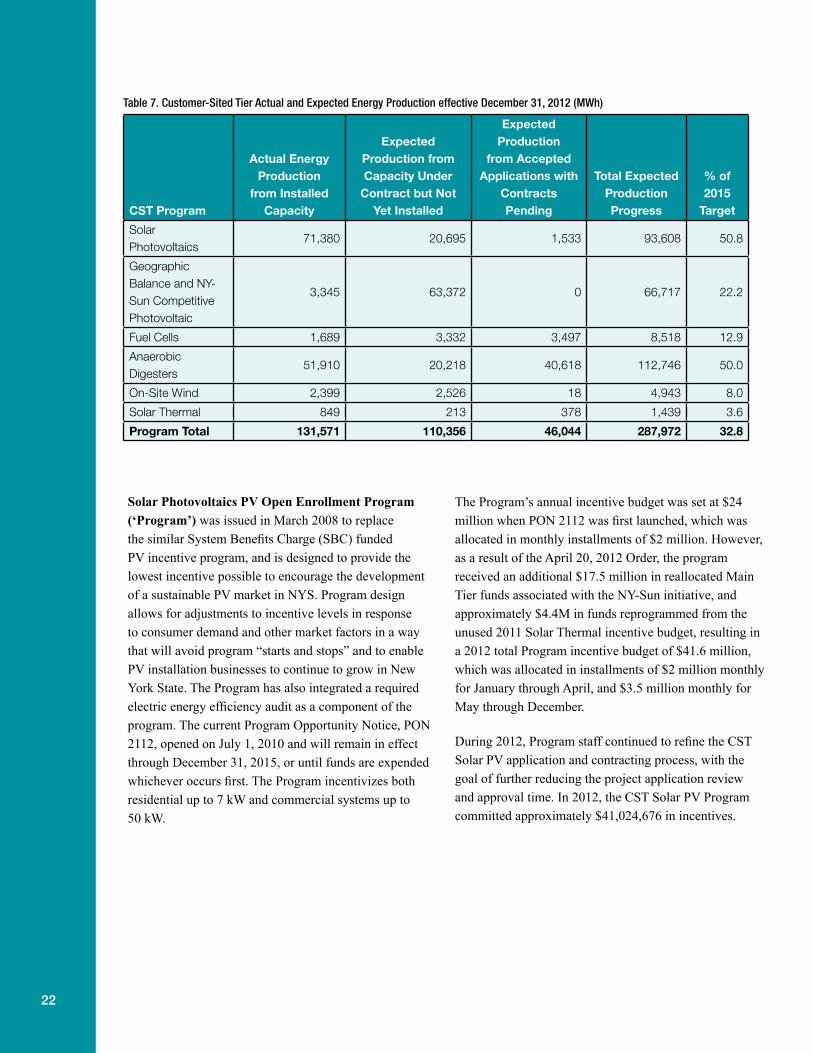
Table 7. Customer-Sited Tier Actual and Expected Energy Production effective December 31, 2012 (MWh)
CST Program
Actual Energy Production
from Installed Capacity
Expected Production from Capacity Under
Contract but Not Yet Installed
Expected Production
from Accepted Applications with
Contracts Pending
Total Expected Production Progress
% of 2015
Target
Solar Photovoltaics
71,380 20,695 1,533 93,608 50.8
Geographic Balance and NSun CompetitiPhotovoltaic
Y-ve
3,345 63,372 0 66,717 22.2
Fuel Cells 1,689 3,332 3,497 8,518 12.9
Anaerobic Digesters
51,910 20,218 40,618 112,746 50.0
On-Site Wind 2,399 2,526 18 4,943 8.0
Solar Thermal 849 213 378 1,439 3.6
Program Total 131,571 110,356 46,044 287,972 32.8
Solar Photovoltaics PV Open Enrollment Program The Program’s annual incentive budget was set at $24 (‘Program’) was issued in March 2008 to replace million when PON 2112 was first launched, which was the similar System Benefits Charge (SBC) funded allocated in monthly installments of $2 million. However, PV incentive program, and is designed to provide the as a result of the April 20, 2012 Order, the program lowest incentive possible to encourage the development received an additional $17.5 million in reallocated Main of a sustainable PV market in NYS. Program design Tier funds associated with the NY-Sun initiative, and allows for adjustments to incentive levels in response approximately $4.4M in funds reprogrammed from the to consumer demand and other market factors in a way unused 2011 Solar Thermal incentive budget, resulting in that will avoid program “starts and stops” and to enable a 2012 total Program incentive budget of $41.6 million, PV installation businesses to continue to grow in New which was allocated in installments of $2 million monthly York State. The Program has also integrated a required for January through April, and $3.5 million monthly for electric energy efficiency audit as a component of the May through December.program. The current Program Opportunity Notice, PON 2112, opened on July 1, 2010 and will remain in effect During 2012, Program staff continued to refine the CST through December 31, 2015, or until funds are expended Solar PV application and contracting process, with the whichever occurs first. The Program incentivizes both goal of further reducing the project application review residential up to 7 kW and commercial systems up to and approval time. In 2012, the CST Solar PV Program 50 kW. committed approximately $41,024,676 in incentives.
23
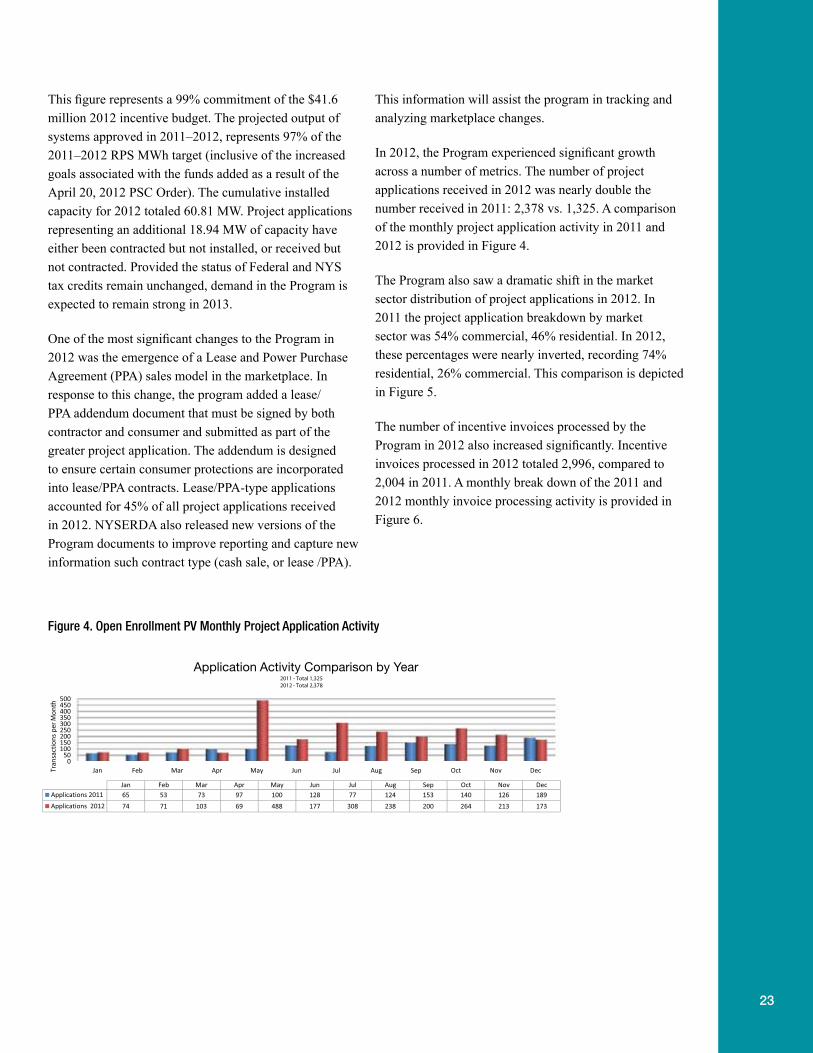
This figure represents a 99% commitment of the $41.6 This information will assist the program in tracking and million 2012 incentive budget. The projected output of analyzing marketplace changes.systems approved in 2011–2012, represents 97% of the 2011–2012 RPS MWh target (inclusive of the increased In 2012, the Program experienced significant growth goals associated with the funds added as a result of the across a number of metrics. The number of project April 20, 2012 PSC Order). The cumulative installed applications received in 2012 was nearly double the capacity for 2012 totaled 60.81 MW. Project applications number received in 2011: 2,378 vs. 1,325. A comparison representing an additional 18.94 MW of capacity have of the monthly project application activity in 2011 and either been contracted but not installed, or received but 2012 is provided in Figure 4.not contracted. Provided the status of Federal and NYS
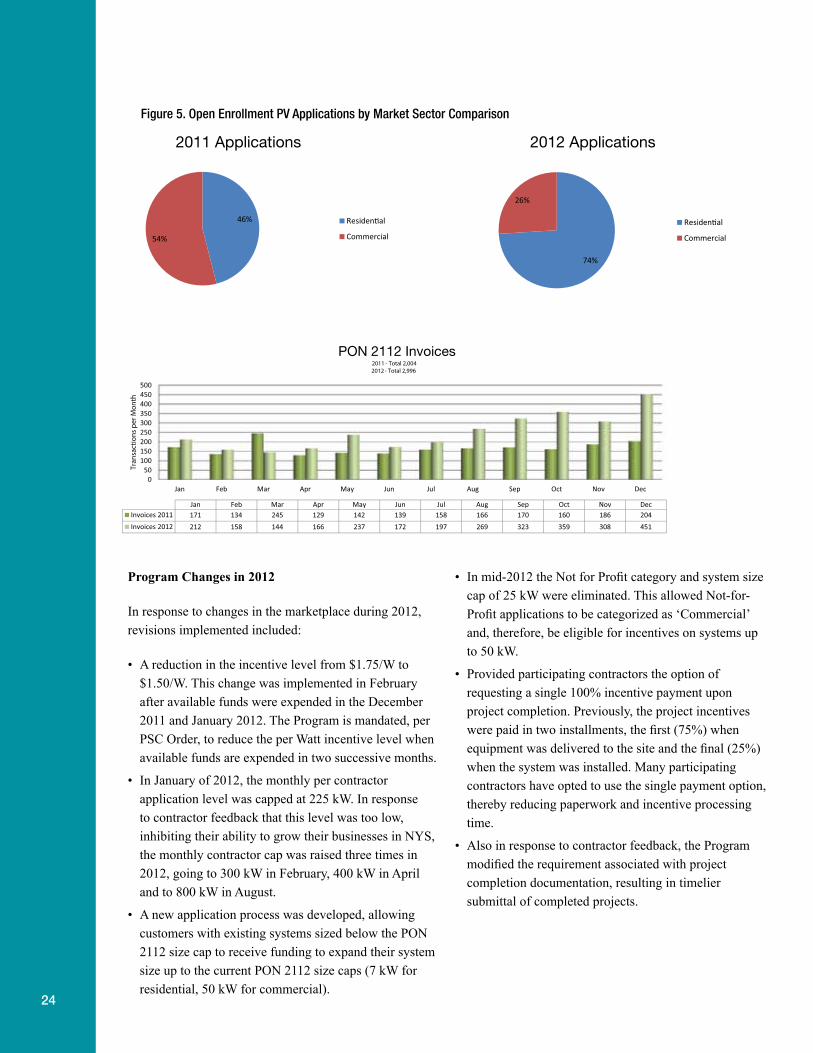
The Program also saw a dramatic shift in the market tax credits remain unchanged, demand in the Program is sector distribution of project applications in 2012. In expected to remain strong in 2013.2011 the project application breakdown by market
One of the most significant changes to the Program in sector was 54% commercial, 46% residential. In 2012, 2012 was the emergence of a Lease and Power Purchase these percentages were nearly inverted, recording 74% Agreement (PPA) sales model in the marketplace. In residential, 26% commercial. This comparison is depicted response to this change, the program added a lease/ in Figure 5.PPA addendum document that must be signed by both
The number of incentive invoices processed by the contractor and consumer and submitted as part of the Program in 2012 also increased significantly. Incentive greater project application. The addendum is designed invoices processed in 2012 totaled 2,996, compared to to ensure certain consumer protections are incorporated 2,004 in 2011. A monthly break down of the 2011 and into lease/PPA contracts. Lease/PPA-type applications 2012 monthly invoice processing activity is provided in accounted for 45% of all project applications received Figure 6.in 2012. NYSERDA also released new versions of the
Program documents to improve reporting and capture new information such contract type (cash sale, or lease /PPA).
Figure 4. Open Enrollment PV Monthly Project Application Activity
0 50
100 150 200 250 300 350 400 450 500
Jan Feb Mar Apr May Jun Jul Aug Sep Oct Nov Dec Tran
sact
ions
per
Mon
th
Jan Feb Mar Apr May Jun Jul Aug Sep Oct Nov Dec Applications 2011 65 53 73 97 100 128 77 124 153 140 126 189 Applications 2012 74 71 103 69 488 177 308 238 200 264 213 173
Application Activity Comparison by Year 2011 - Total 1,325 2012 - Total 2,378
24
Figure 5. Open Enrollment PV Applications by Market Sector Comparison
46%
54%
2011 Application s
Residen�al
Commercial
74%
26%
2012 Application s
Residen�al
Commercial
0 50
100 150 200 250 300 350 400 450 500
Jan Feb Mar Apr May Jun Jul Aug Sep Oct Nov Dec
Tran
sact
ions
per
Mon
th
Jan Feb Mar Apr May Jun Jul Aug Sep Oct Nov Dec Invoices 2011 171 134 245 129 142 139 158 166 170 160 186 204 Invoices 2012 212 158 144 166 237 172 197 269 323 359 308 451
PON 2112 Invoices 2011 - Total 2,004 2012 - Total 2,996
Program Changes in 2012 • In mid-2012 the Not for Profit category and system size cap of 25 kW were eliminated. This allowed Not-for-
In response to changes in the marketplace during 2012, Profit applications to be categorized as ‘Commercial’ revisions implemented included: and, therefore, be eligible for incentives on systems up
to 50 kW.• A reduction in the incentive level from $1.75/W to
• Provided participating contractors the option of$1.50/W. This change was implemented in February
requesting a single 100% incentive payment uponafter available funds were expended in the December
project completion. Previously, the project incentives2011 and January 2012. The Program is mandated, per
were paid in two installments, the first (75%) whenPSC Order, to reduce the per Watt incentive level when
equipment was delivered to the site and the final (25%)available funds are expended in two successive months.
when the system was installed. Many participating• In January of 2012, the monthly per contractor contractors have opted to use the single payment option,
application level was capped at 225 kW. In response thereby reducing paperwork and incentive processingto contractor feedback that this level was too low, time.inhibiting their ability to grow their businesses in NYS,
• Also in response to contractor feedback, the Programthe monthly contractor cap was raised three times in
modified the requirement associated with project2012, going to 300 kW in February, 400 kW in April
completion documentation, resulting in timelierand to 800 kW in August.
submittal of completed projects.• A new application process was developed, allowing
customers with existing systems sized below the PON2112 size cap to receive funding to expand their systemsize up to the current PON 2112 size caps (7 kW forresidential, 50 kW for commercial).

25
3.6 kW PV System, Lockport, NY
Geographic Balance/Competitive PV Program was initially designed to encourage additional customer-sited installations of larger-scale, renewable electric generationin the downstate region (NYISO Zones G, H, I and J) andwas modified in 2012 to provide support for PV projects statewide as part of NY-Sun. The program is designed to facilitate larger installations of eligible projects (above 50kW), including solar PV, fuel cells and anaerobic digesterderived renewable biogas projects that accept delivery ofbiogas from a pipeline delivering the fuel from a separatelocation to the electric generator. These larger installationare coordinated with distribution companies within the target zones, and other stakeholders. The program seeks to identify and address institutional and technical barriers to installation, minimize potential market confusion, and assess electric grid and location-based value of installations. The primary delivery mechanism for the program will be one or more annual competitive solicitations. PON 2156 was issued in March 2011 and included two due dates, through which $34.5 million wasawarded in incentives in support of 26.62 MW of solar photovoltaic capacity. PON 2484 was issued in April 201and awarded $32.5 million in incentives in support of 34 MW of solar photovoltaic capacity. PON 2589 was issuedin August 2012 and includes three due dates spread over 2012-2013. The program has shown strong demand and has demonstrated that the competitive bidding model canreduce the incentive levels needed, thereby maximizing the program’s impact.
NY-Sun Competitive Photovoltaic Program was initiatedin a Commission Order issued in April 2012 and provided funding for PV projects in NYISO Zones A-J through 2015. With the issuance of PON 2589, the way NYSERDA administers the Geographic Balance Program has been subsumed into the Competitive PV Program. This merger will minimize confusion in the marketplace and will continue to capitalize on a program format that has yielded a trend of declining costs per megawatt for the acquisition of solar photovoltaic resources, with portfolio-weighted average acquisition costs in 2011 of $1.30 per Watt ($34.5 million/26.62 MW = $1.30 per Watt) declining to $0.93 per Watt in early 2012 ($32.1 million/34.6 MW = $0.93 per Watt).
The PV developer companies that have been selected for awards in 2011 and 2012 are:
• altPOWER
• American Capital Energy• Bright Power, Inc.
• ConEdison Solutions- • Dynamic Solar • Earthkind Energy • EmPower Solars • EnterSolar
• GreenLogic• Lighthousesolar• Martifer Solar USA• Mercury Solar Systems• MS Harrison, LLC• OnForce Solar• Orion Energy Systems
• Real Goods Solar• Ross Solar Group
2 • Safari Energy• Solar Energy Systems
• Solar Star New York I, LLC• SolarCity Corp.• Solartech Renewables
• SuNation Solar• SunEdison• SunRay Power, LLC• SunWize Technologies • TriState Solar Alliance
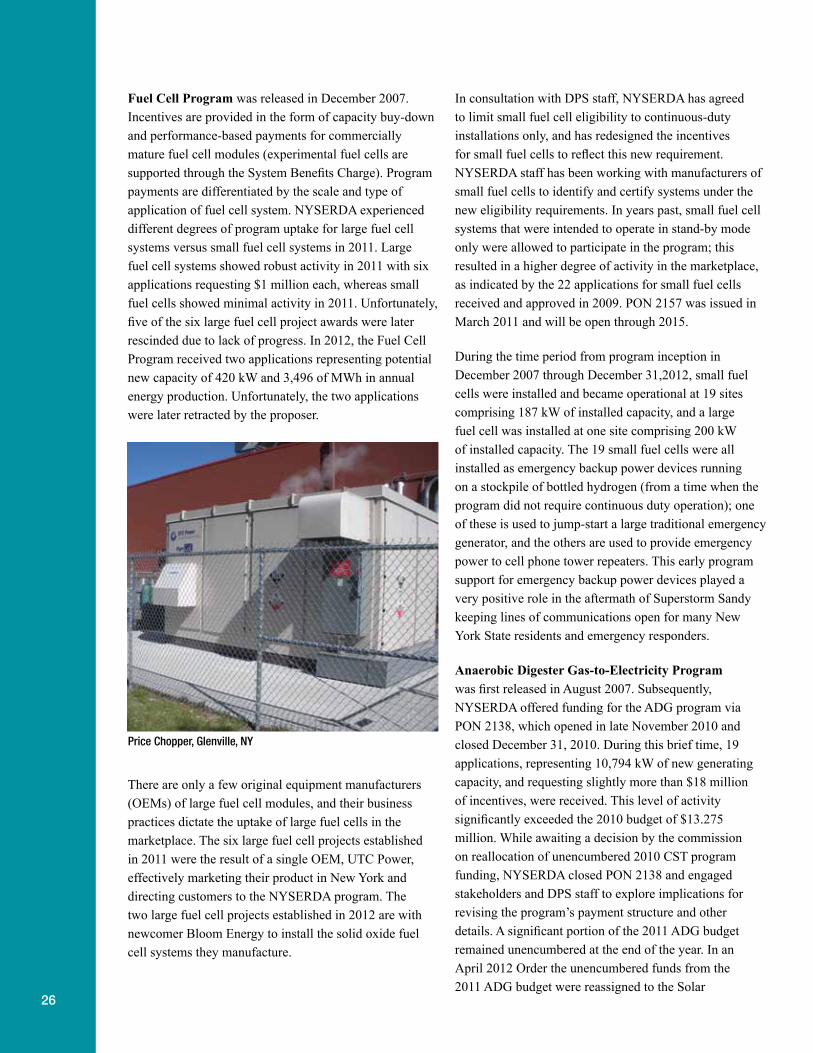
26
Fuel Cell Program was released in December 2007. Incentives are provided in the form of capacity buy-downand performance-based payments for commercially mature fuel cell modules (experimental fuel cells are supported through the System Benefits Charge). Programpayments are differentiated by the scale and type of application of fuel cell system. NYSERDA experienced different degrees of program uptake for large fuel cell systems versus small fuel cell systems in 2011. Large fuel cell systems showed robust activity in 2011 with six applications requesting $1 million each, whereas small fuel cells showed minimal activity in 2011. Unfortunatelyfive of the six large fuel cell project awards were later rescinded due to lack of progress. In 2012, the Fuel Cell Program received two applications representing potentialnew capacity of 420 kW and 3,496 of MWh in annual energy production. Unfortunately, the two applications were later retracted by the proposer.
There are only a few original equipment manufacturers (OEMs) of large fuel cell modules, and their business practices dictate the uptake of large fuel cells in the marketplace. The six large fuel cell projects established in 2011 were the result of a single OEM, UTC Power, effectively marketing their product in New York and directing customers to the NYSERDA program. The two large fuel cell projects established in 2012 are with newcomer Bloom Energy to install the solid oxide fuel cell systems they manufacture.
In consultation with DPS staff, NYSERDA has agreed to limit small fuel cell eligibility to continuous-duty
installations only, and has redesigned the incentives for small fuel cells to reflect this new requirement.
NYSERDA staff has been working with manufacturers of small fuel cells to identify and certify systems under the new eligibility requirements. In years past, small fuel cell systems that were intended to operate in stand-by mode only were allowed to participate in the program; this resulted in a higher degree of activity in the marketplace, as indicated by the 22 applications for small fuel cells
, received and approved in 2009. PON 2157 was issued in March 2011 and will be open through 2015.
During the time period from program inception in December 2007 through December 31,2012, small fuel cells were installed and became operational at 19 sites comprising 187 kW of installed capacity, and a large fuel cell was installed at one site comprising 200 kW of installed capacity. The 19 small fuel cells were all installed as emergency backup power devices running on a stockpile of bottled hydrogen (from a time when the program did not require continuous duty operation); one of these is used to jump-start a large traditional emergency generator, and the others are used to provide emergency power to cell phone tower repeaters. This early program support for emergency backup power devices played a very positive role in the aftermath of Superstorm Sandy keeping lines of communications open for many New York State residents and emergency responders.
Anaerobic Digester Gas-to-Electricity Program was first released in August 2007. Subsequently, NYSERDA offered funding for the ADG program via PON 2138, which opened in late November 2010 and closed December 31, 2010. During this brief time, 19 applications, representing 10,794 kW of new generating capacity, and requesting slightly more than $18 million of incentives, were received. This level of activity significantly exceeded the 2010 budget of $13.275 million. While awaiting a decision by the commission on reallocation of unencumbered 2010 CST program funding, NYSERDA closed PON 2138 and engaged stakeholders and DPS staff to explore implications for revising the program’s payment structure and other details. A significant portion of the 2011 ADG budget remained unencumbered at the end of the year. In an April 2012 Order the unencumbered funds from the 2011 ADG budget were reassigned to the Solar
Price Chopper, Glenville, NY
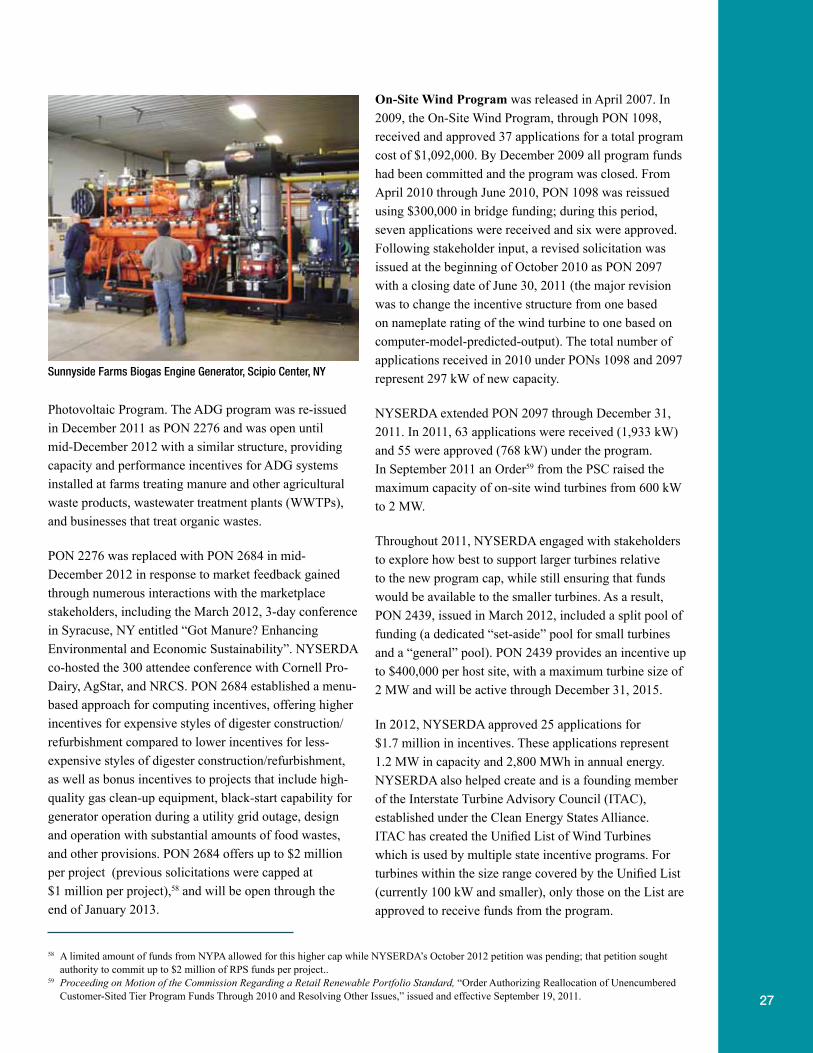
27
Photovoltaic Program. The ADG program was re-issued in December 2011 as PON 2276 and was open until mid-December 2012 with a similar structure, providing capacity and performance incentives for ADG systems installed at farms treating manure and other agricultural waste products, wastewater treatment plants (WWTPs), and businesses that treat organic wastes.
PON 2276 was replaced with PON 2684 in mid-December 2012 in response to market feedback gained through numerous interactions with the marketplace stakeholders, including the March 2012, 3-day conference in Syracuse, NY entitled “Got Manure? Enhancing Environmental and Economic Sustainability”. NYSERDA co-hosted the 300 attendee conference with Cornell Pro-Dairy, AgStar, and NRCS. PON 2684 established a menu-based approach for computing incentives, offering higher incentives for expensive styles of digester construction/refurbishment compared to lower incentives for less-expensive styles of digester construction/refurbishment, as well as bonus incentives to projects that include high-quality gas clean-up equipment, black-start capability for generator operation during a utility grid outage, design and operation with substantial amounts of food wastes, and other provisions. PON 2684 offers up to $2 million per project (previous solicitations were capped at $1 million per project),58 and will be open through the end of January 2013.
On-Site Wind Program was released in April 2007. In 2009, the On-Site Wind Program, through PON 1098, received and approved 37 applications for a total program cost of $1,092,000. By December 2009 all program funds had been committed and the program was closed. From April 2010 through June 2010, PON 1098 was reissued using $300,000 in bridge funding; during this period, seven applications were received and six were approved. Following stakeholder input, a revised solicitation was issued at the beginning of October 2010 as PON 2097 with a closing date of June 30, 2011 (the major revision was to change the incentive structure from one based on nameplate rating of the wind turbine to one based on computer-model-predicted-output). The total number of applications received in 2010 under PONs 1098 and 2097 represent 297 kW of new capacity.
NYSERDA extended PON 2097 through December 31, 2011. In 2011, 63 applications were received (1,933 kW) and 55 were approved (768 kW) under the program. In September 2011 an Order59 from the PSC raised the maximum capacity of on-site wind turbines from 600 kW to 2 MW.
Throughout 2011, NYSERDA engaged with stakeholders to explore how best to support larger turbines relative to the new program cap, while still ensuring that funds would be available to the smaller turbines. As a result, PON 2439, issued in March 2012, included a split pool of funding (a dedicated “set-aside” pool for small turbines and a “general” pool). PON 2439 provides an incentive up to $400,000 per host site, with a maximum turbine size of 2 MW and will be active through December 31, 2015.
In 2012, NYSERDA approved 25 applications for $1.7 million in incentives. These applications represent 1.2 MW in capacity and 2,800 MWh in annual energy. NYSERDA also helped create and is a founding member of the Interstate Turbine Advisory Council (ITAC), established under the Clean Energy States Alliance. ITAC has created the Unified List of Wind Turbines which is used by multiple state incentive programs. For turbines within the size range covered by the Unified List (currently 100 kW and smaller), only those on the List are approved to receive funds from the program.
Sunnyside Farms Biogas Engine Generator, Scipio Center, NY
58 A limited amount of funds from NYPA allowed for this higher cap while NYSERDA’s October 2012 petition was pending; that petition sought authority to commit up to $2 million of RPS funds per project..
59 Proceeding on Motion of the Commission Regarding a Retail Renewable Portfolio Standard, “Order Authorizing Reallocation of Unencumbered Customer-Sited Tier Program Funds Through 2010 and Resolving Other Issues,” issued and effective September 19, 2011.
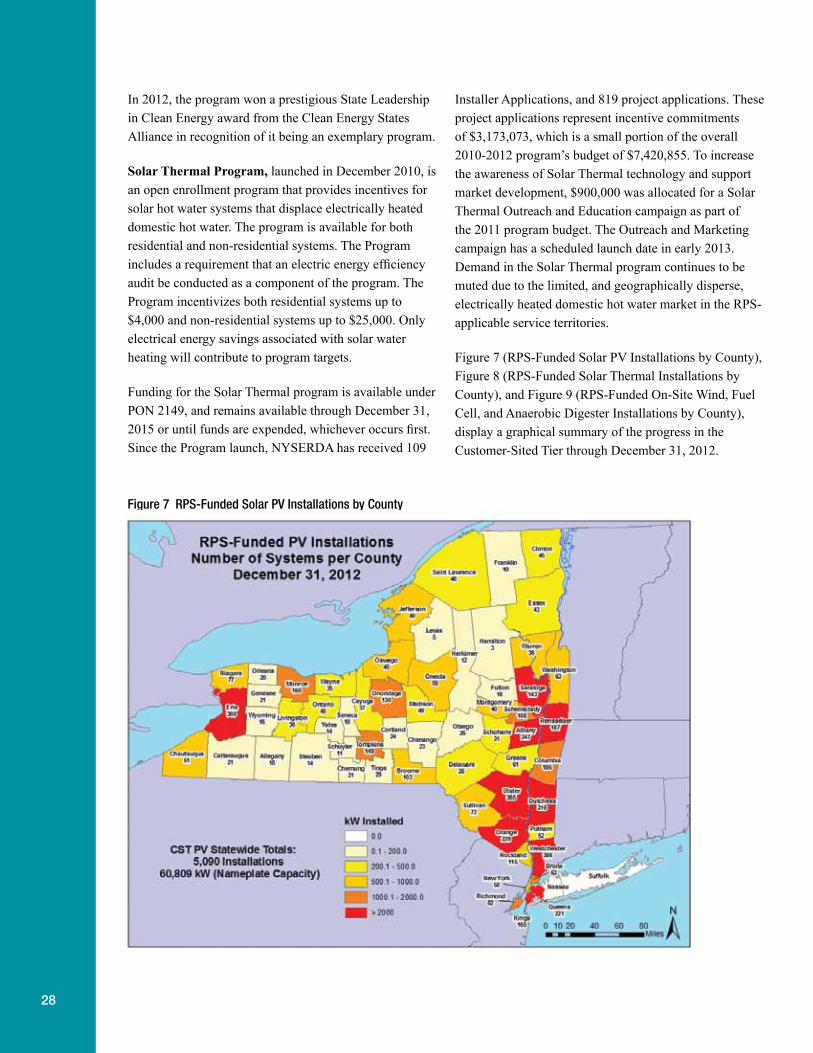
28
In 2012, the program won a prestigious State Leadership Installer Applications, and 819 project applications. These in Clean Energy award from the Clean Energy States project applications represent incentive commitments Alliance in recognition of it being an exemplary program. of $3,173,073, which is a small portion of the overall
2010-2012 program’s budget of $7,420,855. To increase Solar Thermal Program, launched in December 2010, is the awareness of Solar Thermal technology and support an open enrollment program that provides incentives for market development, $900,000 was allocated for a Solar solar hot water systems that displace electrically heated Thermal Outreach and Education campaign as part of domestic hot water. The program is available for both the 2011 program budget. The Outreach and Marketing residential and non-residential systems. The Program campaign has a scheduled launch date in early 2013. includes a requirement that an electric energy efficiency Demand in the Solar Thermal program continues to be audit be conducted as a component of the program. The muted due to the limited, and geographically disperse, Program incentivizes both residential systems up to electrically heated domestic hot water market in the RPS-$4,000 and non-residential systems up to $25,000. Only applicable service territories.electrical energy savings associated with solar water heating will contribute to program targets. Figure 7 (RPS-Funded Solar PV Installations by County),
Figure 8 (RPS-Funded Solar Thermal Installations by Funding for the Solar Thermal program is available under County), and Figure 9 (RPS-Funded On-Site Wind, Fuel PON 2149, and remains available through December 31, Cell, and Anaerobic Digester Installations by County), 2015 or until funds are expended, whichever occurs first. display a graphical summary of the progress in the Since the Program launch, NYSERDA has received 109 Customer-Sited Tier through December 31, 2012.
Figure 7 RPS-Funded Solar PV Installations by County
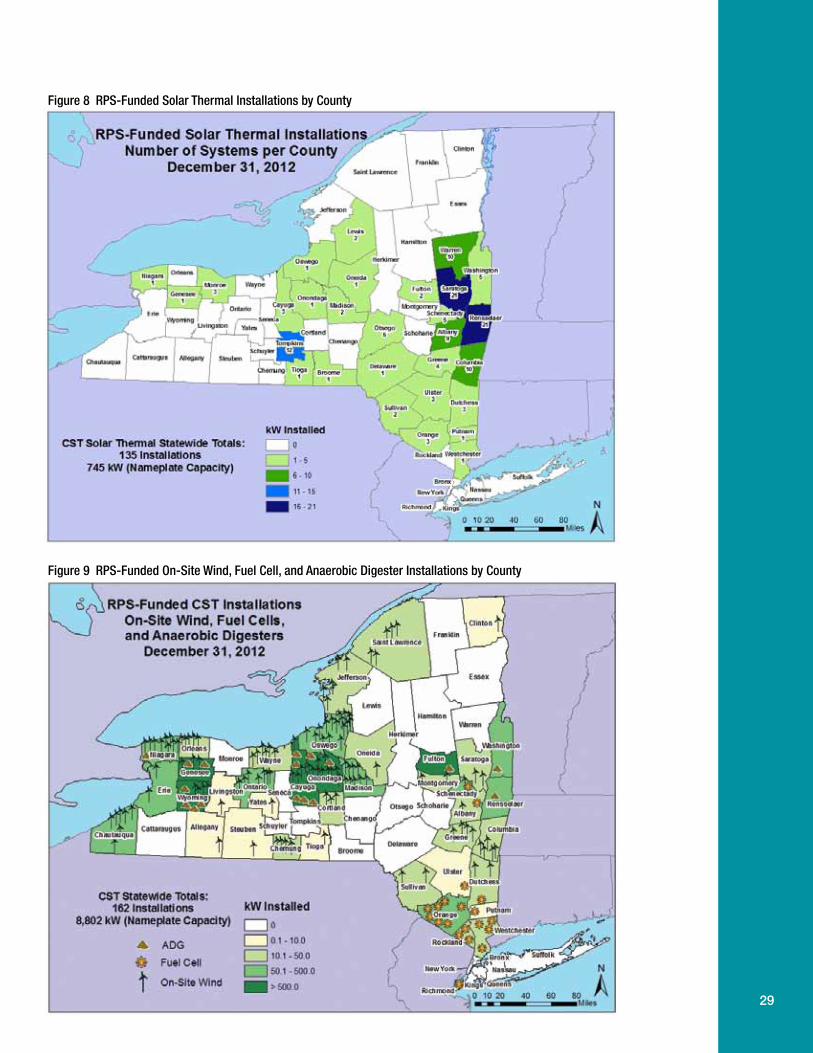
29
Figure 8 RPS-Funded Solar Thermal Installations by County
Figure 9 RPS-Funded On-Site Wind, Fuel Cell, and Anaerobic Digester Installations by County
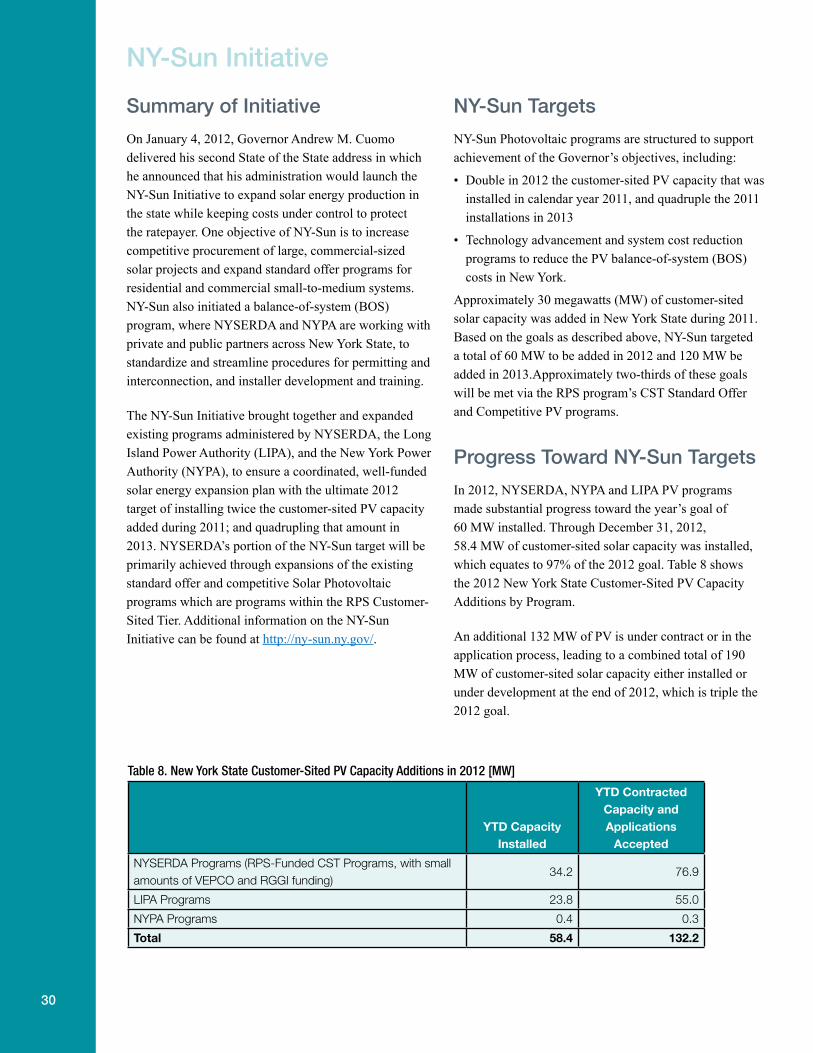
30
nY-sun Initiative
summary of Initiative nY-sun Targets
On January 4, 2012, Governor Andrew M. Cuomo NY-Sun Photovoltaic programs are structured to support delivered his second State of the State address in which achievement of the Governor’s objectives, including:he announced that his administration would launch the • Double in 2012 the customer -sited PV capacity that was NY-Sun Initiative to expand solar energy production in installed in calendar year 2011, and quadruple the 2011 the state while keeping costs under control to protect installations in 2013the ratepayer. One objective of NY-Sun is to increase • T echnology advancement and system cost reduction competitive procurement of large, commercial-sized programs to reduce the PV balance-of-system (BOS) solar projects and expand standard offer programs for costs in New York.residential and commercial small-to-medium systems.
Approximately 30 megawatts (MW) of customer-sited NY-Sun also initiated a balance-of-system (BOS) solar capacity was added in New York State during 2011. program, where NYSERDA and NYPA are working with Based on the goals as described above, NY-Sun targeted private and public partners across New York State, to a total of 60 MW to be added in 2012 and 120 MW be standardize and streamline procedures for permitting and added in 2013.Approximately two-thirds of these goals interconnection, and installer development and training.will be met via the RPS program’s CST Standard Offer
The NY-Sun Initiative brought together and expanded and Competitive PV programs.
existing programs administered by NYSERDA, the Long Island Power Authority (LIPA), and the New York Power Progress Toward nY-sun TargetsAuthority (NYPA), to ensure a coordinated, well-funded solar energy expansion plan with the ultimate 2012 In 2012, NYSERDA, NYPA and LIPA PV programs target of installing twice the customer-sited PV capacity made substantial progress toward the year’s goal of added during 2011; and quadrupling that amount in 60 MW installed. Through December 31, 2012, 2013. NYSERDA’s portion of the NY-Sun target will be 58.4 MW of customer-sited solar capacity was installed, primarily achieved through expansions of the existing which equates to 97% of the 2012 goal. Table 8 shows standard offer and competitive Solar Photovoltaic the 2012 New York State Customer-Sited PV Capacity programs which are programs within the RPS Customer- Additions by Program.Sited Tier. Additional information on the NY-Sun Initiative can be found at http://ny-sun.ny.gov/. An additional 132 MW of PV is under contract or in the
application process, leading to a combined total of 190 MW of customer-sited solar capacity either installed or under development at the end of 2012, which is triple the 2012 goal.
Table 8. New York State Customer-Sited PV Capacity Additions in 2012 [MW]
YTD Contracted
YTD Capacity Installed
Capacity and Applications
Accepted
NYSERDA Programs (RPS-Funded CST Programs, with small amounts of VEPCO and RGGI funding)
34.2 76.9
LIPA Programs 23.8 55.0
NYPA Programs 0.4 0.3
Total 58.4 132.2
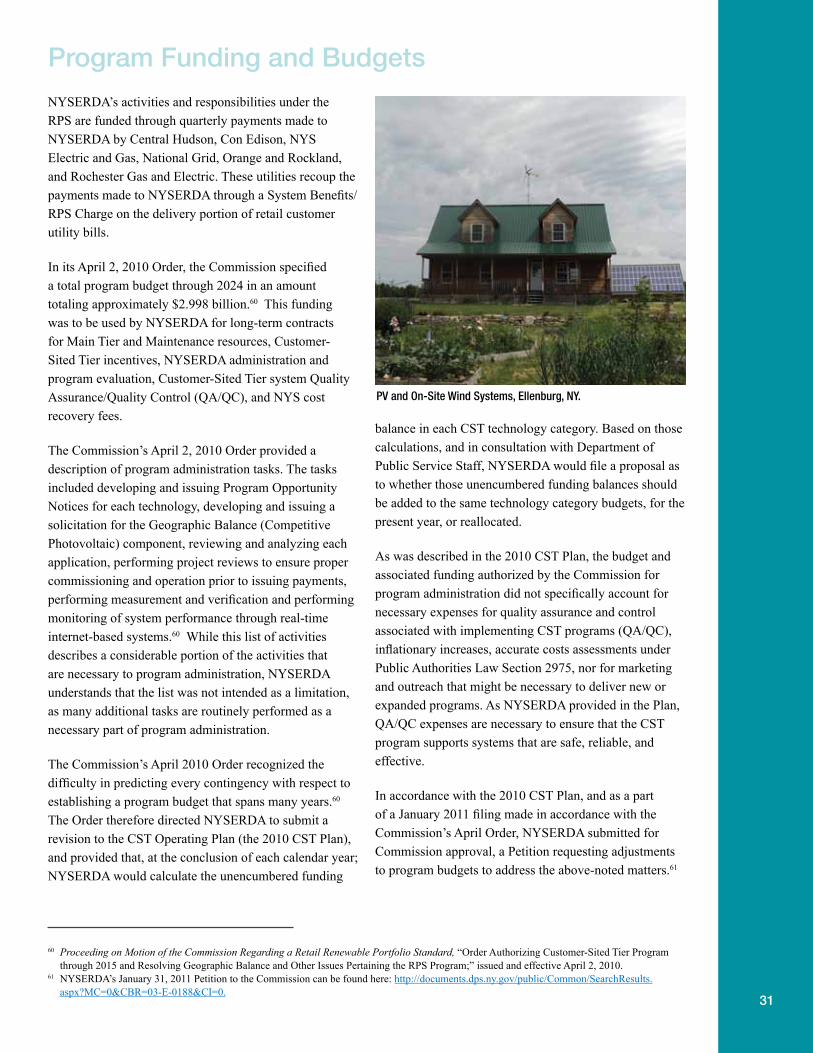
31
Program funding and budgets
NYSERDA’s activities and responsibilities under the RPS are funded through quarterly payments made to NYSERDA by Central Hudson, Con Edison, NYS Electric and Gas, National Grid, Orange and Rockland, and Rochester Gas and Electric. These utilities recoup the payments made to NYSERDA through a System Benefits/RPS Charge on the delivery portion of retail customer utility bills.
In its April 2, 2010 Order, the Commission specified a total program budget through 2024 in an amount totaling approximately $2.998 billion.60 This funding was to be used by NYSERDA for long-term contracts for Main Tier and Maintenance resources, Customer-Sited Tier incentives, NYSERDA administration and program evaluation, Customer-Sited Tier system Quality Assurance/Quality Control (QA/QC), and NYS cost recovery fees.
The Commission’s April 2, 2010 Order provided a description of program administration tasks. The tasks included developing and issuing Program Opportunity Notices for each technology, developing and issuing a solicitation for the Geographic Balance (Competitive Photovoltaic) component, reviewing and analyzing each application, performing project reviews to ensure proper commissioning and operation prior to issuing payments, performing measurement and verification and performing monitoring of system performance through real-time internet-based systems.60 While this list of activities describes a considerable portion of the activities that are necessary to program administration, NYSERDA understands that the list was not intended as a limitation, as many additional tasks are routinely performed as a necessary part of program administration.
The Commission’s April 2010 Order recognized the difficulty in predicting every contingency with respect to establishing a program budget that spans many years.60 The Order therefore directed NYSERDA to submit a revision to the CST Operating Plan (the 2010 CST Plan), and provided that, at the conclusion of each calendar year; NYSERDA would calculate the unencumbered funding
balance in each CST technology category. Based on those calculations, and in consultation with Department of Public Service Staff, NYSERDA would file a proposal as to whether those unencumbered funding balances should be added to the same technology category budgets, for the present year, or reallocated.
As was described in the 2010 CST Plan, the budget and associated funding authorized by the Commission for program administration did not specifically account for necessary expenses for quality assurance and control associated with implementing CST programs (QA/QC), inflationary increases, accurate costs assessments under Public Authorities Law Section 2975, nor for marketing and outreach that might be necessary to deliver new or expanded programs. As NYSERDA provided in the Plan, QA/QC expenses are necessary to ensure that the CST program supports systems that are safe, reliable, and effective.
In accordance with the 2010 CST Plan, and as a part of a January 2011 filing made in accordance with the Commission’s April Order, NYSERDA submitted for Commission approval, a Petition requesting adjustments to program budgets to address the above-noted matters.61
PV and On-Site Wind Systems, Ellenburg, NY.
60 Proceeding on Motion of the Commission Regarding a Retail Renewable Portfolio Standard, “Order Authorizing Customer-Sited Tier Program through 2015 and Resolving Geographic Balance and Other Issues Pertaining the RPS Program;” issued and effective April 2, 2010.
61 NYSERDA’s January 31, 2011 Petition to the Commission can be found here: http://documents.dps.ny.gov/public/Common/SearchResults.aspx?MC=0&CBR=03-E-0188&CI=0.
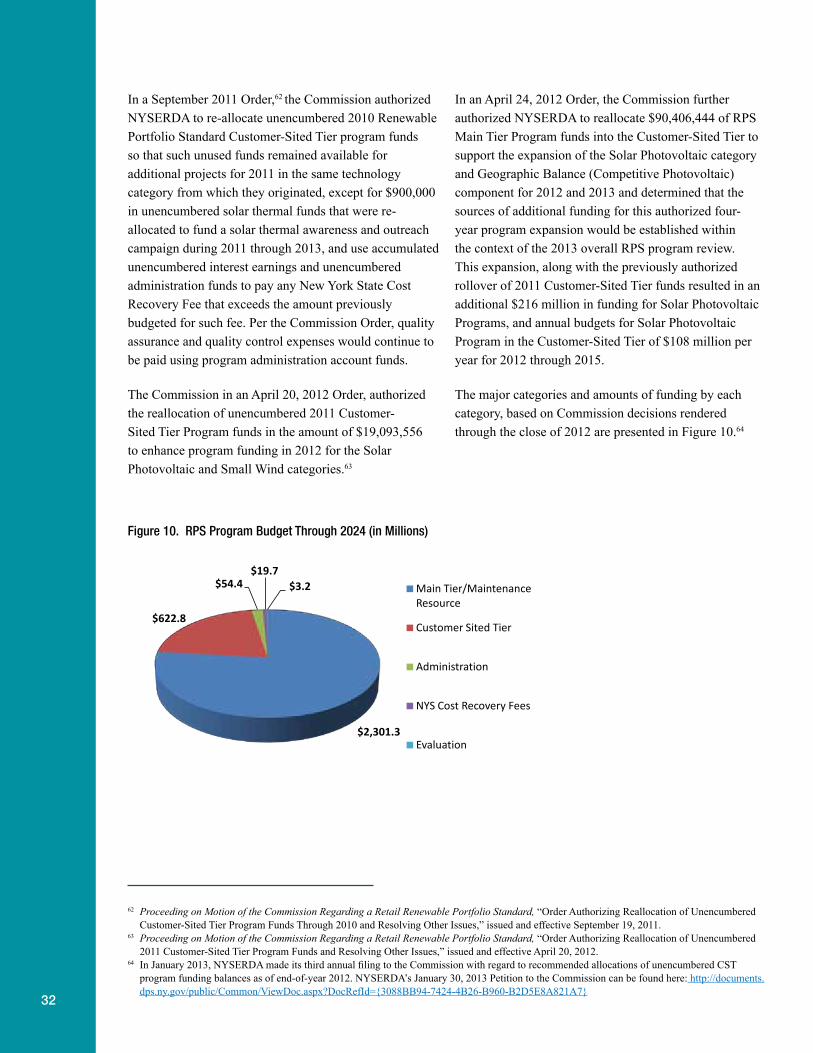
32
In a September 2011 Order,62 the Commission authorized In an April 24, 2012 Order, the Commission further NYSERDA to re-allocate unencumbered 2010 Renewable authorized NYSERDA to reallocate $90,406,444 of RPS Portfolio Standard Customer-Sited Tier program funds Main Tier Program funds into the Customer-Sited Tier to so that such unused funds remained available for support the expansion of the Solar Photovoltaic category additional projects for 2011 in the same technology and Geographic Balance (Competitive Photovoltaic) category from which they originated, except for $900,000 component for 2012 and 2013 and determined that the in unencumbered solar thermal funds that were re- sources of additional funding for this authorized four-allocated to fund a solar thermal awareness and outreach year program expansion would be established within campaign during 2011 through 2013, and use accumulated the context of the 2013 overall RPS program review. unencumbered interest earnings and unencumbered This expansion, along with the previously authorized administration funds to pay any New York State Cost rollover of 2011 Customer-Sited Tier funds resulted in an Recovery Fee that exceeds the amount previously additional $216 million in funding for Solar Photovoltaic budgeted for such fee. Per the Commission Order, quality Programs, and annual budgets for Solar Photovoltaic assurance and quality control expenses would continue to Program in the Customer-Sited Tier of $108 million per be paid using program administration account funds. year for 2012 through 2015.
The Commission in an April 20, 2012 Order, authorized The major categories and amounts of funding by each the reallocation of unencumbered 2011 Customer- category, based on Commission decisions rendered Sited Tier Program funds in the amount of $19,093,556 through the close of 2012 are presented in Figure 10.64 to enhance program funding in 2012 for the Solar Photovoltaic and Small Wind categories.63
$2,301.3
$622.8
$54.4 $19.7
$3.2 Main Tier/Maintenance Resource
Customer Sited Tier
Administration
NYS Cost Recovery Fees
Evaluation
Figure 10. RPS Program Budget Through 2024 (in Millions)
62 Proceeding on Motion of the Commission Regarding a Retail Renewable Portfolio Standard, “Order Authorizing Reallocation of Unencumbered Customer-Sited Tier Program Funds Through 2010 and Resolving Other Issues,” issued and effective September 19, 2011.
63 Proceeding on Motion of the Commission Regarding a Retail Renewable Portfolio Standard, “Order Authorizing Reallocation of Unencumbered 2011 Customer-Sited Tier Program Funds and Resolving Other Issues,” issued and effective April 20, 2012.
64 In January 2013, NYSERDA made its third annual filing to the Commission with regard to recommended allocations of unencumbered CST program funding balances as of end-of-year 2012. NYSERDA’s January 30, 2013 Petition to the Commission can be found here: http://documents.dps.ny.gov/public/Common/ViewDoc.aspx?DocRefId={3088BB94-7424-4B26-B960-B2D5E8A821A7}

33
funding Commitments and expenses As of December 31, 2012, approximately $1,192.2 million, NYSERDA’s actual expenses through December 31, 2012 or roughly 40% of the total approved RPS funding, has have totaled $390.8 million, or approximately 13.0% been expended, committed or is pending to achieving of the total RPS budget. The large majority of these NYSERDA’s 2015 targets (inclusive of administration expenses, $359.7 million have resulted from payments and NYS fees). This includes $871.9 million for program for Main Tier and Maintenance resource contracts as well resource acquisition costs in the Main Tier, inclusive of as Customer-Sited Tier incentives. Figure 11 illustrates Maintenance resource obligations, and $280.8 million NYSERDA’s major expenses through December 31, 2012. for the Customer-Sited Tier.65 Appendix B, Renewable Actual program collections and costs as well as projected Portfolio Standard Financial Status Report, presents the future revenues and program costs can be found in program’s detailed budgets, expenditures, and funding Appendix C, Cash Flow Estimates.commitments from contracts and/or pending contracts and applications through December 31, 2012.
$203.7 $155.9
$20.5
$9.6 $1.0
Main Tier/Maintenance Resource
Customer Tier
Administration
NYS Cost Recovery Fee
Evaluation
Figure 11. RPS Program Expenses through December 31, 2012 (in Millions)
65 The funding commitments do not include solicitation pre-encumbered funds for which awards were not made by December 31, 2012.
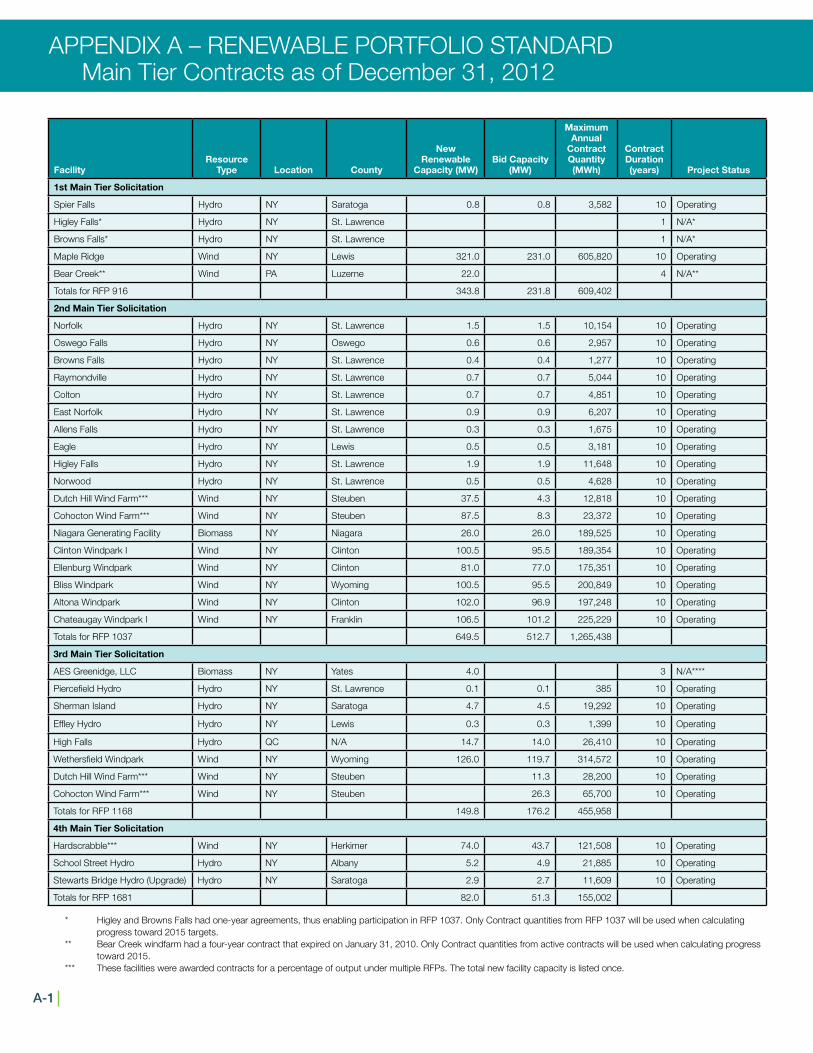
APPENDIx A – RENEWABLE PORTFOLIO STANDARD Main Tier Contracts as of December 31, 2012
a-1
FacilityResource
Type Location County
New Renewable
Capacity (MW)Bid Capacity
(MW)
Maximum Annual
Contract Quantity (MWh)
Contract Duration (years) Project Status
1st Main Tier Solicitation
Spier Falls Hydro NY Saratoga 0.8 0.8 3,582 10 Operating
Higley Falls* Hydro NY St. Lawrence 1 N/A*
Browns Falls* Hydro NY St. Lawrence 1 N/A*
Maple Ridge Wind NY Lewis 321.0 231.0 605,820 10 Operating
Bear Creek** Wind PA Luzerne 22.0 4 N/A**
Totals for RFP 916 343.8 231.8 609,402
2nd Main Tier Solicitation
Norfolk Hydro NY St. Lawrence 1.5 1.5 10,154 10 Operating
Oswego Falls Hydro NY Oswego 0.6 0.6 2,957 10 Operating
Browns Falls Hydro NY St. Lawrence 0.4 0.4 1,277 10 Operating
Raymondville Hydro NY St. Lawrence 0.7 0.7 5,044 10 Operating
Colton Hydro NY St. Lawrence 0.7 0.7 4,851 10 Operating
East Norfolk Hydro NY St. Lawrence 0.9 0.9 6,207 10 Operating
Allens Falls Hydro NY St. Lawrence 0.3 0.3 1,675 10 Operating
Eagle Hydro NY Lewis 0.5 0.5 3,181 10 Operating
Higley Falls Hydro NY St. Lawrence 1.9 1.9 11,648 10 Operating
Norwood Hydro NY St. Lawrence 0.5 0.5 4,628 10 Operating
Dutch Hill Wind Farm*** Wind NY Steuben 37.5 4.3 12,818 10 Operating
Cohocton Wind Farm*** Wind NY Steuben 87.5 8.3 23,372 10 Operating
Niagara Generating Facility Biomass NY Niagara 26.0 26.0 189,525 10 Operating
Clinton Windpark I Wind NY Clinton 100.5 95.5 189,354 10 Operating
Ellenburg Windpark Wind NY Clinton 81.0 77.0 175,351 10 Operating
Bliss Windpark Wind NY Wyoming 100.5 95.5 200,849 10 Operating
Altona Windpark Wind NY Clinton 102.0 96.9 197,248 10 Operating
Chateaugay Windpark I Wind NY Franklin 106.5 101.2 225,229 10 Operating
Totals for RFP 1037 649.5 512.7 1,265,438
3rd Main Tier Solicitation
AES Greenidge, LLC Biomass NY Yates 4.0 3 N/A****
Piercefield Hydro Hydro NY St. Lawrence 0.1 0.1 385 10 Operating
Sherman Island Hydro NY Saratoga 4.7 4.5 19,292 10 Operating
Effley Hydro Hydro NY Lewis 0.3 0.3 1,399 10 Operating
High Falls Hydro QC N/A 14.7 14.0 26,410 10 Operating
Wethersfield Windpark Wind NY Wyoming 126.0 119.7 314,572 10 Operating
Dutch Hill Wind Farm*** Wind NY Steuben 11.3 28,200 10 Operating
Cohocton Wind Farm*** Wind NY Steuben 26.3 65,700 10 Operating
Totals for RFP 1168 149.8 176.2 455,958
4th Main Tier Solicitation
Hardscrabble*** Wind NY Herkimer 74.0 43.7 121,508 10 Operating
School Street Hydro Hydro NY Albany 5.2 4.9 21,885 10 Operating
Stewarts Bridge Hydro (Upgrade) Hydro NY Saratoga 2.9 2.7 11,609 10 Operating
Totals for RFP 1681 82.0 51.3 155,002
* Higley and Browns Falls had one-year agreements, thus enabling participation in RFP 1037. Only Contract quantities from RFP 1037 will be used when calculating progress toward 2015 targets.
** Bear Creek windfarm had a four-year contract that expired on January 31, 2010. Only Contract quantities from active contracts will be used when calculating progress toward 2015.
*** These facilities were awarded contracts for a percentage of output under multiple RFPs. The total new facility capacity is listed once.
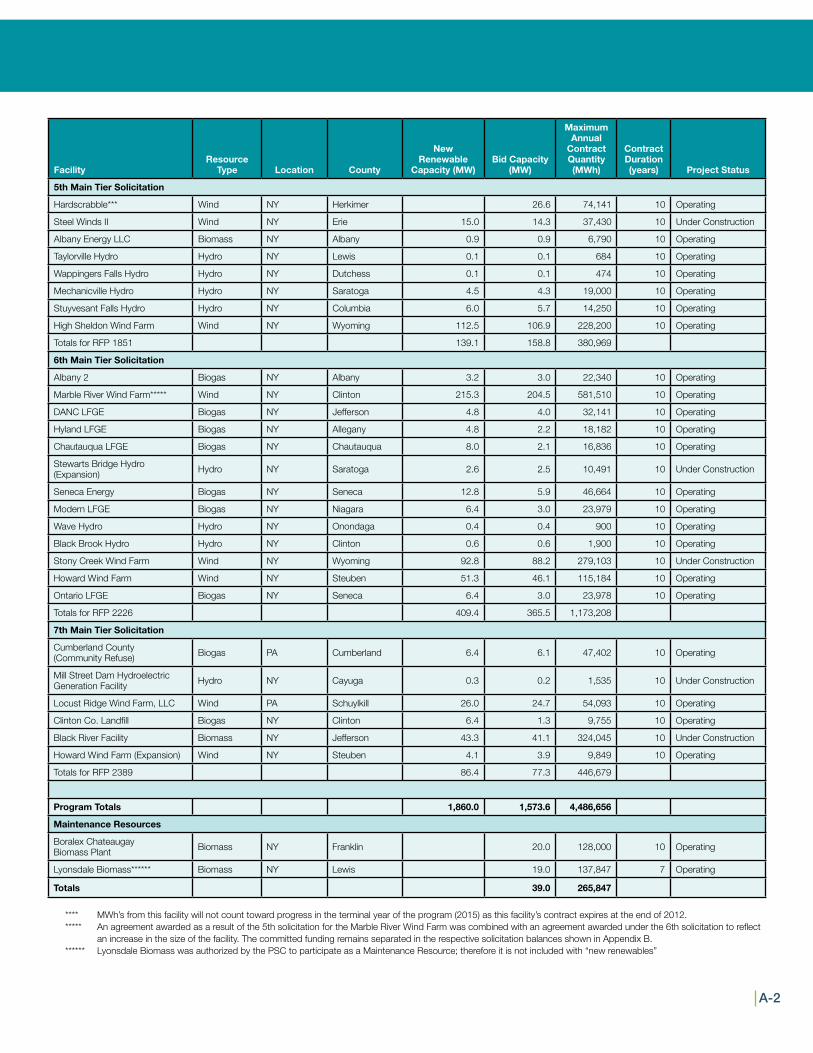
a-2
FacilityResource
Type Location County
New Renewable
Capacity (MW)Bid Capacity
(MW)
Maximum Annual
Contract Quantity (MWh)
Contract Duration (years) Project Status
5th Main Tier Solicitation
Hardscrabble*** Wind NY Herkimer 26.6 74,141 10 Operating
Steel Winds II Wind NY Erie 15.0 14.3 37,430 10 Under Construction
Albany Energy LLC Biomass NY Albany 0.9 0.9 6,790 10 Operating
Taylorville Hydro Hydro NY Lewis 0.1 0.1 684 10 Operating
Wappingers Falls Hydro Hydro NY Dutchess 0.1 0.1 474 10 Operating
Mechanicville Hydro Hydro NY Saratoga 4.5 4.3 19,000 10 Operating
Stuyvesant Falls Hydro Hydro NY Columbia 6.0 5.7 14,250 10 Operating
High Sheldon Wind Farm Wind NY Wyoming 112.5 106.9 228,200 10 Operating
Totals for RFP 1851 139.1 158.8 380,969
6th Main Tier Solicitation
Albany 2 Biogas NY Albany 3.2 3.0 22,340 10 Operating
Marble River Wind Farm***** Wind NY Clinton 215.3 204.5 581,510 10 Operating
DANC LFGE Biogas NY Jefferson 4.8 4.0 32,141 10 Operating
Hyland LFGE Biogas NY Allegany 4.8 2.2 18,182 10 Operating
Chautauqua LFGE Biogas NY Chautauqua 8.0 2.1 16,836 10 Operating
Stewarts Bridge Hydro (Expansion) Hydro NY Saratoga 2.6 2.5 10,491 10 Under Construction
Seneca Energy Biogas NY Seneca 12.8 5.9 46,664 10 Operating
Modern LFGE Biogas NY Niagara 6.4 3.0 23,979 10 Operating
Wave Hydro Hydro NY Onondaga 0.4 0.4 900 10 Operating
Black Brook Hydro Hydro NY Clinton 0.6 0.6 1,900 10 Operating
Stony Creek Wind Farm Wind NY Wyoming 92.8 88.2 279,103 10 Under Construction
Howard Wind Farm Wind NY Steuben 51.3 46.1 115,184 10 Operating
Ontario LFGE Biogas NY Seneca 6.4 3.0 23,978 10 Operating
Totals for RFP 2226 409.4 365.5 1,173,208
7th Main Tier Solicitation
Cumberland County (Community Refuse) Biogas PA Cumberland 6.4 6.1 47,402 10 Operating
Mill Street Dam Hydroelectric Generation Facility Hydro NY Cayuga 0.3 0.2 1,535 10 Under Construction
Locust Ridge Wind Farm, LLC Wind PA Schuylkill 26.0 24.7 54,093 10 Operating
Clinton Co. Landfill Biogas NY Clinton 6.4 1.3 9,755 10 Operating
Black River Facility Biomass NY Jefferson 43.3 41.1 324,045 10 Under Construction
Howard Wind Farm (Expansion) Wind NY Steuben 4.1 3.9 9,849 10 Operating
Totals for RFP 2389 86.4 77.3 446,679
Program Totals 1,860.0 1,573.6 4,486,656
Maintenance Resources
Boralex Chateaugay Biomass Plant Biomass NY Franklin 20.0 128,000 10 Operating
Lyonsdale Biomass****** Biomass NY Lewis 19.0 137,847 7 Operating
Totals 39.0 265,847
**** MWh’s from this facility will not count toward progress in the terminal year of the program (2015) as this facility’s contract expires at the end of 2012. ***** An agreement awarded as a result of the 5th solicitation for the Marble River Wind Farm was combined with an agreement awarded under the 6th solicitation to reflect
an increase in the size of the facility. The committed funding remains separated in the respective solicitation balances shown in Appendix B.****** Lyonsdale Biomass was authorized by the PSC to participate as a Maintenance Resource; therefore it is not included with “new renewables”
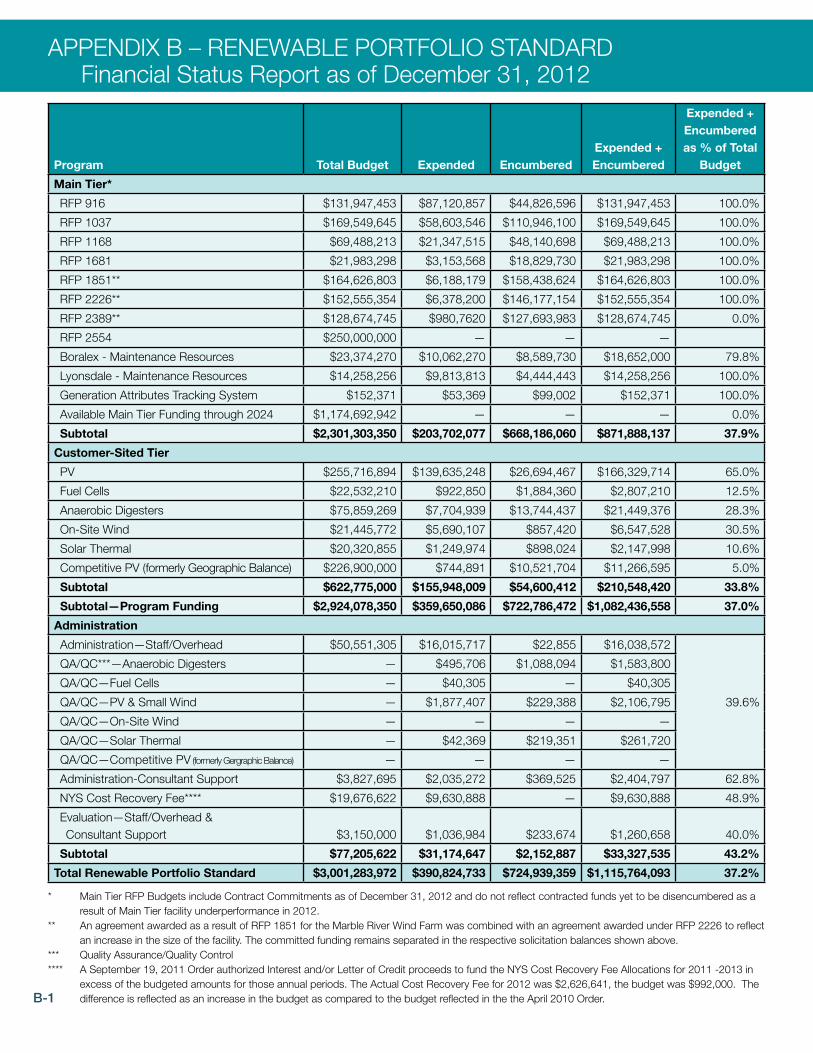
APPENDIx B – RENEWABLE PORTFOLIO STANDARD Financial Status Report as of December 31, 2012
b-1
Expended + Encumbered
Program Total Budget Expended EncumberedExpended + Encumbered
as % of Total Budget
Main Tier*
RFP 916 $131,947,453 $87,120,857 $44,826,596 $131,947,453 100.0%
RFP 1037 $169,549,645 $58,603,546 $110,946,100 $169,549,645 100.0%
RFP 1168 $69,488,213 $21,347,515 $48,140,698 $69,488,213 100.0%
RFP 1681 $21,983,298 $3,153,568 $18,829,730 $21,983,298 100.0%
RFP 1851** $164,626,803 $6,188,179 $158,438,624 $164,626,803 100.0%
RFP 2226** $152,555,354 $6,378,200 $146,177,154 $152,555,354 100.0%
RFP 2389** $128,674,745 $980,7620 $127,693,983 $128,674,745 0.0%
RFP 2554 $250,000,000 — — —
Boralex - Maintenance Resources $23,374,270 $10,062,270 $8,589,730 $18,652,000 79.8%
Lyonsdale - Maintenance Resources $14,258,256 $9,813,813 $4,444,443 $14,258,256 100.0%
Generation Attributes Tracking System $152,371 $53,369 $99,002 $152,371 100.0%
Available Main Tier Funding through 2024 $1,174,692,942 — — — 0.0%
Subtotal $2,301,303,350 $203,702,077 $668,186,060 $871,888,137 37.9%
Customer-Sited Tier
PV $255,716,894 $139,635,248 $26,694,467 $166,329,714 65.0%
Fuel Cells $22,532,210 $922,850 $1,884,360 $2,807,210 12.5%
Anaerobic Digesters $75,859,269 $7,704,939 $13,744,437 $21,449,376 28.3%
On-Site Wind $21,445,772 $5,690,107 $857,420 $6,547,528 30.5%
Solar Thermal $20,320,855 $1,249,974 $898,024 $2,147,998 10.6%
Competitive PV (formerly Geographic Balance) $226,900,000 $744,891 $10,521,704 $11,266,595 5.0%
Subtotal $622,775,000 $155,948,009 $54,600,412 $210,548,420 33.8%
Subtotal—Program Funding $2,924,078,350 $359,650,086 $722,786,472 $1,082,436,558 37.0%
Administration
Administration—Staff/Overhead $50,551,305 $16,015,717 $22,855 $16,038,572
39.6%
QA/QC***—Anaerobic Digesters — $495,706 $1,088,094 $1,583,800
QA/QC—Fuel Cells — $40,305 — $40,305
QA/QC—PV & Small Wind — $1,877,407 $229,388 $2,106,795
QA/QC—On-Site Wind — — — —
QA/QC—Solar Thermal — $42,369 $219,351 $261,720
QA/QC—Competitive PV (formerly Gergraphic Balance) — — — —
Administration-Consultant Support $3,827,695 $2,035,272 $369,525 $2,404,797 62.8%
NYS Cost Recovery Fee**** $19,676,622 $9,630,888 — $9,630,888 48.9%
Evaluation—Staff/Overhead & Consultant Support $3,150,000 $1,036,984 $233,674 $1,260,658 40.0%
Subtotal $77,205,622 $31,174,647 $2,152,887 $33,327,535 43.2%
Total Renewable Portfolio Standard $3,001,283,972 $390,824,733 $724,939,359 $1,115,764,093 37.2%
* Main Tier RFP Budgets include Contract Commitments as of December 31, 2012 and do not reflect contracted funds yet to be disencumbered as a result of Main Tier facility underperformance in 2012.
** An agreement awarded as a result of RFP 1851 for the Marble River Wind Farm was combined with an agreement awarded under RFP 2226 to reflect an increase in the size of the facility. The committed funding remains separated in the respective solicitation balances shown above.
*** Quality Assurance/Quality Control**** A September 19, 2011 Order authorized Interest and/or Letter of Credit proceeds to fund the NYS Cost Recovery Fee Allocations for 2011 -2013 in
excess of the budgeted amounts for those annual periods. The Actual Cost Recovery Fee for 2012 was $2,626,641, the budget was $992,000. The difference is reflected as an increase in the budget as compared to the budget reflected in the the April 2010 Order.
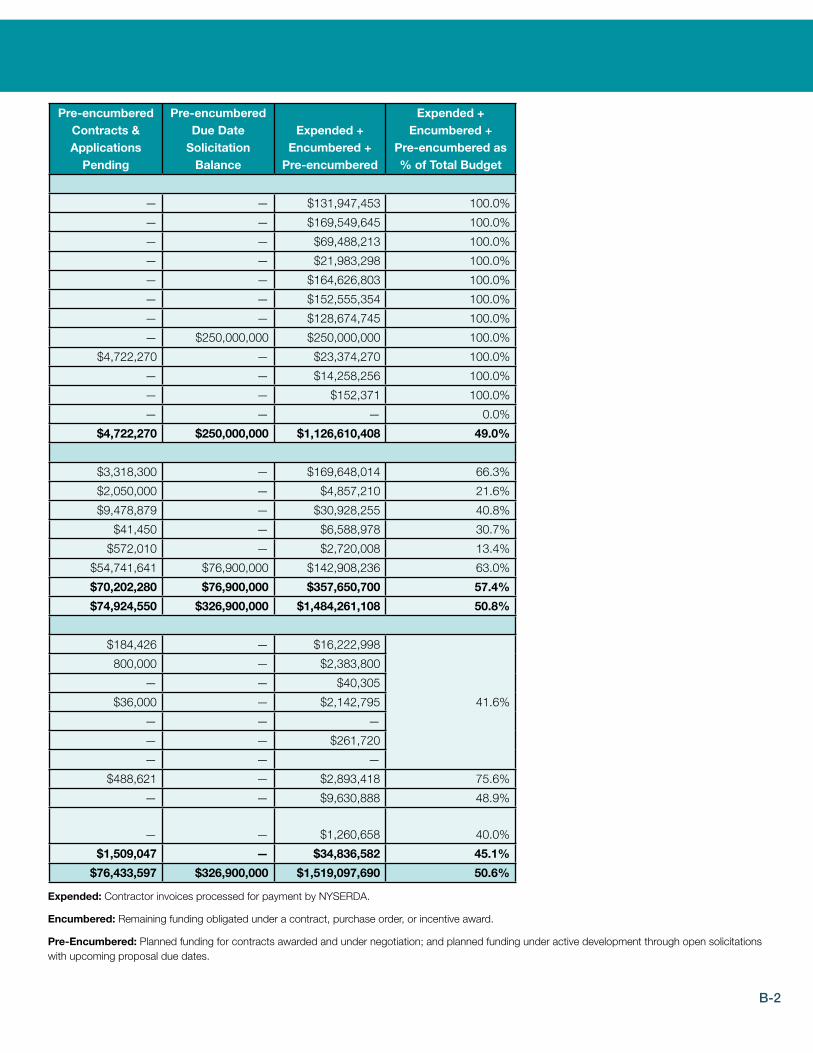
b-2
Pre-encumbered Contracts & Applications
Pending
Pre-encumbered Due Date
Solicitation Balance
Expended + Encumbered +
Pre-encumbered
Expended + Encumbered +
Pre-encumbered as % of Total Budget
— — $131,947,453 100.0%
— — $169,549,645 100.0%
— — $69,488,213 100.0%
— — $21,983,298 100.0%
— — $164,626,803 100.0%
— — $152,555,354 100.0%
— — $128,674,745 100.0%
— $250,000,000 $250,000,000 100.0%
$4,722,270 — $23,374,270 100.0%
— — $14,258,256 100.0%
— — $152,371 100.0%
— — — 0.0%
$4,722,270 $250,000,000 $1,126,610,408 49.0%
$3,318,300 — $169,648,014 66.3%
$2,050,000 — $4,857,210 21.6%
$9,478,879 — $30,928,255 40.8%
$41,450 — $6,588,978 30.7%
$572,010 — $2,720,008 13.4%
$54,741,641 $76,900,000 $142,908,236 63.0%
$70,202,280 $76,900,000 $357,650,700 57.4%
$74,924,550 $326,900,000 $1,484,261,108 50.8%
$184,426 — $16,222,998
41.6%
800,000 — $2,383,800
— — $40,305
$36,000 — $2,142,795
— — —
— — $261,720
— — —
$488,621 — $2,893,418 75.6%
— — $9,630,888 48.9%
— — $1,260,658 40.0%
$1,509,047 — $34,836,582 45.1%
$76,433,597 $326,900,000 $1,519,097,690 50.6%
Expended: Contractor invoices processed for payment by NYSERDA.
Encumbered: Remaining funding obligated under a contract, purchase order, or incentive award.
Pre-Encumbered: Planned funding for contracts awarded and under negotiation; and planned funding under active development through open solicitations with upcoming proposal due dates.
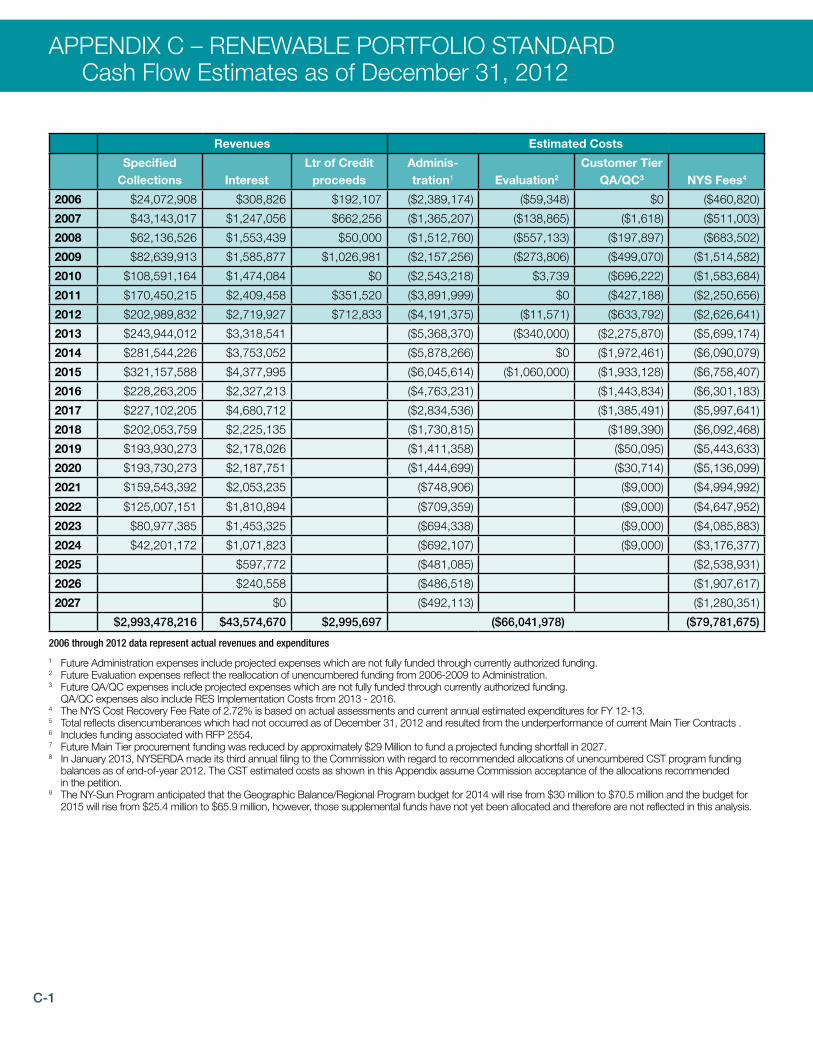
APPENDIx C – RENEWABLE PORTFOLIO STANDARD Cash Flow Estimates as of December 31, 2012
C-1
Revenues Estimated Costs
Specified Collections
Interest
Ltr of Credit proceeds
Adminis-tration1
Evaluation2
Customer Tier QA/QC3
NYS Fees4
2006 $24,072,908 $308,826 $192,107 ($2,389,174) ($59,348) $0 ($460,820)
2007 $43,143,017 $1,247,056 $662,256 ($1,365,207) ($138,865) ($1,618) ($511,003)
2008 $62,136,526 $1,553,439 $50,000 ($1,512,760) ($557,133) ($197,897) ($683,502)
2009 $82,639,913 $1,585,877 $1,026,981 ($2,157,256) ($273,806) ($499,070) ($1,514,582)
2010 $108,591,164 $1,474,084 $0 ($2,543,218) $3,739 ($696,222) ($1,583,684)
2011 $170,450,215 $2,409,458 $351,520 ($3,891,999) $0 ($427,188) ($2,250,656)
2012 $202,989,832 $2,719,927 $712,833 ($4,191,375) ($11,571) ($633,792) ($2,626,641)
2013 $243,944,012 $3,318,541 ($5,368,370) ($340,000) ($2,275,870) ($5,699,174)
2014 $281,544,226 $3,753,052 ($5,878,266) $0 ($1,972,461) ($6,090,079)
2015 $321,157,588 $4,377,995 ($6,045,614) ($1,060,000) ($1,933,128) ($6,758,407)
2016 $228,263,205 $2,327,213 ($4,763,231) ($1,443,834) ($6,301,183)
2017 $227,102,205 $4,680,712 ($2,834,536) ($1,385,491) ($5,997,641)
2018 $202,053,759 $2,225,135 ($1,730,815) ($189,390) ($6,092,468)
2019 $193,930,273 $2,178,026 ($1,411,358) ($50,095) ($5,443,633)
2020 $193,730,273 $2,187,751 ($1,444,699) ($30,714) ($5,136,099)
2021 $159,543,392 $2,053,235 ($748,906) ($9,000) ($4,994,992)
2022 $125,007,151 $1,810,894 ($709,359) ($9,000) ($4,647,952)
2023 $80,977,385 $1,453,325 ($694,338) ($9,000) ($4,085,883)
2024 $42,201,172 $1,071,823 ($692,107) ($9,000) ($3,176,377)
2025 $597,772 ($481,085) ($2,538,931)
2026 $240,558 ($486,518) ($1,907,617)
2027 $0 ($492,113) ($1,280,351)
$2,993,478,216 $43,574,670 $2,995,697 ($66,041,978) ($79,781,675)
2006 through 2012 data represent actual revenues and expenditures
1 Future Administration expenses include projected expenses which are not fully funded through currently authorized funding.2 Future Evaluation expenses reflect the reallocation of unencumbered funding from 2006-2009 to Administration.3 F uture QA/QC expenses include projected expenses which are not fully funded through currently authorized funding.
QA/QC expenses also include RES Implementation Costs from 2013 - 2016.4 The NYS Cost Recovery Fee Rate of 2.72% is based on actual assessments and current annual estimated expenditures for FY 12-13.5 Total reflects disencumberances which had not occurred as of December 31, 2012 and resulted from the underperformance of current Main Tier Contracts .6 Includes funding associated with RFP 2554.7 Future Main Tier procurement funding was reduced by approximately $29 Million to fund a projected funding shortfall in 2027.8 In January 2013, NYSERDA made its third annual filing to the Commission with regard to recommended allocations of unencumbered CST program funding
balances as of end-of-year 2012. The CST estimated costs as shown in this Appendix assume Commission acceptance of the allocations recommended in the petition.
9 The NY-Sun Program anticipated that the Geographic Balance/Regional Program budget for 2014 will rise from $30 million to $70.5 million and the budget for 2015 will rise from $25.4 million to $65.9 million, however, those supplemental funds have not yet been allocated and therefore are not reflected in this analysis.
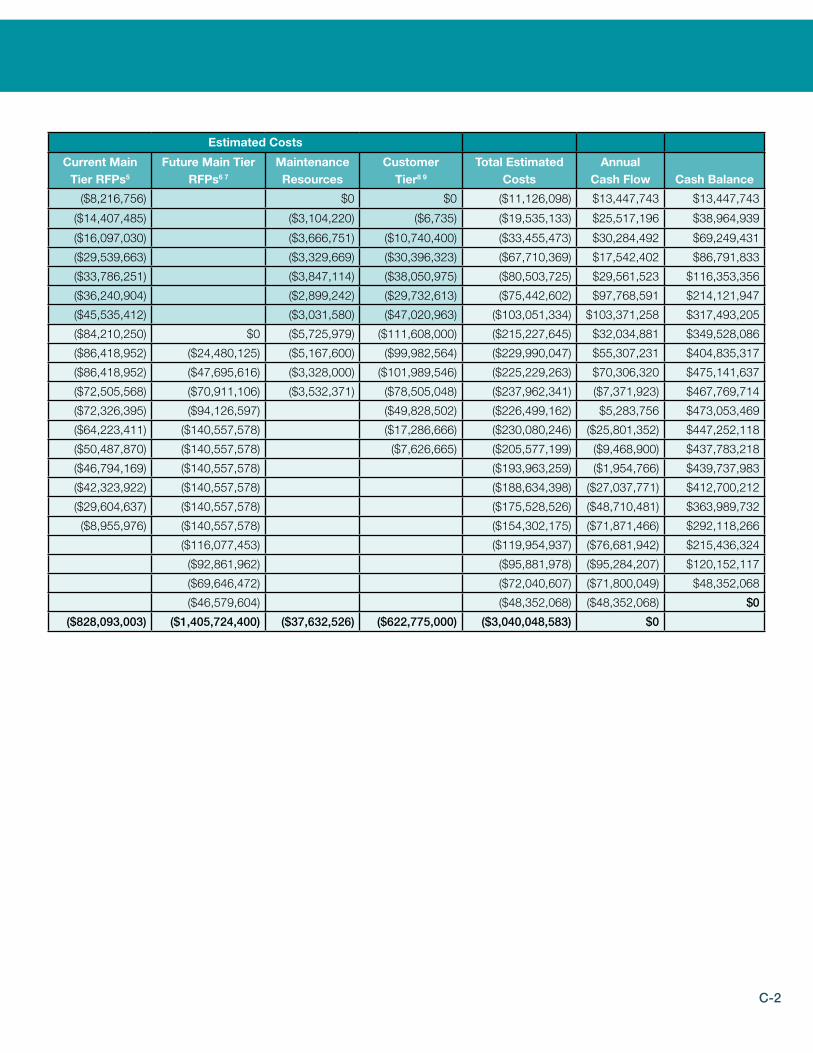
C-2
Estimated Costs
Current Main Tier RFPs5
Future Main Tier RFPs6 7
Maintenance Resources
Customer Tier8 9
Total Estimated Costs
Annual Cash Flow
Cash Balance
($8,216,756) $0 $0 ($11,126,098) $13,447,743 $13,447,743
($14,407,485) ($3,104,220) ($6,735) ($19,535,133) $25,517,196 $38,964,939
($16,097,030) ($3,666,751) ($10,740,400) ($33,455,473) $30,284,492 $69,249,431
($29,539,663) ($3,329,669) ($30,396,323) ($67,710,369) $17,542,402 $86,791,833
($33,786,251) ($3,847,114) ($38,050,975) ($80,503,725) $29,561,523 $116,353,356
($36,240,904) ($2,899,242) ($29,732,613) ($75,442,602) $97,768,591 $214,121,947
($45,535,412) ($3,031,580) ($47,020,963) ($103,051,334) $103,371,258 $317,493,205
($84,210,250) $0 ($5,725,979) ($111,608,000) ($215,227,645) $32,034,881 $349,528,086
($86,418,952) ($24,480,125) ($5,167,600) ($99,982,564) ($229,990,047) $55,307,231 $404,835,317
($86,418,952) ($47,695,616) ($3,328,000) ($101,989,546) ($225,229,263) $70,306,320 $475,141,637
($72,505,568) ($70,911,106) ($3,532,371) ($78,505,048) ($237,962,341) ($7,371,923) $467,769,714
($72,326,395) ($94,126,597) ($49,828,502) ($226,499,162) $5,283,756 $473,053,469
($64,223,411) ($140,557,578) ($17,286,666) ($230,080,246) ($25,801,352) $447,252,118
($50,487,870) ($140,557,578) ($7,626,665) ($205,577,199) ($9,468,900) $437,783,218
($46,794,169) ($140,557,578) ($193,963,259) ($1,954,766) $439,737,983
($42,323,922) ($140,557,578) ($188,634,398) ($27,037,771) $412,700,212
($29,604,637) ($140,557,578) ($175,528,526) ($48,710,481) $363,989,732
($8,955,976) ($140,557,578) ($154,302,175) ($71,871,466) $292,118,266
($116,077,453) ($119,954,937) ($76,681,942) $215,436,324
($92,861,962) ($95,881,978) ($95,284,207) $120,152,117
($69,646,472) ($72,040,607) ($71,800,049) $48,352,068
($46,579,604) ($48,352,068) ($48,352,068) $0
($828,093,003) ($1,405,724,400) ($37,632,526) ($622,775,000) ($3,040,048,583) $0

NYSERDA, a public benefit corporation, offers objective information and analysis, innovative programs, technical expertise and funding to help New Yorkers increase energy efficiency, save money, use renewable energy, and reduce their reliance on fossil fuels. NYSERDA professionals work to protect our environment and create clean-energy jobs. NYSERDA has been developing partnerships to advance innovative energy solutions in New York since 1975.
To learn more about NYSERDA programs and funding opportunities visit nyserda.ny.gov.
New York State toll free: 1 (866) NYSERDAEnergy Research and local: (518) 862-1090
Development Authority fax: (518) 862-1091
17 Columbia Circle [email protected], New York 12203-6399 nyserda.ny.gov
The New York State Renewable Portfolio Standard Performance Report
Through December 31, 2012
New York State Energy Research and Development Authority
Francis J. Murray, Jr., President and CEO
RD-CERMD-rps-r-2012-2-v1 Release Date: 3-29-13
State of New York
Andrew M. Cuomo, Governor