the northeast residuals & biosolids conference weftec 2016 ... · the northeast residuals &...
TRANSCRIPT

weftec 2016 | 89th Annual WEFTEC Conference
September 2016
Lab-Scale Thermophilic Startup Influencing Full-Scale Startup
Karla S. Guevarra, Alexander Miot, Bonnie Jones San Francisco Public Utilities Commission
Tracy Chouinard T 978.983.2047 [email protected]
The Northeast Residuals & Biosolids Conference

• Background - Oceanside Plant - Digester Upgrades
• Objectives and Results of Lab-Scale Studies
• Full-Scale Implementation
• Conclusions
Presentation Outline

Oceanside Plant Overview
• Commissioned in 1993 • Provides secondary treatment for 20%
of San Francisco’s wastewater • Dry weather flow:
21 MGD (design) 12-14 MGD (current)
• Wet weather flow:
65 MGD • High rate pure oxygen plant
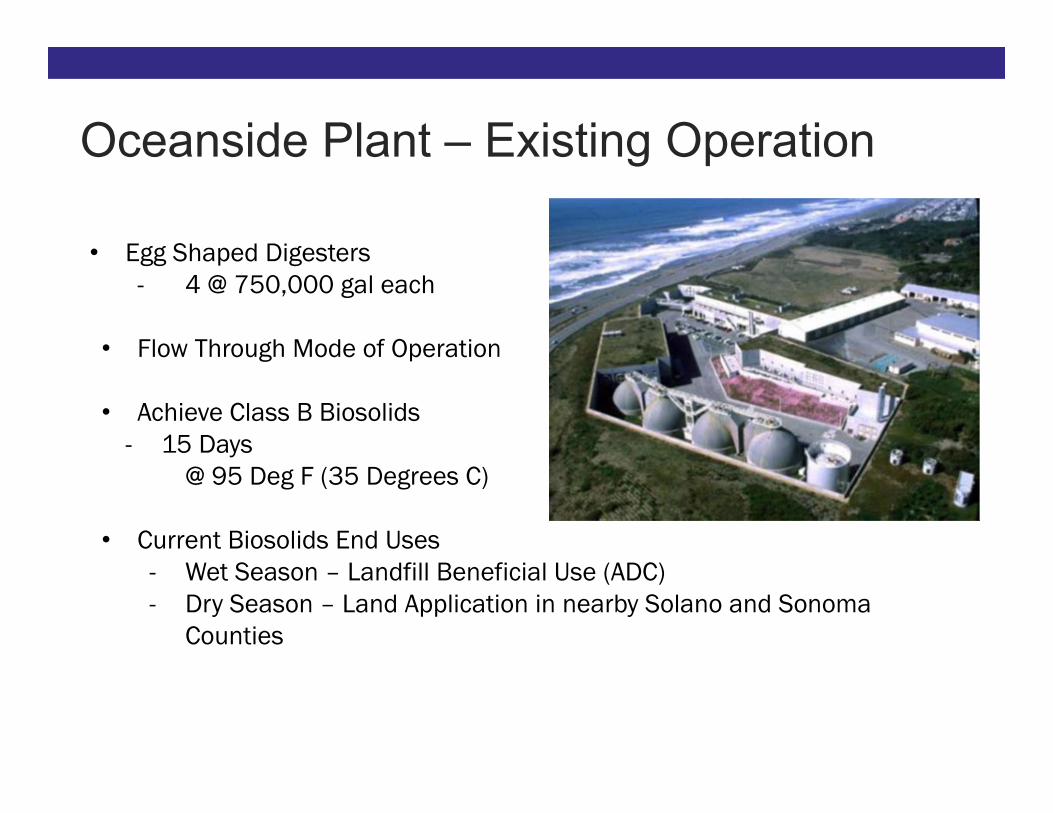
Oceanside Plant – Existing Operation
• Egg Shaped Digesters - 4 @ 750,000 gal each
• Flow Through Mode of Operation
• Achieve Class B Biosolids - 15 Days
@ 95 Deg F (35 Degrees C)
• Current Biosolids End Uses - Wet Season – Landfill Beneficial Use (ADC) - Dry Season – Land Application in nearby Solano and Sonoma
Counties

Temperature Phased Anaerobic Digestion
• Driver to Class A – County ordinance requirement in order
to continue to land apply
• Temperature Phased Anaerobic Digestion (TPAD) Process - Three thermophilic digesters operate in batch mode - One mesophilic digester receives all thermophilic
sludge • Achieve Class A through time and temp
- 24 hours @ 131 Deg F (55 Deg C)

TPAD Conversion
• Previous Operation 4 Mesophilic digesters operating
in parallel Daily feed evenly split to online
digesters so each digester receives ~30,000 gal feed
Mesophilic Digesters
1
2
3
4
Dewatering Tanks
FEED Tank
• Future Operation – TPAD 3 Thermophilic Digesters alternate in Fill-
Hold-Draw Mode where Fill digester receives 130,000 gal feed
1 Mesophilic Digester receives transferred thermophilic sludge
Fill
Hold
Draw 1
Mesophilic Digester
Thermophilic Digesters
Dewatering Tanks
FEED Tank

Meso Sludge
Cooling HEX
Dig 4
Dig 3
Dig 2
Dig 1
F
Preheated TPAS
F
Grit Flow
Through
HDS Pump
Hold
Draw
Fill
Day Tank
Cool
ed T
herm
o Sl
udge
Hot Therm
o Sludge

Digester Upgrades • Existing Digesters were Retrofitted
- Corrosion repairs
- Odor Control Improvements
- Piping modifications
- Insulation improvements
- Heat exchanger upgrades
- Heat recovery system
- New boilers

Today’s Digesters
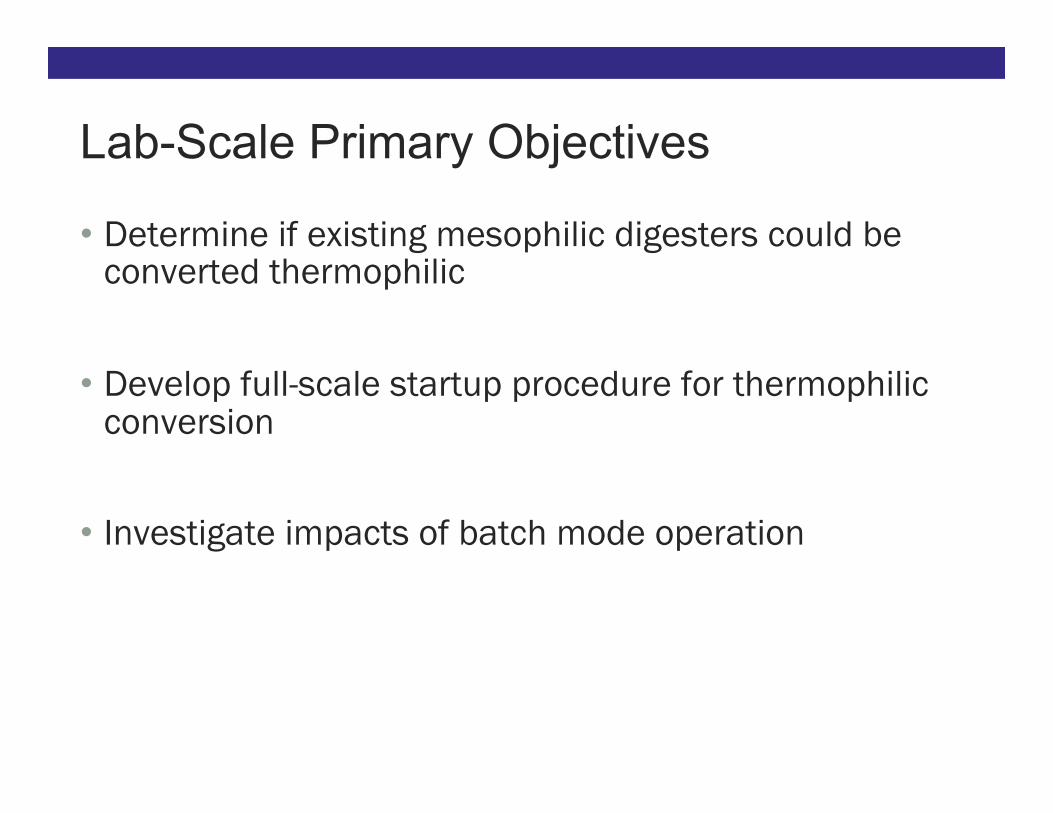
• Determine if existing mesophilic digesters could be converted thermophilic
• Develop full-scale startup procedure for thermophilic conversion
• Investigate impacts of batch mode operation
Lab-Scale Primary Objectives

• Four – 14 L Stainless Steel Reactors - 11L working volume
• Continuous biogas flow measurement • Key parameters measured
- Volatile Acids - Alkalinity - pH - Ammonia - TS/VS
Lab-Scale Reactors

Objective To determine the feasibility of converting mesophilic
seed to thermophilic seed
Main Configuration
Temp2 day
increase2day
increase4 day
increaseMesophilicControl
Reactor R1 R2 R3 R4Final OLR
Goal (lb VS/ft3-d)
0.17
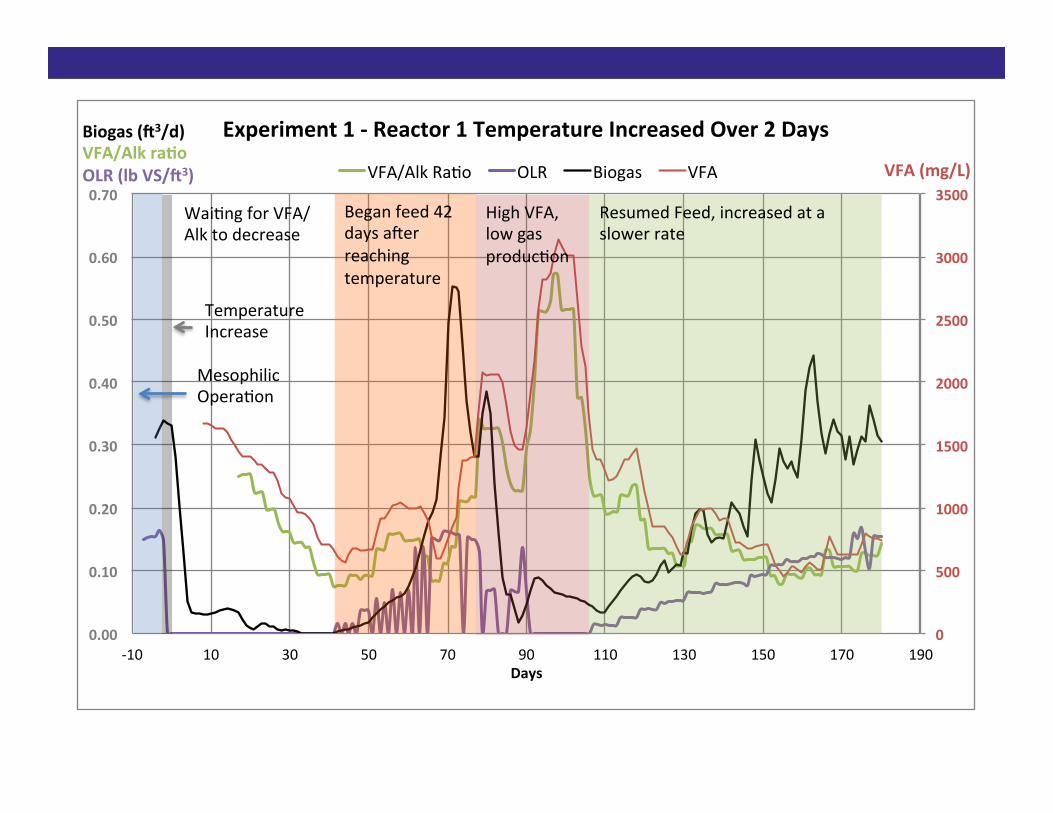
Experiment 1
0
500
1000
1500
2000
2500
3000
3500
0.00
0.10
0.20
0.30
0.40
0.50
0.60
0.70
-10 10 30 50 70 90 110 130 150 170 190
VFA(mg/L)
Biogas(93/d)VFA/Alkra>oOLR(lbVS/93)
Days
Experiment1-Reactor1TemperatureIncreasedOver2Days
VFA/AlkRa1o OLR Biogas VFA
HighVFA,lowgasproduc1on
ResumedFeed,increasedataslowerrate
Beganfeed42daysaJerreachingtemperature
TemperatureIncrease
MesophilicOpera1on
Wai1ngforVFA/Alktodecrease

0
500
1000
1500
2000
2500
3000
3500
0.00
0.10
0.20
0.30
0.40
0.50
0.60
0.70
-10 10 30 50 70 90 110 130 150 170 190
VFA(mg/L)
Biogas(93/d)VFA/Alkra>oOLR(lbVS/93)
Days
Experiment1-Reactor3TemperatureIncreasedOver4Days
VFA/AlkRa1o OLR Biogas VFA
BeganFeeding40daysa>ertemperatureincrease
HighVFA,lowgasproduc1on
ResumedFeed,increasedataslowerrate
MesophilicOpera1on
TemperatureIncrease
Wai1ngforVFA/Alktodecrease

ObjectiveTo repeat and confirm results from
Experiment 1
Main Configuration
Temp 4 day increaseReactor R2&R4
Final OLR Goal (lb VS/ft3-d)
0.17
Experiment 2

0
500
1000
1500
2000
2500
3000
3500
0.00
0.10
0.20
0.30
0.40
0.50
0.60
0.70
-40 -20 0 20 40 60 80 100
VFA(mg/L)
Biogas(93/d)VFA/Alkra>oOLR(lbVS/93)
Days
Experiment2-Reactor2
VFA/AlkRa1o OLR Biogas VFA
MesophilicOpera1on
TemperatureIncrease
StarvedReactor
BeganFeed12DaysAJerTemperatureIncrease

0
500
1000
1500
2000
2500
3000
3500
0.00
0.10
0.20
0.30
0.40
0.50
0.60
0.70
-40 -20 0 20 40 60 80 100
VFA(mg/L)
Biogas(93/d)VFA/Alkra>oOLR(lbVS/93)
Days
Experiment2-Reactor4
VFA/AlkRa1o OLR Biogas VFA
MesophilicOpera1on BeganFeed15DaysaDerTemperatureIncrease
TemperatureIncrease

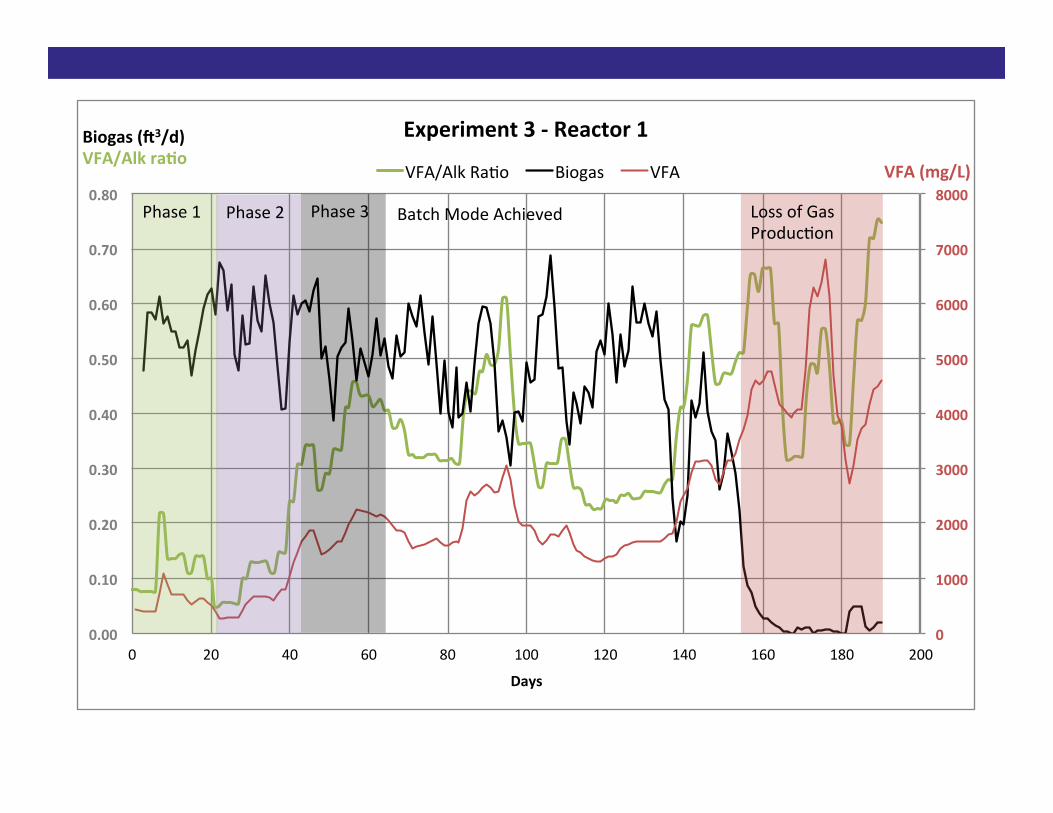
Cycle = Fill-Hold-Draw OLR (lb VS/ft3-d)
Initial Conditions Flow Through Operation 0.17
Phase 1 Cycle 1 - 7 0.25 0.13 0.13
Phase 2 Cycle 8 - 14 0.34 0.08 0.08
Phase 3 Cycle 15 - 21 0.42 0.04 0.04
Batch OLR Achieved Cycle 22 0.51 0.00 0.00
Experiment 3 - Transition to Batch Mode
0
1000
2000
3000
4000
5000
6000
7000
8000
0.00
0.10
0.20
0.30
0.40
0.50
0.60
0.70
0.80
0 20 40 60 80 100 120 140 160 180 200
VFA(mg/L)
Biogas(:3/d)VFA/Alkra?o
Days
Experiment3-Reactor1
VFA/AlkRa0o Biogas VFA
LossofGasProduc0on
Phase1 Phase2
Phase3 BatchModeAchieved

0
1000
2000
3000
4000
5000
6000
7000
0.00
0.10
0.20
0.30
0.40
0.50
0.60
0.70
0 20 40 60 80 100 120 140 160 180 200 220 240 260 280 300 320 340 360
VFA(mg/L)
Biogas(93/d)VFA/Alkra>o
Days
Experiment3-Reactor2
VFA/AlkRa1o Biogas VFA
BatchModeAchieved
LossofGasProduc1on
Phase1
Phase2
Phase3

Modified OLR (lb VS/ft3-d)
Flow Through Operation 0.17
Phase 1 0.25 0.00 0.00
Phase 2 0.34 0.00 0.00
Phase 3 0.42 0.00 0.00
Batch OLR Achieved 0.51 0.00 0.00
Modified Feed Strategy

0
1000
2000
3000
4000
5000
6000
7000
0.00
0.10
0.20
0.30
0.40
0.50
0.60
0.70
0 20 40 60 80 100 120 140 160 180 200 220 240 260 280 300 320 340 360
VFA(mg/L)
Biogas(93/d)VFA/Alkra>o
Days
Experiment3-Reactor2
VFA/AlkRa1o Biogas VFA
BatchModeAchieved
LossofGasProduc1on
ChangedFeedStrategyPhase1
Phase2
Phase3
BatchModeAchieved

• Maintain Strict Temperature Control - Resulted in automating temperature control strategy in full-
scale digesters • Conservative Feed Strategy
- Decision to “starve” digesters prior to temperature increase - Increase Feed to Digesters Weekly
• Transition from Flow Through to Batch Operation - Changed feed strategy to slowly ramp up overall OLR - One digester will be converted from flow through to batch
mode while maintaining 3 mesophilic digesters
Key Lab-Scale Findings and Impact on Full-Scale Startup

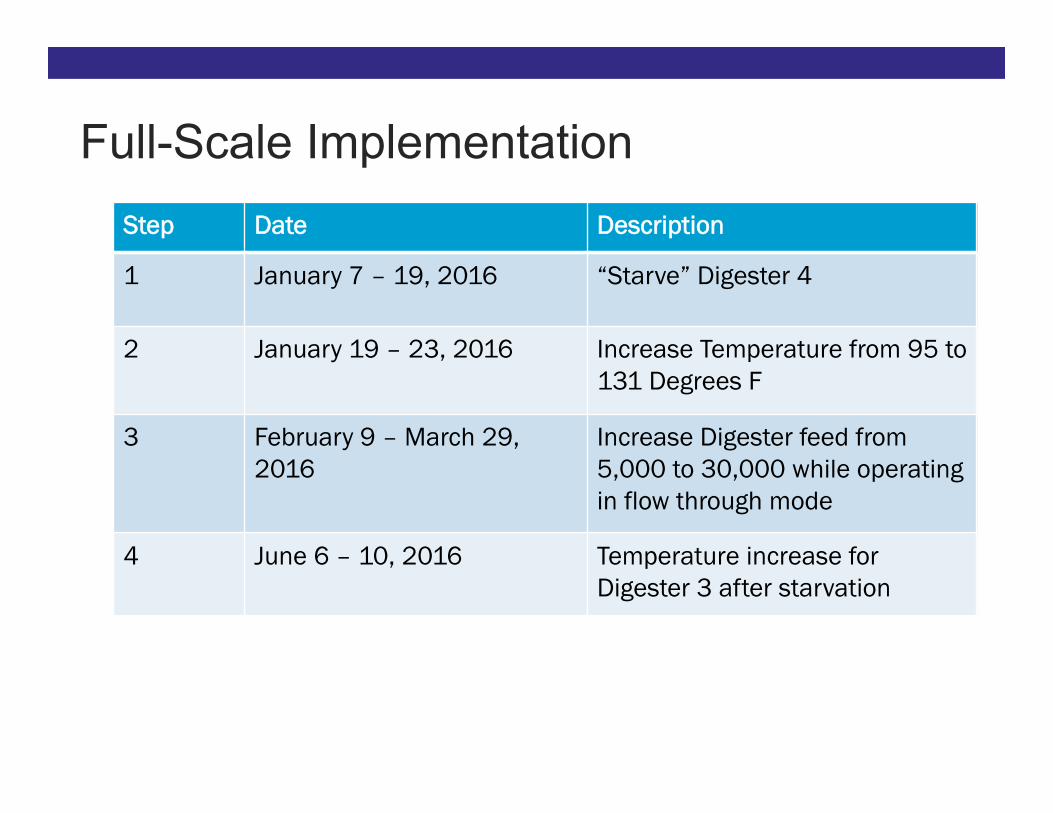
Step Date Description
1 January 7 – 19, 2016 “Starve” Digester 4
2 January 19 – 23, 2016 Increase Temperature from 95 to 131 Degrees F
3 February 9 – March 29, 2016
Increase Digester feed from 5,000 to 30,000 while operating in flow through mode
4 June 6 – 10, 2016 Temperature increase for Digester 3 after starvation
Full-Scale Implementation

Temperature Increase

12/24 1/13 2/2 2/22 3/13 4/2
0
200
400
600
800
1000
0
0.1
0.2
0.3
0.4
0.5
-30 -10 10 30 50 70
VFA(mg/L)
Biogas(x106:3/d)VFA/ALKRa>oOLR(lbVS/:3)
Days
FullScaleStartup-Digester4
VFA/AlkRa2o OLR VFA Biogas
MesophilicOpera2on
Digesterreachedfeedrategoalunderflowthroughmodeon3/29
ValvingErroron2/14Leadtolossof130,000gal
StarvedDigesterfor12DaysPriortoTempIncrease
TemperatureIncrease
Beganfeed17daysaRertemperatureincrease

Parameter Lab-Scale vs. Full-Scale
Comments
Stringent Temperature Control þ Closely monitored during full-
scale startup
Biogas Production Trends þ
Expected gas production to stop during transition
Feed Strategy þ
Conservative approach
Volatile Acids ý High peaks in lab-scale reactors likely from slug feeding
Flow Through to Batch Mode þ Full-Scale success anticipated
Conclusions

• Oceanside Plant Staff - Operations - Maintenance - Laboratory - Instrumentation & Controls - Distributed Control Systems
• Process Engineering Team (Co-Authors) - Alexandre Miot - Karla Guevarra - Bonnie Jones (retired)
• TPAD Design Team – CH2M
Acknowledgements

Questions?