the of biological vol. no. 15, issue august 10, pp. 7108 ...15, issue of august 10, pp. 7108-7117,...
TRANSCRIPT
THE JOURNAI. OF BIOLOGICAL CHEMISTRY Vol. 255. No. 15, Issue of August 10, pp. 7108-7117, 1980 Printed in U S.A.
A Ternary Complex Model Explains the Agonist-specific Binding Properties of the Adenylate Cyclase-coupled P-Adrenergic Receptor*
(Received for publication, November 14, 1979, and in revised form, March 18, 1980)
Medical Center, Durham, North Carolina 27710
The unique properties of agonist binding to the frog erythrocyte P-adrenergic receptor include the exist- ence of two affinity forms of the receptor. The propor- tion and relative affinity of these two states of the receptor fo r ligands varies with the intrinsic activity of the agonist and the presence of guanine nucleotides. The simplest model for hormone-receptor interactions which can explain and reproduce the experimental data involves the interaction of the receptor R with an ad- ditional membrane component X, leading to the ago- nist-promoted formation of a high affinity ternary com- plex HRX. Computer modeling of agonist binding data with a ternary complex model indicates that the model can fit the data with high accuracy under conditions where the ligand used is either a full or a partial agonist and where the system is altered by the addition of guanine nucleotide or after treatment with group-spe- cific reagents, e.g. p-hydroxymercuribenzoate. The pa- rameter es t imates obtained indicate that the intrinsic activity of the agonist is correlated significantly with the affinity constant L of the component X fo r the binary complex HR. The major effect of adding guanine nucleotides is to destabilize the ternary complex HRX from which both the hormone H and the component X can dissociate. The modulatory role of nucleotides on the affinity of agonists fo r the receptor is consistent with the assumption that the component X is the gua- nine nucleotide binding site. The ternary complex model was also applied successfully to the turkey erythrocyte receptor system. The model provides a general scheme for the activation b y agonists of ade- nylate cyclase-coupled receptor systems and also of other systems where the effector might be different.
The direct study of radiolabeled agonist and antagonist interactions with the /?-adrenergic receptor has revealed unique properties of agonist binding which may be indicative of the mechanism by which they activate the effector adenyl- ate cyclase. It has been shown that, while competition curves
* This work was supported by Grants HL16037 and HL20339 from the Department of Health, Education and Welfare and by Grant LM03373 from the National Library of Medicine. The costs of publi- cation of this article were defrayed in part by the payment of page charges. This article must therefore be hereby marked “aduertise- ment” in accordance with 18 U.S.C. Section 1734 solely to indicate this fact.
$ Recipient of a “Centennial” Postdoctoral Fellowship of the Med- ical Research Council of Canada.
3 To whom correspondence and requests for reprints should be addressed at: Box 3325, Duke University Medical Center, Durham, NC 27710.
1 Investigator of the Howard Hughes Medical Institute.
Andre De Lean,+g Jeffrey M. Stadel, and Robert J. Lefkowitzl From the Howard Huehes Medical Institute Laboratory, Departments of Medicine and Biochemistry, Duke University
for antagonists uersus radiolabeled antagonists are “steep” with slope factors (“pseudo Hill coefficients”) of 1, competition curves for agonists are “shallow” with slope factors less than 1 (1-3). The shdow agonist competition curves are compati- ble with at least two states of the receptor in the absence of guanine nucleotides: a magnesium-dependent, slowly reversi- ble high affinity state, also demonstrable by direct binding studies with the tritiated agonist hydroxybenzylisoproterenol ([3H]HBI)’ and a lower affinity state which predominates when guanine nucleotides are present at high concentration. In contrast, antagonist binding to the same receptor is char- acterized by a single affinity form insensitive to guanine nucleotides (4) . The formation of the high affinity state of the agonist-receptor complex is a prerequisite for its action (5). The transition or “shift” from the high to the low affinity state of the agonist e receptor complex, promoted by guanine nucleotide, is normally associated with an increase in agonist- induced adenylate cyclase catalytic activity (2, 5).
Quantitative data analysis of agonist competition curves with [3H]DHA has revealed that the intrinsic activity of the agonist for stimulation of adenylate cyclase activity is corre- lated with the proportion of agonist - receptor complex in the high affinity state as well as with the ratio KH/KL of the affinity constants of the agonist for the high RH and the low RL affinity states of the receptor (3). Computer modeling of agonist competition curves has also indicated that, in the presence of increasing concentrations of guanine nucleotides, the proportion of the high afiinity form of the agonist. recep- tor complex gradually decreases to low and undetectable levels (3). The observation of varying proportions of high and low affinity states of the receptor with agonists of different intrin- sic activity and with increasing concentrations of guanine nucleotides is strong evidence for the interconvertibility of these states of the receptor.
Observations compatible with two affinity states of the receptor have been described not only for many /?-adrenergic receptor systems (1, 2, 5-8), but also for the platelet a-adre- nergic receptor (9), the muscarinic receptor (lo), the dopa- minergic receptor (ll), and the glucagon receptor (12). The widespread occurrence and the similarities of the agonist- specific, nucleotide-sensitive high affinity state of receptors for various hormones and neurotransmitters suggests that a common mechanism might be involved.
We describe here a systematic study of various models of hormone-receptor interactions in terms of the ability to ex- plain and reproduce the binding characteristics of the adenyl-
’ The abbreviations used are: HBI, hydroxybenzylisoproterenol; COB, cobefrin; DCI, dichloroisoproterenol; DHA, dihydroalprenolol; EPI, epinephrine; Gpp(NH)p, guanyl-5“yl imidodiphosphate; ISO, isoproterenol; ISOETH, isoetharine; NEM, N-ethylmaleimide; SOT, soterenol; p-MB. p-hydroxymercuribenzoate; GTPyS, guanosine 5’- 0-(3-thiotriphosphate).
7 108

Ternary Complex Model for the P-Adrenergic Receptor 7 109
ate cyclase-coupled P-adrenergic receptor in frog erythrocytes. These studies involve an agonist (['HIHBI) and an antagonist ([3H]DHA) radioligand. The simplest appropriate model in- volves the interaction of the hormone-occupied receptor ( H R ) with an additional component ( X ) in the plasma membrane according to a bimolecular reaction. The model proposed 1) fits the data with high accuracy, 2) is verifiable using a number of distinct experimental approaches, 3) provides a basis for predictions about the nature of agonist interactions with their receptors, 4) correlates with recent biochemical evidence sug- gesting the involvement of the nucleotide binding site (G site) in the formation of the agonist-promoted high affinity state of the P-adrenergic receptor, and 5) may be applicable to other receptor systems including those where the agonistic effect is an inhibition of adenylate cyclase activity and also to those which involve a different kind of effector.
EXPERIMENTAL PROCEDURES
Materials-The sources of all drugs and chemicals have been reported previously (13). Jumbo southern grass frogs were obtained from Nasco-Steinhilber. (-)-["HIDHA (52 and 41 Ci/mmol) and (t)-[?H]HBI (17 Ci/mmol) were obtained from New England Nu- clear.
Frog Erythrocyte Membrane Preparation-Washed frog erythro- cytes were obtained as previously described (13). Purified plasma membranes were prepared as described (14).
Binding Assay for Frog Erythrocyte Membranes-Freshly pre-
either (-)-['HIDHA or (k)-[:'H]HBI and appropriate unlabeled lig- pared plasma membranes were incubated in polypropylene tubes with
and for 60 min a t 25OC in a total volume of 1 d containing 45 mM Tris-HCI, pH 7.5, 7.5 mM MgC12, 0.9 mM EDTA, I mM ascorbic acid, 0.1 mM catechol, and 150 to 250 pg of membrane protein. The final concentration of receptor sites ranged from 200 to 400 PM. The reaction was stopped by the addition of 5 ml of ice-cold buffer containing 75 mM Tris-HCI, pH 7.65, 25 m~ MgCl?, and filtration on GF/C glass fiber filters (Whatman), and one (for (-)-["HIDHA bind- ing) or two (for (&)-["HIHBI binding) additional washings with 5 ml of buffer. The radioactive ligand trapped on the filters was then measured as previously described (13).
For saturation curves with (-)-["HIDHA or (k)-["H]HBI, "non- specific" binding was determined in the presence of M (&)- propranolol. For competition curves, (-)-["HIDHA or (+)-cH]HBI were added a t a final concentration of about 2 nM together with the indicated concentration of unlabeled competitor.
Agonist binding has been shown to be reversible a t a slow but finite rate (4). In order to validate the hypothesis that both saturation and competition curves were obtained under conditions compatible with true equilibrium, the regular incubation period (60 min) was doubled and the results obtained were indistinguishable from those found after the usual incubation time.
Membrane Preparation and Binding Assay for Turkey Erythro- cyte Membranes-The membrane preparation and binding assay for turkey erythrocyte membranes were performed as previously de- scribed ( 5 ) .
Data Analysis.-All the experimental data, expressed as the ob- served concentration of radioligand bound uersus the concentration of varying ligand added were subjected to nonlinear least squares curve fitting according to the method of Marquardt and Levenberg as described by Fletcher (15). The deviations of the points from their predicted value Yon the curve (residuals) were weighted according to the reciprocal of their expected variance according to Ref. 16:
Var(Y) = au + Ui.Y"' (1)
where a1 is a proportionality constant roughly equal to the square of the relative error of Y , the exponent a, is ranging from 1 to 2, and is a small constant which prevents the variance estimate from becom- ing too small when Y is close to 0. The variance function is verified by checking that the weighted residual variance of the fit is in the neighborhood of unity when the model used is appropriate.
Testing for statistical difference between models is obtained by comparing the residual variance of their fits to the data according to the "extra sum of squares" principle ( 17) as applied by Rodbard (18):
F = ((SSI - S&)/(dfi - dfi))/(SSz/dfr) (2)
where SS, and SS2 are the sum of squares of residuals for the fit with the simpler (less parameters) and the more complex model (more parameters), respectively, and dfi and dfL are the corresponding degrees of freedom of the fits (dfi,dfd. The F ratio has (dfi - dfd degrees of freedom for the numerator and dfi degrees of freedom for the denominator.
Saturation Curves-The curves for total binding (specific and nonspecific) and those for nonspecific binding only are analyzed simultaneously, according to a model for one class of receptor sites and nonspecific binding (19). The two curves are constrained to become parallel a t high ligand concentration by sharing among the curves a common estimate for the proportionality constant N for nonspecific binding. The parameter N is equal to bound/free ligand for nonspecific binding, corresponding to the horizontal asymptote on a Scatchard plot for total binding (19). Attempts to fit the saturation curves using a model for two classes of sites did not significantly improve the goodness of fit.
Competition Curues-The competition curves expressed as concen- tration of total radioligand bound uersus concentration of competitor added are first analyzed according to a four parameter logistic equa- tion (20):
Y = d + (a - d)/(l + (X/C)h) (3 )
where X and Y are the concentration of the competitor and radioli- gand bound, respectively, c is the 50% effective concentration of competitor (EDYl), b is the slope factor, and a and da re t he extrap- olated upper and lower limits for the observed value of Y, when X is 0 and infinite, respectively. When required, competition curves from several experiments are pooled by first scaling them according to their respective limits a and d. Then the scaled data are averaged and their mean points are rescaled to the original units for Y , using the averaged upper a and lower d limits of all the curves.
The individual or averaged curves are then analyzed according to a model for the binding of the ligand and the competitor to one or two forms of the receptor according to mass action law (19). A model for two forms of the receptor is retained only when it fits the data significantly better compared to a model for a single form of receptor sites. The concentration B, of each ligand i bound is given by:
B, H, - F, ( 4 )
where H, is the total concentration of ligand i and F, is the correspond- ing free ligand concentration which satisfies the implicit equation:
G(F,) = Hz - F,.T, = 0 (5)
Tr = 1 4- Z K,h.Rh/Sh + N , (6)
s o = 1 + X K,I,.F, (7)
The parameter Rb is the concentration of state 6, K,D and K,, are the equilibrium "affinity" constants for the binding of ligand i or a to state b and N, is the bound/free ratio for nonspecific binding for ligand i.
This model has been applied previously to systems with independ- ent receptor subtypes (21, 22) or with separate affinity states of the same receptor ( 3 ) . When the model is applied to the case of separate affinity states, one assumes that those states, although interconvert- Me, can be nonetheless segregated. This assumption is supported by experimental evidence which indicates that the high affinity, slowly reversible form of agonist binding can be isolated in a slow release form after washing out the low affinity, readily reversible form of the agonist.receptor complex (4). Once formed, the high affinity state dissociates slowly in the presence of antagonists but is readily con- vertible to the low affinity form of the receptor only in the presence of guanine nucleotide.
The competition curves are finally analyzed with a model for a ternary complex HRX involving another component X in the mem- brane. Each ligand i binds to the free form of the receptor according to:
Kc HRt/(E. Fa) (8 )
where K, is the equilibrium constant for the "low affinity" form HR,, and E and F, are the concentration of empty sites and free ligand i, respectively. The low affinity form HR, for ligand i can interact with the component X according to:
Lr = HRX,/( U - HR,) (9)
where L, is the equilibrium constant for the transition from the low (HRJ to the high (HRX,) affinity form of the bound ligand i and U
7110 Ternary Complex Model for the P-Adrenergic Receptor
is the concentration of uncoupled component X . A spontaneous association of R with X to form RX is described according to:
M = R X / ( E - U ) (10)
where M is the equilibrium constant of the reaction. The total concentration E, of ligand i bound in both the low and the high affinity form is given by:
B, = H, - F, ( 1 1 )
where F, is obtained from the implicit equation:
G(F,) = Ht - F , . ( l + K1.E + K, .L ,E .U) - N,.F, = O (12)
The term E is obtained from the solution of the quadratic equation:
P ( E ) = T . ( S + 1 ) * E 2 + ( 1 + S + T . ( X - R ) ) - E - R = 0 (13)
and U is given by:
u = X / ( l + T . E ) (14 ) where
S = X Kc,, F,, (15)
T = M + X K ,*L , .F , (16 )
Computer Simulations-The analysis of the theoretical properties of model I (two classes of sites) were based on Equations 4 to 7 .
The properties of the "cyclic-allosteric" model (model 11) prior to equilibrium were studied by solving the linear differential equations for the four components R,R', HR, HR' of the system, and finding the eigenvalues and eigenvectors of the corresponding rate matrix (15) . The cyclic-allosteric model reduces at equilibrium to the allo- steric model (23) . For a monomeric receptor, it can be proved that the slope factor is 1 for any ligand (24):
Y = ( M . K ' . F + K * F ) / ( M . ( l + K'eF) + ( 1 + K . F ) ) (17)
where Y represents the fractional saturation of the receptor sites as a function of the free ligand concentration F, with M as the isomeri- zation constant for the two forms of the receptor, and K and K' as the equilibrium constants for the binding of the ligand to the two forms of the receptor. The slope of the logit-log transform:
log ( Y / ( 1 - Y ) ) = log ((A4.K' + K ) / ( M + 1 ) ) + log F (18)
is 1 .
equations previously described (25) .
IV) were studied using Equations 8 to 16.
ten in PL/1 for a PDP 11/45.
The divalent receptor model (model 111) was studied according to
The equilibrium properties of the ternary complex model (model
All computations were performed using interactive programs writ-
RESULTS
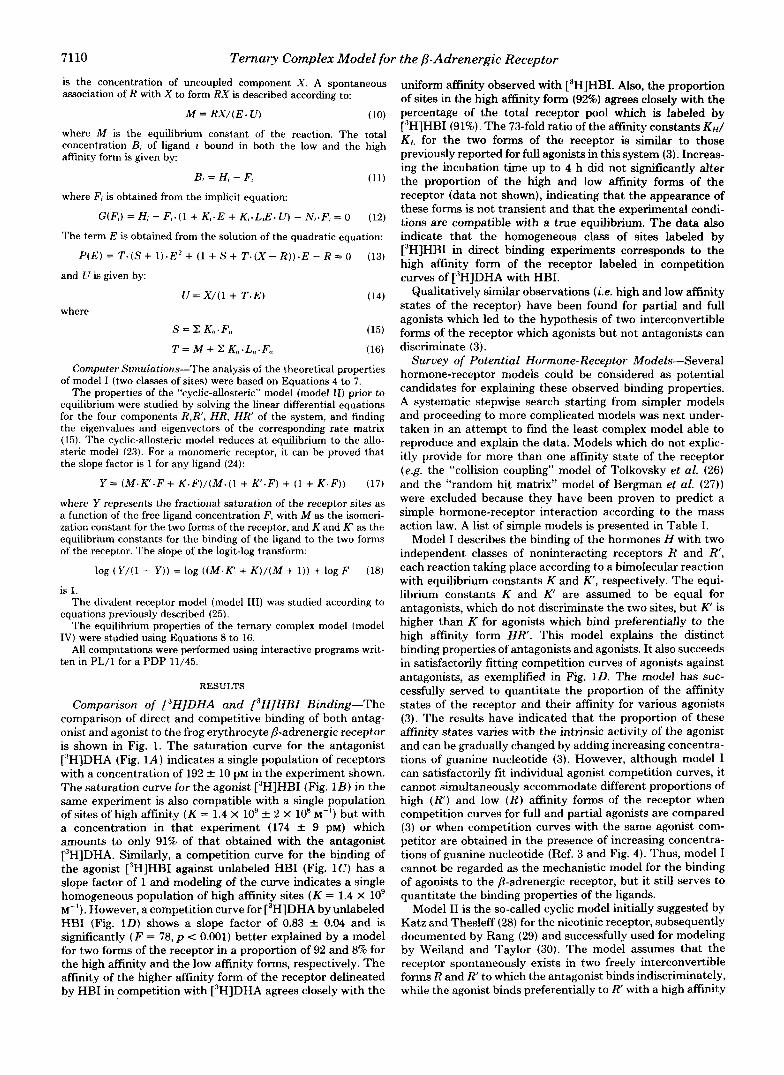
Comparison of r3H]DHA and L3H]HBI Binding-The comparison of direct and competitive binding of both antag- onist and agonist to the frog erythrocyte /?-adrenergic receptor is shown in Fig. 1. The saturation curve for the antagonist ["HIDHA (Fig. 1A) indicates a single population of receptors with a concentration of 192 k 10 PM in the experiment shown. The saturation curve for the agonist ["HIHBI (Fig. 1B) in the same experiment is also compatible with a single population of sites of high affinity ( K = 1.4 X 10' k 2 X 10' M") but with a concentration in that experiment (174 * 9 pM) which amounts to only 91% of that obtained with the antagonist [3H]DHA. Similarly, a competition curve for the binding of the agonist ['HIHBI against unlabeled HBI (Fig. 1C) has a slope factor of 1 and modeling of the curve indicates a single homogeneous population of high affinity sites ( K = 1.4 X 10' M-'). However, a competition curve for [3H]DHA by unlabeled HBI (Fig. 1D) shows a slope factor of 0.83 & 0.04 and is significantly ( F = 78, p < 0.001) better explained by a model for two forms of the receptor in a proportion of 92 and 8% for the high affinity and the low affinity forms, respectively. The affinity of the higher affinity form of the receptor delineated by HBI in competition with ["HIDHA agrees closely with the
uniform affinity observed with [3H]HBI. Also, the proportion of sites in the high affinity form (92%) agrees closely with the percentage of the total receptor pool which is labeled by ["HIHBI (91%). The 73-fold ratio of the affinity constants KH/ KL for the two forms of the receptor is similar to those previously reported for full agonists in this system (3). Increas- ing the incubation time up to 4 h did not significantly alter the proportion of the high and low affinity forms of the receptor (data not shown), indicating that the appearance of these forms is not transient and that the experimental condi- tions are compatible with a true equilibrium. The data also indicate that the homogeneous class of sites labeled by [3H]HBI in direct binding experiments corresponds to the high affinity form of the receptor labeled in Competition curves of C3H]DHA with HBI.
Qualitatively similar observations (i.e. high and low affinity states of the receptor) have been found for partial and full agonists which led to the hypothesis of two interconvertible forms of the receptor which agonists but not antagonists can discriminate (3).
Survey of Potential Hormone-Receptor Models-Several hormone-receptor models could be considered as potential candidates for explaining these observed binding properties. A systematic stepwise search starting from simpler models and proceeding to more complicated models was next under- taken in an attempt to find the least complex model able to reproduce and explain the data. Models which do not explic- itly provide for more than one affinity state of the receptor (e.g. the "collision coupling" model of Tolkovsky et al. (26) and the "random hit matrix" model of Bergman et al. (27)) were excluded because they have been proven to predict a simple hormone-receptor interaction according to the mass action law. A list of simple models is presented in Table I.
Model I describes the binding of the hormones H with two independent classes of noninteracting receptors R and R', each reaction taking place according to a bimolecular reaction with equilibrium constants K and K ' , respectively. The equi- librium constants K and K' are assumed to be equal for antagonists, which do not discriminate the two sites, but fc' is higher than K for agonists which bind preferentially to the high affinity form HR'. This model explains the distinct binding properties of antagonists and agonists. It also succeeds in satisfactorily fitting competition curves of agonists against antagonists, as exemplified in Fig. 1D. The model has suc- cessfully served to quantitate the proportion of the affinity states of the receptor and their affinity for various agonists (3). The results have indicated that the proportion of these affinity states varies with the intrinsic activity of the agonist and can be gradually changed by adding increasing concentra- tions of guanine nucleotide (3). However, although model I can satisfactorily fit individual agonist competition curves, it cannot simultaneously accommodate different proportions of high (R') and low (R) affinity forms of the receptor when competition curves for full and partial agonists are compared (3) or when competition curves with the same agonist com- petitor are obtained in the presence of increasing concentra- tions of guanine nucleotide (Ref. 3 and Fig. 4). Thus, model I cannot be regarded as the mechanistic model for the binding of agonists to the /?-adrenergic receptor, but it still serves to quantitate the binding properties of the ligands.
Model I1 is the so-called cyclic model initially suggested by Katz and Thesleff (28) for the nicotinic receptor, subsequently documented by Rang (29) and successfully used for modeling by Weiland and Taylor (30). The model assumes that the receptor spontaneously exists in two freely interconvertible forms R and R' to which the antagonist binds indiscriminately, while the agonist binds preferentially to R' with a high affinity

A
400
300
200
100
0 IO 20 30 40
I I
IO 20 30 40
['H] DHA ADDED (nM1
500 I
400
300
200
100
0
B ['HI H B I ADDED (nM)
FIG. 1. Comparative binding of the antagonist 13H]DHA and the agonist I3HJHBI to the frog erythrocyte 8-adrenergic re- ceptor. In all four panels, the solid or dashed lines are computer- drawn and represent the best fit obtained with model I based on mass action law. All the data shown in the four panels were obtained from a single representative experiment with duplicate determination of each point. For the saturation curves in A and B, both total and nonspecific binding curves were analyzed simultaneously to provide a common estimate of nonspecific binding. The competition curve in Panel D is the only curve in Fig. 1 which is significantly better fitted with a model for two classes of receptor sites. A, saturation curve with the antagonist (-)-['HIDHA, in the absence (.) and in the presence (0) of (+)-propranolol M. The data are consistent with a model for one class of receptor sites with an affinity constant K = 1.3 X lo9 M" rC_ 2 X lo8 M" and a concentration of R = 192 pM & 1@M, together with nonspecific binding characterized by a ratio N of bound/free ligand 3.9 X lo-" k 2 X (see "Experimental Procedures"). B, saturation curve with the agonist (+)-["HIHBI, in the absence (0) and in the presence (0) of (&)-propranolol M. The best simulta- neous fit was obtained with a model for one class of sites with an affinity constant K = 1.4 X lo9 M" f 2 X 10' M" and a concentration
constant K'. T h e binding steps are assumed to be fast com- pared to the slow isomerization steps between the two forms of the receptor. Computer simulations of saturation or com- petition curves for agonists prior to equilibrium indicate that the curves can be shallow with slope factors less than one and significant proportions of two apparent components when analyzed according to model 11. However, the model predicts such shallow agonist competition curves only when the tran- sition from the low affinity form HR to the high affinity form HR' is extremely slow relative to the binding steps, so that most of the hormone. receptor complex accumulates in the
120
90
60
30
I I I 1 I -10 -9 -8 -7 -6 - 5
LOG [UNLABELLED H B I ] ( M 1
30
0 \ -10 -9 -8 -7 -6
LOG [UNLABELLED H B I ] ( M )
of 174 PM f 9 PM, together with nonspecific binding with a bound/ free ratio N = 1 X -+ 2 X C, competition curve of ["HIHBI with unlabeled HBI. The analysis of the curve with a four-parameter logistic equation indicates a slope factor of 0.96 k 0.06 and an ED.,,, of 1.6 nM f 0.2 nM. The equilibrium constant for the [ 'H]HBI was set to 1.4 X 10' M", as determined in Fig. 1B. The analysis of the competi- tion curve provided an estimate of 1.4 X lo9 M-' k 9 X 10' M" for the affinity constant of the unlabeled agonist. The data shown include nonspecific binding, as indicated by the lower asymptote of the competition curve. 0, competition curve of ["HIDHA with unlabeled HBI. The curve is characterized by a slope factor of 0.83 k 0.04 and an EDM of 1.9 nM & 0.2 nM. The data shown include nonspecific binding indicated by the lower asymptote of the curve. The use of a model for two classes of receptor sites resulted in a significant im- provement of the fit of the data ( F = 78, p < 0.001), as compared to a model for a single class of receptor sites. The parameter estimates for the affinity constants were K,, = 1.6 X IOq M" f 9 X 10' M I and Kl, = 2.2 X 10' M" & 7 X 10' M-' with a proportion of 924 k 1% and 8% k 1% for the high affinty state RH and the low affinity state R , , respectively.
low affinity form, providing only a small (<50%) percentage in the high affinity form HR'. In addition, the shallow agonist competition curves tend to steepen up and shift to the left as the reaction proceeds toward equilibrium, when the cyclic model simplifies to an allosteric model for a monomeric recep- tor. The latter model predicts saturation and competition curves of normal steepness (slope factor = 1) with one appar- ent form of the receptor as revealed by modeling with model I. Thus the cyclic-allosteric model fails to explain the experi- mental data for HBI (Fig. 1D) and other full agonists which promote a high (>80%) proportion of high affinity form of the

7112 Ternary Complex Model for the P-Adrenergic Receptor
TABLE I Properties of simple hormone-receptor models which couldpotentially explain agonist specific
binding characteristics of the P-adrenergic receptor Theoretical binding curves for agonists and antagonists were obtained by computer simulation as
described under “Experimental Procedures.” The theoretical curves were then analyzed by modeling with model I as done for experimental data in Fig. 1.
MODELS FOR HORMONE RECEPTORS WITH TWO AFFINITY STATES
MODELS - I. Two non- mterconvertlble sltes
( K ’ > K for agonLsts)
H+R===HR K
K‘ H + R ’ e HR’
2 Cycl~c (allosteric) model
( K’ > K for agonlsts)
K H+R=-HR
H + R’* HR‘ 11 K’ 1 I
3 Dwalent Receptor
( K ‘ < K for agonlsts) K
H + R # H R
K‘ H+HR *a H,R
4 Ternary complex model
( L 0 for agonlsts)
H + R HR+X K
1 I HRX
BINDING PROPERTIES
AGONISTS ANTAGONISTS * % RH factor - -
< 1 constant 1 none
2.1, at eaullibrum 1 none 1 none
2 2 before equlhbrum < 1 smoll 1 rime (<50 % I
receptor. Moreover, the assumption of a lack of equilibrium during the binding assay is not supported by the experimental data.
In model 111, the ligand can potentially interact with two regions of a divalent receptor. The formation of the binary complex H R is characterized by a high affinity equilibrium constant K , while the binding of a second ligand to form a ternary complex H,R is of lower affinity constant R. The low affinity of the receptor for the second incoming ligand can occur due to “negatively cooperative” interactions among the monomers of the receptor (31), or to ligand-ligand interactions in binding to a multi-subsite receptor (25). Such a model can explain the occurrence of shallow competition curves with slope factors <1 for agonists. However, the proportion of the two apparent forms of the receptor, as estimated by computer modeling would be invariant (50%) for a dimeric receptor. Thus, model I11 fails to explain the gradual increase in the proportion of the high affinity form of the receptor with agonists of increasing intrinsic activity (3).
In model IV (Table I and Fig. 61, the transition from the low affinity state H R to the high affinity state HRX involves the interaction of the agonist-bound receptor with another component X in the membrane. Agonists are characterized by their ability to promote and stabilize the formation of the high affinity state (HRX) and are associated with a high equilib-
< 1 constant 1 none (50 %)
< 1 vanes 1 none wlth
ogonlst
rium constant L for the bimolecular reaction of the initial hormone .receptor complex (low affinity) with the component X .
Two versions of model IV are considered. A partial model including 1) the initial binding step, common to agonist and antagonists, resulting in the binary complex HR and charac- terized by the equilibrium constant K ; and 2) the transition step, exclusive for agonists, leading to the formation of the ternary complex HRX and characterized by the equilibrium constant L.
The full model allows for the occurrence of spontaneous RX complex in the membrane unexposed to any ligand. The formation of the RX complex is determined by an equilibrium constant M . Antagonists bind to either form of the receptor with the same affinity K = K‘ and do not stabilize the ternary complex HRX ( L = M). At equilibrium, agonists are bound with higher affinity (K‘ > K ) to the ternary complex HRX and stabilize it ( L > M). Due to thermodynamic constraints, the affinity ratio K’IK must equal the stability ratio LIM.
Simulations based on both versions of model IV proved to mimic the observed properties of antagonist and agonist bind- ing. In contrast to the previous models considered, the pro- portion of the two apparent forms of the receptor can be varied over a wide range by changing the equilibrium constant L. In addition, the stoichiometry ( X / R ) of the membrane

Ternary Complex Model for the P-Adrenergic Receptor 7113
TABLE I1 Comparison ofparameter estimates obtained by modeling competition curves for agonists of uarying intrinsic actioity with the ternfl,lv
complex model The values for the intrinsic activity were obtained from Ref. 3. For each ,&adrenergic ligand, the parameter estimates shown were obtained
by analyzing the average of three closely similar Competition curves with ["HIDHA. The approximate standard errors shown were obtained from the co-variance matrix provided by the least squares curve-fitting algorithm. The equilibrium constant M was assumed constant for all the agonists and equal to the estimate in Fig. 2 (10"' "I).
Drug Int.rinsic ac-
tivity K L I L / W R X (X/W
M -' M" I )M PM
HBI 1.1 1.1 -C 0.6 X 10' 1.3 f 0.1 X 10" (130) 310 f 5 3 0 0 f 8 0.96 EPI 0.92 4 * 2 x lo5 1.8 f 0.2 X 10" (180) 430 f 11 361 f 12 0.84 IS0 1 2.0 -+ 0.1 x IO" 1.8 f 0.2 X 10" (180) 298 f 8 241 f 8 0.81 COB 0.54 1.2 f 0.2 x lo5 1.1 f 0.07 x 10¹² (110) 408 f 4 319 rC_ 5 0.78 ISOETH 0.45 2.0 -C 1.2 X 10⁴ 9.9 f 1.4 X 10" (99) 430 f 10 331 f 12 0.77 SOT 0.08 3.5 f 2 x IOti 1.5 f 0.4 X 10" (15) 306 f 6 181 f 18 0.59 DCI 0 6.0 f 0.2 x 10" lo1" (1) 313 k 3
components of the system can alter the shape of the compe- tition curves in a predictable manner. The model in no way depends upon any assumption about the identity of the com- ponent X .
Testing of the Ternary Complex Model-In order to test the applicability of the ternary complex model, both versions of model IV were fitted to averaged competition curves (eight experiments) for [3H]DHA binding in competition with HBI (Fig. 2). Both versions closely fit the experimental data. How- ever, modeling the data with the full version of the model resulted in a significantly better fit ( F = 38, p < 0,001). The equilibrium constant K for the binding step (1.1 X lo7 M") was in close agreement with the affinity constant of the ligand for the low affinity form (2.2 X lo7 M") of the receptor obtained by modeling the data with model I (Fig. 1D). The equilibrium constant L (1.5 X 10" M") for the agonist HBI indicated a 150-fold stabilization of the high affinity ternary complex HRX, when compared to the spontaneous equilib- rium constant M (10" M"). The apparent stoichiometry ( X / R ) of the membrane components was not different from 1. The absolute values of the constants M and L are artificially high because their estimates were obtained under the assump- tion that all the membrane components R and X were in solution in the same assay volume as H (32).
An approximate estimate of the ratio of membrane volume to assay volume can be obtained by calculating the fraction of assay volume occupied by the erythrocyte plasma membrane. Since 1 ml of packed frog erythrocytes corresponds to lo9 cells,' and since the receptor density is 1500 sites/cell, an estimate of 1% can be obtained for the fractional membrane volume in a regdar 1 -d assay containing 300 pM receptor sites, assuming that the plasma membrane thickness is 100 A (32). Thus, the corrected values of M and L would range from lo8 M-' to 10'" M-', compared to the current estimates ranging from 10'" M" to 10" M - I . However, the estimate of the ratio L / M and the modeling approach are appropriate since all the reactions of the model involve univalent components (32). The value of the equilibrium constant M (10'' M-') in Fig. 2 suggests that as much as 57% (174 PM) of the receptor R (310 PM) and the component X (310 PM) might spontaneously form a weak complex RX in the absence of any ligand.
The applicability of the ternary complex model was further tested by modeling competition curves of ["HIDHA with other agonists of varying intrinsic activity. Estimates of the equilib- rium constant L for the agonist-induced coupling of R with the component X ranged from 10"' M" for the antagonist DCI to as high as 1.8 x for the full agonists (Table II), providing a 180-fold range of values which highly significantly
' L. J. Pike, personal communication.
250
K = 1.1 x IO' M"
L = 1.5~ 10" M-l
M = 1.04 M" X -. 1.0
., -10 -9 -0 -7 -6 -5 -4
LOG [HBI] (M)
FIG. 2. Computer modeling of competition curves for 13HJ DHA and unlabeled HBI with the partial (- - -) and the full (-) versions of the ternary complex model. The data shown are the average of eight experiments with duplicate determination at each point. The use of the full version of the model results in a significant (F = 38, p < 0.001) improvement of the goodness of the fit. The parameter estimates for the equilibrium constants were M = 1 X 10'') M" f 6 X IO9 M" and L = 1.5 x IO" M" rt 5 x 10" M". The estimates for the equilibrium constant for the binding step was K 5
1.1 X 10' M" 2 4 X 10' "I. The parameters R and X were not significantly different, compatible with an apparent stoichiometry X / R = 1. The parameter estimates of the equilibrium constant M for the precoupling of R and X , both at a concentration of 310 PM k 5 pM suggests that as much as 57% of the receptor might be precoupled as RX.
correlates ( r = 0.9, p c 0.01) with the intrinsic activity of the ligands. In contrast, the equilibrium constants K for the bind- ing step (Table 11) did not correlate ( r = -0.06, p e 0.05) with the intrinsic activity, but rather with the potency of the compounds (13). The estimate of the apparent stoichiometric ratio X / R obtained with partial agonists ( eg . soterenol) was lower, although the range of values (1.7-fold) was small com- pared to the range of values for L (180-fold). Thus, the constant L is the major correlate of the intrinsic activity of the ligand.
Additional testing of the applicability of the ternary com- plex model for the /3-adrenergic receptor can be obtained by modeling agonist competition curves after perturbing the sys- tem. The importance of sulfhydryl groups has been previously demonstrated not only for adenylate cyclase catalytic activity but also for the formation of the agonist-promoted nucleotide- sensitive high affinity state of binding (4, 14, 33). In addition, it has been shown that treatment of the nucleotide regulatory

7114 Ternary Complex Model for the @-Adrenergic Receptor
component with N-ethylmaleimide precluded its ability to reconstitute the uncoupled mutant of the 549 lymphoma cell line (34). Modeling of the HBI competition curves obtained after chemical pretreatment of the membranes withp-hydrox- ymercuribenzoate (p-MB) is shown in Fig. 3. Simultaneous modeling of the curves indicates a selective change in the estimate for parameter X and the stoichiometry ratio X/R, which ranged from 1 in the control curve to 0.7 at 5 to 6 X
M p-hydroxymercuribenzoate and 0 at 8 X lo-' M (Table 111). Thus, the parameter estimates obtained indicate a de- crease in the effective concentration of X in the p-hydroxy- mercuribenzoate-treated membranes. No alteration of K or L was observed. These results indicate that the component X is sensitive to chemical reagents specific for sulfhydryl groups. Similar results were obtained after treatment with N-ethyl- maleimide (data not shown). The exquisite sensitivity of the system to small changes in concentration of p-hydrox.ymer- curibenzoate (5 to 8 X M) is notable.
200
150 Y
z 3 0
n
100
I Q
n
n I 50 m Y
0
1
0 CONTROL
I POMB 5 x 1 6 ~ ~ A POUB 8 I C Y M
I I I I 1 I -10 -9 -8 -7 -6 -5 -
LOG [HBI] ( M I
FIG. 3. Simultaneous analysis of the agonist competition curves after pretreatment of membranes withpMB. The mem- branes were preincubated for 10 min at 25°C in the presence ofp-MB (POMB) at the indicated concentration. They were then diluted 8- fold with ice-cold buffer and centrifuged at 30,000 X g for 10 min at 4°C. The pellets were resuspended in the original volume of buffer then sampled for the binding assay. The common estimate of the parameter M for the three curves was not significantly different from 10"' M" and could be set constant to that value without significantly worsening the goodness of the fit. The estimate for receptor concen- tration was 246 f 4, 242 k 4, and 249 f 9 pM for each curve, respectively. The data shown were obtained from a single experiment with duplicate determination at each point and the corresponding parameter estimates are listed in Table 111 for Experiment I.
TABLE 111 Effect of pretreatment of membranes with p-MB on the parameter estimates obtained from the analysis of HBI competition curves
with the ternary complex model For each experiment, the three competition curves were analyzed
simultaneously. There was no significant worsening of the goodness of the fit when the curves shared a common value for the parameters K, L , and M .
Experiment K IL/MI X / R M - 1
I. p-MB ( M ) 0 5 x lo-$ 8 X
1.9 x 10' f 1 x 10' 96 k 10 1.004 -c 0.039 1.9 x 10' f I x IO" 96 f 10 0.707 f 0.025 1.9 x 10' f 1 x lob 96 f 10 0 f 0.033
11. p-MB (M) 0 1.8 x 10' f 2 x 10' 94 f 12 1.026 f 0.049 6 x 1.8 X 10' k 2 X 10" 94 12 0.704 f 0.030 8 x 1.8 X IO7 f 2 X lo6 94 f 12 0.079 f 0.039
300 I
250
200
I 5 0
100
50
0
LOG [HBI] f M)
FIG. 4. Simultaneous analysis of agonist competition curves in the presence of increasing concentrations of Gpp(NH)p. The nucleotide analog was added to the regular binding assay at the onset of the incubation period. The parameter M, common to all four curves, could be set to a constant value 10"' M" without worsening the goodness of the fit. The estimate of the receptor concentration was 372 f 7, 376 f 7, 381 & 6, and 380 f 5 p ~ . The data show the results of a single experiment with duplicate determination at each point. The corresponding parameter values are listed in Table IY as Experiment I.
TABLE IV Effect of the presence of Gpp(NH)p on the parameter estimates obtained by modeling HBI competition curves with the ternary
complex model Each competition experiment was analyzed separately, the param-
eter M being set to 10" M", as determined in Fig. 2. Experiment I Experiment I1 Experiment I11
Gpp(NH)p K h " ) 1.9 x 10' 2 1 x 1.6 x lo'.* 9 x 2.7 x 10' * 3 x 10" 10" 10"
Experiment I Experiment I1 Experiment I11 Gpp(NH)p K '
I U 1u 1u
M
0 L / M 92 f 13 153 f 20 84 & 13 10" L / M 50 f 9 842 11 48 & 10
L / M 13 rt 4 37 f 7 36 & 44 10-~ L / M 0 0 0 0 10"
X / R 1.07 f 0.06 1.00 2 0.04 0.95 0.03
X / R 0.42 f 0.06 0.60 2 0.03 0.11 * 0.07 X / R 0.60 f 0.03 0.81 -t 0.03 0.49 f 0.04
X / R 0 0 0
Another way in which the equilibrium of the system can be perturbed is with increasing concentrations of guanine nucleo- tide. Fig. 4 shows the results of the simultaneous modeling of HBI competition curves in the presence of increasing concen- trations of Gpp(NH)p. The correspnding parameter estimates are provided in Table IV. Due to its analogy with the affinity constant KL of the low affinity state of the receptor for agonists (3), the intrinsic affinity constant K of model IV was assumed invariant with regard to guanine nucleotide. The parameter M for the spontaneous interaction of the receptor R and the other component X was determined by fitting the full version of the ternary complex to the agonist competition curve in Fig. 2. Since Mcould not be reliably estimated for competition curves in the presence of guanine nucleotide, the parameter M was assumed to be constant for a given receptor system. We have determined that changing the parameter M during the modeling procedure results in concordant changes in parameter L such that the ratio LIM is unchanged. Thus, the ratio L / M is reported in Table IV to quantitate the stability of the ternary complex, avoiding any uncertainty in the deter- mination of the absolute values of M and L. There is a

Ternary Complex Model for the P-Adrenergic Receptor 7115
progressive decrease of the stabilization of the high affinity complex from a ratio L / M of 109 in control membranes, to 61 in the presence of lo" M and to 28 in the presence of M Gpp(NH)p while no estimate of L can be obtained in the presence of an excess ( M) of the nucleotide. In addition to destabilizing the ternary complex, Gpp(NH)p appears to re- duce the apparent stoichiometry from a ratio X / R of 1 in control membranes to 0.38 in the presence of M Gpp(NH)p. A similar effect of the presence of GDP on the estimate for parameter L is observed, although at higher concentration of the nucleotide to M). However, in contrast to the nonhydrolyzable nucleotide, GDP does not appear to reduce consistently the apparent stoichiometry X / R of the system (data not shown). The possible interpretation of the effect of Gpp(NH)p is discussed below.
In order to test the model further, we have checked its applicability to another &adrenergic receptor system. Fig. 5 shows Competition curves of r3H]DHA by isoproterenol for binding to the turkey erythrocyte /&adrenergic receptor in the absence and the presence of Gpp(NH)p ( W 4 M). It has been demonstrated recently that in contrast to previous reports, agonist binding to turkey erythrocyte P-adrenergic receptor does demonstrate a high affinity form which is sensitive to guanine nucleotides (5). Fig. 5 shows an example of a 10-fold
160r 0 1
e Control Gpp(Nli)p IOm4M
120- - n D z 3 p 80- Q
5? B
L% 40-
FIG. 5. Analysis of agonist competition curves in turkey erythrocyte membranes in the absence (0) and in the presence @) of guanine nucleotide. The solid lines were computer-drawn on the basis of the partial version of the ternary complex model. Modeling of the data with the full version of the model did not significantly improved the goodness of fit of the data ( F = 2.1, p = 0.13). The data shown correspond to a single experiment with dupli- cate determination at each point. The parameter estimates for the figure are shown in Table V as Experiment I.
TABLE V Parameter estimates obtained by curve fitting of isoproterenol
competition curves with r3H/DHA in turkey erythrocyte membranes
In both experiments, there was no signscant improvements of the goodness of the fit with the full version of the model, compared to the partial version ( M = 0, in Fig. 6). The standard errors were obtained from the co-variance matrix provided by the least squares curve- fitting algorithm. Both X and R are separately estimated by computer modeling. To test whether X = R, both parameters are constrained to be equal and the resulting fit of the data is compared to the former result with independent X and A.
Experiment I Experiment I1
K (M") 1.2 x IO6 f 1 x IO5 L (M")
x (PM) 240 2 24 204 f 17
1.8 x 10' f 1 x 10:' 9.8 x 10'" f 3.8 x 10'" 8.9 x IO"' f 3.4 x IO"'
R (PM) 314 f 11 428 -c a X I R 0.76 k 0.08" 0.48 k 0.04'
Not significantly different from 1. ' Significantly different from 1.
shift. of such a competition curve in the presence of Gpp WWp, as measured by the EDm of the two curves (1.6 X 10" M and 1.6 x M), Simultaneous fitting of the two competition curves with the ternary complex model indicates that the partial version of the model (M = 0) is sufficient and that no significant improvement of the fit is obtained with the full model which provides a comparatively low estimate of the equilibrium constant M (6 X lo6 "I), However, the stabili- zation by isoproterenol of the ternary complex for turkey erythrocyte p-adrenergic receptor appears to be 19-fold lower ( L = 9.4 x 10'" M-') than observed for the frog erythrocyte receptor ( L = 1.8 X 10" "I), (see Table v).
DISCUSSION
We have documented that a ternary complex model (model IV) is the simplest model considered which can explain agonist binding t.o the p-adrenergic receptor. The goodness of the simultaneous fit of agonist competition curves under varying conditions exemplifies the ability of the model to conform to the experimental data. Models based on freely interconverti- ble states of the receptor according to a unimolecular reaction (e.g the cyclic-allosteric model) fail to reproduce the observed agonist receptor binding data. In contrast, the description of the transition from the low to the high affinity form of the receptor in terms of a bimolecular reaction involving another membrane component provides a simple scheme amenable to quantitative testing by computer modeling. The postulated involvement of an additional membrane component in the agonist promoted high affinity complex is also supported by biochemical evidence for an apparent larger molecular size of the agonist. receptor complex than the antagonist receptor complex (35).
The ternary complex model provides a rational basis for agonist intrinsic activity in terms of the equilibrium constant L which reflects the ability of the agonist to promote the formation and stabilize the high affinity complex. It also establishes a distinction between the intrinsic activity re- flected by the constant L, and the potency of the agonist, reflected by the constant K .
The full version of the model appears to fit more closely the agonist competition curve for the frog erythrocyte p- adrenergic receptor. The additional properties of the full version of the model include the existence of spontaneous preformed RX complex in the membrane and the ability of the agonist to dissociate from the slowly reversible high affin- ity state HRX. The high equilibrium constant value M (10'" M-') observed for the frog erythrocyte system suggests that as much as 50% of the receptor might be precoupled as a loose complex RX whose stability would be more than 100-fold lower than the ternary complex HRX promoted by a full agonist. The ratio K'IK = L / M of the affinity constants of varying agonists (Table 11) for the two forms is in close agreement with the ratio of the affinity constants K H / K [ . obtained by curve fitting with model I (3).
A previous estimate of 50% high affinity state of the receptor RH in the presence of antagonist was obtained by extrapolation from the correlation between percentage of RH and the intrin- sic activity of the ligand (3). This proportion of RH compares with an estimate of 50% spontaneously coupled RX complex in the absence of any ligand in the present study (Fig. 2). This comparison is appropriate because the ternary complex model is based on the assumption that antagonists do not perturb the interaction of R and X.
The assumption of as much as 50% of precoupled receptors RX also correlates with the earlier finding of a 50% proportion of "high affinity" form of the receptor in the presence of antagonist, as estimated by ext.rapolation of the correlation

7116 Ternary Complex Model for the P-Adrenergic Receptor
between the fraction of receptors in the high affinity state and the intrinsic activity (see Fig. 4B or Ref. 3).
The aim of the present study was to define and test the simplest adequate model which could fit and explain the observed properties of agonist interaction with the P-adrener- gic receptor. The ternary complex model proved to fulfii the requirements. However, the model might be simplistic in describing the interaction of the membrane components R and X in terms of a bimolecular reaction obeying the mass action law. The interaction of these two membrane compo- nents might be more appropriately described according to the stochastic models with random molecular events occurring in the membrane environment, as is the case for the random hit- matrix model of Bergman and Hechter (27). However, such refined models might not be quantitatively testable and the ternary complex model can be considered as the current simplest adequate and testable model.
A previous report from this group (36) indicated that the tritiated antagonist DHA showed binding properties compat- ible with negatively cooperative interaction among the recep- tor sites with a slope factor of 0.85. This property was common to both agonists and antagonists and was related to the potency of the ligand rather than to agonist-specific coupling events (e.g. intrinsic activity). This subtle phenomenon is not demonstrated in antagonist competition curves which have slope factor of 1 and obey simple mass action law principles ( 3 ) . In contrast, agonist competition curves strongly deviate from a model for a single class of noninteracting sites with slope factors as low as 0.5 (3). Thus, the small negatively cooperative behavior of the receptor was not included among the binding properties required to be explained by a model for agonist specific binding properties of the /?-adrenergic receptor.
The mathematical formulation of the ternary complex model is identical with the mobile receptor model of De Haen (37 ) , also described by Boyenaems et a[. (38) and Jacobs et a[. (39). The model does not specify whether the membrane components R and X are freely mobile and randomly collide upon interaction of the agonist, or if the components R and X are organized in “domains” (40) within which they interact either loosely or tightly. The high affinity constants M and L estimated by modeling of agonist competition curves (Fig. 2) suggest close encounters, perhaps within domains of the mem- brane.
The identity of the membrane component X must be in- ferred from biochemical data. A previous model was based on the postulate that X was a component of the enzyme adenylate cyclase (4). However, recent data indicate that the enzyme can be “uncoupled” from the /?-adrenergic receptor without altering the ability of agonists to form a high affinity complex with the receptor (14,33,41), indicating that the catalytic unit of the enzyme itself is not involved at least in its active form in the formation of the high affinity state of the receptor. The demonstration by Limbird et al. (42) that the nucleotide binding site is physically part of the high affinity complex indicates that the component X is probably the so-called “G site.”
The coupling between the receptor and the final effector E can be visualized according to Fig. 6. The agonist-promoted formation of the high affinity ternary complex HRX is a prerequisite for effector activation, as recently demonstrated ( 5 ) . The reversal of the high affinity complex HRX to the low affinity form HR is promoted by guanine nucleotide which interacts with the component X (nucleotide binding site) and destabilize the HRX complex. We speculate that the nucleo- tide-bound component X , freed from the ternary complex HRX, can interact with the effector adenylate cyclase ( E ) , as
(precoupled)
FIG. 6. Schematic diagram of the full version of the ternary complex model. The model involves the interaction of the hormone (H), the receptor ( R ) , and the additional component ( X ) in the membrane. The scheme also shows the coupling of the breakdown of the ternary complex (HRX) with the activation of the effector ( E ) .
recently demonstrated by Pfeuffer (43). The interaction of the nucleotide-bound component X with the effector E presum- ably results in the activation of the latter.
The spontaneously formed loose complex RX might also be capable of binding nucleotide and of interacting with the effector, resulting in an agonist-independent basal response. Interestingly, the frog erythrocyte system which has a high “basal” activity for adenylate cyclase also apparently sponta- neously forms the loose complex RX, while in the turkey erythrocyte system, for which no significant proportion of complex RX is predicted (Fig. 6 ) , the basal level of activity of the enzyme is low.
The earlier observation of a persistently activated form of the effector adenylate cyclase (44) in the presence of nonhy- drolyzable forms of guanine nucleotides (e.g. Gpp(NH)p, Gpp(CHZ)p, GTP-yS) may be explained by the observation of a stable complex between the enzyme and the nucleotide binding site occupied by GTP-$3 (43). Thus, the estimation of an apparent decrease in the stoichiometric ratio XIR in the presence of Gpp(NH)p (Fig. 4) but not in the presence of GDP (data not shown) suggests that the nonhydrolyzable nucleotide-fied component X interacting with the effector E might not be available for subsequent formation of new ter- nary complex HRX.
In the future, the ternary complex model might be used to study the effect on the estimates of the parameters (K , L , R, X , M ) of various alterations of the system such as uncoupling, desensitization, temperature changes, etc.. . It can serve as a basis for studying complex systems involving more than one kind of receptor or effector. Moreover, the model offers a general scheme for agonist receptor interactions not only in adenylate cyclase-coupled receptor systems, where the agonist either enhances enzyme activity (e.g. the /?-adrenergic recep- tor) or inhibits the activity of the enzyme (e.g. the platelet a- adrenergic receptor), but also for systems where the effector might be entirely different. The striking similarity of binding properties of many of these systems to the &adrenergic re- ceptor suggests that the ternary complex model may be a widely useful tool for the analysis of hormone-receptor-effec- tor systems.
Acknowledgments-Dr. Jacqueline Reynolds kindly reviewed the manuscript and provided helpful suggestions. Dr. Frank Starmer and Bruce Wright generously offered help and guidance in the use of their computer facilities. We are grateful to Ms. Donna Addison for her expert assistance in typing the manuscript.
REFERENCES
1. Maguire, M. E., Van Arsdale, P. M., and Gilman, A. G. (1976) Mol. Pharmacol. 12, 335-339

Ternary Complex Model for the P-Adrenergic Receptor 7117
2. Lefkowitz, R. J., Mullikin, D., and Caron, M. G. (1976) J . Biol.
3. Kent, R. S., DeLean, A., and Lefkowitz, R. J. (1980) Mol. Phar-
4. Williams, L. T., and Lefiowitz, R. J. (1977) J. Biol. Chem. 252,
5. Stadel, J. M., DeLean, A,, and Lefkowitz, R. J. (1980) J. Biol.
6. Lucas, M., and Bockaert, J. (1977) Mol. Pharmacol. 13,314-329 7. Lirnbird, L. E., Gill, M., Stadel, J. M., Hickey, A. R., and Lefkow-
8. Hegstrand, L. R., Minneman, K. P., and Molinoff, P. B. (1979) J .
9. Tsai, B. S., and Lefkowitz, R. J. (1979) Mol. Pharmacol. 16,61-
10. Berrie, C. P., Birdsall, N. J. M., Burgen, A. S. V., and Hulme, E.
11. Zahniser, N. R., and Molinoff, P. B. (1978) Nature 275,453-455 12. Rodbell, M., Krans, H. M. J., Pohl, S. L., and Birnbaurner, L.
13. Mukherjee, C., Caron, M. G., Mullikln, D., and Lefkowitz, R. J.
14. Stadel, J. M., and Lefkowitz, R. J. (1980) Mol. Pharrnacol. 16,
15. Magar, M. E. (1972) Data Analysis in Biochemistry and Bio-
16. Rodbard, D., Lenox, R. H., Wray, H. L., and Ramseth, D. (1976)
17. Draper, N. R., and Smith, H. (1966) Applied Regression Analysis,
18. Rodbard, D. (1974) Clin. Chem. 20, 1255-1270 19. Feldman, H. A. (1972) Anal. Biochem. 48, 317-338 20. De Lean, A., Munson, P. J., and Rodbard, D. (1978) Am. J.
21. Hancock, A. A,, De Lean, A. L., and Lefkowitz, R. J. (1979) Mol.
22. Hoffman, B. B., De Lean, A., Wood, C. J., Schocken, D. D., and
Chem. 251,4686-4692
macol. 17, 14-23
7207-7213
Chem. 255, 1436-1441
itz, R. J. (1980) J. Biol. Chem. 255, 1854-1861
Pharmacol. Exp. Ther. 210,215-221
68
C. (1979) Biochem. Biophys. Res. Commun. 87, 1000-1005
(1971) J. Biol. Chem. 246, 1872-1876
(1976) Mol. Pharmacol. 12, 16-31
709-718
physics, Academic Press, New York
Clin.. Chem. 22, 350-358
Wiley, New York
Physiol. 235(2), E97-E102
Pharmacol. 16, 1-9
Lefkowitz, R. J. (1979) Life Sci. 24, 1739-1746 23. Karlin, A. (1967) J . Theor. Biol. 16,306-320 24. Furchgott, R. F. (1978) Fed. Proc. 37, 115-120 25. De Lean, A,, Munson, P. J., and Rodbard, D. (1979) Mol. Phar-
26. Tolkovsky, A. M., and Levitzki, A. (1978) Biochemistry 17,3795-
27. Bergman, R. N., and Hechter, 0. (1978) J. Biol. Chem. 253,3238-
28. Katz, B., and Thesleff, S. (1957) J. Physiol. (Lond.) 138, 63-80 29. Rang, H. P., and Ritter, J. M. (1970) Mol. Pharmacol. 6, 357-382 30. Weiland, G., and Taylor, P. (1979) Mol. Pharmacol. 15, 197-212 31. Fletcher, J. E., Spector, A. A,, and Ashbrook, J. D. (1970) BLO-
32. Reynolds, J. A. (1979) Biochemistry 18, 264-269 33. Howlett, A. C., Van Arsdale, P. M., and Gilrnan, A. V. (1978) Mol.
34. Ross, E. M., and Gilrnan, A. G. (1977) J . Biol. Chem. 252, 6966-
35. Lirnbird, L. E., and Lefkowitz, R. J. ( 1 9 , ~ ) Proc. Natl. Acad. Sri.
36. Limbird, L. E., and Lefkowitz, R. J. (1976) J. Biol. Chem. 251,
37. DeHaen, C. (1976) J. Theor. Biol. 58, 383-400 38. Boeynaerns, J. M., and Dumont, J. E. (1975) J . Cyclic Nucleotide
39. Jacobs, S., and Cuatrecasas, P. (1976) Biochim. Biophys. Acta
40. Biltonen, R. L. (1977) Fed. Proc. 36,2112-2114 41. Limbird, L. E., Hickey, A. R., and Lefkowitz, R. J. (1979) J. Biol.
42. Limbird, L. E., Gill, D. M., and Lefkowitz, R. J. (1980) Proc. Nufl.
43. Pfeuffer, T. (1979) FEBS Lett. 101,85-89 44. Londos, C., Salomon, Y., Lin, M. C., Harwood, J. P., Schramm,
M., Wolff, J., and Rodbell, M. (1974) Proc. Natl. Acad. Sci. U. S. A. 71.3087-3090
macol. 15,60-70
3810
3250
chemistry 9,4580-4587
Pharmucol. 14, 531-539
6969
U. S. A. 75, 228-232
5007-5014
Res. 1, 123-142
433,482-495
Chem. 254,2677-2683
Acad. Sci. U. S. A . 77,775-779